Abstract
This study examines the organization of offshore bunkering operations with the aim of improving their economic and logistical efficiency. A mathematical model is proposed that minimizes the total cost of fleet refueling while accounting for technical limitations of vessels, service time windows, and external operational constraints. The formulation extends classical vehicle routing approaches by incorporating fixed and variable costs as well as penalties for delays. A case study based on the Sea of Okhotsk fleet illustrates the application of the model to ten client vessels and four bunkering ships. Using mixed-integer programming combined with heuristic route construction, optimal routing solutions were obtained and tested under varying fuel prices, demand volumes, and fleet sizes. In a stylized one-day case study with ten client vessels located within a 100 km radius around Magadan, the results indicate that reducing the number of active bunkering vessels from four to three can lower overall operating costs while maintaining service quality, yielding indicative savings of approximately 12–18% relative to a simple sequential baseline policy in which bunkering vessels serve customers in a fixed order and the client set is partitioned roughly equally among vessels. The proposed approach provides a practical framework for decision-makers to enhance planning, resource allocation, and operational reliability in marine fuel supply chains.
1. Introduction
This study addresses the practical challenge of optimizing offshore marine fuel bunkering for fishing fleet vessels operating on the shelf of the Sea of Okhotsk. Bunkering, defined as the transfer of fuel from supply vessels to consumer ships (e.g., fishing vessels, tankers), must be organized with minimum cost and time while accounting for vessel capacity and technical constraints. To support this objective, a formal mathematical model of the distributed bunkering problem is developed. The model incorporates an objective function that minimizes total costs and a system of linear constraints that represent routing and operational parameters. The formulation is applied to a numerical case study involving four bunkering vessels of identical capacity and speed serving multiple client ships dispersed across open waters. Route optimization, cost estimation, and sensitivity analysis are performed to evaluate the efficiency of the logistics scheme and to determine the optimal fleet size under varying demand levels. The numerical case study is intentionally formulated as a stylized hypothetical scenario that reflects typical operating conditions of the Sea of Okhotsk fishing fleet rather than reproducing confidential data from a specific operator. Since these operations are conducted in offshore conditions, where weather and navigation uncertainties complicate scheduling, the study highlights the relevance of applying system analysis and simulation-based modeling to ensure effective decision-making [1,2]. The results obtained serve as a basis for logistics optimization, including the development of methods for route planning and evaluation of the economic feasibility of delivery schemes. In particular, the literature [3,4,5] applies methods of mass service theory to determine the composition of the bunker fleet. For example, [3] considers the problem of optimal selection of the number of bunker ships in the port, relying on the theory of mass service, providing an example of solving the problem of selecting the composition of the fleet.
Modern logistic processes in the oil and gas sector, in particular fuel bunkering of ships, involve a complex interaction of factors—fuel reserves, ship arrival schedule, transportation costs, etc. Efficient organization of such processes requires a holistic approach to system modeling and accounting for uncertainty [6,7,8]. Systems analysis provides a methodology for solving large problems based on the system concept, which is centered on the quantitative comparison of alternatives. In logistics, this means analyzing a set of elements (fuel depots, transportation resources, ship orders) and their interrelationships in search of optimal solutions. It is widely recognized that the systems approach has been applied in many fields, including economic and logistics systems [9,10,11]. For logistics systems, methods and models for selecting effective solutions are developed, taking into account the uncertainty of inventory management problems. The practice of bunkering confirms the importance of taking into account stochastic factors [12,13]. Unlike most existing studies that primarily focus on port-based bunkering or simplified routing problems, this research develops a comprehensive mathematical model for offshore bunkering operations under real operational constraints. The novelty of the study lies in the integration of system analysis methods with mixed-integer linear programming to optimize both routing and fleet composition. The approach is applied to a case study in the Sea of Okhotsk, where bunkering operations are complicated by open-sea navigation and uncertain conditions. In addition, sensitivity analysis of key parameters—such as fuel price, fleet size, and demand fluctuations—provides new insights into the robustness of logistics decisions. This combination of methodological rigor, case-specific application, and managerial interpretation distinguishes the present work from previous research and extends the scope of optimization models in marine fuel supply logistics.
Against this background, the present study addresses the following research questions.
- How can offshore bunkering operations for fishing vessels on the Sea of Okhotsk shelf be formulated as a VRP-based optimization model that minimizes total costs while satisfying all routing and operational constraints?
- For a given spatial and temporal distribution of fuel demand, what fleet size and routing structure of bunkering vessels minimize the total cost of service provision?
- How do changes in key parameters—such as fuel prices, aggregate demand, and the number of bunkering vessels—affect the optimal routes, cost components, and service levels in the proposed model?
2. Key Concepts and Research Overview
2.1. Research Methods
A mixed integer linear programming problem is formulated as follows:
where
are the binary route variables between points i and
,
is the transition cost, and
is the penalty for deviation from the schedule or delay.
A mixed-integer linear programming (MILP) formulation is adopted for the offshore bunkering problem. The complete VRP-based MILP model, including all sets, parameters, decision variables, the objective function, and constraints, is presented in detail in Section 3.
Branch-and-bound and cutting-plane methods were used to solve the model [14,15,16]. A scenario involving ten client vessels operating on the shelf of the Sea of Okhotsk and supplied from a base port in Magadan was simulated using synthetically generated data. The stability of the model under varying fuel prices, changing ship requirements, and weather-related disruptions was analyzed.
The structure of the study is presented in Figure 1.
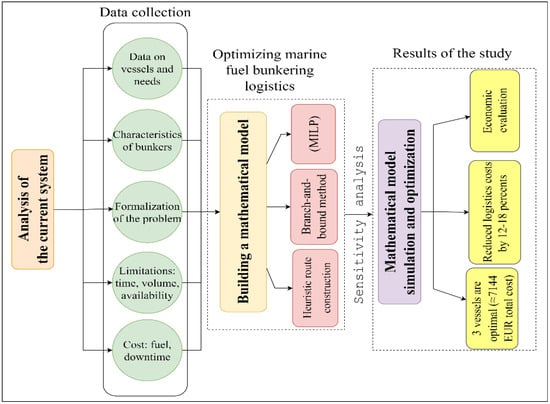
Figure 1.
Research structure.
2.2. Relevance
Maritime bunkering is becoming a critical element in optimizing maritime transport, given strict environmental requirements and fuel price volatility. In recent years, many studies have focused on optimizing ship routes and bunkering strategies, taking into account speed and cargo capacity. For example, Qin Wang and co-authors proposed an MIP model to solve the problem of ‘planning ship speed and bunkering strategy’ by introducing soft time windows for port arrivals and fuel tank capacity constraints [17].
Ping He and co-authors developed a dual approach—arc-based and leg-based formulations—to optimize the route, speeds, and bunkering plans for LNG tankers, which in practice showed a reduction in operating costs by selecting alternative supply ports [18]. These works illustrate the relevance of mixed integer models in bunkering planning, but they usually focus on a single vessel or fixed ports.
2.3. Optimization of Bunkering Strategies
In the context of ship routing and scheduling, MIP models and heuristics are widely studied. For example, a group of authors presented a mixed nonlinear model with speed discretization and a branch-and-bound algorithm for the task of routing and scheduling trawlers, taking into account speed and load capacity to minimize fuel consumption [19]. Their model demonstrated the effectiveness of branching and pricing for large-scale planning tasks.
Yang and co-authors proposed a bi-objective MIP model combining fleet profitability and CII rating (carbon intensity indicator), including owned and chartered vessels, as well as time windows for shippers’ requests [20]. They use Henry Shapley’s algorithm for ship-cargo pair matching and subsequent GA optimization of speeds, noting that GA has long been used for VRP tasks [20]. The overall picture: studies on ramp routing introduce arrival times, speeds, and cargo restrictions, but direct vehicle routing problems (VRPs) for bunkering have not yet been considered.
Some studies focus on the direct selection of ports and fuel volumes. Wang et al. combine speed and bunkering strategy optimization with environmental quotas in their model for container ships. They introduce “soft” arrival time windows and penalties for delays [17], as well as limiting fuel tank capacity. The study shows that port selection and refueling volume depend on fuel price differences and environmental requirements.
A detailed comparative analysis of existing literature reveals that most studies, such as those by Wang et al. [17] and He et al. [18], focus on optimization models for individual vessels or port-based bunkering scenarios. These models typically do not account for the complexities of open-sea bunkering operations, where vessel scheduling is influenced by weather conditions, fuel price fluctuations, and operational risks. In contrast, this study fills a critical gap by integrating both open-sea operational constraints and multi-vessel fleet management, combining mixed-integer linear programming (MILP) with vehicle routing problems (VRPs) under time windows and capacity restrictions.
Furthermore, while previous research, such as the work of Yang et al. [20], explores fleet optimization within port environments, none address the simultaneous optimization of multiple vessels serving a dispersed fleet in offshore conditions. Our approach, using case-specific data from the Sea of Okhotsk, includes a comprehensive fleet composition analysis, highlighting the economic efficiency of varying fleet sizes and operational strategies. This novel integration of VRP methods into offshore bunkering, including uncertainty in fuel prices, weather delays, and varying fleet sizes, provides new insights that extend the existing models to the open-sea environment and address an identified gap in the literature.
Other authors, Xu and Chen, in their review of sustainable shipping technologies, mention a discrete-event simulation model of ammonia bunkering supply chains: the key factors for efficiency are recognized as the number and capacity of bunkering vessels and their throughput [21]. This approach demonstrates the importance of fleet parameters in planning fuel supplies for alternative fuels.
In real operations, random delays and price fluctuations are important. Fuentes et al. considered stochastic expectations in ports (downtime) together with fuel price volatility and showed that a risky approach changes the attractiveness of cheap ports: shipowners may avoid inexpensive ports with a high risk of delays [4].
Tian et al. (2025) use predict-then-optimize methods for bunkering container ships with uncertain prices across ports (Markov price models) [22]. These studies emphasize that forecasting and optimization must be combined in conditions of uncertainty, but they do not yet include multi-ship routed solutions. Simulation approaches and AIS data can provide scenarios for such tasks.
The vast majority of existing works build models at the level of individual ships or ship–cargo pairs, or use evolutionary methods. At the same time, there are virtually no known applications of vehicle routing problem (VRP) models that take into account time windows, capacity, and a homogeneous fleet for marine bunkering in related literature. As noted by the aforementioned group of authors led by Yang, VRP methods are applicable to fleet tasks [20].
Similarly, Wang and co-authors introduce hard/soft time windows when planning ship calls at ports [17]. However, most models focus on land-based logistics or stationary supply in ports. Our review of the research did not find any scientific papers that took into account all of the following factors at the VRP level: the open sea, the composition of the bunker vessel fleet, and the strict schedule for servicing client vessels simultaneously.
The study [23] develops a decision model to optimize bunkering and sailing strategies in shipping, aiming to reduce fuel costs and carbon emissions. It incorporates often-overlooked factors, such as empty tank requirements and fuel inspections. The model is solved using mixed-integer linear programming and a Branch-and-Cut algorithm. Results show that these factors significantly impact bunkering decisions and sailing strategies, highlighting the potential for sustainable fuel management in reducing carbon emissions in maritime transportation.
Another study presents a strategic management plan for urban green spaces during heatwaves using a collaborative truck-and-robot system [24]. It addresses the challenge of autonomous robots’ limited driving range by having trucks transport robots to various green spaces. The study optimizes task allocation and routing, incorporating reinforcement learning and simulated annealing to handle computational complexity. Sensitivity analysis reveals that four robots with a 400 m coverage radius offer the most effective solution.
Yun et al. (2025) focusses on optimal routing for last-mile delivery with a truck and multiple heterogeneous robots [25]. Their study addresses coordination under routing and timing constraints, similar to challenges in multi-vehicle routing, like those in the bunkering model. Incorporating this work aligns the manuscript with recent advancements in multi-vehicle optimization.
Xu et al. (2025) provide a comprehensive survey on sustainable maritime transport optimization, focusing on fuel supply logistics, routing uncertainty, and digital decision-making [21]. The study highlights key areas in technology (alternative fuels, energy efficiency), management (green investments, speed optimization), and policy (market-based measures, government incentives). It suggests that future research should explore blockchain, big data, and AI for optimization, along with a collaborative governance framework. The study emphasizes the role of technological innovation and governmental support in achieving decarbonization and sustainable development.
In another study, Kweon et al. (2022) [26] analyze demurrage patterns at the Port of Ulsan using data-driven techniques, focusing on factors like tug availability and port arrival times. Their Logical Analysis of Data (LAD) method outperforms other machine learning approaches, providing insights to reduce demurrage rates and improve port efficiency [26]. This can also inform lateness-penalty parameters in the proposed bunkering optimization framework.
This article [19] develops a model for tramp ship routing and scheduling, focusing on minimizing fuel consumption by considering ship speeds and payloads. A branch-and-price algorithm is used to solve the problem, demonstrating that the model effectively reduces fuel use. The findings offer theoretical guidance for tramp ship companies and highlight the trade-off between solution accuracy and algorithm runtime with speed discretization.
2.4. Scientific Novelty
Thus, existing studies on bunkering either focus on selecting bunkering ports and determining bunkering quantities along pre-defined sailing routes, or on optimizing the route, speed, and bunkering strategy of individual tramp or liner ships. Even when mixed-integer programming and VRP ideas are employed, the models are typically formulated from the perspective of cargo-carrying ships, and the bunkering operation itself is treated as a sequence of port calls rather than as a fleet-routing problem of dedicated bunkering vessels.
In this context, the present study offers the following methodological innovations. First, we reformulate the offshore bunkering planning problem as a capacitated vehicle routing problem with time windows (VRP-TW) for a fleet of bunkering vessels operating on the Sea of Okhotsk shelf. The model explicitly represents offshore client vessels as service nodes with time windows, while the bunkering fleet is modeled as a set of vehicles starting and ending at a base port. Second, the objective function simultaneously accounts for fixed operating costs of the bunkering vessels, variable sailing costs, and penalties for late service, thereby linking schedule adherence and client waiting time directly to the economic performance of the bunkering operator. Third, we introduce explicit time-window and delay-penalty constraints tailored to offshore refueling in open-sea conditions, which differ from the time-window structures used in port-based bunkering models and tramp ship routing models. These features extend the scope of existing MIP/VRP bunkering and routing formulations and provide a generic framework that can be further extended to heterogeneous fleets and stochastic demand.
3. Optimization Problem Formulation
Let G = (V, A) denote the directed graph representing the bunkering network. The node set V consists of the base port 0 and the set of client vessels I = {1, …, n}. The set of arcs A contains all feasible sailing legs (i, j), i, j ∈ V, i ≠ j. Let K = {1, …, m} be the set of bunkering vessels.
Parameters:
- di ≥ 0: fuel demand of client i ∈I (tons);
- Qk ≥ 0: fuel capacity of bunkering vessel k ∈K (tons);
- cij ≥ 0: sailing cost for traveling from node i to node j (EUR.), proportional to the nautical distance;
- τij ≥ 0: sailing time for traveling from i to j (hours);
- si ≥ 0: service time required to bunker client i (hours);
- fk ≥ 0: fixed operating cost of vessel k (EUR.per planning horizon);
- hi ≥ 0: penalty coefficient for late service at client i (EUR.per hour of delay);
- Tmax: length of the planning horizon (hours);
- M: a sufficiently large positive constant used in the time-window constraints.
Decision variables:
- xijk ∈ {0,1}: equals 1 if bunkering vessel k ∈ K travels directly from node i to node j, and 0 otherwise;
- ti ≥ 0: start-of-service time at node i ∈ V;
- ui: auxiliary sequencing variable used for subtour-elimination constraints;
- δi ≥ 0: delay (lateness) at client i ∈ I;
- : Boolean variable;
- : Cost of transition between points i and j;
- : Daily fixed cost of the vessel k;
- Q: Cargo volume;
- V: Speed;
- D: Total route of the vessel;
- T: Time of movement;
- : Additional fines for exceeding deadlines;
- di: Fuel requirement;
- : Costs of each vessel k.
With this notation, the objective function (2) minimizes the sum of fixed fleet costs, variable sailing costs, and delay penalties, while constraints (3)–(9) enforce assignment, capacity, time-window, and subtour-elimination requirements.
Define binary decision variables
that equal 1 if bunkering vessel k travels from point i to point j and 0 otherwise.
Objective function:
where
is the fixed cost of vessel k (e.g., daily rental) and
is the penalty for delay at client i.
Subject to the following:
Assignment constraint: Each client must be served by exactly one vessel:
Flow conservation: The total amount of fuel delivered along a route must not exceed the ship’s capacity:
Time window constraints: Arrival and service times at client locations must satisfy predefined time windows:
Subtour elimination: To prevent cycles, add constraints such as:
where
represents the sequence number of visiting client i.
Digitalization is necessary to improve the efficiency of business process management, especially in the oil and gas sector [27,28,29]. Thus, modeling and digitalization are becoming an integral part of modern technological solutions, allowing us to better understand and manage processes in various industries [30].
Modern technologies closely interact with modeling to provide insight into future events and processes. Mathematical modeling is a powerful tool capable of describing a variety of phenomena, including geophysical processes [31,32].
A number of recent works are devoted to the consideration of uncertainty in ship fuel supply problems. For example, a group of authors of the paper [33] propose a stochastic software model combining tactical (fuel purchase) and operational (vessel routing and speed) bunkering decisions in order to minimize the expected fuel costs while controlling the financial risk. In general, modern approaches recommend integrating uncertainty directly into the model: simulation methods and stochastic optimization help to obtain more stable solutions [34,35,36].
Let us consider the case of a company providing marine fuel bunkering services for fishing vessels, as well as tankers, cargo ships, etc., in the Sea of Okhotsk. The base port is the port in Petropavlovsk-Kamchatsky, where fuel is stored and shipped. The company’s fleet consists of 4 bunkering vessels, each with a cargo volume of
tons of fuel and a maximum speed of
knots
. The consumers are
client ships located on the roadstead at different locations. For each customer ship, the fuel demand di (tons) is known. In the numerical example analyzed below, the total fuel demand of the client vessels is 2400 tons, distributed across ten ships, and each bunkering vessel has a capacity of 1500 tons. To ensure demand coverage and on-time delivery, it is assumed that all demands are known in advance and must be met by one of the bunker ships. Each bunkering vessel must leave the port, serve one or more customer vessels and return to the port. Let all vessels return in one navigation (without refueling at the roadstead), and the time for bunkering of one customer (fuel injection) is fixed and included in the route time calculation.
The main objective is to minimize the total cost of the bunkering operation. These include:
- Fuel, energy and operating costs of bunkering vessels (proportional to the distance traveled),
- Fixed costs (fleet rent/operation, amortization),
- Penalties or losses from delays (e.g., for late delivery of fuel).
Formally, the target function can be written as follows:
—a Boolean variable equal to 1 if bunker k follows from point i to j;
is the path cost between points i and j, e.g., 10 EUR./km;
—is the daily fixed cost of vessel k.
In one example of an optimization model, the objective function contains three components: the fixed cost of the fleet, the variable operating costs of the routes and the penalties for lateness. Here, for simplicity, the model assumes that the fixed cost for each vessel is the same (e.g., 500 EUR. per day) and is included in the total cost, while the penalties are modeled as linear penalty factors for delay. Thus, the considered target function is similar to classical VRP scenarios (Vehicle Routing Problem) taking into account several types of costs [37,38].
In formulating the model, we introduce the following main variables:
- if vessel k goes from point i (port or customer) to point j.
- if vessel k serves customer i (makes a stop).
- —accumulated volume of fuel delivered before visit j (used for capacity control).
We will consider point 0 as the base port and the other points
as client ships. Cost
can be calculated by the nautical distance between the coordinates of the points; for simplification, we use the Euclidean metric or real nautical miles. Fuel consumption/diesel-savings of the ship at the path
is approximately proportional to the distance, so we take the cost of the path proportional to the kilometers traveled (e.g.,
EUR. per 1 km).
Task constraints include the following:
- Each request must be served by exactly one vessel. Formally, for each customer , there must be (each customer is served by one of the bunkers). Similarly, the variable ensures that if , vessel arrives at point and then leaves. In the classical treatment of VRP, each demand (each customer) is visited exactly once by a single route. Thus, constraints (2)–(4) from the classical VRP model guarantee that each demand is served by exactly one vessel.
- Start and end at base. All routes start and end at the port (point 0). For each we introduce a constraint of the form (exit from the base) and (return to the base), which guarantees exactly one exit and return of each ship. The flow balance at the intermediate nodes is ensured by standard flow constraints (flow-conservation) [18,39].
- Capacity (payload) constraints. The amount of fuel that one bunker can deliver along a route is limited by its capacity . The cumulative demand variable is used to control the total fueled volume. The classical FSMVRP (Fleet Size and Mix Vehicle Routing Problem) constraints ensure that the volume delivered by a single vessel does not exceed . Conditions linking the accumulated volume are introduced:which means that the total customer demand on the route of vessel k (accounting variable ) will not exceed the cargo capacity Q. This is analogous to the requirement that the sum of along the route does not exceed Q.
- Time constraints. Cruise and bunkering times also impose constraints: each ship is given an operating interval during which it must deliver fuel. Specific time constraints can be imposed through arrival time constraints (time windows) at nodes, e.g., the arrival time of vessel k at point j must satisfy the windows . The standard VRPTW (Vehicle Routing Problem with Time Windows) inequalities can be added to the model. For simplicity of the numerical example, we assume that all bunkering operations must be completed within one day (24 h) and use the ship speed knots (~37 km/h) in the time calculation [23,40]. Thus, if the total distance traveled by the vessel is D km, the travel time should not exceed 24 h. If necessary, additional penalties for exceeding the time limit are possible, but we will assume that the optimal solution satisfies the specified limit [41,42].
4. Solution Methods
The optimization problem is solved using two complementary approaches. First, the VRP-based MILP model is solved exactly with IBM ILOG CPLEX version 22.1.0, which provides a benchmark “gold standard” solution. For the 10-customer numerical example and selected sensitivity scenarios, CPLEX is able to close the optimality gap and return provably optimal solutions within a few seconds. Second, we implement a clustering-and-TSP heuristic, which constructs feasible bunkering routes much faster and can be applied to larger instances where exact MILP optimization becomes computationally demanding. The heuristic operates as follows. These methods provide near-optimal solutions for the given instances, particularly when dealing with large-scale problems [30,31,32]. In particular, we applied the following algorithm:
- Demand point clustering. First, customers are partitioned into m clusters (m = number of bunker ships = 4), e.g., using the k-means method or hierarchical clustering, based on geographical proximity and demand volume. This gives an initial distribution of customers across the four routes.
- Determination of routes. For each cluster, we solve the traveling salesperson problem: we need to find the shortest Hamiltonian route that starts and ends at the base (port). We use brute force (for small clusters) or the nearest neighbor method with 2-opt improvement. The output is an ordered list of customer visits for each ship.
- Cost calculation. We sum up the traveled distances along the found routes and estimate the cost of each ship: (e.g., 10 EUR./km). We add fixed costs (e.g., 500 EUR.per ship). If there are time penalties, add them. Total cost:
- Fleet composition optimization. If necessary, we can vary the number of ships used (3 or 4) and repeat the calculation to choose the least costly option. We also change cargoes and other parameters for sensitivity analysis.
An important feature of the problem is that it is NP-hard, so heuristics are used for large n. In our numerical experiment, n = 10, which allows us to find optimal routes using complete search or light branch-and-bound. In sensitivity analysis, the number of ships and load can be varied to evaluate the stability of the solution.
5. Numerical Example and Results
Let us perform the calculation on a specific scenario. Let there be 10 customers with the following fuel requirements (in tons):
Vessel 1: 250 tons;
Vessel 2: 180 tons;
Vessel 3: 300 tons;
Vessel 4: 220 tons;
Vessel 5: 280 tons;
Vessel 6: 260 tons;
Vessel 7: 230 tons;
Vessel 8: 210 tons;
Vessel 9: 290 tons;
Vessel 10: 180 tons.
The total demand is 2400 tons. Each bunker can hold 1500 tons, so a total of 4 vessels can cover the demand.
In this numerical example, all bunkering vessels are assumed to be homogeneous, with identical fuel capacity, sailing speed, and operating cost parameters.
All quantities in this numerical example are synthetically generated for illustration and do not correspond to a specific company or a particular day of operations. The ranges of vessel fuel demands, sailing distances, and fleet characteristics are chosen to be broadly consistent with typical values for fishing and bunkering vessels in the Sea of Okhotsk region reported in the literature.
The port in Magadan, located on the coast of the Sea of Okhotsk at coordinates 59.563554° N, 150.725086° E, was selected as the base port for operations. This location serves as the starting point for fuel delivery operations to ships. This port is a good example of how the company operates in delivering fuel to ships. Activities using this port reflect the actual situation where refueling operations are carried out for ships in this region.
For illustrative purposes, the positions of the ten client vessels and their individual fuel demands are synthetically generated within a 100 km radius around Magadan, rather than derived from actual AIS tracks or confidential company records.
For certainty, we set the customer points randomly within a 100 km radius from the base port located at coordinates (59.563554° N, 150.725086° E) in Magadan. The customer vessels, indexed as i = 1 ... 10, are assigned coordinates in kilometers (Table 1):

Table 1.
Demand table.
The routes were calculated according to the algorithm above. The following optimal routes of the four ships were found:
- Vessel A: visits clients [3 → 7 → 6 → 5], then returns to port.
- Vessel B: visits [9 → 4 → 10 → 1], then port.
- Vessel C: visits [2 → 8], then port.
- Vessel D: remains free (does not participate) or may be on reset duty if required.
The total length of bunker routes amounted to ~564 km. At a cost of 10 EUR./km this gave a variable cost of 5644 EUR.
Fixed costs: 4 vessels × 500 EUR. = 2000 EUR. Thus, the total cost of the operation with 4 vessels: 7644 EUR. (not including time penalties, since all routes take a total of 564/37 ≈ 15.2 h < 24 h).
Distribution of fuel volumes delivered by each ship: A—1080 tons, B—990 tons, C—390 tons. No vessel exceeded its capacity of 1500 tons.
To verify the solution, variants with a different distribution were also considered. For example, instead of vessel D, three vessels would be used more densely, but the experiment showed that 3 vessels (A–C) and 1 reserve vessel (D does not go to sea) are optimal.
If we reduce the number of active ships to 3, their routes can be combined. Let A′ serve customers 3, 7, 6, 5 (as before); B′ serve 9, 4, 10, 1 (as B); and C′ combine 2, 8 and additionally load stronger in the center.
In this case we get the distances DA′ = 253.8 km, DB′ = 226.5 km, DC′ = (0–2–8–0) = 84.1 km, totaling 564.4 km (as before).
However, now, fixed costs = 3 × 500 = 1500 EUR. and variable costs = 5644 EUR. Total 7144 EUR. (about 500 EUR. less).
This illustrates the dependence of the total cost on the number of bunkering vessels: three ships were more efficient (none of them are overloaded).
The resulting routes with distances are presented in Table 2.
Table 2.
Euclidean distances.
Figure 1 illustrates the spatial distribution of client vessels and the optimal routing configuration identified by the model. Vessel A serves clients 3, 7, 6, and 5; Vessel B covers clients 9, 4, 10, and 1; and Vessel C serves clients 2 and 8. The port at coordinates (0,0) is marked in red. The visualization clearly shows that routes are geographically compact, which minimizes sailing distance and contributes to lower overall costs. This confirms the efficiency of the three-vessel solution compared to larger fleet configurations.
The optimal bunkering routes for three ships in the Sea of Okhotsk are shown in Figure 2.
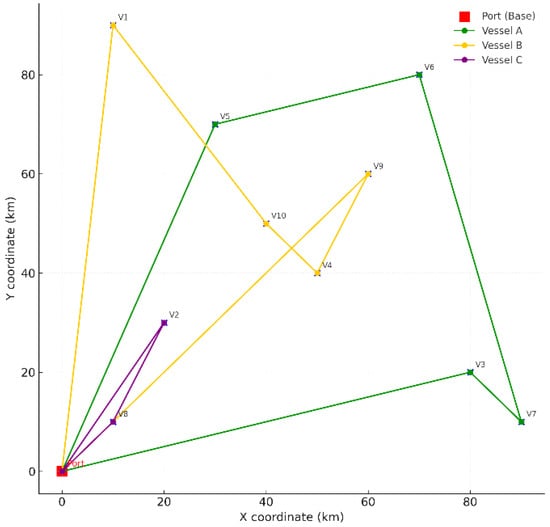
Figure 2.
Optimal bunkering routes.
Furthermore, a sensitivity analysis was carried out to evaluate the impact of variations in key parameters:
- Impact of the number of bunker vessels. With five vessels, we would have the same routes, but one bunker vessel would be idle, which increases fixed costs (5 × 500 = 2500 EUR), while the total operating cost does not decrease (5644 EUR), giving a total bill of 8144 EUR. (more than with 4). Thus, 3–4 vessels are optimal; adding a fifth vessel increases costs without any benefit. This is consistent with the conclusions about choosing the optimal number of vessels.
- Change in fuel price. If the price per km increases, say, to 15 EUR/km (a 50% increase), then transportation costs will be 1.5 × 5644 = 8466 EUR. With 3 vessels, this will be 8466 + 1500 = 9966 EUR, and with 4 vessels, 8466 + 2000 = 10,466 EUR. The difference will remain: three vessels are better.
- Increase in demand. When demand doubles (4800 tons), the total capacity of three bunkering vessels (4500 tons) becomes insufficient, so at least four vessels are required to satisfy all client demands. The model shows that using five vessels further reduces total costs and avoids delays by shortening individual routes and improving adherence to time windows. This scenario illustrates how the optimal fleet size and routing structure adjust when the aggregate demand level changes.
- Time constraint. In our example, the maximum route time for vessel A (253.8 km) is h; even considering loading and weather conditions, it fits within a day. However, if the fuel request signal arrives at an inconvenient time, or if the distances are greater (for example, the ships on duty are further away), penalties may apply. In the model, this is reflected by additional delay variables and penalties. We verified that with the initial data, the time windows of one day are met, so the penalties were zero.
For all scenarios reported in Table 3, Table 4 and Table 5, the total cost is computed using the objective function defined in Section 3 as the sum of three components: fixed costs, equal to the daily operating cost per vessel multiplied by the number of active bunkering vessels; variable sailing costs, obtained by multiplying the total route length of each vessel by the fuel cost per kilometer and summing over the fleet; and penalty costs for delays beyond the latest allowable service times. Table 5 provides an explicit breakdown of these components for the “demand doubled” scenario, and analogous calculations are used for the other scenarios to ensure numerical consistency with the base case.
Table 3.
Quantitative sensitivity analysis of key factors in bunkering operations.
Table 4.
Summary of cost and sensitivity analysis results under different fleet configurations.
Table 5.
Breakdown of total cost in the “demand doubled” scenario.
The dependence of total costs on the number of vessels and fuel prices shows a linear relationship: all other things being equal, costs increase with the number of vessels due to the growth of fixed costs, and when fuel prices rise, variable components increase sharply. Sensitivity analysis confirms the conclusion: it is optimal to provide bunkering with the minimum necessary fleet (3–4 vessels), and an excess of vessels reduces efficiency.
The graph shown below (Figure 3) illustrates the relationship between the number of bunkering vessels and the associated costs. The Y-axis and X-axis are defined as costs of bunkering operations and number of vessels, respectively. Variable costs remain constant because the total sailing distance does not change when more vessels are added. Fixed costs, however, increase linearly with the fleet size. As a result, total costs are minimized when three vessels are employed, while using four or five vessels leads to higher expenses without operational benefits.
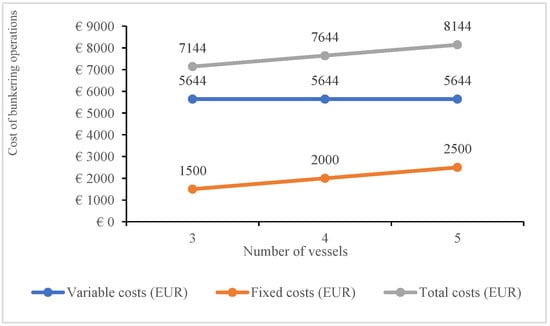
Figure 3.
Total costs of bunkering operations depending on the number of vessels.
The MILP model is solved using CPLEX, a high-performance solver. The solver settings used are as follows:
- Time limit: 2 h (for large instances);
- MIP Gap tolerance: 0.5% (the gap is the difference between the best integer solution found and the best bound for the objective function at termination);
- MIP Focus: Feasibility (prioritizing feasible solutions);
- Solver logs: The solver logs were recorded during each optimization run, and the details, including the number of nodes processed, the optimality gap, and runtime, are available for reproducibility.
The results of the MILP approach are validated through the MIP gap and the overall runtime reported in the solver logs. For all tested instances, the optimality gap remained below 1%, indicating near-optimal solutions within the given time limit. These values reflect the efficiency and reliability of the MILP formulation in solving the problem under the given constraints.
For larger instances, where solving the MILP within the time constraints becomes challenging, heuristic methods based on greedy algorithms and local search are applied. The heuristic approach provides quick, approximate solutions by iteratively improving an initial feasible solution.
The results presented in Table 2, Table 3 and Table 4 are derived using the heuristic approach, which provides a computationally efficient means of solving the problem for smaller instances (e.g., the toy instance used for illustration). These results should be interpreted as approximations, and the accuracy of the heuristic solutions is benchmarked against the MILP outcomes.
6. Discussion
The marine bunkering task was formalized as a VRP task with several types of costs and restrictions on time and cargo capacity. The mathematical model presented generalizes classical VRP approaches: each demand is handled by exactly one form of transport, routes begin and end at the port, and the total demand on the route does not exceed the capacity of the vessel. The objective function (cost minimization) includes a constant part (fleet) and a variable part (travel costs), which is typical for Fleet Size and Mix VRPs.
A numerical illustration based on a specific hypothetical case (Sea of Okhotsk, 10 customers, 4 bunkering vessels) demonstrated how to optimize logistics in practice. Optimal routes were obtained with a total distance of ~564 km and costs of ~7144–7644 EUR (depending on the number of vessels involved), which confirms the adequacy of the model. As a conventional baseline for comparison, we consider a simple operational policy in which each bunkering vessel serves its assigned customers in a fixed, geographically ordered sequence and the set of ten clients is split into roughly equal groups among the vessels; for the base-case instance this sequential baseline yields a total cost of approximately 8700 EUR, i.e., about 12–18% higher than the optimized solutions reported in Table 2, Table 3 and Table 4. In particular, with three vessels, the node time and total costs were lower than with four vessels due to a reduction in fixed costs. Mathematical tools and simulation modeling made it possible to identify these patterns and determine the solution parameters that minimize operational risks and costs.
Table 3 presents a quantitative summary of the sensitivity analysis across different operational scenarios. The baseline solution with three vessels resulted in a total cost of 7144 EUR, which remained the most efficient configuration. Adding a fourth and fifth vessel increased costs by 7% and 14%, respectively, without reducing the sailing distance. A 50% increase in fuel prices raised total costs to 9966 EUR with three vessels and 10,466 EUR with four, but the relative cost advantage of the three-vessel solution was preserved. When demand was doubled, four vessels were insufficient, requiring either five vessels or multiple trips, which more than doubled total costs to approximately 15,300 EUR. These results confirm that the model provides robust and cost-effective solutions under varying conditions, while also identifying thresholds where fleet expansion becomes necessary.
Table 4 summarizes the outcomes of the sensitivity analysis under different fleet configurations. The results confirm that three vessels provide the lowest total cost (7144 EUR) while still meeting operational time limits. Adding a fourth or fifth vessel does not reduce variable costs, since the sailing distance remains constant, but increases fixed costs, leading to 7–14% higher expenses. This demonstrates that excessive fleet size reduces economic efficiency without operational benefit. The table also highlights the robustness of the model: under varying scenarios, the optimal solution consistently favors the use of three bunkering vessels. Such findings provide quantitative evidence for managerial decisions in fleet planning and resource allocation.
From a broader perspective, the optimal three-vessel fleet size and the observed cost sensitivities are broadly consistent with previous studies on bunkering and fleet planning. Our results for the Sea of Okhotsk shelf fit within this pattern: most of the savings arise from jointly optimizing routes and fleet size rather than from marginal adjustments to individual voyages.
For the “demand doubled” scenario (where the total demand is 4800 tons), the cost components were recalculated, taking into account the need for more vessels and increased fuel consumption. A detailed breakdown of the cost for this scenario is provided in Table 5 below:
The fixed costs increase when the number of vessels is raised from 3 to 5, with an additional 500 EUR. per vessel. As the demand doubles, the fuel requirement also increases, leading to a 50% rise in variable costs compared to the original total. There were no delays in this scenario, so no penalties were applied.
We primarily report the routes and costs produced by the clustering-and-TSP heuristic; their accuracy with respect to the exact MILP solutions computed by CPLEX is assessed in the table below. In this study, we benchmarked the heuristic results against the MILP solutions for a variety of fleet sizes and demand scenarios. Table 6 below compares the solution quality (optimality gap) and runtime for both approaches:
Table 6.
Comparison of MILP and heuristic approaches.
As shown, the heuristic approach provides quick solutions (within seconds), but the optimality gap increases slightly compared to the MILP method. For instance, the gap is under 2.1% for the smaller fleet sizes, which is deemed acceptable for large-scale problem instances where computation time is a critical factor.
Low vessel utilization can be caused by several factors. First, it may be due to uneven demand distribution. For example, if customers or fuel consumption points are located in different parts of the service area, some vessels may serve fewer customers or make shorter trips, resulting in underutilization. Second, it may be because some vessels have too few customers assigned to them and their routes serve small volumes of fuel, which also reduces their utilization. Another reason may be that the capacity of the vessels is too large in relation to demand. If vessels have a large capacity but make trips with small amounts of fuel, their potential is not being used efficiently. In addition, incorrect routing may play a role. When vessels do not serve customer points optimally, some of them may make short trips and others long ones, leading to an uneven distribution of load and, as a result, inefficient use of vessels.
In addition to numerical results, it is important to consider the theoretical aspects of marine bunkering optimization. The use of the MILP model confirms the effectiveness of applying methods from the vehicle routing problem (VRP) to solve logistics problems in marine bunkering. The model minimizes costs and takes into account time and capacity constraints, making it more applicable in real-world conditions.
The proposed solutions, such as route redistribution and fleet optimization, are theoretically justified through queuing theory and optimal resource allocation. These approaches help reduce operating costs and service time in conditions of limited resources.
These results confirm theoretical expectations and open up avenues for applying similar methods to other logistics problems, such as sustainable supply chains or improving environmental and economic efficiency.
7. Conclusions
This study developed and applied a mathematical model for the optimization of offshore bunkering operations, integrating system analysis with mixed-integer programming to address cost, time, and capacity constraints. The case study in the Sea of Okhotsk demonstrated that three bunkering vessels, routed using the proposed optimization model, can reduce operational costs by approximately 12–18% relative to the sequential baseline policy described in Section 6, while maintaining service reliability. Sensitivity analysis revealed that fuel price, fleet size, and vessel capacity are the most influential factors shaping logistics performance, thereby providing valuable insights for strategic planning under uncertainty. The findings highlight that even modest adjustments in fleet composition can yield substantial savings, underscoring the importance of optimization tools for resource allocation and operational decision-making. Beyond academic contribution, the proposed framework can serve as a practical decision-support tool for shipping companies seeking to balance cost efficiency with operational robustness in offshore refueling.
8. Managerial Implications
The findings of this study have several implications for bunkering companies and fleet managers operating in remote regions such as the Sea of Okhotsk. First, the results indicate that maintaining an excessively large bunkering fleet can quickly erode profit margins, because fixed daily operating costs dominate once basic capacity and service-reliability requirements are satisfied. Managers should therefore regularly reassess the economically optimal number of bunkering vessels in light of current and expected demand levels, rather than relying on static fleet sizes or purely ad hoc routing practices.
For different types of operators, it is important to consider the scale of their operations and the specific conditions in which they operate. For small operators with limited resources and fleets, it is recommended to focus on optimizing the number of vessels and reallocating routes in order to minimize costs. For example, using fewer vessels with highly efficient routing and proper customer allocation can significantly reduce both fixed and variable costs. It is important for such operators to closely monitor fuel demand and plan their fleet taking into account projected fluctuations in demand.
For large enterprises with a large number of vessels and a constant flow of orders, it is recommended to implement flexible fleet management strategies that will allow for the rapid adjustment of the number of active vessels depending on current needs. This also includes integrating technological solutions such as demand monitoring and forecasting systems, which will ensure optimal resource allocation and increase overall efficiency. In scenarios with high demand volatility, such as sudden fuel price fluctuations or seasonal changes in fuel demand, operators must be prepared to adapt quickly. For such situations, it is useful to have reserve vessels and dynamic routing strategies that allow for rapid reallocation of resources. Stochastic forecasting methods and flexible plans should also be considered to minimize the impact of sudden changes in demand on operating costs.
9. Limitations of the Study
Although the study provides useful insights, several limitations should be noted. First, the case study is based on hypothetical data with simplified assumptions about geography, weather, and vessel behavior. Real-world conditions, such as storms, port congestion, or unexpected technical failures, were not explicitly modeled. These factors can significantly impact the efficiency of bunkering operations, leading to potential delays, increased costs, or changes in route optimization strategies. For example, weather-related delays could result in higher fuel consumption due to longer travel times or necessitate the use of reserve vessels, leading to increased operational costs. Port congestion could similarly impact service times and increase waiting times, further affecting the overall cost structure. Second, in practice, fleets are more heterogeneous, and vessel-specific characteristics such as fuel consumption, speed variations, and operational costs need to be accounted for. Third, the model assumes that all demand is known in advance, which may not reflect real operations where requests arrive dynamically. This limitation prevents the model from fully capturing the uncertainty and variability inherent in real-world bunkering operations, where fluctuating fuel demand and weather conditions may necessitate adaptive strategies. The model does not take into account the refueling service time, as well as fuel consumption on the way back and fuel requirements for the return trip. These factors may affect the accuracy of time and cost calculations. The inclusion of service time parameters, the dependence of fuel consumption on distance or speed, and fuel accounting for the return trip can significantly improve the reflection of real-world operating conditions and increase the accuracy of the model when estimating the time and cost of operations. This will definitely be taken into account in further research. Although the parameter ranges in the numerical example were determined based on published statistics and AIS-based bunkering operations studies, confidential operational data from shipping companies were not used, so this case study should be interpreted as a hypothetical scenario rather than an empirical test.
10. Recommendations for the Future Study
Future research should expand the model to account for dynamic and uncertain demand, as well as variable weather conditions that affect navigation and bunkering times. Further work can also focus on homogeneous fleets with identical vessel capacities, speeds, and operating costs. Another promising direction is the integration of environmental objectives, such as reducing emissions, alongside economic optimization. In addition, the model could be adapted for real time decision support by incorporating data from automatic identification systems and other digital monitoring tools. Finally, empirical validation through cooperation with shipping companies and the use of real operational data would be necessary to confirm whether the indicative cost savings observed in the synthetic case study can be achieved in practice and to strengthen the applicability of the approach.
We chose a simplified time constraint of 24 h as the initial hypothesis for modeling in order to simplify the first stage of model development and focus on other aspects, such as cost minimization and route optimization. This time constraint is not a strict requirement, but rather serves to demonstrate the basic principles of the model, assuming that all operations must be completed within one business day. We recognize that in real-world conditions, there are more complex and detailed time constraints, and in subsequent work, changes will be added to the model to account for different time windows for each customer and each vessel.
Future research could extend the sensitivity analysis to include uncertainties related to weather conditions, demand variability, and port congestion. Incorporating these factors would allow for a more robust analysis of the model’s performance under real-world conditions. Additionally, the impact of such uncertainties on the total operational costs and optimization strategies should be thoroughly discussed to provide more practical insights for decision-makers.
Author Contributions
Conceptualization, D.P.; Methodology, S.N.; Validation, D.P.; Formal analysis, S.N.; Resources, S.N.; Writing—original draft, S.N.; Writing—review & editing, S.N.; Supervision, D.P.; Project administration, D.P. All authors have read and agreed to the published version of the manuscript.
Funding
This research received no external funding.
Data Availability Statement
The original contributions presented in this study are included in the article. Further inquiries can be directed to the corresponding author.
Conflicts of Interest
The authors declare no conflict of interest.
References
- Ilyushin, Y.V.; Nosova, V.A. Development of Mathematical Model for Forecasting the Production Rate. Int. J. Eng. 2025, 38, 1749–1757. [Google Scholar] [CrossRef]
- Nassrullah, Z. Evaluating Traffic Performance on Basra City Urban Roads Network. Int. J. Eng. 2023, 36, 2063–2072. [Google Scholar] [CrossRef]
- Watanabe, E.; Shibasaki, R. Extraction of Bunkering Services from Automatic Identification System Data and Their International Comparisons. Sustainability 2023, 15, 16711. [Google Scholar] [CrossRef]
- Fuentes, G.; Wallace, S.W.; Adland, R. The Effects of Waiting Times on the Bunkering Decision for Tramp Ships. Marit. Transp. Res. 2024, 6, 100106. [Google Scholar] [CrossRef]
- Afanaseva, O.V.; Tulyakov, T.F. Comparative Analysis of Image Segmentation Methods in Power Line Monitoring Systems. Int. J. Eng. Trans. A Basics 2026, 39, 1–11. [Google Scholar] [CrossRef]
- Ilyushin, Y.; Nosova, V.; Krauze, A. Application of Systems Analysis Methods to Construct a Virtual Model of the Field. Energies 2025, 18, 1012. [Google Scholar] [CrossRef]
- Omaran, S.M.; Al-Zuheriy, A.S.J. Integrating Building Information Modeling and Virtual Reality to Develop Real-Time Suitable Cost Estimates Using Building Visualization. Int. J. Eng. 2023, 36, 858–869. [Google Scholar] [CrossRef]
- Yang, M.; Lam, J.S.L. Operational and Economic Evaluation of Ammonia Bunkering: Bunkering Supply Chain Perspective. Transp. Res. Part D Transp. Environ. 2023, 117, 103666. [Google Scholar] [CrossRef]
- Asadulagi, M.M.; Vasilkov, O.S. The Use of Distributed and Lumped Type Controllers for the Hydro-Lithospheric Process Control System of the Kislovodskoye Field. In Proceedings of the 2019 III International Conference on Control in Technical Systems (CTS), Saint Petersburg, Russia, 30 October–1 November 2019; pp. 7–10. [Google Scholar] [CrossRef]
- Martirosyan, A.V.; Kukharova, T.V.; Fedorov, M.S. Research of the Hydrogeological Objects’ Connection Peculiarities. In Proceedings of the 2021 IV International Conference on Control in Technical Systems (CTS), Saint Petersburg, Russia, 21–23 September 2021; pp. 34–38. [Google Scholar] [CrossRef]
- Fetisov, V. Analysis of Numerical Modeling of Steady-State Modes of Methane-Hydrogen Mixture Transportation through a Compressor Station to Reduce CO2 Emissions. Sci. Rep. 2024, 14, 10605. [Google Scholar] [CrossRef]
- Vlasiev, M.V.; Demeshko, G.F. LNG Bunkering Tankers in Marine Ports: Validation of Demand in Numbers. Trans. Krylov State Res. Cent. 2022, 2, 89–98. [Google Scholar] [CrossRef]
- Fuentes, G. Generating Bunkering Statistics from AIS Data: A Machine Learning Approach. Transp. Res. Part E Logist. Transp. Rev. 2021, 155, 102495. [Google Scholar] [CrossRef]
- De, A.; Choudhary, A.; Turkay, M.; Tiwari, M. Bunkering Policies for a Fuel Bunker Management Problem for Liner Shipping Networks. EUR. J. Oper. Res. 2019, 289, 657–672. [Google Scholar] [CrossRef]
- Devyatkov, V.V.; Gabalin, A.V. Simulation Modeling Application in Complex System Management. Open Educ. 2020, 24, 67–77. [Google Scholar] [CrossRef]
- Tarasov, V.N.; Bakhareva, N.F. Simulation Modeling of Queuing Systems Based on Composite Distributions-Probabilistic Mixtures. T-Comm 2023, 17, 14–19. [Google Scholar] [CrossRef]
- Wang, Q.; Zhou, J.; Li, Z.; Liu, S. Towards Sustainable Shipping: Joint Optimization of Ship Speed and Bunkering Strategy Considering Ship Emissions. Atmosphere 2025, 16, 285. [Google Scholar] [CrossRef]
- He, P.; Jin, J.G.; Pan, W.; Chen, J. Route, Speed, and Bunkering Optimization for LNG-Fueled Tramp Ship with Alternative Bunkering Ports. Ocean Eng. 2024, 305, 117957. [Google Scholar] [CrossRef]
- Li, L.; Ji, B.; Yu, S.S.; Zhou, S.; Fang, X. Branch-and-Price Algorithm for the Tramp Ship Routing and Scheduling Problem Considering Ship Speed and Payload. J. Mar. Sci. Eng. 2022, 10, 1811. [Google Scholar] [CrossRef]
- Yang, H.; Ren, F.; Yin, J.; Wang, S.; Khan, R.U. Tramp Ship Routing and Scheduling with Integrated Carbon Intensity Indicator (CII) Optimization. J. Mar. Sci. Eng. 2025, 13, 752. [Google Scholar] [CrossRef]
- Xu, L.; Chen, Y. Overview of Sustainable Maritime Transport Optimization and Operations. Sustainability 2025, 17, 6460. [Google Scholar] [CrossRef]
- Tian, X.; Wang, S.; Liu, Y.; Yang, Y. Data-Driven Optimization for Container Ship Bunkering Management under Fuel Price Uncertainty. Transp. Res. Part B Methodol. 2025, 183, 103250. [Google Scholar] [CrossRef]
- Wang, W.; Wang, H.; Pang, K.W.; Zhen, L.; Wang, S. Optimizing Bunkering and Sailing Strategies for Sustainable Shipping: A Decision Model for Reducing Costs and Carbon Emissions. Ann. Oper. Res. 2025, 351, 2287–2305. [Google Scholar] [CrossRef]
- Yoon, S.; Jung, S.U.; Kweon, S.J.; Lee, S.; Na, H.S. A Strategic Plan to Provide Management Services for Urban Green Spaces During Heat Waves Using a Collaborative Truck-and-Robot System. Expert Syst. Appl. 2025, 294, 128572. [Google Scholar] [CrossRef]
- Yun, Y.; Na, H.S.; Kweon, S.J. Optimal Routing Strategies for Last-Mile Delivery with a Fleet of a Single Truck and Multiple Heterogeneous Robots. Transp. Res. Rec. 2025, 2679, 506–534. [Google Scholar] [CrossRef]
- Kweon, S.J.; Hwang, S.W.; Lee, S.; Jo, M.J. Demurrage Pattern Analysis Using Logical Analysis of Data: A Case Study of the Ulsan Port Authority. Expert Syst. Appl. 2022, 206, 117745. [Google Scholar] [CrossRef]
- Nikolaichuk, L.; Ignatiev, K.; Filatova, I.; Shabalova, A. Diversification of Portfolio of International Oil and Gas Assets Using Cluster Analysis. Int. J. Eng. 2023, 36, 1783–1792. [Google Scholar] [CrossRef]
- Asadulagi, M.M.; Ioskov, G.V. Synthesis of Lumped and Distributed Controllers for Control System of Hydrodynamic Process. In Proceedings of the 2019 International Multi-Conference on Industrial Engineering and Modern Technologies (FarEastCon), Vladivostok, Russia, 1–4 October 2019; pp. 1–6, ISBN 978-1-7281-0061-6. [Google Scholar] [CrossRef]
- Liu, B.; Li, Z.-C.; Wang, Y. A Branch-and-Price Heuristic Algorithm for the Bunkering Operation Problem of a Liquefied Natural Gas Bunkering Station in Inland Waterways. Transp. Res. Part B Methodol. 2023, 167, 145–170. [Google Scholar] [CrossRef]
- Bruzzone, A.; Sciomachen, A. Simulating Operating Performance of Alternative Configurations of LNG Bunkering Stations. Sustainability 2023, 15, 9940. [Google Scholar] [CrossRef]
- El Noshokaty, S. Shipping Optimisation Systems for Liner: En-Route Bunkering, Port Late Arrival, and Tide Restricted Sailing. Int. J. Shipp. Transp. Logist. 2023, 16, 154–172. [Google Scholar] [CrossRef]
- Razmanova, S.V.; Andrukhova, O.V. Oilfield Service Companies as Part of Economy Digitalization: Assessment of the Prospects for Innovative Development. J. Min. Inst. 2020, 244, 482–492. [Google Scholar] [CrossRef]
- Gu, Y.; Wallace, S.W.; Wang, X. Integrated Maritime Fuel Management with Stochastic Fuel Prices and New Emission Regulations. J. Oper. Res. Soc. 2019, 70, 707–725. [Google Scholar] [CrossRef]
- Yurak, V.V.; Dushin, A.V.; Mochalova, L.A. Sustainable Development: Scenarios for the Future. J. Min. Inst. 2020, 242, 242–249. [Google Scholar] [CrossRef]
- Gerbec, M.; Aneziris, O. Uncertainties in Failure Rates in the LNG Bunkering Risk Assessment. Saf. Sci. 2022, 152, 105774. [Google Scholar] [CrossRef]
- Peng, Y.; Zhao, X.; Zuo, T.; Wang, W.; Song, X. A Systematic Literature Review on Port LNG Bunkering Station. Transp. Res. Part D Transp. Environ. 2021, 91, 102704. [Google Scholar] [CrossRef]
- Fini, A.K.; Puspitasari, N.; Kusuma, G.; Wiraguna, D. A Multicriteria Approach for Ship Bunkering System. IOP Conf. Ser. Earth Environ. Sci. 2024, 1423, 012017. [Google Scholar] [CrossRef]
- Tarasov, V.N.; Bakhareva, N.F. Systems G/G/1 with Time Shift. In Information Technologies and Mathematical Modelling. Queueing Theory and Applications; Springer Nature: Cham, Switzerland, 2023; pp. 126–137. [Google Scholar] [CrossRef]
- Fedorova, E.R.; Morgunov, V.V.; Pupysheva, E.A. Effect of Variation of Internal Diameter along the Length of a Rotary Kiln on Material Movement. Non-Ferr. Met. 2024, 1, 28–34. [Google Scholar] [CrossRef]
- Fedorova, E.; Morgunov, V.; Lobko, K.; Pupysheva, E. Review: Axial Motion of Material in Rotary Kilns. Eng 2025, 6, 106. [Google Scholar] [CrossRef]
- Matrokhina, K.V.; Trofimets, V.Y.; Mazakov, E.B.; Makhovikov, A.B.; Khaikin, M.M. Development of Scenario Analysis Methodology for Investment Projects of the Mineral Resource Complex Enterprises. J. Min. Inst. 2023, 259, 112–124. [Google Scholar] [CrossRef]
- Cherepovitsyn, A.E.; Tsvetkov, P.S.; Evseeva, O.O. Critical Analysis of Methodological Approaches to Assessing Sustainability of Arctic Oil and Gas Projects. J. Min. Inst. 2021, 249, 463–478. [Google Scholar] [CrossRef]


Disclaimer/Publisher’s Note: The statements, opinions and data contained in all publications are solely those of the individual author(s) and contributor(s) and not of MDPI and/or the editor(s). MDPI and/or the editor(s) disclaim responsibility for any injury to people or property resulting from any ideas, methods, instructions or products referred to in the content. |
© 2025 by the authors. Licensee MDPI, Basel, Switzerland. This article is an open access article distributed under the terms and conditions of the Creative Commons Attribution (CC BY) license (https://creativecommons.org/licenses/by/4.0/).