Abstract
Planetary gears consisting of simple external gear wheels and an internal ring gear are widely used in industry in various fields. This type of drive is most commonly found in robots, and it is also frequently used in the automotive industry, such as in wheel hub drives, in addition to general engineering. This study investigates the design of simple planetary gears manufactured with involute gearing. In simple internal gear planetary gears, the orbiting motion of the planetary gear is transferred to the output shaft by a radial balancing clutch and converted into rotary motion through the planetary gear’s guiding holes and the output element’s pins. The guiding holes reduce the planetary gear teeth strength, and the rim thickness “h” has a fundamental influence on the resulting tooth root stress. The main objective of this research is to design external gears with relief for simple planetary gears with a rim thickness “h” that does not decrease the load-carrying capacity. The dimensioning of involute gearing is well known, but the tooth root weakening effect of the clearance holes in such planetary gears is not known. Therefore, this paper focuses on analyzing how the size and position of the guiding holes influence tooth root stress, using finite element method (FEM) calculations performed in SolidWorks 2023. This study aimed to determine the rim thickness “h” required for the design of such a gear in order not to weaken the load-carrying capacity of the gear teeth. As a result of the research, the design of the guiding holes and the wheel relief holes can be performed with an accurate knowledge of their influence on tooth stress. The research results also make it possible to design this type of planetary gear using simple analytical calculation algorithms. Our goal was to define a simple design limit that could be used specifically in the preliminary design phase. This allows designers to determine the positions and dimensions of the guiding holes in the preliminary design phase without affecting the tooth stress.
1. Introduction
Type B planetary gears are elementary planetary gears consisting of one or two planetary wheels and a ring gear, as well as an arm that supports the planetary wheels and provides their circular motion. One of the main advantages of simple type B planetary gears (Figure 1) is their high-power density, and high torque modification capability. The orbital motion of the planetary gear relative to the output element is ensured by the radial balancer clutch of the planetary gears, which has through-holes in the planetary gears [].
Compact B planetary gears are generally designed with cycloidal gearing [,] to prevent interference due to the small tooth number difference between the planet gear and ring gear. However, cycloidal gearing is expensive because it requires extremely high manufacturing accuracy. The use of involute gearing in these planetary systems therefore offers an economic advantage, as gear ratio fluctuations resulting from manufacturing errors are negligible compared to those in cycloidal systems. Previous research has demonstrated a clear correlation between cycloidal curve profile errors and gear ratio fluctuations. It is also published that the ratio fluctuation, and hence the torque dissipation, can reach errors as low as 1–2% for profile errors as small as 10 μm []. The geometric design accuracy of planetary gears has a significant impact on both transmission efficiency [] and vibration characteristics []. However, errors in the gearing and load distribution also affect other components of the drive [,,,,,,,,].
The present research investigates the weakening effects of the bores in the planetary gears of simple B planetary gears using involute gearing and their impact on the gear root stress. The results are also applicable to the design of relief bores in other types of external gears, which are important in weight optimization of gear wheels [].

Figure 1.
The construction of a simple planetary gear. 1 and 2—input shaft bearing surfaces; 3—excentric driving parts of the input shaft; 4—planetary gears with the driving bores; 5—ring pin gear; 6—pins of the ring gear; 7—driven pins of the output pin shaft; 8—output shaft with the driven pins, 9—output shaft and one of its bearing surfaces [].
Therefore, this research focused on the effect of the planetary gear of a simple planetary gear B with an evolved gear on the geometry of the planetary gear’s pinhole. In the case of an involute gear, the effects of the guiding hole of the radial balancing clutch on the gear tooth stress weakening are investigated in addition to the control of interferences.
Therefore, it is essential to evaluate the resulting tooth root stress for various geometric configurations to understand how the guiding holes affect the stress distribution and potential weakening of the tooth structure. Prior to analyzing the effect of guiding holes on tooth root stress, a general understanding of the expected stress development is necessary. The study of tooth root stress has been an active research area in recent years [,,,,,,,]. Research has clearly shown that the rim thickness has a dominant influence on the formation of cracks caused by tooth root tension and their spread [,]. In general, the literature has focused on the force acting on the tooth tip edge, where the force on the tooth root is highest. However, in actual contact conditions, two pairs of teeth are typically engaged simultaneously, which leads to partial load distribution.
The analytical calculation in the present research is used as a comparative and control method to validate the results obtained by the finite element method. The most accurate analytical model and computational algorithm possible are used. The computational procedure is based on the Niemann and Glaubitz model, which represent the tooth as a captive support, subject to bending, compression, and shear.
The model applied in the present research differs in that force application point is not at the edge of the tooth head, but at the interface of the individual tooth contact as shown in Figure 2. Consequently, is not necessary to calculate the exact number of mating teeth coefficient separately and the value of the tooth factor is determined by measurement in a CAD system. Thanks to the measurements, the value of the tooth factor can be determined for both the pulled and the compressed side of the tooth, so that asymmetric tooth structures can be tested. The circular arc Highest Point of Single Tooth Contact (HPSTC) in Figure 2 indicates the starting point of the single tooth contact, while Lowest Point of Single Tooth Contact (LPSTC) indicates the end point.
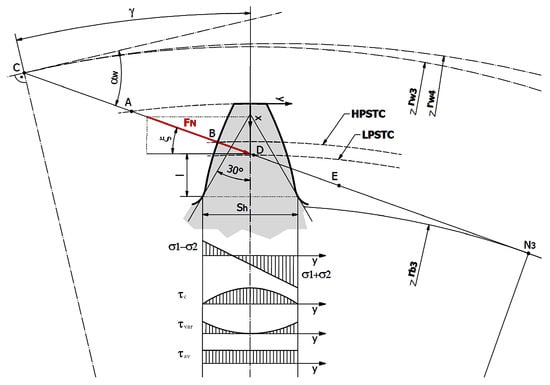
Figure 2.
Load stresses in the dangerous cross-section of the tooth root.
In Niemann and Glaubitz’s method, the tooth factor considers the shear stress, but it is important to note that it uses an average sliding stress []. For accuracy, it is important to clarify that since the tooth has a variable cross-section, sliding stress is also induced in the outer fibre, as shown in Figure 2. An important parameter is the fatigue ratio µ investigated by Niemann, which is the ratio of the fatigue stress σ and the fatigue stress τ. According to Niemann, who investigated the fatigue limit of the gear using stress-optical and pulsator tests for different gear materials with different lubricants, this value is 2.5. This ratio remains constant across different tooth heights and impact loads [].
Therefore, the diagrams in the literature cannot be used in the present study, since the values of the tooth factors are developed for the case of the force applied at the tooth tip edge. By editing and measuring in CAD and then substituting the values obtained, the value of the tooth factor can be calculated, moreover, by this method, for any force applied at any arbitrary profile point. When determining the maximum of the reduced stress, it is also necessary to introduce the YSa stress concentration factor. Based on the literature, its value can be assumed to be between 1.5–1.7 and can be refined by means of a diagram as a function of the profile shift coefficient. However, since these models primarily describe the extracted side of the tooth, in this study, the factor is iteratively refined based on finite element method feedback [].
2. Materials and Methods
In the examined design, the guiding hole weakens the tooth root of the planetary gear, and the size of the rim thickness “h” has a fundamental influence on the value of the resulting tooth root stress. The gear rim is the ring of material located beneath the gear teeth, which serves to hold and support the gear teeth. This geometrical length defines the weakest point of the gear. The gear rim must be of sufficient radial thickness to prevent fatigue cracks from propagating through the rim rather than under the gear teeth. American Gear Manufacturers Association (AGMA) recommends that gear rim thickness should be no less than 1.2 times the whole tooth depth []. To investigate this, it is necessary to determine a load position at which the weakening effect of the guiding holes is most critical.
To consider the most critical case for the position of the guiding hole, the asymmetric nature of the tooth root loading must be considered (Figure 3). The force transmitted through the tooth pair can be decomposed into a bending component and a compressive component. Then the stress components from pulling and bending are added on one side—the pressing side, while on the other side, the stress components from pulling and bending are subtracted—the pulling side (Figure 3). From a fatigue perspective, the pulled side is more critical, even though the stress peak is smaller, since the propagation of cracks is assisted by the tensile stress. Thus, if the guiding hole weakens the tooth filling on the side of the compressive stress, the root stress on the pulled side will also increase due to the greater deformation caused by the weakening effect of the guiding hole, since the greater stress on the compressive side tends to dent the stressed part under the tooth. This condition promotes the crack-opening effect of the pulled side and leads to the formation of a stress-concentration plastic zone on the compressed side. Repeated stresses in this manner will lead to rapid fatigue if the weakening effect of the guiding hole reaches a critical level.
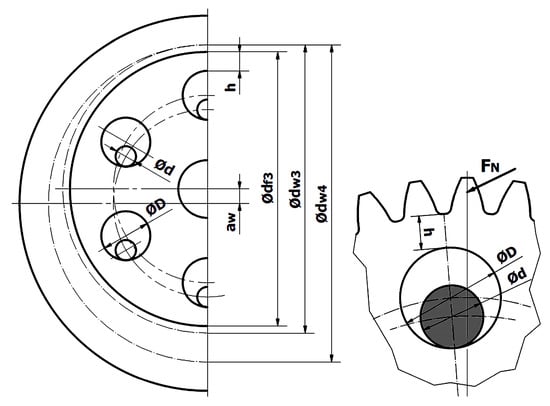
Figure 3.
Sketch of the load situation and the geometry of the guiding bores.
By reviewing the theoretical background, a load model was developed that allows the structure to be tested in a way that the maximum loaded connection situation exists for the critical geometric parameters. Main findings:
- -
- Analytical analysis based on the Niemann and Glaubitz model.
- -
- Load at the upper limit of the single-tooth-pair contact.
- -
- The weakening effect of the guiding hole is located on the compressive side of the loaded flank.
In summary, the loading model investigates the weakening effect on the compressed side of the tooth, since the extensive stress zone here coincides with the weakening effect of the guiding hole sooner than on the less stressed side of the pulled tooth. Consequently, there is an elevated fatigue risk due to stress accumulation and greater deformation.
The tests were carried out using the Solid Works finite element module under static loading conditions and a linear material model. The test boundary conditions can be observed in Figure 4, illustrating the main constraints and loads to ensure that the results are close to reality. Table 1 summarizes the constraints, contacts, and loads applied during the simulations.
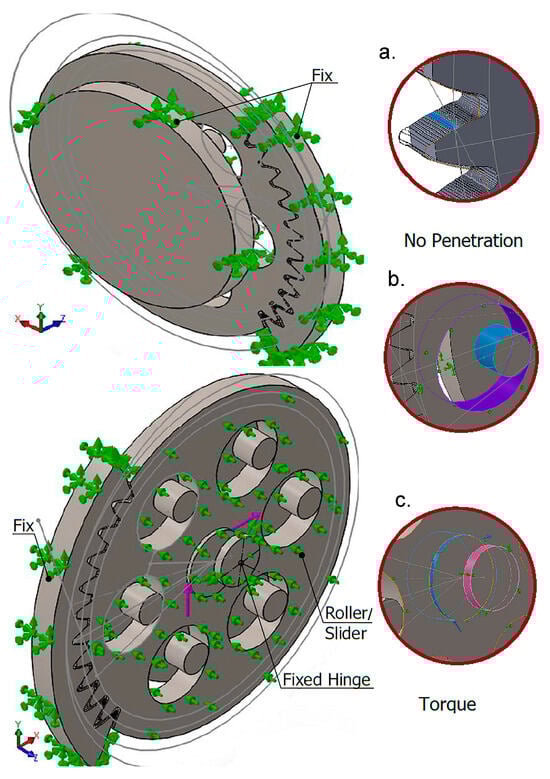
Figure 4.
Boundary conditions for finite element analysis; (a) tooth contact, (b) driving or guiding contact with the planetary gear, (c) load torque entering the eccentric axis.

Table 1.
Boundary conditions.
According to the established test model, the weakening effect of the guiding hole is evaluated at the B boundary point of the one-tooth pair contact (Figure 5) utilizing the meshing conditions from Table 2.
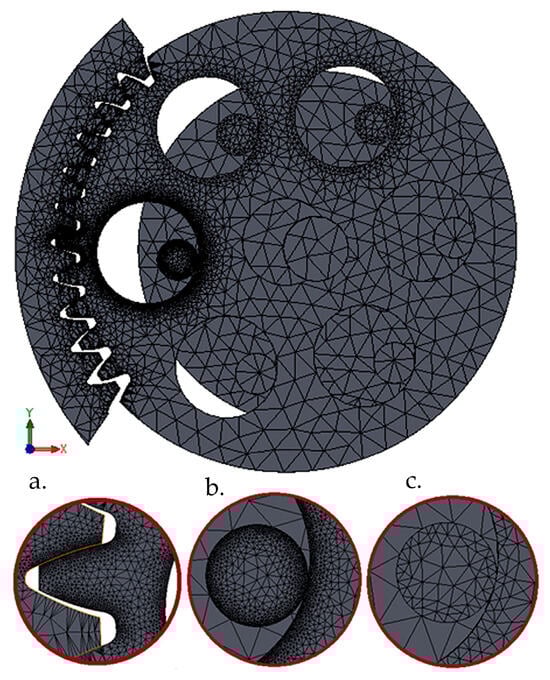
Figure 5.
The Curvatured Mesh Elements model. (a) loaded tooth pair, (b) guiding hole and pin weakening the loaded tooth pair, and (c) pins involved in load transfer.
Table 2.
Meshing conditions.
For a proper comparison of the test results, it is important to record the coordinate systems in which the results will be interpreted. Thus, the results of the simulations on the weakening effect of the tooth root are always plotted in the coordinate system K1 and K2 as shown in Figure 6. Where the x1 and x2 axes intersect the center of the planetary wheel.
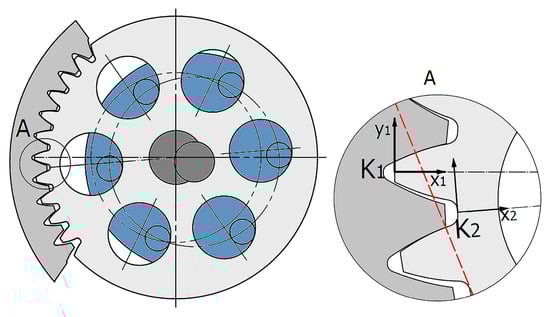
Figure 6.
Coordinate systems for evaluating the test results.
3. Results
To validate the finite element model, a comparison with analytically calculated tooth loading parameters, using the Niemann-Glaubitz method, was established.
From Table 3 and Table 4, the maximum stress of the tooth root obtained from the finite element tests for the structure under study starts to set at approximately h = 8.5 [mm] to the analytically calculated value at h = 8.5 [mm]. At the stress corresponding to h = 9 [mm], there is a minimally lower stress value at h = 8.5 [mm] due to the minimal deviation in the mesh. However, based on the simulations, it is clear that the value of h = 8.5 [mm] represents the limit that is significant in terms of the increase in tooth root stress. This means that if the rim thickness is smaller than this, the weakening effect of the guiding hole already increases the load on the root. Thus, the comparison of analytical results can only be made with h ≥ 8.5 mm.
Table 3.
Tooth structure data and analytically calculated tooth loading parameters for the pressed side using the Niemann-Glaubitz method.
Table 4.
Effect of rim thickness h on the maximum Von Mises stress of the root.
4. Discussion
After determining by interaction the rim thickness “h” at which the weakening effect of the relaxation does not yet occur, the stress-strengthening effect can be tested. For this purpose, it is advisable to reduce the h gradually, so that an approximate function describing the nature of the weakening effect can be obtained by documenting the stress values. Figure 7 illustrates that as rim thickness decreases, the zone of stress above the fatigue limit of the tooth root expands visibly.
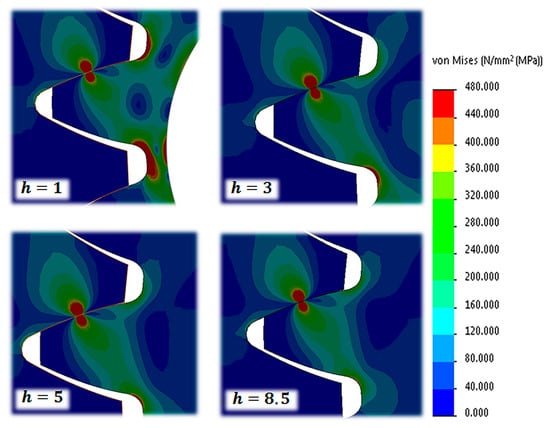
Figure 7.
Von Mises stresses for different rim thicknesses h.
4.1. The Weakening Effect of the Guiding Hole
The weakening effect of the passing guiding hole is most significant at the tooth root. Here, the maximum stress value increases rapidly, and later, the location of its onset starts to migrate as the rim thickness becomes thinner. This can be seen in the diagram in Figure 8, which shows the Von Mises stresses on the compressed side of the rim for different rim thicknesses. Here, the abrupt rise of the stress peaks in the vicinity of the tooth root curve, i.e., the geometric discontinuity, can be observed.
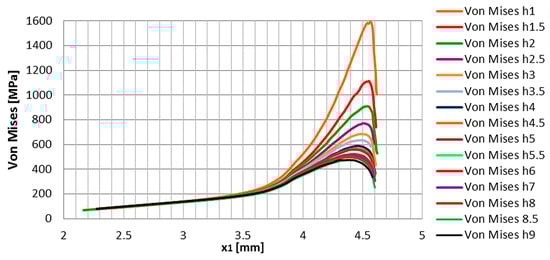
Figure 8.
The stresses in the pressed tooth root at different rim thicknesses (plotted in the coordinate system K1).
The stress variation on the pressed and pulled sides follows a similar trend, though the maximum stresses are lower on the pulled side, and the onset of the weakening effect occurs later. Here, we observe an increase in the maximum stress of the tooth root as a function of the rim thickness “h”, both on the pulled and the pressed side. When the value of the parameter h reaches a certain value, the stress growth follows a hyperbolic pattern.
Comparison of Figure 9 and Figure 10 indicates that the maximum stress occurs on the pressed side due to the significant stress-increasing effect of the tooth curvature change. Therefore, further refinement of the pressed-side load data is necessary to establish a general relation. The practical benefit of this is that a simple relation can be used in everyday design to easily predict the geometric limit of the location of the guiding holes, beyond which the stress in the tooth root starts to increase.
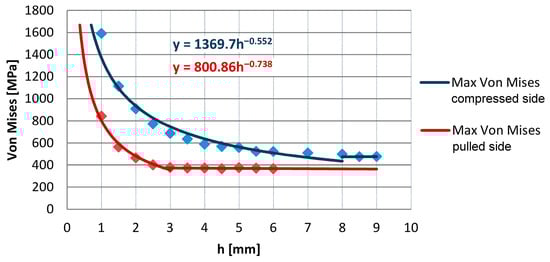
Figure 9.
Variation in the maximum stress on the tooth root on the pulled (upper curve) and pressed (lower curve) side (in coordinate system K1).
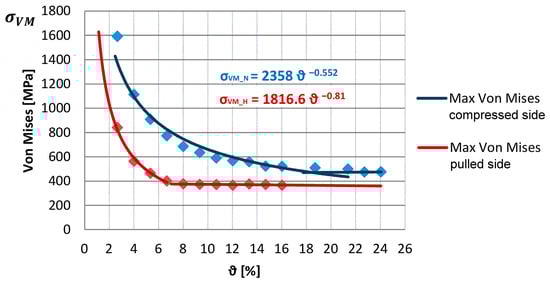
Figure 10.
A generalized case of the stress-inducing effect of a guiding hole. The upper curve is for the compressed side, the lower one for the extracted side.
It is therefore necessary to have a factor that can introduce a generalized relationship based on geometric similarity. This requires knowing the design value of the maximum stress of the tooth root, which is fixed. This defines the linear section of the compressed side curve in Figure 9. Then, the value of our desired coefficient is independent of the thickness b of the gear, since, if the stress is fixed, the value of the line pressure between the tooth profiles is constant. This means that the load is always kept constant by adjusting the width of the gear to the resulting tooth load. Therefore, the rim thickness h between the leg circle and the guiding hole and the driving hole diameter D may be influencing factors, as they also modify the value of the tooth deformation. The ratio between two parameters defines a simplified rim factor (let δ), the lower this ratio, the higher the resulting tooth stress.
Thus:
Accordingly, there is an inverse proportionality between the stress and the value of the inhibition factor:
Evidently, this is true only within the range of the weakening effect, since outside this range the maximum of the gear stress is set to the scaling value (in this case, σred max). Since the geometry of the involute gears can be described and proportionalized to the modulus, it is useful to introduce a modulus-related inhibition factor:
The ϑ defines the rim factor per unit module. From now on, we will call this the inhibition factor, which gives the value of the inhibition factor per module.
In the present case, the approximate equation describing the increase in tooth stress on the compressed side:
In the present case, an approximate equation describing the increase in the stress on the drawn or pulled side:
Figure 8 shows the variation in the maximum stress as a function of the number of retractions. On both the tensioned and compression sides, a limit ϑlim is observed where the weakening effect of the guiding hole starts to increase the value of the stresses. The mentioned ϑlim, i.e., the limit of the guiding ratio, is different for the tensioned and the compression side. For the compressed side, subtracting the design base value of the stress from the approximate equation gives the function whose zero position gives the value of ϑlim:
where σred max = 480 [MPa].
If the value of the specific inhibition factor is lower than this, the weakening effect of the guiding hole is already present, and the stress in the tooth starts to increase. However, the above relationship has been validated for a specific tooth stress, but simulations can be used to determine tooth stresses for other materials and other loading cases. Thus, it was also useful to investigate the variation in the coefficient of relaxation as a function of the tooth root stress, so that the relationship between the value ϑlim and the tooth root stress allowed for different materials and load cases could be demonstrated.
The following equation is a general formula that estimates the highest root stress value in the compressed root:
Table 5 summarizes the results of some of the finite element simulations.
Table 5.
Data for the compressed side of the tooth root. For different loads, the finite element results and the approximate values calculated for these points according to Equation (1) are shown, as well as the relative error.
As can be seen in Figure 11, the value of ϑlim does not seem to change with the change in the tooth root stress. An important result here is that the variation is not significant in the load ranges that are commonly encountered, so its value can be taken to be ~18 [%].
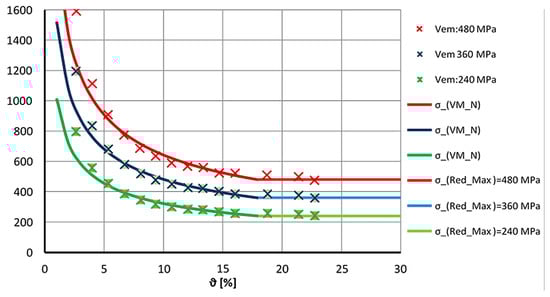
Figure 11.
Compressive side stress approximation under different loading conditions.
It should be noted here that the stress concentration effect starts around ~20 [%], if this is neglected, the error here is 5–6%, which can also be seen in Table 5.
In general, if σmeg ≤ REh, then the stress increase takes the shape shown in Figure 11, where the linear phase is replaced by a hyperbolically increasing curve at the limit point of the ϑ inhibitor factor.
This can also be seen in Figure 12, where the change in the stress state of the root as a function of the introduced guiding ratio is shown. Here, it can be observed that the limit of the interpretation range is the yield strength, since this is also our maximum allowable stress at design time. Another possibility in design is to use static sizing. In this case, σmeg = REh; however, also in this case, the limiting value of the specific rim factor introduced is the value of ϑlim. The results are summarized in Table 6.
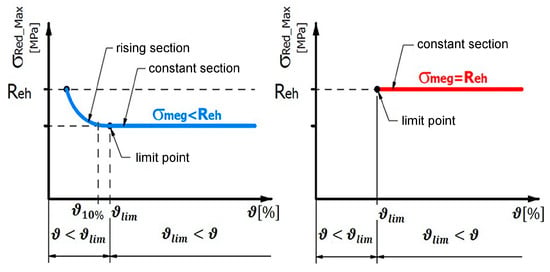
Figure 12.
Range limits of the specific guiding coefficient for two different scaling models.
Table 6.
Summarizing the results.
Using the simple calculation procedure presented here, it is easy to calculate the rim thickness h at which the stress-absorbing effect of the guiding hole is not yet or only to the desired extent, according to the design.
4.2. Checking the Correctness of Modelling: Testing the Weakening Effect on the Pulled Side of the Tooth Root
The main objective in checking the load model is to ensure that the critical load situation established is correct. The literature search and the preliminary analytical calculations led to the conclusion that it was appropriate to investigate the pressed side of the tooth root, since the stress peak that develops here is much more extensive than on the pulled side. However, the crack initiation point is on the pulled side of the tooth, so it is also worth investigating the case where the weakening effect of the guiding hole is most pronounced.
In this case, sticking to the evaluation as a function of the h rim thickness, it can be said in advance that the maximum stresses on the pressed side of the root are expected to be lower. The question is how much the tension increase on the pull side will be. In this case, the pull side will be significantly weakened, but the stiffness of the push side will increase, which may compensate for the weakening effect.
The test procedure is the same as in the previous method, and the finite element model is built in the same way. The only difference is that the driving bores weaken the pull side tooth root more, resulting in the smallest h rim thickness. This is shown in Figure 13. This means that the tests were carried out in the K1 coordinate system, as shown in Figure 6, so that a comparison of the results can be easily made.
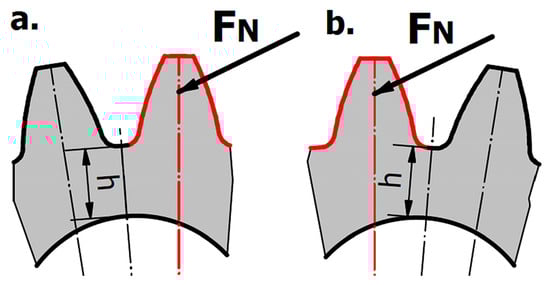
Figure 13.
Investigation of the weakening effect of the driving bore (a) push side load (b) pull side load.
4.3. Comparison of the Weakening Effect on the Pushed and Pulled Sides of the Tooth Root
Because both data sets were analyzed using the same coordinate system, direct comparison is possible. The diagrams compare the stresses on the pressed and pulled sides of the tooth, according to the side of the loaded tooth on which the threaded holes, weakening the tooth, are located.
An exciting result can be seen by looking at Figure 14, where the variation in the root stress on the pulled side is shown in a comparison diagram. It can be observed that when the weakening effect of the guiding bore is transferred to the pulled side, the tooth root stress increases, but not as much as on the pushed side. The rate of increase in stress remains below 10%, even though the strength of the pull side tooth root has weakened significantly. This is partly explained by the fact that the stiffness of the more loaded side of the tooth has increased, so that the loaded tooth suffers less deformation. As a result, there is not enough root stress on the pulled side to compensate for the weakening effect. On the other hand, the local stress concentration zone on the pulled side is less extensive, so that the weakening effect occurs later, and the two test data series are not sharply separated.
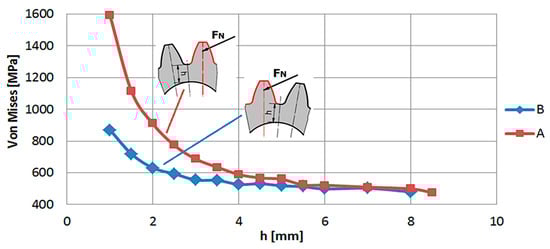
Figure 14.
Variation in the compressive side tooth root stress as a function of the weakening, considering the placement (in the K1 coordinate system). Data series A: The driving hole weakens the side of the root that is being pushed. Data series B: The driving hole weakens the side of the extracted tooth.
Figure 15 demonstrates the results as a function of the number of departures. It can be observed that if the tensioned side is weakened by the loaded tooth root, then the stress-increasing effect starts to occur at a much lower value of the inhibition factor on the compressed side. In summary, Table 7 summarizes the stress variations and relative deviations for the weakening of the tensioned and compression sides. The deviations show the stress deviations for the compressive side weakening effect compared to the pulled side weakening case (Figure 16).
where
∆σVM_N—The difference in the maximum stress on the pressed side, with the guided bore placed on the pulled–pressed side.
∆σVM_H—Difference in the maximum stress of the pulled side, to the positioning of the driving or guided hole on the pul–push side.
σVM_N1—Compressed tooth root side stress maximum, if the guided hole or bore is on the pressured side.
σVM_N2—Compressed tooth root side stress maximum, if the guided bore is on the pulled side.
σVM_H1—Root stress maximum on the pulled side, if a guiding bore is on the pushed side.
σVM_H2—Stress maximum on the pulling side when the guiding bore, or hole, is on the pulled side.

Figure 15.
Variation in the pulling side gripping stress as a function of the number of threading ratios, taking into consideration the placement (in the K1 coordinate system). Data series A: The driving hole weakens the side of the root that is being pushed. Data series B: The driving hole weakens the side of the extracted tooth.
Table 7.
The effect of the positioning of the tapping hole on the pressed or pulled side of the tooth on the tooth stresses.
Table 7.
The effect of the positioning of the tapping hole on the pressed or pulled side of the tooth on the tooth stresses.
| h [mm] | ϑ [%] | Guiding Hole on the Compressed Root Side | Guiding Hole on the Pulled Root Side | Difference on the Compressed Side | Difference on the Pulled Side | ||||
|---|---|---|---|---|---|---|---|---|---|
| Compressed Side σVM_N1 | Pulled Side σVM_H1 | Compressed Side σVM_N1σVM_N2 | Pulled Side σVM_H2 | ΔσVM_N | HN | ΔσVM_H | HH | ||
| Von Mises [MPa] | Von Mises [MPa] | [MPa] | [%] | [MPa] | [%] | ||||
| 1.0 | 2.674 | 1591.609 | 841.091 | 870.601 | 857.232 | 721.008 | 82.817 | −16.141 | −1.883 |
| 1.5 | 4.011 | 1113.383 | 563.669 | 718.538 | 619.135 | 394.845 | 54.951 | −55.466 | −8.959 |
| 2.0 | 5.348 | 908.125 | 463.553 | 630.168 | 488.541 | 277.957 | 44.108 | −24.988 | −5.115 |
| 2.5 | 6.684 | 772.314 | 399.792 | 592.965 | 430.341 | 179.349 | 30.246 | −30.549 | −7.099 |
| 3.0 | 8.021 | 685.731 | 377.027 | 554.335 | 389.234 | 131.396 | 23.703 | −12.207 | −3.136 |
| 3.5 | 9.358 | 634.666 | 372.508 | 552.089 | 385.005 | 82.577 | 14.957 | −12.497 | −3.246 |
| 4.0 | 10.695 | 588.823 | 371.31 | 526.322 | 368.427 | 62.501 | 11.875 | 2.883 | 0.783 |
| 4.5 | 12.032 | 567.456 | 365.745 | 530.879 | 376.794 | 36.577 | 6.890 | −11.049 | −2.932 |
| 5.0 | 13.369 | 559.091 | 375.182 | 517.644 | 369.877 | 41.447 | 8.007 | 5.305 | 1.434 |
| 5.5 | 14.706 | 523.041 | 370.517 | 512.205 | 371.696 | 10.836 | 2.116 | −1.179 | −0.317 |
| 6.0 | 16.043 | 521.478 | 365.497 | 498.109 | 363.263 | 23.369 | 4.692 | 2.234 | 0.615 |
| 7.0 | 18.717 | 509.302 | - | 502.128 | - | 7.174 | 1.429 | - | - |
| 8.0 | 21.390 | 498.517 | - | 479.433 | - | 19.084 | 3.981 | - | - |
| 8.5 | 22.727 | 474.638 | - | - | - | - | - | - | - |
| 9.0 | 24.064 | 475.711 | - | - | - | - | - | - | - |

Figure 16.
Differences in root stresses in the case of weakening on the pushed side compared to the case of weakening on the pulled side.
5. Conclusions
This study investigated the design aspects of simple internal gear planetary gears. The main objective was to establish a design criterion that ensures the rim thickness (h) is sufficient to prevent weakening of the gear’s load-carrying capacity.
The investigation of the effect of the rim thickness on the gear tooth stress was analyzed to identify the most critical tapping and relief hole positions and geometries.
The validation of the tooth root stresses was performed by analytical and FEM simulations. As a result of the research, the design of the guiding holes and the wheel relief holes can be performed with an accurate knowledge of their influence on tooth stress. The overall objective of this paper was to find a method to calculate the maximum guiding hole pitch diameter at which the stress does not increase in the tooth root. The first step in the calculation algorithm is to determine the necessary gear parameters based on the gear ratio and the performance of the planetary gear. The number of teeth and the module “m” can be determined. This also gives the center distance “a”. Knowing the torque of the planetary gear, the diameters of the drive pins must be determined by strength calculations. The diameter of the guiding holes “D” is the sum of the diameter of the drive pin and twice the center distance. Based on the relationships presented in the article, it is possible to determine the maximum guiding hole pitch diameter at which the stress does not increase in the tooth root. Future work should include examining the effect of the wheel width-to-diameter ratio. These calculations were based on the assumption that, during the design process, the tooth stress value is kept constant by selecting the required wheel width.
In conclusion, the load geometry used in the tests takes into consideration the most dangerous case for the load capacity of the gear. This is particularly true as the effect of overloading due to tooth deformations, and thus the effect of the distribution of the tooth contact force has not been taken into consideration. This makes the relationship in the following equation suitable for scaling towards safety.
The demanding requirements placed on engineers, such as extremely rapid pre-design, require the development of fast and accurate algorithms that can significantly shorten the pre-design and design process. It is important that the relationships given to the engineer are supported by solid background research, numerical and analytical calculations, and that the resulting tooth root and rim stresses are accurate already at the pre-planning stage of the planetary gears. This research gives engineers such a tool to perform fast and accurate geometric and strength calculations in a cost-effective way.
Author Contributions
Conceptualization, F.T.-R. and Z.F.; validation, A.S.; writing—original draft preparation, F.T.-R. and Z.F.; writing—review and editing, F.T.-R.; supervision, A.S.; funding acquisition, A.S. All authors have read and agreed to the published version of the manuscript.
Funding
This research received no external funding.
Institutional Review Board Statement
Not applicable.
Informed Consent Statement
Not applicable.
Data Availability Statement
The original contributions presented in this study are included in the article. Further inquiries can be directed to the corresponding author.
Acknowledgments
Special thanks to László Ferenc Németh, a former university student, for the figures and for his very helpful and active assistance in the research.
Conflicts of Interest
The authors declare no conflicts of interest.
References
- Kozma, M. Hajtásrendszerek (Drive Systems); Műegyetemi Kiadó: Budapest, Hungary, 2001. [Google Scholar]
- Thube, S.V.; Bobak, T.R. Dynamic Analysis of a Cycloidal Gearbox Using Finite Element Method. In AGMA Technical Paper; AGMA: Alexandria, VA, USA, 2012. [Google Scholar]
- Cyclo® 6000 Speed Reducers, Gearmotors and Brakemotors, Operation and Maintenance Maintenance Manual; Manual 04.601.60.005; Sumitomo Machinery Corporation of America. Available online: https://us.sumitomodrive.com/sites/default/files/2023-11/cyclo_6000_o_and_m_v5_web.pdf (accessed on 25 October 2025).
- Roboz, D. Numerical Analysis of the Load Distribution of Cycloidal Gears as a Function of Manufacturing Errors. Bachelor’s Diploma Thesis, BME Budapest, Budapest, Hungary, 2016. [Google Scholar]
- Tihomir, M.; Blagojevic, M.; Babić, Ž.; Kostic, N. Influence of design parameters on cyclo drive efficiency. J. Balk. Tribol. Assoc. 2013, 19, 497–507. [Google Scholar]
- Ivanov, V.; Alexandrov, A.; Vrazhilski, D.; Tomova-Damyanova, E.; Tsonev, V.; Kuzmanov, N.; Popov, A. Experimental Study of the Pin Loads in a Full Pinion Engagement Planetary Gear Train. Eng. Proc. 2024, 70, 13. [Google Scholar] [CrossRef]
- Wang, S.; Wang, J.; Ren, H. Research on Fault Diagnosis of Gear Transmission Systems Based on Dynamic Transmission Error. Eng. Proc. 2025, 111, 3. [Google Scholar] [CrossRef]
- Benarbia, A.; Tomomewo, O.S.; Laalam, A.; Khalifa, H.; Bertal, S.; Abadli, K. Enhancing Wear Resistance of Drilling Motor Components: A Tribological and Materials Application Study. Eng 2024, 5, 566–588. [Google Scholar] [CrossRef]
- Ziaei, M.; Selzer, M.; Sommer, H. Influence of a Shaft Shoulder on the Torsional Load-Bearing Behaviour of Trochoidal Profile Contours as Positive Shaft–Hub Connections. Eng 2024, 5, 834–850. [Google Scholar] [CrossRef]
- Ziaei, M. Shear and Bending Stresses in Prismatic, Non-Circular-Profile Shafts with Epitrochoidal Contours Under Shear Force Loading. Eng 2024, 5, 2752–2777. [Google Scholar] [CrossRef]
- Erney, G. Fogaskerekek (Gears); Műszaki Kiadó: Budapest, Hungary, 1983; ISBN 961050890. [Google Scholar]
- Vörös, I. Fogaskerekek Fogalakjai és Fogalaktényezői a Fogtőszilárdság Méretezéséhez (Gear Tooth Shapes and Tooth Shape Factors for Dimensioning Gear Tooth Strength); Akadémiai Kiadó: Budapest, Hungary, 1968. [Google Scholar]
- Stampfer, M. Segédlet Egyfokozatú Fogaskerék-Áthajtómű Méretezéséhez (Guide to Sizing a Single-Stage Gear Transmission); Pécs University of Sciences: Pécs, Hungary, 2011. [Google Scholar]
- Raja, S.; Ramaswamy, K.; Lokesh, M. Weight Optimization of Helical Gear Under Static Analysis. Int. J. Mech. Eng. Technol. 2018, 9, 875–881. Available online: http://iaeme.com/Home/issue/IJMET?Volume=9&Issue=9 (accessed on 20 October 2025).
- Chmurawa, M.; Lokiec, A. Distribution of loads in Cycloidal Planetary Gear (CYCLO) including modification of equidistant. In Proceedings of the 16th European ADAMS User Conference, Berchtesgaden, Germany, 14–15 November 2001. [Google Scholar]
- Park, J.-H.; Chung, W.-J.; Park, Y.-J.; Kim, H.-S.; Seo, J.B.; Park, J.S. Effect of Rim and Web Thickness on Tooth Root Stress of Spur Gear Body and Safety. Int. J. Automot. Technol. Chassis Manuf. Mater. Recycl. 2024, 25, 279–293. [Google Scholar] [CrossRef]
- Doğan, O.; Yuce, V.; Karpat, K. Effects of rim thickness and drive side pressure angle on gear tooth root stress and fatigue crack propagation life. Eng. Fail. Anal. 2021, 122, 105260. [Google Scholar] [CrossRef]
- Mallesh, G.; Avinash, P.; Melvin Kumar, R.; Sacchin, G.; Zayeem, K. Finite Element Modeling and Bending Stress Analysis of Non Standard Spur Gear. Int. J. Res. Eng. Technol. 2015, 4, 231–237. [Google Scholar] [CrossRef]
- Kailuke, J.S.; Yenarkar, Y.L. Investigation of Stresses in the Thin Rimmed Spur Gear Tooth Using Fem. Int. J. Res. Eng. Technol. 2013, 2, 437–441. [Google Scholar] [CrossRef]
- Debreczeni, D.; Bognar, G. Investigation of the Nominal Tooth Root Stress for External, Cylindrical Gears with Symmetric and Asymmetric Profile. Wseas Trans. Appl. Theor. Mech. 2020, 15, 31–37. [Google Scholar] [CrossRef]
- Tata, R.P. Basic Gear Fundamentals; Course No: M04-033; Continuing Education and Development, Inc.: Stony Point, NY, USA, 2023; Available online: https://www.cedengineering.com/userfiles/M04-033%20-%20Basic%20Gear%20Fundamentals%20-%20US.pdf (accessed on 16 May 2024).
- Balajti, Z. Generalization Process of the Integrated Mathematical Model Created for the Development of the Production Geometry of Complicated Surfaces. Symmetry 2024, 16, 1618. [Google Scholar] [CrossRef]
- Lewicki, D.; Ballarini, R. Effect of Rim Thickness on Gear Crack Propagation Path. J. Mech. Des. 1997, 119, 88–95. [Google Scholar] [CrossRef]
- Hiremagalur, J.; Ravani, B. Effect of Backup Ratio on Root Stresses in Spur Gear Design. Mech. Based Des. Struct. Mach. 2004, 32, 423–440. [Google Scholar] [CrossRef]
Disclaimer/Publisher’s Note: The statements, opinions and data contained in all publications are solely those of the individual author(s) and contributor(s) and not of MDPI and/or the editor(s). MDPI and/or the editor(s) disclaim responsibility for any injury to people or property resulting from any ideas, methods, instructions or products referred to in the content. |
© 2025 by the authors. Licensee MDPI, Basel, Switzerland. This article is an open access article distributed under the terms and conditions of the Creative Commons Attribution (CC BY) license (https://creativecommons.org/licenses/by/4.0/).