1. Introduction
With the growth of population and urbanization, the optimal use of land has become a crucial issue. The construction of residential, administrative, and commercial complexes in urban areas, especially in large cities, highlights the importance of detailed field and geotechnical studies to ensure the proper design and stability of the guard structures [
1]. The stability of excavations and the bearing capacity of foundations are critical factors [
2,
3,
4], and the method of pit excavation and stabilization of open pits are key considerations for successful construction projects [
5].
Excavations at great depths require careful consideration of effective land use, time constraints, and the stability of pit walls, which some experimental studies have conducted recently [
6,
7]. In order to minimize the disturbance to the surrounding area and prevent potential collapse, guard structures are implemented before foundation construction to increase the strength of the excavated walls. Various methods can be used for restraining and building a guard structure, but nailing or anchoring is one of the most effective and commonly used methods [
8,
9]. With the unpredictable behavior of soil and the presence of adjacent buildings and facilities, it is necessary to take action to ensure the stability of the excavation site and protect against potential risks [
10].
Soil nail walls are constructed by erecting a front face support and inserting closely spaced steel bars or sections in the existing ground to provide passive reinforcement. Various parameters are influential on the stability of the nailed wall, such as nail spacing, whose effect on the global stability of soil-nailed walls has been well studied [
11]. Anchoring, on the other hand, is a more complex and specialized method of providing stability to structures. Anchors come in a variety of types, including helical anchors, driven piles, and drilled shafts, and are designed to provide support in a variety of soil and geologic conditions. Anchors are commonly used in foundation work, including building foundations, retaining walls, and bridges, where they are used to transfer the load of the structure to the ground [
12]. The problems of designing a well and implementing guard structures in the field of civil engineering vary widely, and therefore there is a need to review and study geotechnical data, available materials, implementation methods, financial costs, and project construction time. To select the stabilization system of the pit walls using guard structures, factors such as excavation depth, soil type, existing overhead, boundary conditions, materials, and equipment are influential. The following are a few current, pertinent studies: In a superdeep excavation in Beijing, Wang et al. [
13] studied the stress and deformation properties of a composite soil-nailed wall and an anchored soldier pile wall combined retaining system. Their study shed light on the variables influencing the performance of the retaining structure and emphasized the need to limit lateral displacement during excavation. Similar to this, during the construction of a deep foundation pit, Sun et al. [
14] examined the behavior of a three-pile and two-anchor rod support system in an anhydrous sand pebble strata. Their investigation clarified the axial force distribution along anchor rods and the passive force-bearing property of soil-nailed walls, which advances our knowledge of the behavior of support systems in a range of scenarios. Mun et al. [
15] employed a hybrid soldier pile, tieback, and soil-nailed shoring wall to reduce shoring wall displacement in crowded metropolitan locations. Their results illustrated the usefulness of using thorough numerical simulations in shoring system design by proving how well this hybrid technique reduced wall displacement below allowable bounds. In order to enlarge a hillside roadway, Zhou et al. [
16] devised a laterally cantilevered space frame system that uses ground tieback anchors as essential structural elements. They successfully redistributed surcharge loadings on slopes, which provided advantages over traditional approaches in terms of lower construction costs and environmental impact. Additionally, in soft soil places close to the sea, Junding Liu et al. [
17] looked into the deformation management of deep foundation pit excavation. Using both numerical modeling and long-term in situ monitoring, their study examined the deformation characteristics of a geometrically difficult deep foundation hole project in Taizhou. Future projects with comparable conditions might refer to the study’s insightful findings on the deformation features of deep foundation pit excavation in soft soil areas.
A prestressed anchor holding system with a bearing structure under the anchor head was presented by Jia et al. [
18] as an alternative to rigid retaining techniques in deep foundation pits. Their study proved how well the technology controlled deformation and reduced environmental impact, providing useful solutions for excavation operations in metropolitan areas. Furthermore, in large-scale deep foundation pit situations, Liu et al. [
19] examined the “corner effect” in the optimum design of soil-nailed wall-retaining pile-anchor cable supporting systems. Their work underlined the need to take lateral forces into account in support structure design by proposing an optimization technique to lower construction costs while meeting safety criteria. A case study of a deep excavation next to a residential structure in Tehran using high-pressure grouted soil nails and anchors for lateral support was given by Mirlatifi [
20]. His research validated the efficacy of the chosen design techniques by demonstrating the relationship between numerical forecasts and observed displacements and reinforcing pressures. In order to conduct a deep foundation excavation in a second-tier inland city, Chen et al. [
21] examined several retaining system designs, highlighting the significance of striking a balance between structural capabilities and cost-effectiveness. Their results highlighted the advantages of hybrid methods in lowering displacements and improving safety during excavation, such as soil-nailed walls in conjunction with pile anchors. Nisha et al. [
22] examined the difficulties in urban design and construction while presenting a case study of deep excavation for an office building in Bengaluru. Their research made clear how crucial numerical modeling is to the efficient design of shoring systems and the prompt implementation of corrective actions to reduce the risk to nearby structures. In their investigation of several stabilizing techniques for deep excavation pit walls in Ardabil, Zolfegharifar et al. [
23] emphasized the need to establish a stable and safe environment prior to excavation. In order to evaluate the stability of excavation walls, their study used finite element and limit equilibrium analysis, which gave important insights into geological and geotechnical issues. In addition to the above studies,
Table 1 also summarizes an approach-based literature review that aims to explore the current state of research on the topic of the bearing capacity of nails and helical anchors in order to provide a more comprehensive overview of the existing literature and identify gaps in the research that need to be addressed.
Table 1 shows that most of the previous studies that looked at the effect of different factors on the bearing capacity of nails and helical anchors used numerical and finite element modeling. As mentioned in
Table 1, several researchers have pointed out the effects of spacing between helical plates on bearing capacity, but extensive and practical research has not been conducted in this case.
This novel study examines the comparison of the final bearing capacity of nails and helical anchors in a very detailed and rigorous way to address a gap in the field. We aim to use Abaqus v. 6.12 [
30] software to examine an excavated model with helical anchors to calculate their maximum capacity when expanded in the specified soil. A method for accurately assessing soil behavior is simulation, which provides insightful information for improving and stabilizing soil [
31,
32,
33,
34,
35]. At first, numerical modeling is used to verify the validity of the topic discussed in the selected basic article, and then by making changes in the implementation of helical anchors, such as changing the diameter of helixes, combining simple anchors with helixes, increasing the number of helixes, and a gradual increase in the load, the change in the head of the wall reaches the allowed value of the regulation. In this research, an attempt has been made to discuss and investigate the impact of excavation behaviors and the values obtained from the displacement and deformation of the pit wall, which are modeled by the various implementations of helical and simple anchors in Abaqus.
2. Material and Methods
2.1. Model Planning
Before carrying out any excavation operation, geotechnical studies and research should be conducted to determine the soil type of the site. In this research, the existing dug wells, water aqueducts from the past to the present, and underground facilities should also be examined. The underground water level is another issue that should be paid special attention to. If there is a heavy load, especially dynamic and seismic loads such as pools around the drilling site, the necessary measures must be included in the process requirements to reduce these loads.
One of the most significant, and perhaps one of the most crucial, influencing factors in geotechnical studies is the soil behavior model. The results and analysis design may be significantly impacted by the selection of appropriate soil behavior models. In the research that has been conducted, an effort has been made to look into the behavior of the drilling process and the values of displacements and deformations of the pit wall. These values are first verified by numerical modeling with a laboratory model, and then the drilled model with a nailing system and helical bracing system is analyzed using the Abaqus software. The models created by the software are introduced in
Table 2.
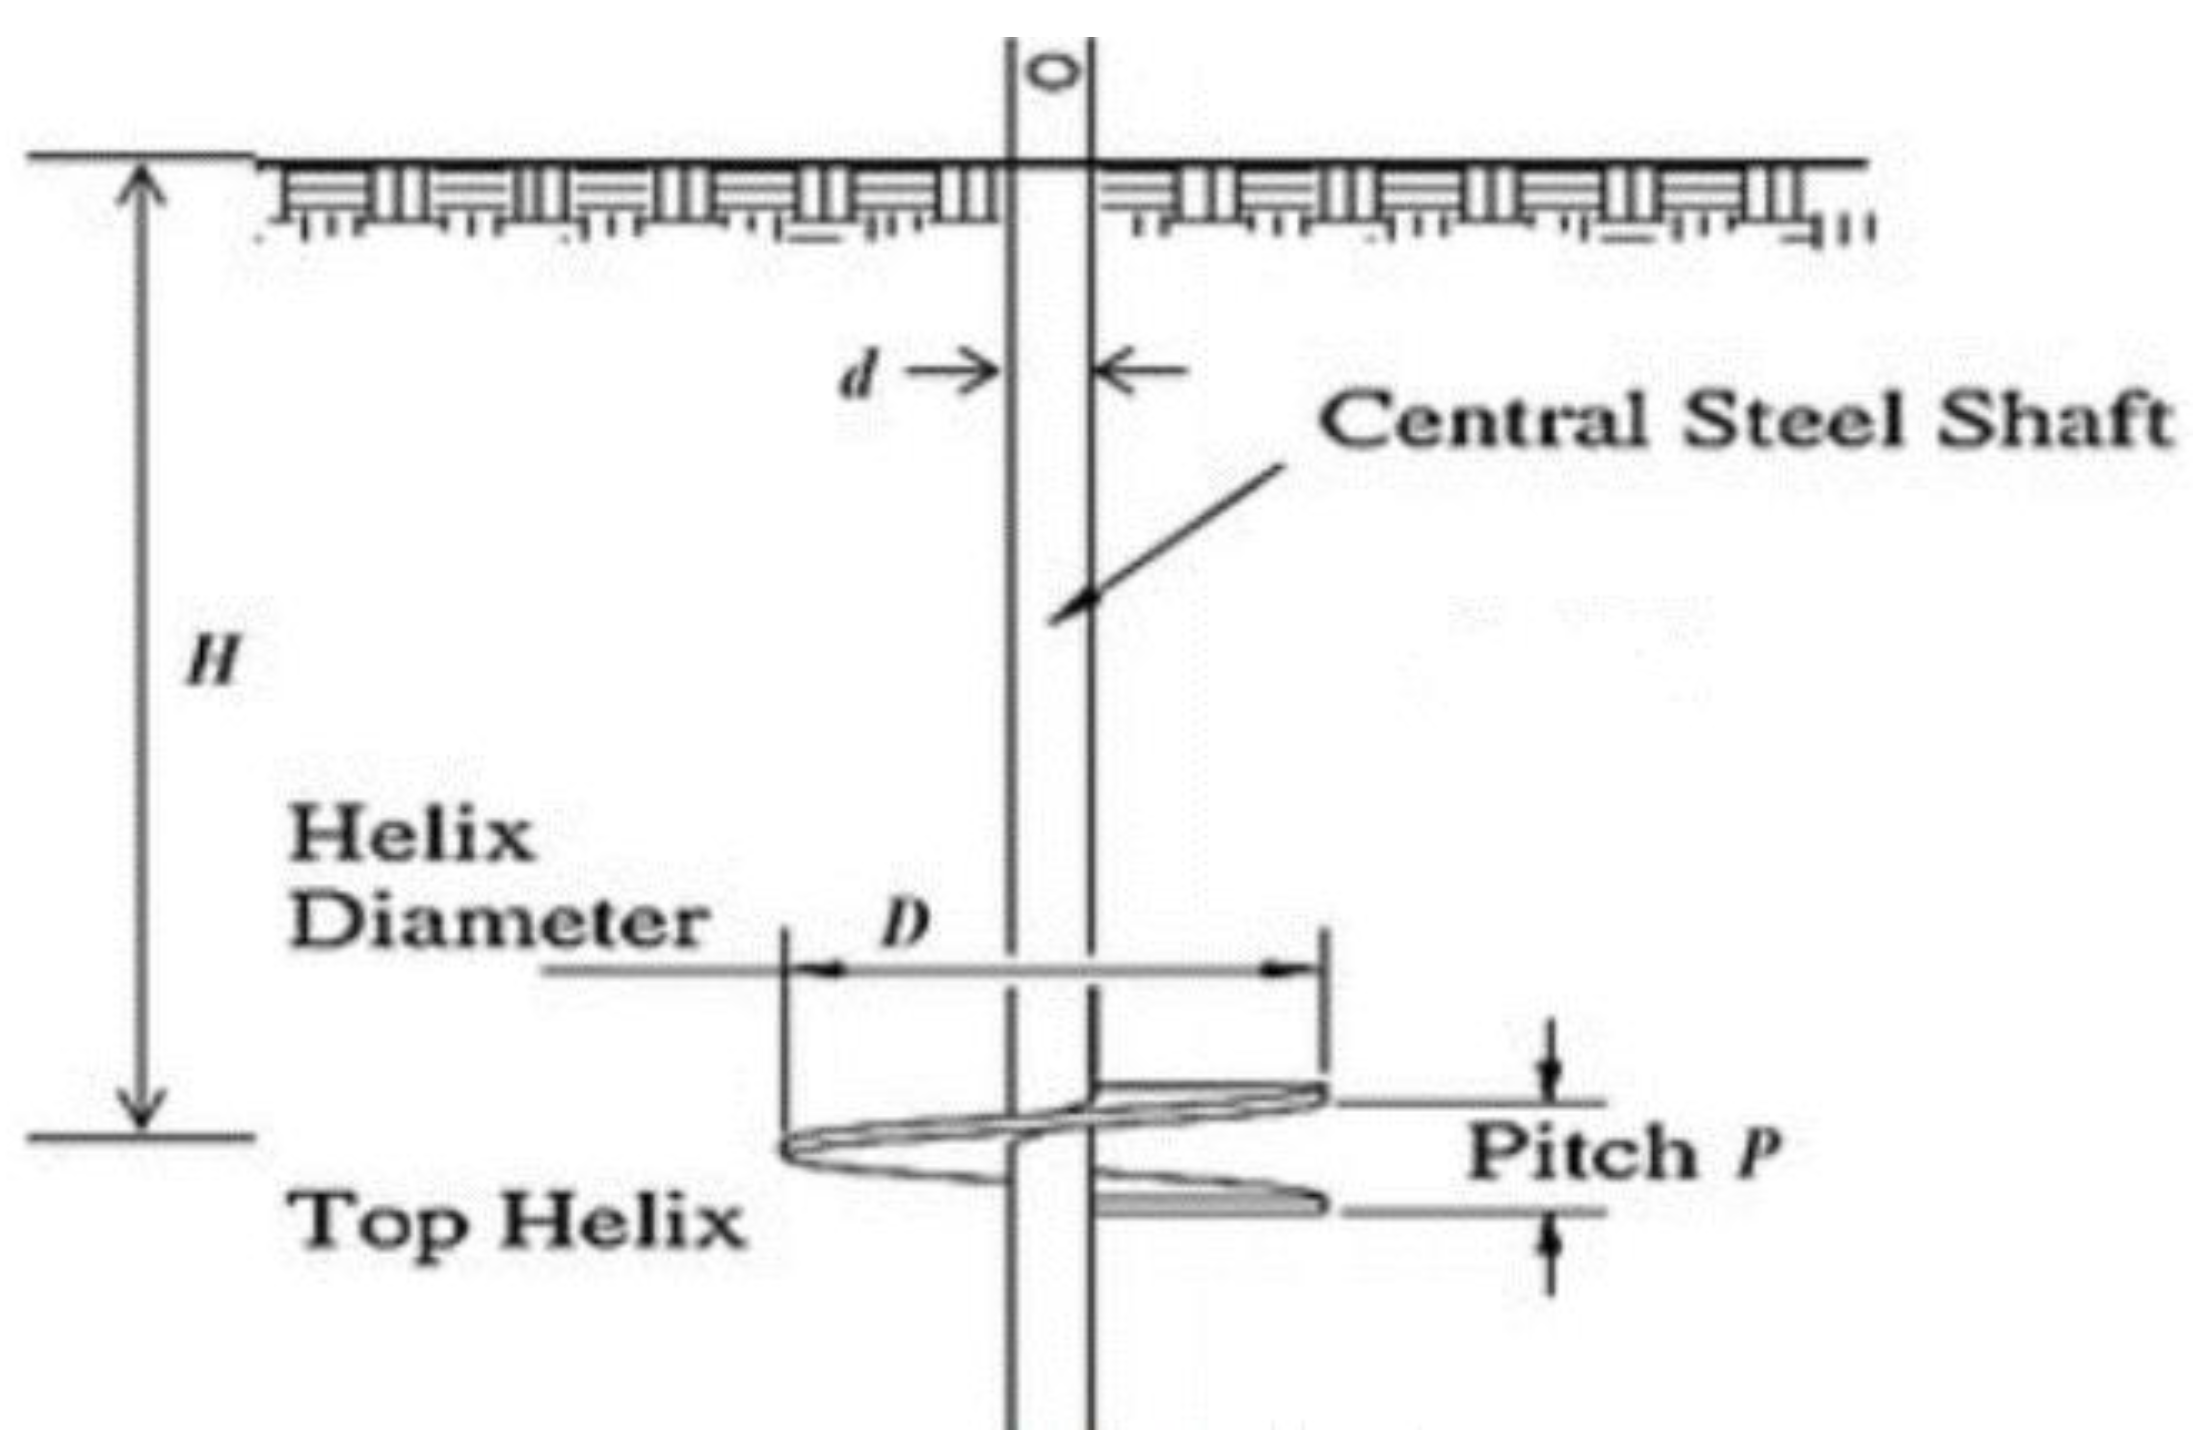
Figure 1 shows the descriptive diagram parameters used in
Table 2.
In contrast to other models, model 7 gradually applies a load to the model until the top of the wall changes to the permitted value of the regulation. This results in a different amount of load on the soil than other models.
2.2. Material Specifications
It should be noted that the main scales are not always practical and applicable due to constraints, which will be discussed further. Two Helical anchor and nailing systems are taken into consideration in this modeling and analysis under entirely identical conditions. In the Abaqus modeling, the excavation wall height is 80 cm, whereas in the actual excavation operation, the walls are 8 m high. After the excavation operation is complete, a top wall made of mesh network and shotcrete concrete is used in the two implementation methods of nailing and helical anchor systems. These walls typically range in thickness from 5 to 10 cm in reality, though this can vary depending on the soil type and other project-specific factors. A 5 cm thick concrete wall has been selected for the design and modeling of the final procedure. Materials that can provide the compressive and tensile strengths of shotcrete concrete as well as the tensile strength of the mesh network used in the excavated wall should be used for the design of the wall. In order to provide this feature, polymer derivatives were used. A compressed Teflon sheet that is fireproof (PTF) and has a compressive strength and high hardness of approximately 1 GPa is used in the numerical modeling.
Based on calculations in
Appendix A, it was determined that a 5 cm concrete wall in the real model is equivalent to a Teflon wall with a thickness of 1.5 cm in the software model for designing the wall thickness in numerical modeling with a laboratory scale of 1:10. Steel plates of a certain weight were used for loading in both models. In terms of soil moisture percentage, it was determined that the value during the experiments was equal to 10%. In modeling, the soil density was also set to 70% based on the characteristics of the soil, which will be covered in more detail. And in the designs, the heel of the wall was taken into account as the heel of the stuck wall. In the real model, holes with a diameter of 10 to 25 cm are used for the drilling design of the nailing system. For this model, holes with a 10 cm diameter served as the basis, and they were scaled down to a 1 cm diameter in a 1:10 ratio. The used strands’ diameter can range from 15 to 40 mm, and they can be made of a variety of materials and alloys. The strands used in the software modeling had a 15 mm diameter, which was converted to 1.5 mm by applying the modeling scale. In the real model, the nails are spaced apart by 150 to 300 cm and 100 to 250 cm, respectively. For the purposes of this simulation, the horizontal and vertical distances between the holes were set, as depicted in
Figure 2a.
We determined the nail length based on the required carrying capacity and the technical characteristics of the soil. Most of these designs shared similar implementation strategies and guiding principles. The regulations for the size and length of the bars in
Figure 2b suggested the following models.
Figure 2c also displays the spatial shape of the simulation element.
The diameter of the helix can range from 15 to 45 cm in accordance with American regulations and taking into account the circumstances and characteristics of the soil. So, using a scale of 1:10, 4.5 cm plates were used in this simulation.
The use of square and solid rods would improve the tensile performance of bracings, but since these materials were not available for this modeling, solid circular rods were chosen instead. Typically, square and curved sections of rods with diameters ranging from 1.5 to 4 cm are used. Iron wire with a 1.5 mm diameter was used in this simulation, scale-adjusted. Additionally, it is advised that the distance between two helical anchors be 2.5 to 3.5 times the diameter of helixes in relation to each other in order to comply with the current regulations regarding the distance of the helixes from one another. As a result, in the simulation, the ratio of the distance between the helix was taken to be roughly three times the helix’s diameter in length.
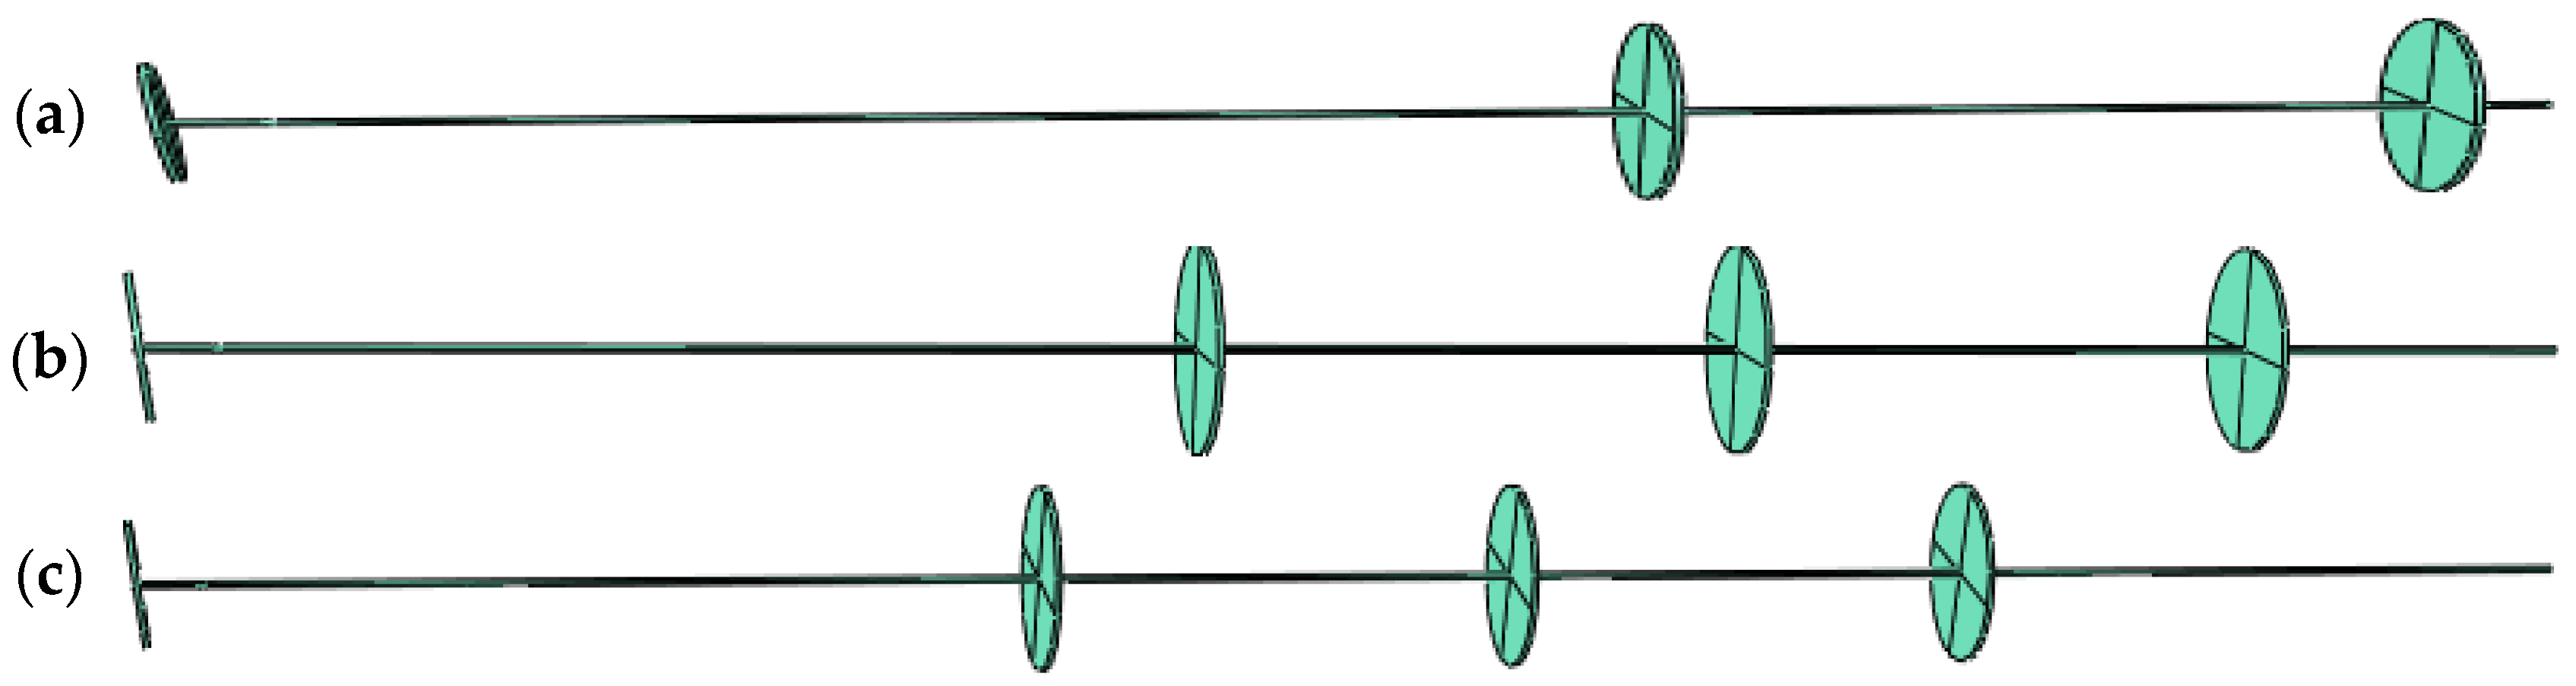
The helical bracing, the soil, and the guard structure make up the model’s three main components. In the experiment, three different types of helixes with lengths of 40, 60, and 70 cm were used. The rows were positioned in the soil at an angle of 10 degrees, with the bottom row being 40 cm long, the second row being 60 cm long, and the top two rows being 70 cm long. The soil in this model had the following measurements: 100 × 80 × 74 cm. Its geometry is shown in
Figure 2c, and
Table 3 lists the material properties of the soil.
The main rod’s diameter was 1.5 mm, its plates’ diameter was 4.5 cm, and their thickness is 1.5 mm. Three times the plates’ diameter, or 13.5 cm, separates them from one another. It has three dimensions, each 40, 60, and 70 cm in length. In
Figure 3, all three models are displayed.
2.3. Loading, Boundary Conditions, and Meshing
As can be seen, the horizontal distance between the helixes is 18.5 cm, and the vertical distance between them is 15 cm. The assembly model for this layout in Abaqus software is also presented in
Figure 4a.
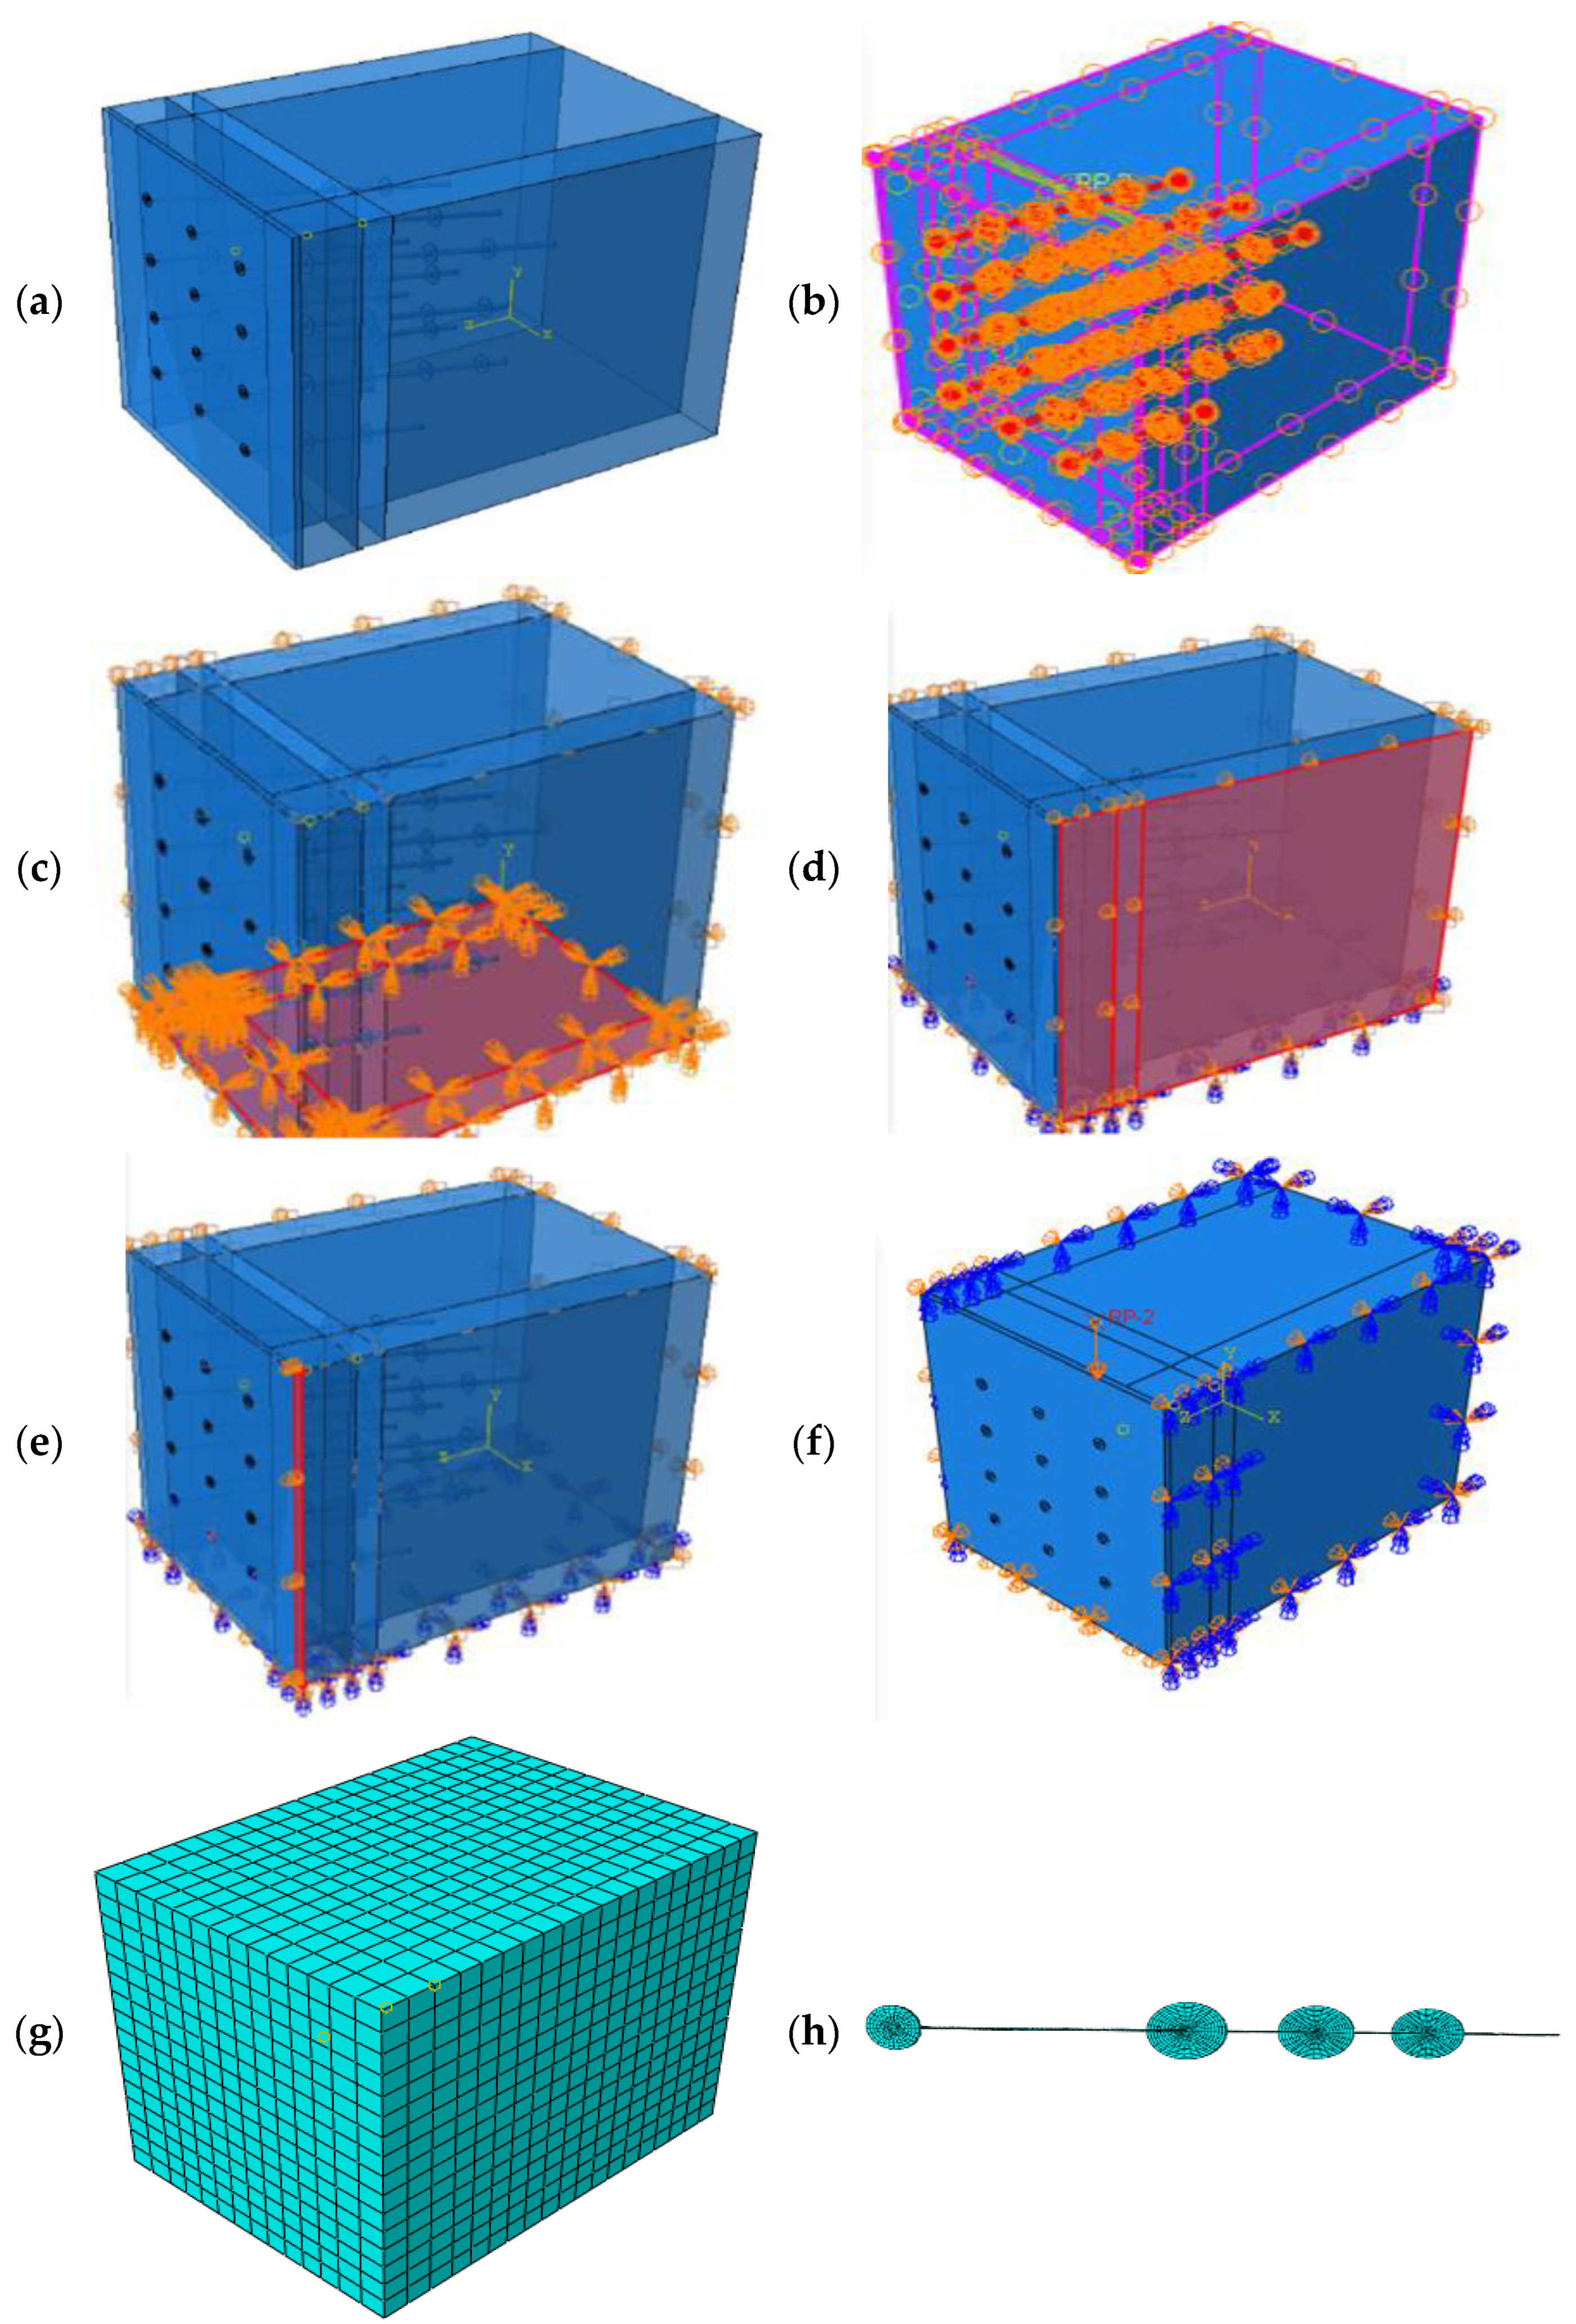
Given that the soil is modeled as a solid,
Figure 4b should be followed when placing the helical bracings in the ground and arming them. The next step is to ascertain the friction coefficient and contact properties on all surfaces after all helical bracings have been defined. Typically, 0.3 is thought to be the approximate value of the coefficient of friction between soil and other components. By choosing the General Contact type after calculating the friction coefficient, it is possible that the software will take into account contact wherever it exists in the models. The model’s loading and boundary conditions are established in this section. The lower portion of the soil is completely bound, as shown in
Figure 4c, in accordance with the type of model.
The upper surface of the soil is the only surface that is bounded and
Figure 4d depicts one of these walls. The upper and lower sides of the guard wall are tied vertically; the other degrees of freedom are left free.
Figure 4e represents how one of the surfaces has been bound. The final step involves applying the incoming load, whose maximum weight is 288 kg, to the soil as a point load at the location depicted in
Figure 4f. The model’s meshing section is then shown.
Figure 4g displays the mesh model for the soil, which has a granularity of 0.01 m (10 mm).
Figure 4h shows the meshing model of one of the helical anchors, which was produced using 0.0079 m as the mesh size. Finally, the meshing of the guard wall is appropriately considered.
4. Results and Discussion
In this section of the research, the results extracted from the modelling are presented. In the modelling performed by the Abaqus software, the changes and displacement of the pit wall are studied during the use of nailing and helical bracing. The helical model is divided into six different models, including changes in the number of helixes, the diameter of the helixes, and the gradual addition of load until reaching the permitted position change of the regulation. In this research, two basic models, including nailing and helical bracing, are used to stabilize the pit wall.
The results are analyzed in seven models; the main characteristics of each model are described below:
Nailing with a diameter of 45 mm and 3 helixes;
Helical anchor with a diameter of 15 mm and 3 helixes;
Helical anchor with a diameter of 15 mm and 4 helixes;
Helical anchor with a diameter of 40 mm and 3 helixes;
Helical anchor with a diameter of 40 mm and 4 helixes;
The combination of helical and nailing with a diameter of 45 mm and 3 helixes with an arrangement of one in between;
Helical bracing as a gradual increase in load permitted by the regulations with a diameter of 45 mm and 3 helixes.
Each model is modelled while taking into account the parameters, and the results are then saved in an Excel file. As a result, at the conclusion of the work, the effects of the change in the shape of the pit wall, capacity, and incoming energy have been compared.
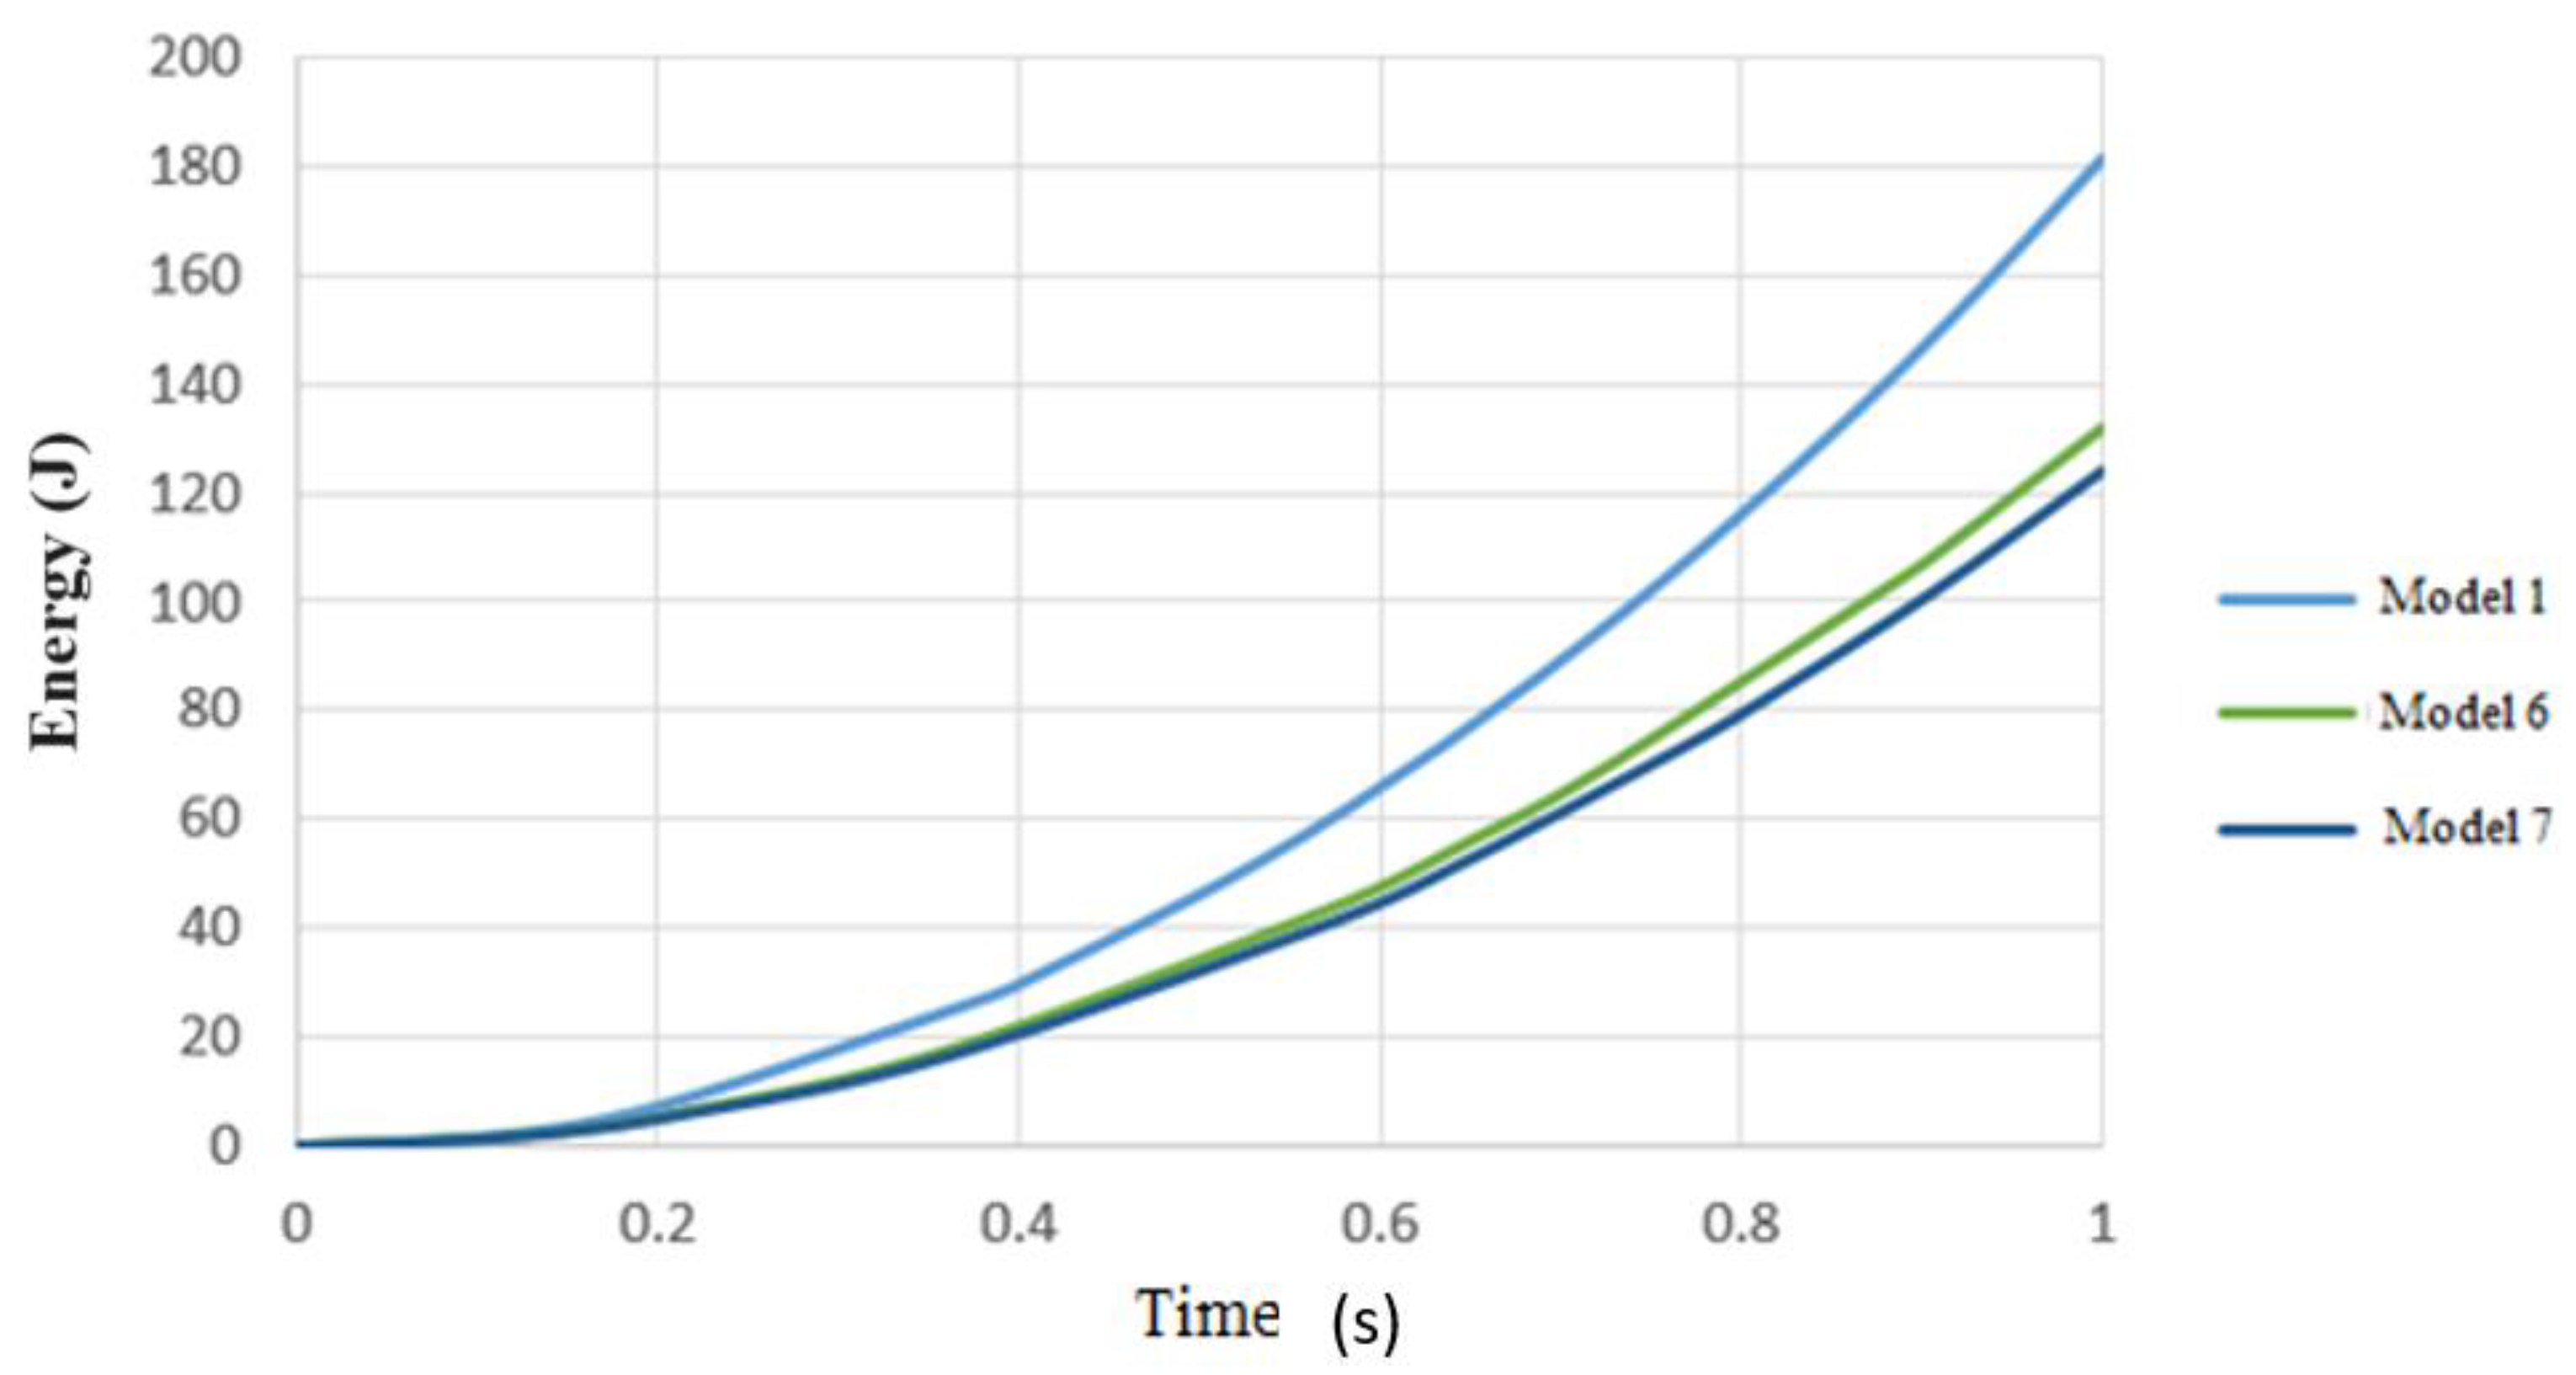
4.1. Type of Bracing
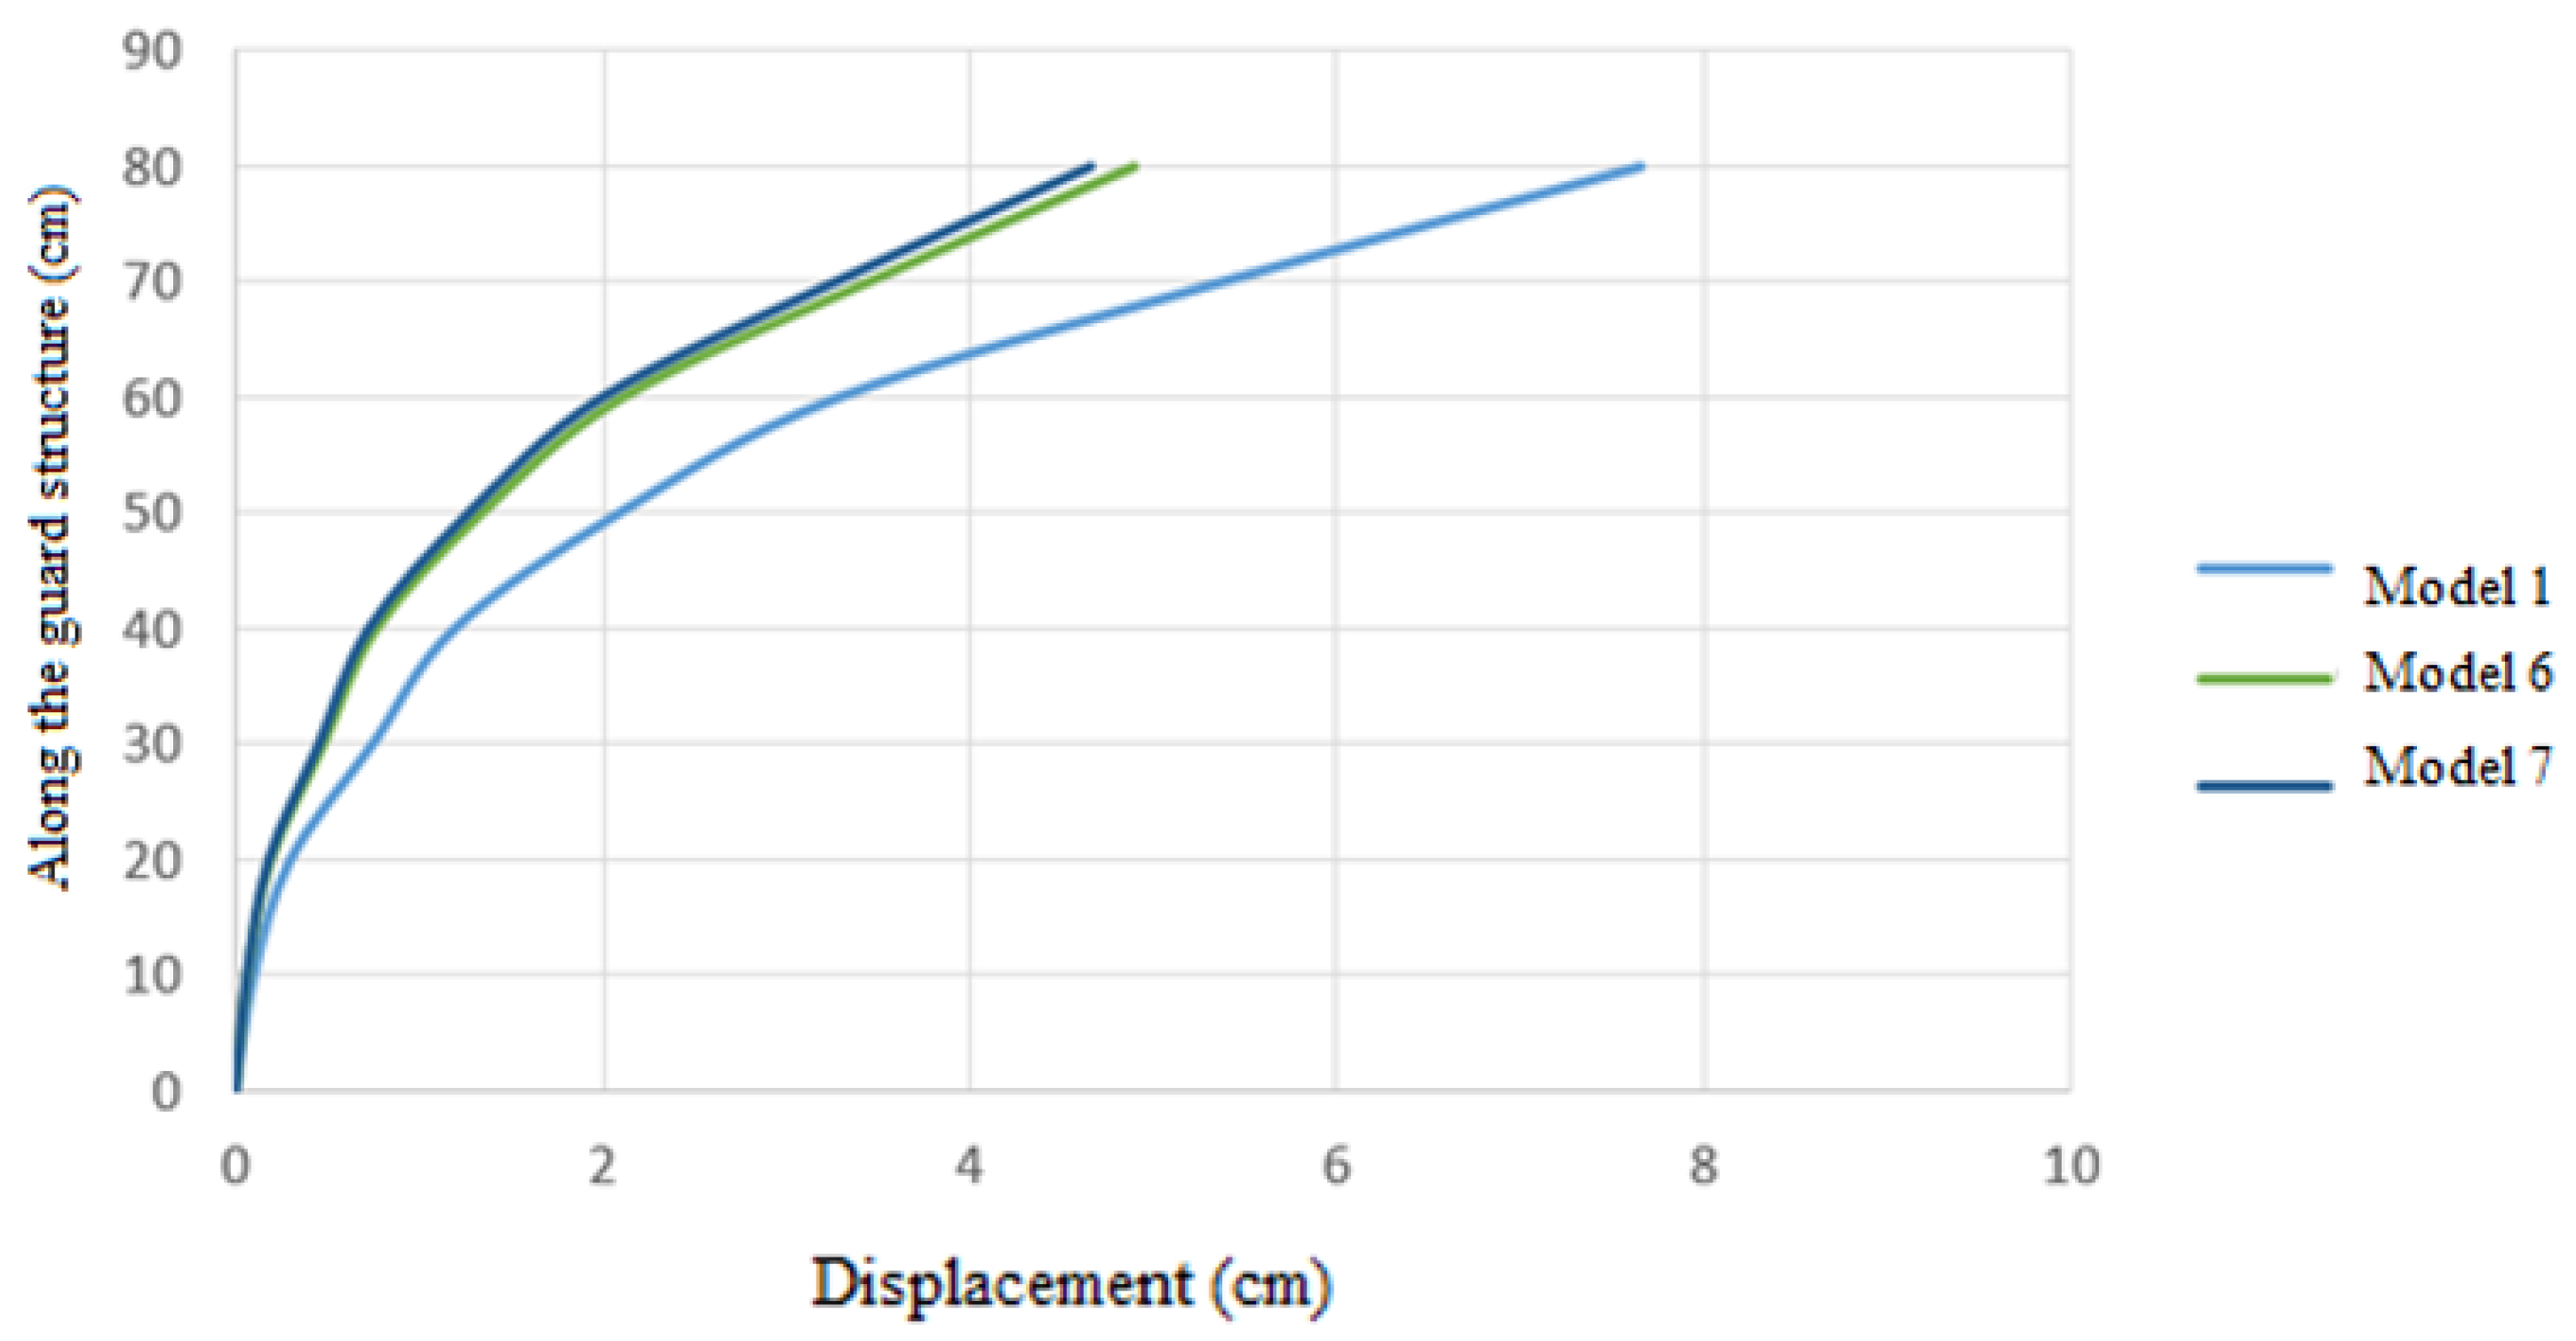
To study the impact of different bracing systems on embankment stability, models 1 (nailing system), 7 (bracing helical anchor system), and 6 (combined nailing and helical bracing system) are being compared in
Figure 6.
In
Figure 6, the displacement of the applied force for each of the models can be seen until the end of the analysis.
With a digging height of 80 cm and a horizontal displacement of the wall equal to 0.002 times that height, the allowable displacement is determined to be 0.16 cm. In order to establish the bearing capacity of the models according to the permissible displacement authorized by laws, it is essential to identify the force value that causes this displacement in the models, as seen in
Figure 7.
Figure 8 displays the wall displacement for each model. Model number 7 (3 to 35 mm helixes) experiences the least amount of wall displacement.
Figure 9 displays the energy input for each model taken from the software, indicating that model number one necessitates the most energy input.
Table 5 displays the maximum energy input, displacements, and bearing capacity for each model. The final conclusion will be drawn based on these statistics.
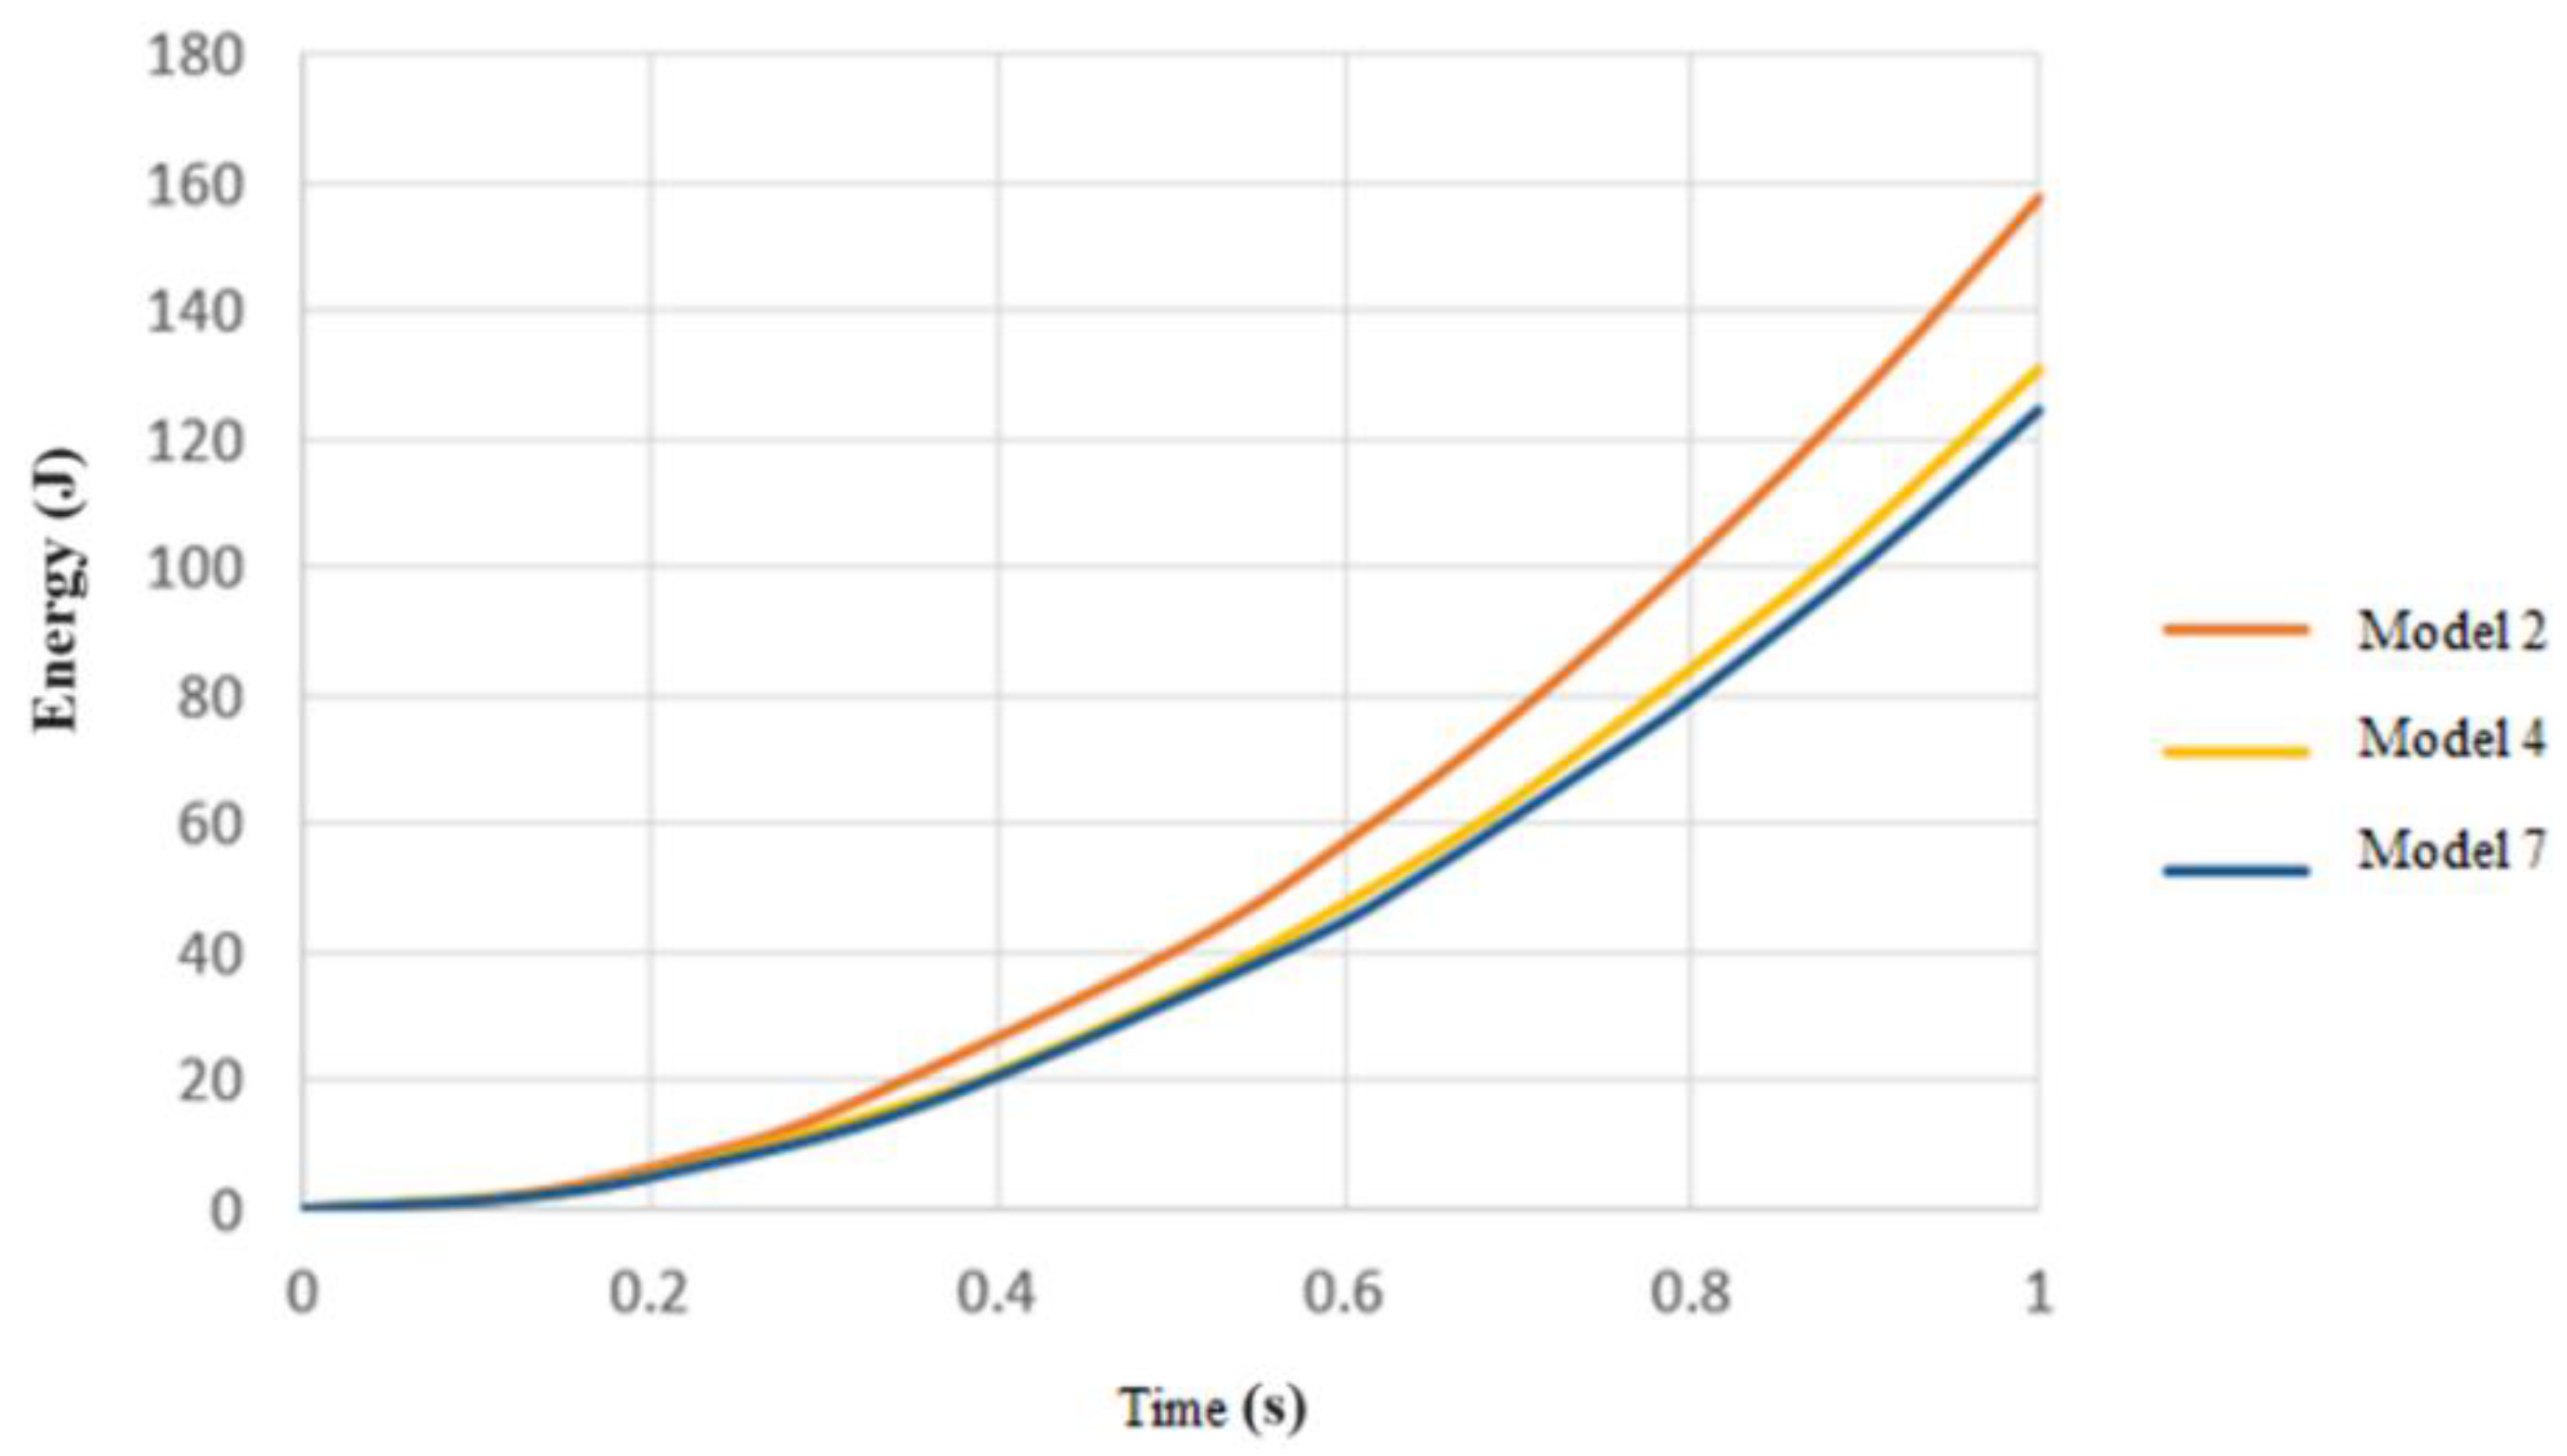
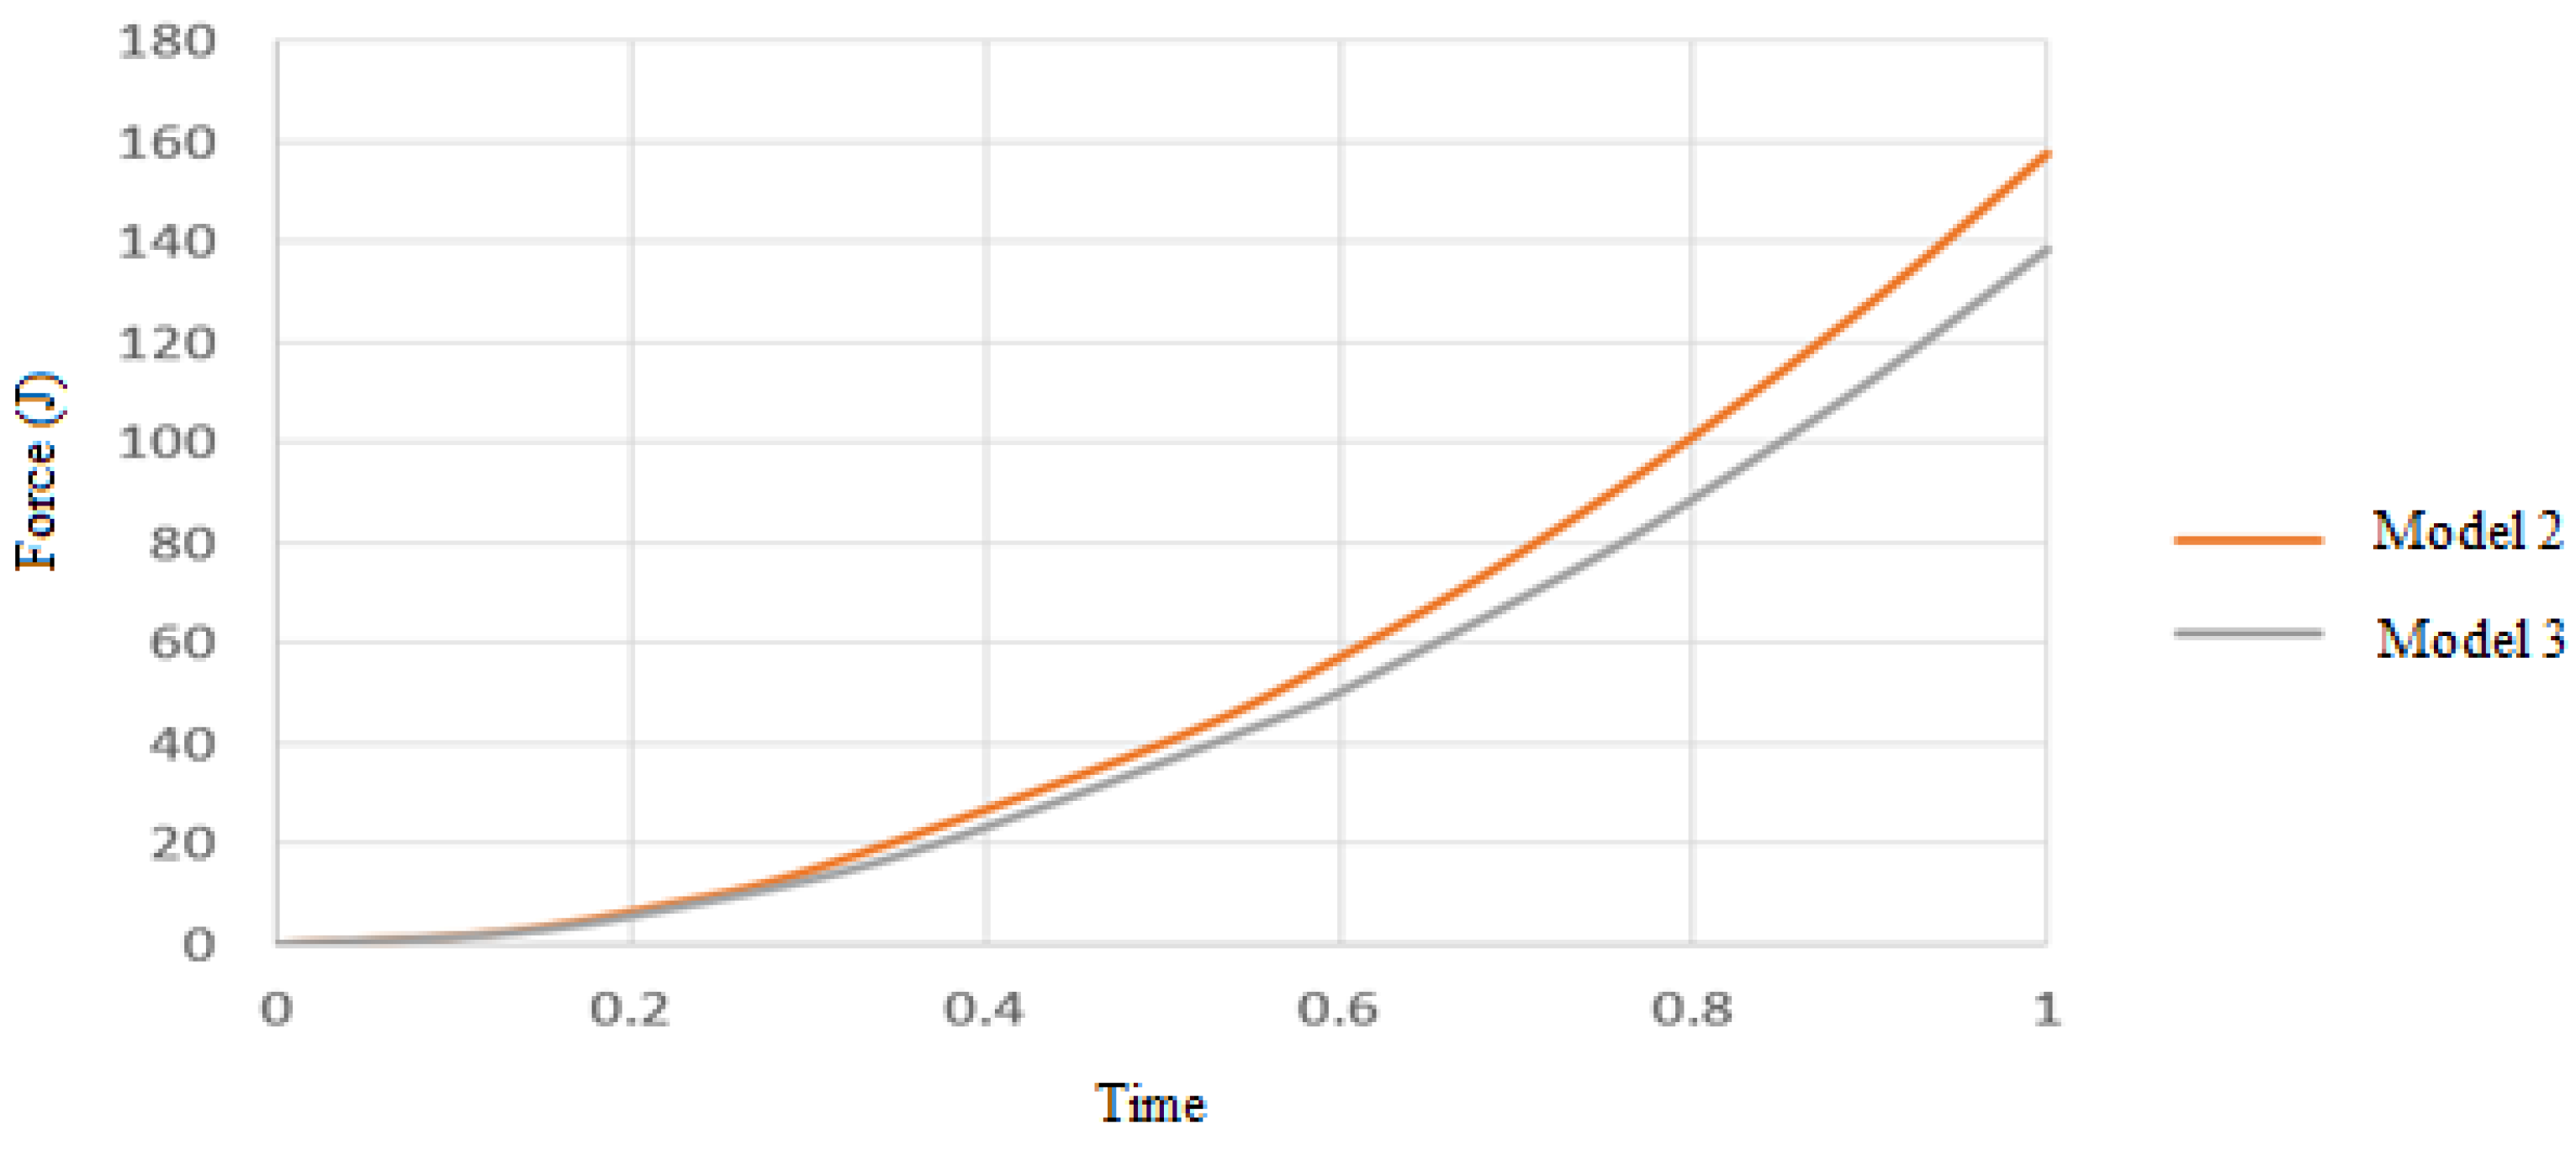
4.2. The Diameter of the Helixes
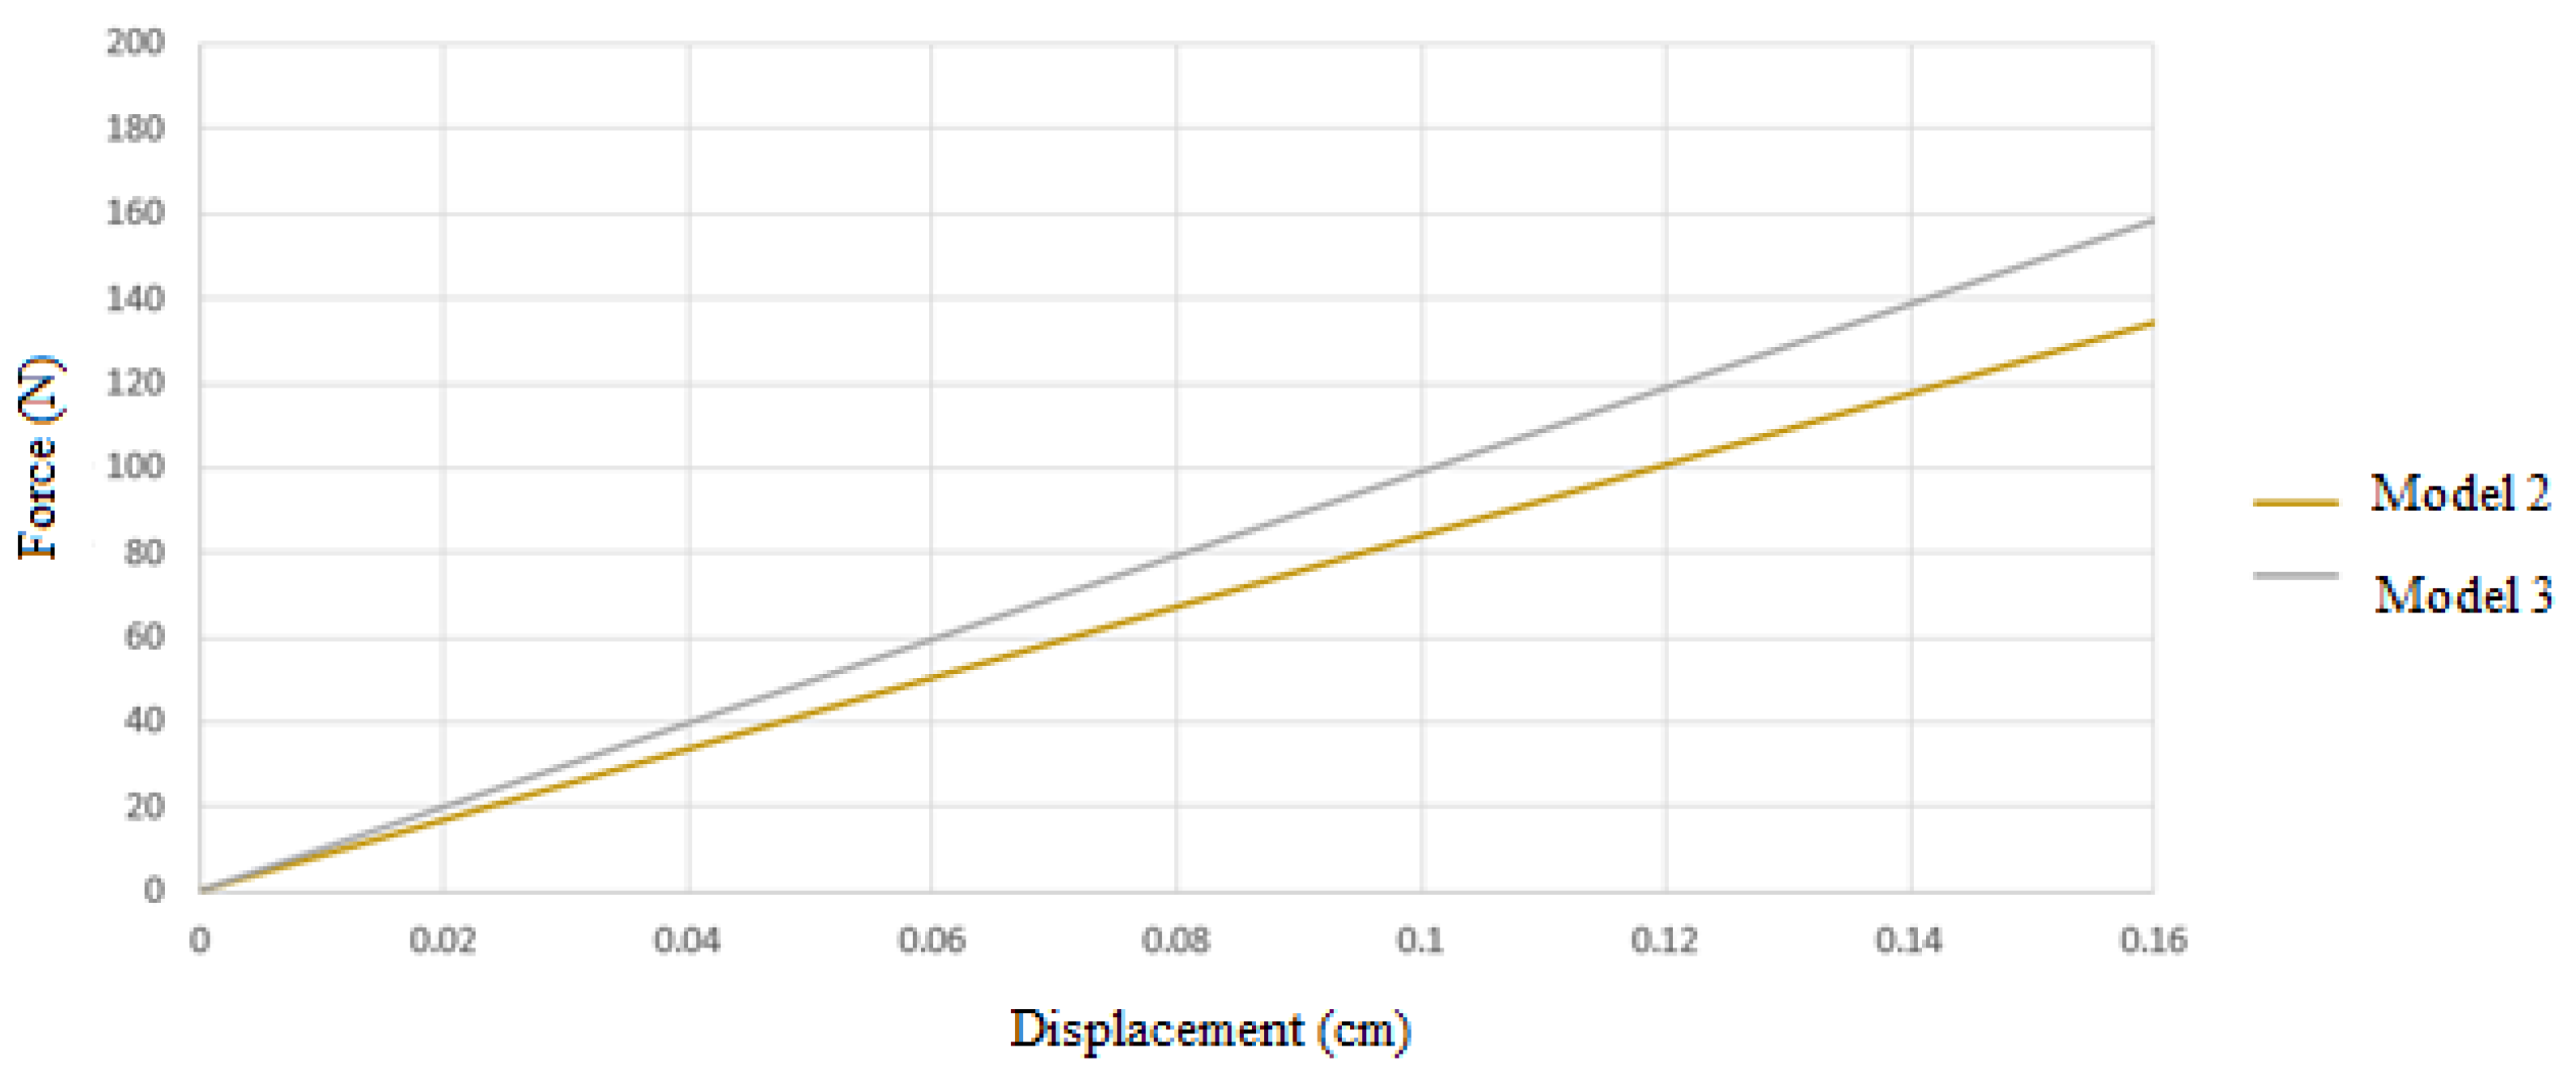
In order to check the effect of the diameter of the helix used in the helical bracing system, model number 2, which has a diameter of 15 mm, and model number 4, which has a diameter of 40 mm, and model number 7, which has a diameter of 45 mm, were compared with each other.
In
Figure 10, the displacement of the applied force for each of the models can be seen until the end of the analysis.
Considering that the amount of horizontal displacement of the wall is equal to 0.002 of the digging height and that the digging height is 80 cm, the allowed displacement is calculated as 0.16 cm. Therefore, by obtaining the amount of force that causes this displacement in the models according to
Figure 11, it is possible to calculate the bearing capacity of the models based on the permissible displacement of the regulations.
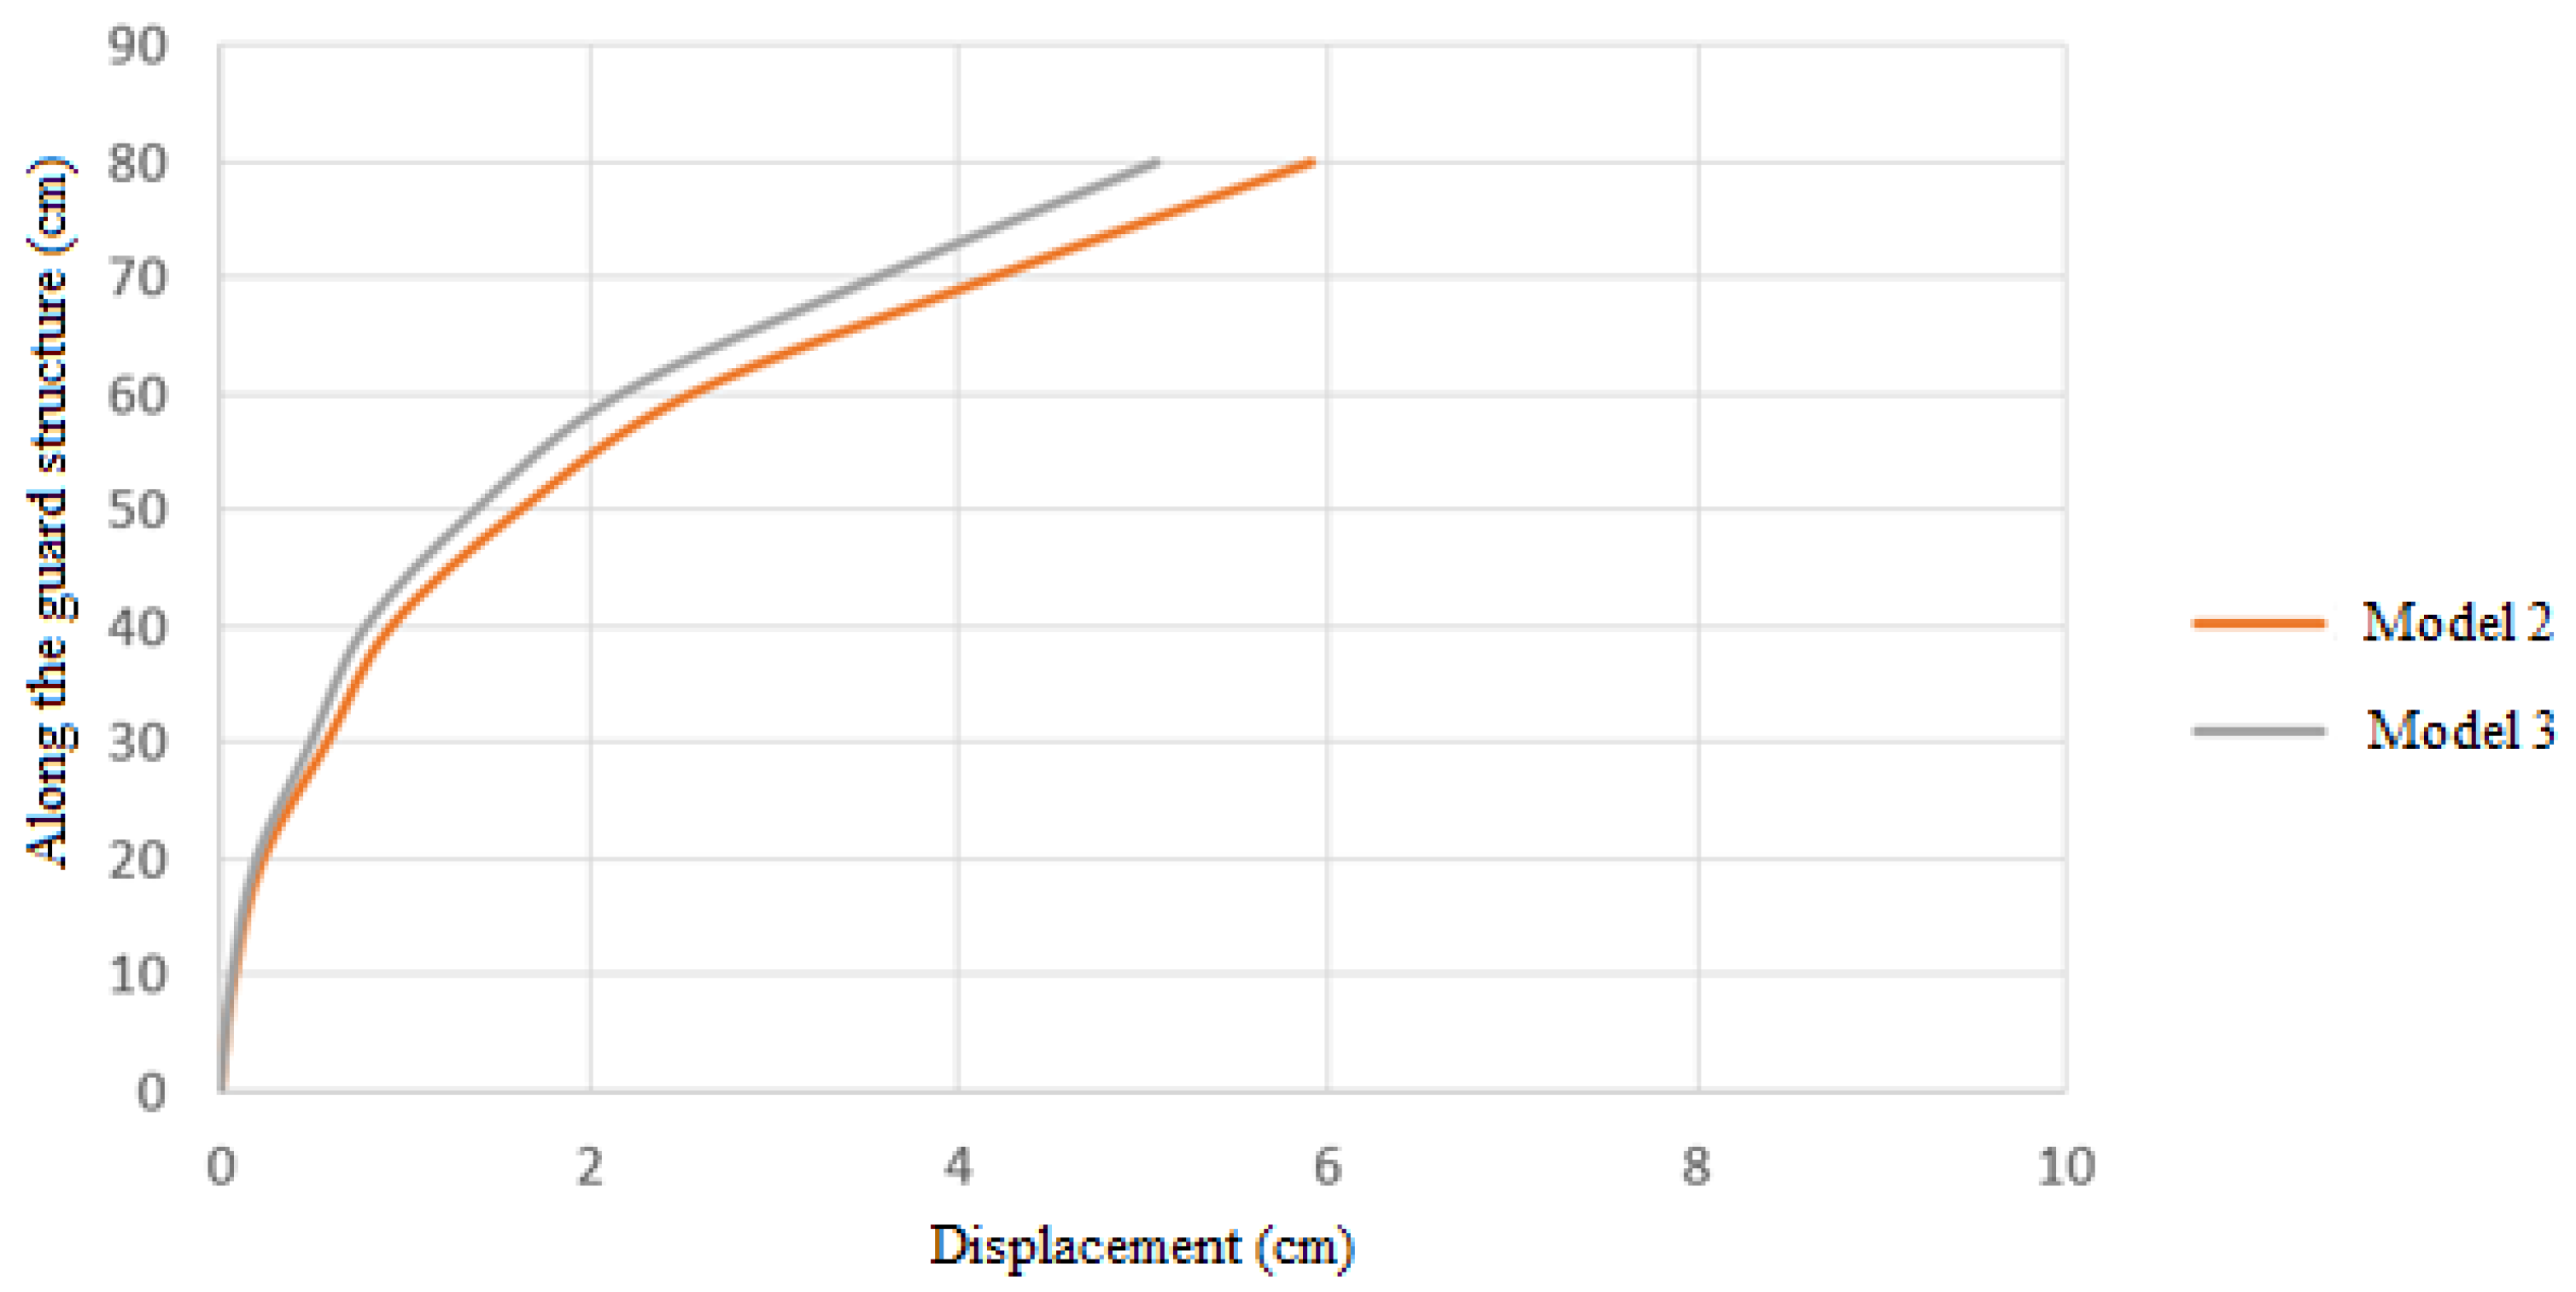
In
Figure 12, the displacement along the wall is shown for each of the models; according to the diagram, the lowest amount of wall displacement occurred in model number 7 (3 to 45 mm helixes).
In
Figure 13, the energy input to each of the models extracted from the software can be seen.
Table 6 provides data on the maximum energy input, displacements, and bearing capacity of each model, which will be used to draw the ultimate conclusion in the summary.
4.3. The Number of Helixes
In order to check the effect of the number of helix plates used in the helical bracing system, considering the constant consideration of the plate diameter, once for the plate diameter of 15 mm, model number 2, which has 3 helix plates, and model number 3, which has 4 helix plates, are compared with each other. Again, for the 40 mm plate diameter, model No. 4, which has 3 helixes, and model No. 5, which has 4 helixes, are compared.
4.3.1. Helixes with Diameter of 15 mm
For the case with helixes of 15 mm diameter, the results are as below.
In
Figure 14, the displacement of the applied force for each of the models can be seen until the end of the analysis.
Considering that the amount of horizontal displacement of the wall is equal to 0.002 of the digging height and that the digging height is 80 cm, the allowed displacement is calculated as 0.16 cm, according to
Figure 15. Therefore, by obtaining the amount of force that causes this displacement in the models, it is possible to calculate the bearing capacity of the models based on the permissible displacement of the regulations.
In
Figure 16, the displacement along the wall is shown for each of the models. According to the diagram, the lowest amount of wall displacement occurred in model number 3 (4 to 15 mm helixes).
In
Figure 17, the amount of energy input to each of the models extracted from the software can be seen.
In
Table 7, the maximum amount of energy entered into the structure, the displacements, and the bearing capacity of each model are presented, and in the summary of the results, the ultimate conclusion will be derived from these data.
4.3.2. Helixes with a Diameter of 40 mm
In
Figure 18, the displacement of the applied force for each of the models can be seen until the end of the analysis.
The permitted displacement is computed as 0.16 cm, taking into account that the wall’s horizontal displacement is equal to 0.002 of the digging height and that the digging height is 80 cm (according to
Figure 19). Therefore, based on the permitted displacement of the regulations, it is possible to compute the bearing capacity of the models by obtaining the amount of force that generates this displacement in the models.
In
Figure 20, the displacement along the wall is shown for each of the models. According to the diagram, the lowest amount of wall displacement occurred in model number 5 (4 to 40 mm helixes).
In
Figure 21, the amount of energy input to each of the models extracted from the software can be seen.
The maximum energy entered into the structure, the displacements, and the load capacity of each model are listed in
Table 8, and the conclusions that follow will be based on these data and the findings summary.
The existing model has been carried out in order to obtain a numerical analysis of the bearing capacity of helical and nailing through finite element modeling. In this way, the conclusion of the research is of great importance because it can be a foundation for solving the problems or improving the current situation and pave the way to a more optimized solution. Based on the available results, we can observe the effect of parameters such as the type of bracing system, the diameter, and the number of helixes. Based on this, in order to check the type of bracing system, models 1, 6, and 7 were used, and for the helical anchor system, compared to the nailing system, the bearing capacity, wall displacement, and energy input to the structure increased by 41%, 39%, and 31%, respectively.
For the helical and nailing combined restraining and bracing system, compared to the nailing system, the amount of capacity, wall displacement, and energy input to the structure increased by 38%, 36%, and 17%, respectively. Now, according to the comparisons made regarding the type of bracing system, the bracing helical anchor system performed better than other systems and improved the performance and capacity of the model.
In order to check the diameter of the helixes, model numbers 2, 4, and 7 were used, and according to the comparisons made, the helical anchor with a plate diameter of 45 mm performed better than other systems and improved the performance and capacity of the model. By changing the diameter of the plate from 40 to 45 mm, the capacity of the structure increased by 3.5%, and also, by changing the diameter from 15 to 45 mm, the bearing capacity of the structure increased by 23%.
The effect of the number of helixes on the structural responses was investigated in two cases; the first case was for a helical anchor with a helix diameter of 15 mm and 3 and 4 helixes. And the second model was the helical anchor with a helix diameter of 40 mm and 3 and 4 helixes. In both cases, increasing the number of helixes improved the performance and capacity of the model. In the first case, the increase in the bearing capacity was 18%, and in the second case, it was 13%.
The study’s results reveal the performance and effectiveness of two distinct deep excavation support systems: the nailing system and the helical anchor system. The behavioral variations across these systems offer vital insights into their structural features and operational mechanisms. The nailing system’s brittle and fragile behavior, along with its rapid upward deformations as it reaches the breaking point, emphasize the significance of comprehending the impact of injected concrete on its load-bearing capability. This trend indicates that the effectiveness of the nailing method could be affected by factors like the quality of concrete injection and soil adhesion. In contrast, the helical anchor system operates more softly, displaying steady upward deformations until breaking. The flexibility of steel helixes in the helical anchor system contributes to its overall performance against overhead loads, making it a promising option for deep excavation support. The comparative analysis reveals that the helical anchor system, particularly configurations with multiple helixes of larger diameters, outperforms the nailing system in terms of displacement and energy input. This underscores the importance of considering the design parameters and configurations when selecting the most suitable support system for a given excavation project.


 ,
, 


