Abstract
The structural performance of mid-rise buildings with a soft first story is a critical issue in earthquake-prone regions. This paper presents a detailed assessment of both the seismic performance and the structural reliability of a confined masonry mid-rise building with a soft reinforced-concrete first-story irregularity located in Mexico. This structure was designed according to outdated building codes to reflect construction practices that remain common in some parts of the country. Nonlinear dynamic analyses were conducted using ETABS v21. To simulate various seismic scenarios, ground motion records associated with return periods of 72, 475, and 975 years, respectively, were implemented. The results demonstrated that maximum inter-story drift is predominantly concentrated at the first story, exceeding the performance thresholds for immediate occupancy, life safety, and collapse prevention. Furthermore, a probabilistic performance assessment was developed considering the randomness of inter-story drift responses. Then, reliability index (β) was calculated for each seismic scenario. In all cases, β values remained consistently below the minimum recommended limit. These findings confirm the formation of a soft-story mechanism at the first level and are relevant for buildings designed under construction provisions like those used in the present case study.
1. Introduction
Structural irregularities are a key consideration in the seismic assessment of buildings, as they can significantly affect the distribution of lateral forces and the dynamic response under earthquake loads. Both in-plane and vertical irregularities may lead to localized stress concentrations and amplified inter-story drifts. Extensive research has shown that conventional lineal analysis methods often fail to fully capture these effects, while nonlinear static and dynamic approaches provide a more accurate representation of structural performance under seismic demands [,,].
Soft- or weak-first-story buildings are a common vertical irregularity in urban areas, typically featuring a ground floor with markedly reduced stiffness and strength due to large openings, while upper stories include confined-masonry walls that significantly increase lateral rigidity. This discontinuity concentrates seismic demands on first-story columns and has repeatedly led to severe damage or collapse during strong earthquakes [,,,,,]. These conditions highlight the need for quantitative assessments of the seismic performance and reliability of mixed/combined of hybrid RC-masonry systems, especially those designed under earlier seismic codes and still widely used. Furthermore, how seismic codes define and address these irregularities is crucial for their proper identification and evaluation, emphasizing the importance of revisiting design provisions for existing structures built under outdated regulations [,].
Seismic events have repeatedly caused severe damage or collapse in buildings with soft first stories, highlighting their vulnerability. Notable examples include the 1971 San Fernando earthquake (Mw = 6.6), where Olive View Hospital suffered extensive damage due to weak first stories and irregular configurations []; the 1985 Michoacan earthquake in Mexico City, which caused about 10,000 fatalities, with 8% of damaged RC building exhibiting vertical irregularities []; the 1986 El Salvador earthquake, affecting nearly 60,000 buildings with first-story failures due to floor stiffness differences [,]; the 2010 Maule earthquake in Chile, where diaphragm-type shear walls did not prevent weak-story failures []; the 2016 Manabí, Ecuador earthquake, where taller first stories increased flexibility beyond structural capacity, causing severe damage []; and the 2017 Mexico earthquake (Mw = 7.1), which resulted in 369 fatalities, over 300 severely damaged buildings, and 46 collapses, with around 50% of affected structures exhibiting weak stories, including some that had previously been retrofitted [,]. These cases demonstrate that significant stiffness and strength discontinuities at the first story amplify ductility demands, promote stress concentrations, and reduce structural reliability, underscoring the need for quantitative assessments of seismic performance in such buildings.
In addition to the seismic damage documented in past earthquakes, several retrofit strategies such as base isolation systems with curved surface sliders and lead rubber bearings, as well as buckling restrained based braces, have been shown to effectively reduce soft-story demands and improve the seismic safety of existing structures [,]. Although these mitigation measures lie beyond the scope of the present study, acknowledging their relevance reinforces the need for reliable assessment methodologies that can support future retrofit decisions.
Previous investigations documented failures of soft-first-story buildings and led to improvements in nonlinear modeling and reliability-based seismic assessment. Pseudo-dynamic tests on RC buildings with masonry infills assessed their impact on seismic behavior []. Comparisons between buildings with uniform infills and those lacking first-floor infills showed that the latter promoted a weak-story mechanism, increasing inter-story drifts and collapse risk []. This research analyzed force–deformation curves and proposed a method to estimate the minimum safety factor in order to prevent collapse, while [] developed an innovative model using frame and link elements to simulate lateral collapse of soft-first-story buildings. This approach allowed for efficient dynamic analysis by reducing the computational demand and avoiding unnecessary growth in the stiffness matrix as link elements increased. Although the results were reasonable, the absence of experimental data limited full validation, highlighting the need for further studies to confirm the model’s accuracy. Additionally, ref. [] showed that preliminary seismic risk assessments are crucial for identifying soft-first-story buildings, where concentrated seismic demand increases collapse probability, as evidenced by their pushover analyses. Similarly, ref. [] analyzed soft-first-story buildings affected by the 2017 Mexico City earthquake. Four-, six-, and eight-story structures designed under 1970s and 1980s codes were evaluated using nearby recorded accelerograms, showing that first-story drift and rotation demands matched observed damage; over 50% of the collapsed buildings had this typology on soft soil. A limitation was assuming elastic masonry walls. Additional numerical studies on four- and eight-story reinforced-concrete frames designed to modern codes, using nonlinear static and incremental dynamic analyses, showed increased drift capacity and reduced collapse probability. Model calibration enhanced result accuracy, supporting more realistic assessments of soft-first-story behavior []. A comparison of buildings designed under the 2017 and 1976 Mexico City codes [,], using records from the 2017 Puebla-Morelos earthquake, was presented in []. The 2017 code improved drift distribution, prevented concentration at the first story, and delayed soft-story mechanisms. In contrast, buildings designed with older provisions showed greater vulnerability, consistent with post-earthquake observations. Calibrated numerical models improved the accuracy of the seismic behavior assessment and confirmed the increased resilience provided by the updated code. Ref. [] evaluated reliability indices of soft-ground-floor buildings using models of structures heavily damaged in the 2017 earthquake. Three-, five-, and eight-story buildings were analyzed with 45 recorded accelerograms. The original structures showed large displacements and low reliability indices, especially the five-story buildings, consistent with observed damage. The study underscores the need for seismic retrofitting and notes that the findings apply specifically to the examined buildings, as results may vary in regions with different seismic conditions and construction practices. In [], soft stories, defined as having about 70% less stiffness than upper levels, were identified as highly vulnerable, potentially leading to severe damage or collapse when columns are weak. The results also indicate that soft stories located at higher levels show greater stiffness and significantly improve the building’s seismic performance.
Despite extensive studies on soft-first-story buildings, their structural reliability remains insufficiently explored, particularly for mid-rise structures with a soft reinforced-concrete first story and confined-masonry walls above, a configuration rarely analyzed. This work addressed that gap by evaluating the seismic reliability of a representative building using a nonlinear dynamic model in which masonry walls are represented through a wide-column approach calibrated with experimental data to capture shear-dominated nonlinear behavior. This study implements an extended probabilistic framework that estimates the reliability index across several performance limits and three seismic hazard levels, using multiple probability density functions and goodness of fit criteria. This provides a practical methodology applicable to buildings commonly constructed under outdated seismic codes, offering a straightforward yet robust means to determinate whether such structures meet acceptable safety levels. By quantifying inter-story drift demands and reliability indices under region-specific ground motions, this study raises a central question: to what extent do past seismic design provisions affect the current safety of these buildings, and how can a simplified probabilistic approach guide retrofit decisions and risk mitigation in earthquake-prone regions?
2. Case Study: Confined Masonry Building with a Soft Story in the First Level
The selected case of study in this paper is a five-story structure with a regular floor plan configuration. However, the structure presents a vertical irregularity due to a sudden change in stiffness and strength between the first and upper stories. Such an irregularity in the structural system consists of reinforced-concrete moment frames at the first story and confined-masonry walls in upper floors. The ground level is designated for vehicle parking, while the upper stories are intended for residential use. This structural configuration is representative of numerous buildings in seismic-prone regions, where soft first stories are commonly employed for functional and architectural reasons. To better illustrate these characteristics, Figure 1 and Figure 2 present the building’s floor plan and elevation view, respectively, offering a detailed representation of its geometric and structural features.
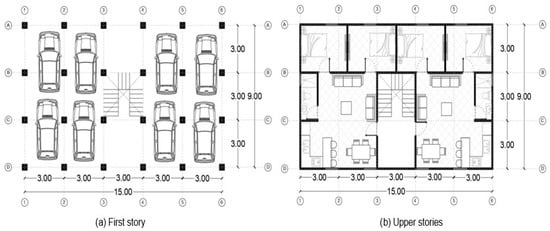
Figure 1.
Structural plan distribution of the building at the first story and upper stories (Dimensions in meters, m).
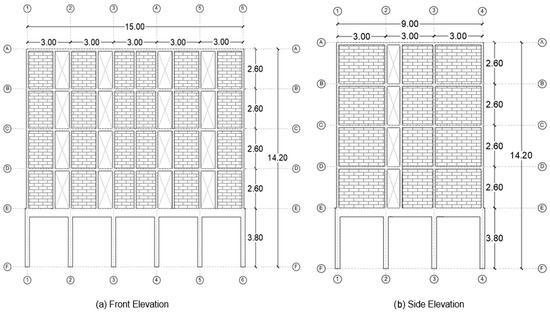
Figure 2.
Front and side elevations of the case-study building (Dimensions in meters, m).
The selected case study has been chosen as a representative benchmark because it exemplifies a structural typology commonly found in seismic-prone regions, where open ground floors are combined with confined masonry upper stories. Many mid-rise buildings in these areas exhibit similar soft-first-story conditions and were designed under older seismic codes, making them potentially vulnerable to earthquake-induced damage. As such, this building provides a realistic scenario to assess the seismic performance and reliability of soft-story structures, allowing the results to be applicable to a winder class of comparable buildings.
The mid-rise building under consideration is in Acapulco, Guerrero, in southwestern Mexico, a region of high seismic activity due to its proximity to the Pacific Ring of Fire. The seismicity in this area is primarily driven by the subduction of the Cocos Plate beneath the North American Plate, a process that has historically generated large-magnitude earthquakes in Mexico []. According to Mexican seismic regulations, Acapulco is classified within seismic zone D, the highest seismic hazard category in the country []. The structural analysis was conducted using a three-dimensional model developed in the commercial software ETABS v21 [], assuming firm soil conditions. The reinforced-concrete beams and columns were modeled as frame elements with linear elastic behavior, consistent with the modal response spectrum analysis carried out in this stage of this study. The linear behavior of the confined-masonry walls was modeled using the wide-column method, following the approach presented in []. This method was chosen because it allows for the representation of shear-dominated behavior in the walls, incorporates the contribution of adjacent boundary columns, and ensures proper connectivity with other structural elements through the use of rigid horizontal links. The wide-column element is placed at the centroid of the wall, with the transformed areas of the boundary columns included to accurately capture the section properties. Figure 3 shows the structural model, where the panels correspond to wide-column elements visualized in extruded view for clarity. Additionally, the floor system was modeled as a rigid diaphragm to ensure the appropriate distribution of lateral forces. A detailed description of the nonlinear components, needed only for the subsequent time-history analyses, is provided later in Section 4, where the plastic hinges and other inelastic features are introduced.
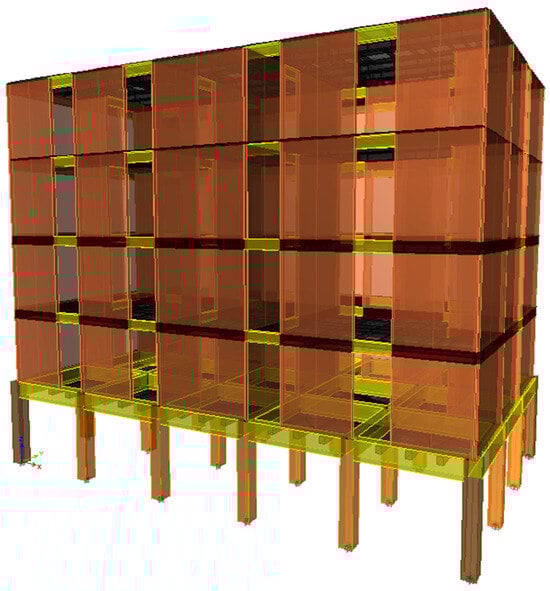
Figure 3.
Three-dimensional structural model of the building.
The structure was originally designed in accordance with the Manual of Civil Structures Design, Earthquake Design of Federal Electricity Commission (MDOC-CFE in Spanish) [], as well as the Mexico City Building Code and its Complementary Technical Standards for the Desing of Masonry Structures and Concrete Structures []. The structural design did consider a seismic behavior factor of Q = 2, with an additional reduction factor applied due to vertical irregularity. In accordance with [], structures that do not meet regularity conditions must employ a reduced seismic behavior factor Q’, obtained as Q times 0.8, to account for ductility effects in the seismic forces. Consequently, the seismic design forces increase due to the penalization of structural irregularity. However, the displacements obtained with Q’ are multiplied by Q to obtain the actual displacements. Figure 4 illustrates the spectrum adopted for the design. Following these design criteria, the cross-sectional dimensions of the structural elements were determined and are summarized in Table 1.
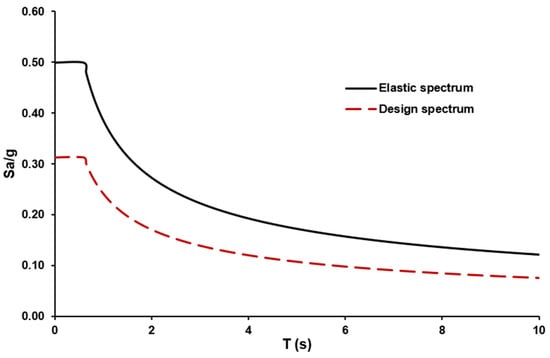
Figure 4.
Seismic design spectrum for the building.

Table 1.
Dimensions of structural elements.
3. Seismic Ground Motions
For the nonlinear dynamic analyses of the building, a total of 66 pairs of ground motion records were selected, comprising 22 pairs for each of the two principal horizontal directions of the structural model. These records are grouped into three intensity levels, corresponding to seismic hazard levels with return periods of 72, 475, and 975 years. Each return period is probabilistically associated with a specific performance level: Immediate Occupancy (IO), Life Safety (LS), and Collapse Prevention (CP), respectively. The relationship between return periods and performance levels is summarized in Table 2.
Table 2.
Return periods associated with structural performance objectives [].
The selection process for ground motion records began with the definition of probabilistic target spectra corresponding to the three considered return periods, which are specifically constructed for the location where the structure is situated (Acapulco, Mexico). A database containing approximately 20,000 historical earthquake records from Mexico was used, most of which were recorded in the southwestern region by the Institute of Engineering of the National Autonomous University of Mexico and the Center for Scientific Research and Higher Education of Ensenada (CICESE, in Spanish). A key step involved converting the original acceleration time histories into response spectra, considering the simultaneous action of the two orthogonal horizontal components of the seismic input. Equation (1) was used to combine the spectral ordinates of both components and generate a single representative spectrum, in accordance with three-dimensional modeling approach employed in the nonlinear dynamic analyses, following the current Complementary Technical Standards for the Seismic Design of Mexico City []. As part of the procedure, the selected records were processed using Equation (2) by applying the geometric mean spectral acceleration ratio (Saavg) [] and were scaled using the geometric mean scaling factor (see Equation (3)), within the period range 0.2 T1 to 2.0 T1, where T1 is the fundamental period of the structure. For the analyzed building, T1 was 0.47 s, calculated as the average of the two principal horizontal directions. Table A1, Table A2 and Table A3 present the characteristics of the 66 selected pairs of ground motion records for return periods of 72, 475, and 975 years, respectively (See Appendix A). In addition, the duration of the selected accelerograms was shortened using the Arias Intensity method, aiming to obtain a 5% to 95% interval, representing the period of greatest intensity of the ground motion records [].
where is the ordinate of the spectrum compared with the probabilistic spectrum, and and are the spectral ordinates corresponding to the pseudo-acceleration spectra of the two individual horizontal components of the candidate seismic ground motions, expressed as a fraction of gravity.
where is the number of vibration periods considered.
where ) denotes the spectral acceleration of the target spectrum at period , and corresponds to the spectral acceleration of the selected spectrum at same period.
4. Nonlinear Modeling
Nonlinear dynamic analyses were conducted using ETABS v21 software [], based on a three-dimensional structural model. The wide-column approach, previously adopted for the linear analysis, was used to represent the confined-masonry walls in the upper stories. This method allows for the incorporation of shear hinges and concentrated plasticity at the center of the wall, reproducing the inelastic behavior observed experimentally. The approach follows established guidelines defining the transformed cross-sectional area, shear areas in parallel and transverse directions, moments of inertia, and torsional rigidity, thereby accounting for the contribution of adjacent reinforced-concrete tie columns. Although a macro-element model could capture local wall response with greater detail, its implementation in ETABS v21 is considerably more complex and requires specialized software for full calibration. Furthermore, only a limited number of studies have adopted the wide-column methodology for mid-rise buildings with reinforced-concrete moment frames in the first story and confined-masonry walls above, yet those applications have demonstrated that this approach provides a reliable representation of the global structural response under seismic loading.
In the ground story, where soft-story mechanisms are critical, plastic hinges of type P-M2-M3 with fiber-section models were assigned to all columns to accurately capture the nonlinear interaction between axial load and biaxial bending []. Beam elements were assigned M3 hinges to represent flexural plasticity []. Concrete nonlinear behavior was defined using the Mander stress–strain curve with kinematic hysteresis to represent its cyclic response. In the upper stories, the confined-masonry walls, already represented as wide columns, were assigned shear-dominated plasticity using hinges calibrated from experimental data. The nonlinear behavior followed the approach proposed by [], using geometric and material properties obtained from a reserved cyclic loading test on a concrete block masonry wall []. To ensure a shear-governed failure mechanism and avoid unrealistic flexural deformation, a rigid beam with infinite stiffness was introduced at the top of each wide-column element. Table 3 summarizes the mechanical properties used in the model, and Figure 5 illustrates the idealized wall configuration.
Table 3.
Mechanical properties of the materials (Mpa units) [].
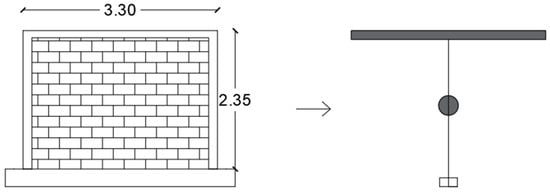
Figure 5.
Idealized model of the masonry wall (Dimensions in meters, m).
The masonry wall tested under reversed cyclic loading provided displacement data used to simulate its nonlinear behavior analytically. A nonlinear dynamic analysis was performed using the displacement history obtained from the experimental test, allowing for accurate reproduction of the observed hysteresis cycles. The hysteretic response was modeled using the Pivot model, whose calibration parameters (α1, α2, β1, β2 y n) allowed for a realistic representation of stiffness degradation and energy dissipation, which are key aspects of masonry behavior under seismic demands. Table 4 presents the shear force–deformation hinge parameters and the final Pivot model coefficients obtained through sensitivity analysis. Figure 6 illustrates the applied displacement history and the comparison between the experimental and numerical hysteresis loops. This calibrated behavior was incorporated into the masonry walls of the building model. However, a limitation of this study is that the actual structure includes walls with different lengths, and no experimental data are currently available for those specific geometries. Although this limitation is acknowledged, the implemented calibration provides a suitable approximation of the nonlinear response of the masonry walls, as it was based on the formula for the maximum shear strength (VmR) established in the Complementary Technical Standards for Masonry Construction []. This approach allowed for an appropriate adjustment of the shear capacity of each wall according to its specific length within the structure. It also acknowledged that more elaborate calibration schemes exist, such as the framework presented in [], which offers a highly detailed procedure for characterizing masonry nonlinear behavior. Although such approaches provide increased resolution at the material and component level, they could also support a more refined calibration of the confined-masonry walls represented as wide-column elements in the upper stories of the reinforced-concrete frame system. Nevertheless, the level of detail required for that type of calibration falls beyond the scope of the present paper.
Table 4.
Shear force–deformation hinge and Pivot hysteresis model parameters.
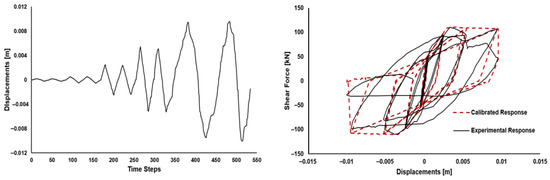
Figure 6.
Displacements history and calibrated hysteresis response of masonry wall.
Force SF and Disp SF are reference shear force and displacement, respectively, used to normalize the force–deformation behavior of the hinge. The parameters defining the hysteresis response (points −E to E) are expressed as dimensionless ratios with respect to these reference values.
5. Structural Performance
5.1. PBSD Methodology
The Performance-Based Seismic Design (PBSD) methodology is an iterative process that begins with the definition of performance objectives associated with a specific seismic hazard level. This is followed by estimating the forces and deformations generated by an earthquake in the structure and its components through a detailed analysis, preferably non-linear. Finally, the performance of the structure is evaluated both globally and locally to ensure that the established objectives have been met []. The PBSD approach aims to predict and assess building performance in a realistic and reliable manner []. The application of PBSD surpasses traditional methods based on prescriptive specifications, as it requires the structure to perform as expected under different seismic intensities in a probabilistic manner. Additionally, this approach seeks to provide a clear understanding of the risk of structural damage and repair costs, which contrasts with conventional codes that only aim to ensure the necessary strength to prevent collapse. However, the implementation of PBSD remains limited due to the complexity in design. For this reason, it is mainly used in high-priority buildings or in structural systems with uncertainty in their performance [].
PBSD is not only used in design processes but is also effective as a seismic assessment method. This evaluation approach allows for the analysis and determination of whether a building meets the established seismic performance levels under different seismic intensities based on its actual behavior in response to seismic demand []. The engineering process of evaluation using the PBSD philosophy is a crucial step towards resilience. Evaluating the structural behavior of buildings is essential, particularly for those located in high-seismic-risk areas or those presenting structural uncertainty, such as buildings with open ground floor plans. Figure 7 illustrates the PBSD process with an emphasis on evaluation.
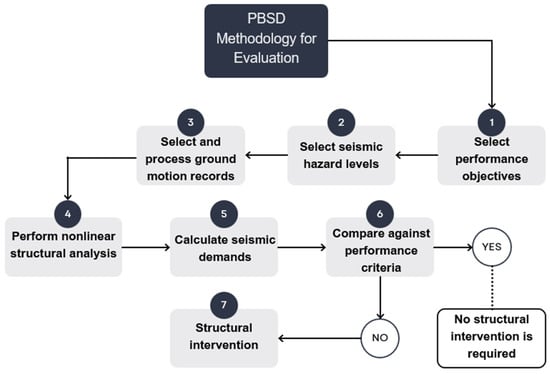
Figure 7.
Methodology for structural evaluation based on PBSD.
5.2. Performance Levels
Performance levels with a structural evaluation focus are used to determine damage in a real or simulated structure subjected to a seismic event. The main objective of this approach is to verify whether the building meets the previously established performance levels, identifying whether it can remain operational in a safe manner with potential damage that does not compromise occupant safety or whether structural intervention is required. When applying a performance-based evaluation, the selected performance levels are linked to specific seismic intensities (see Table 2) and are defined using quantifiable parameters that allow for the assessment not only of damage magnitude but also of structural functionality, occupant safety, and a realistic estimate of repair costs []. In this paper, the global inter-story drift of the building is evaluated using the performance levels IO, LS, and CP, with the aim of identifying the presence of the soft-story mechanism under different seismic intensities. Table 5 presents the damage state associated with each performance level, as well as the acceptable deformation limits considered, which correspond to the reinforced-concrete frames since they represent the most vulnerable structural zone of the building.
Table 5.
Seismic performance levels and allowable drift limits [].
5.3. Structural Response at IO Level Under 72-Year Return Period Earthquakes
The nonlinear dynamic response of the building, in terms of inter-story drift, under seismic records corresponding to a 72-year return period revealed significant flexibility at the ground floor, as drifts increased markedly in that zone. Figure 8 and Figure 9 show the inter-story drift profiles along the building height, where a notable concentration of deformations is observed in the reinforced-concrete frames located at the first level. This behavior is consistent with observations from various seismic events worldwide, where the upper stories of this type of structure typically experience minor to moderate damage, while the ground floor concentrates the highest structural demand.
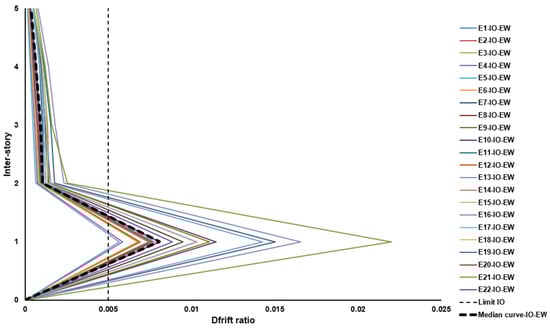
Figure 8.
Maximum inter-story drifts under 72-year return period (X direction).
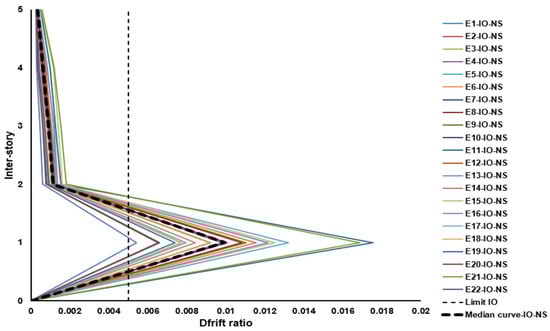
Figure 9.
Maximum inter-story drifts under 72-year return period (Y direction).
According to the previous section, the performance limit considered for earthquake records with a 72-year return period is 0.005. This value is established for concrete structures, as most of the building’s deformation tends to concentrate in this type of structural system. Based on the maximum inter-story drifts obtained from each seismic record, the results indicate that, despite the low intensity of these events, the structure did not remain below this threshold. This suggests the potential for damage that could compromise immediate post-earthquake occupancy. Figure 10 and Figure 11 graphically illustrate the performance level reached by the structure under this demand scenario.
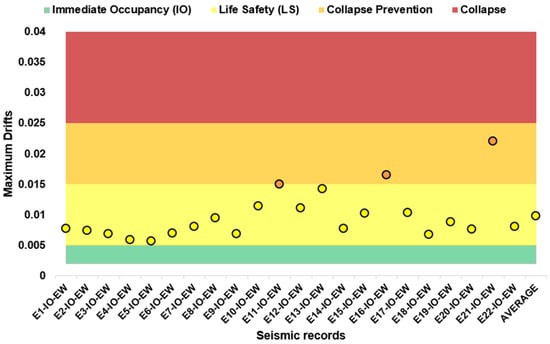
Figure 10.
Seismic demand for 72-year return period records (X direction).
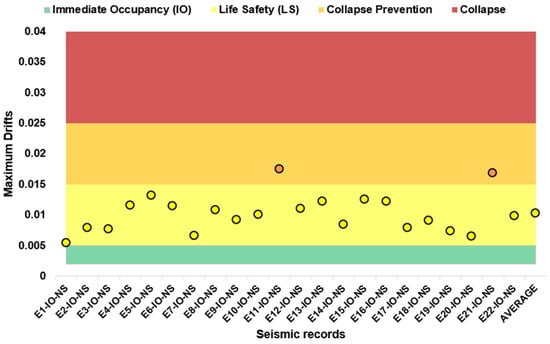
Figure 11.
Seismic demand for 72-year return period records (Y direction).
5.4. Structural Response at LS Level Under 475-Year Return Period Earthquakes
The accelerograms associated with a 475-year return period significantly increased the global deformation of the structure in both directions of analysis (see Figure 12 and Figure 13). Despite the increased seismic demand, the lateral deformation pattern remained like that observed under frequent earthquakes, with deformation concentrated at the ground floor. The plots of maximum inter-story drift profiles clearly reveal the soft-story mechanism, primarily caused by abrupt changes in stiffness and strength between the reinforced-concrete frames at the ground level and the confined-masonry walls above. Although the vulnerability of this configuration is well known, the construction of such buildings is still not explicitly prohibited in most cities worldwide. In Mexico, recent code updates have addressed this issue by recognizing the limited ductility of ground-floor elements and requiring more robust sections; however, most buildings of this type were built decades ago under less-stringent regulations that did not effectively control this structural irregularity, as is the case with the building analyzed in this paper. These results demonstrate that, under rare seismic events, such buildings are already highly susceptible to severe damage.
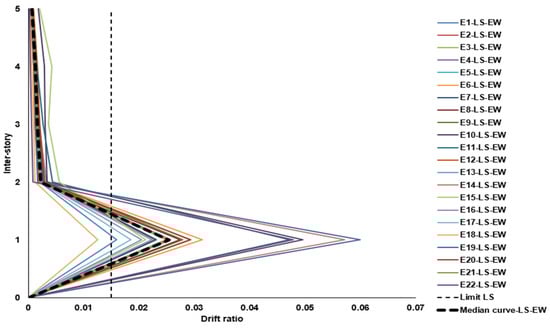
Figure 12.
Maximum inter-story drifts under 475-year return period (X direction).
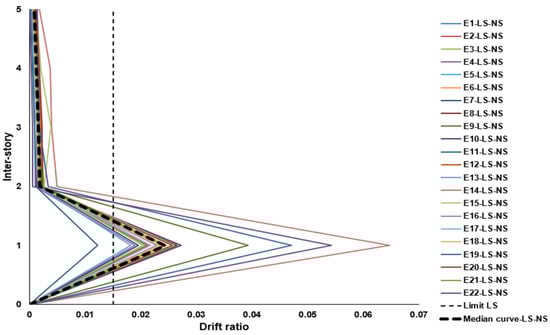
Figure 13.
Maximum inter-story drifts under 475-year return period (Y direction).
The seismic performance assessment for this intensity level showed that the accelerograms pushed the structure beyond the CP threshold, with an average peak inter-story drift of 0.030 in the X-direction and 0.027 in the Y-direction. These results indicate that the demand significantly exceeded the LS performance level, doubling its expected limits and entering a range associated with potential collapse. Figure 14 and Figure 15 clearly illustrate this high demand, reflected in the deterioration of the building’s overall seismic performance.
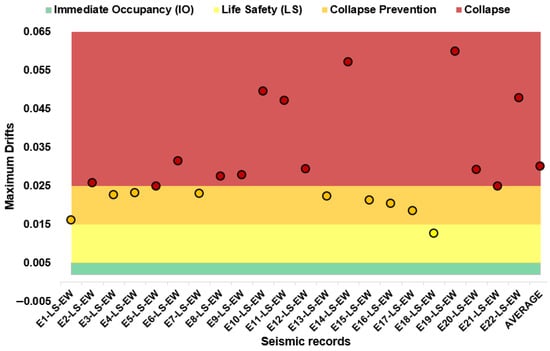
Figure 14.
Seismic demand for 475-year return period records (X direction).
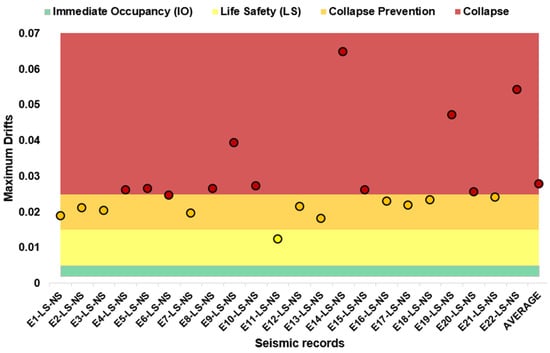
Figure 15.
Seismic demand for 475-year return period records (Y direction).
5.5. Structural Response at CP Level Under 975-Year Return Period Earthquakes
The highest-intensity earthquakes, associated with a 975-year return period, caused nearly all inter-story drift responses to exceed the maximum allowable threshold of 0.025 by a considerable margin, as shown in Figure 16 and Figure 17. Similar to the previously analyzed events, the global deformation was concentrated at the ground floor, further accentuating the vulnerability of the reinforced-concrete frames at this level. Although such seismic events are of low probability, their occurrence cannot be ruled out in regions with high seismic activity, where buildings with combined structural systems like the one analyzed may lose their load-bearing capacity under extreme seismic demand. These conditions can lead to severe and often irreparable damage, especially in structures designed under outdated or less-stringent building codes or those with significant structural irregularities.
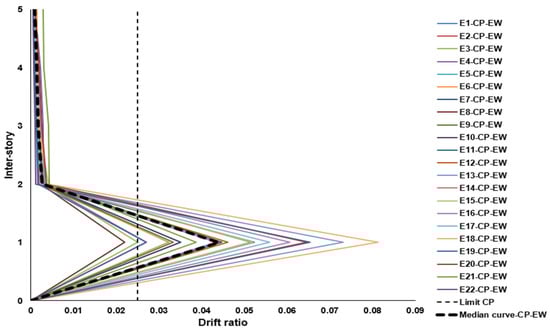
Figure 16.
Maximum inter-story drifts under 975-year return period (X direction).
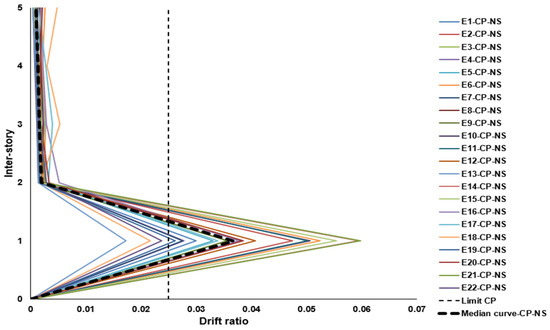
Figure 17.
Maximum inter-story drifts under 975-year return period (Y direction).
The seismic performance evaluation of the building under earthquakes associated with the CP level did not align with the expected behavior. As shown in Figure 18 and Figure 19, the seismic demand significantly weakened the global capacity of the structure. The maximum inter-story drift values in both directions were found to be near or within the collapse range, with average values of 0.0045 in the X-direction and 0.038 in the Y-direction. According to Table 5, this performance level is expected to result in severe structural damage without total collapse. However, the results suggest that the structural elements at the ground floor are being put under excessive demand, potentially leading to a localized collapse in that area. This condition has been observed in past seismic events, where ground-floor column instability led to the crushing of that story under the weight of the upper floors. Furthermore, the results indicate that for all three intensity levels analyzed, the upper stories tend to behave as a rigid block, producing similar inter-story drift values across the confined-masonry wall levels, which is consistent with behavior observed in real buildings of this typology.
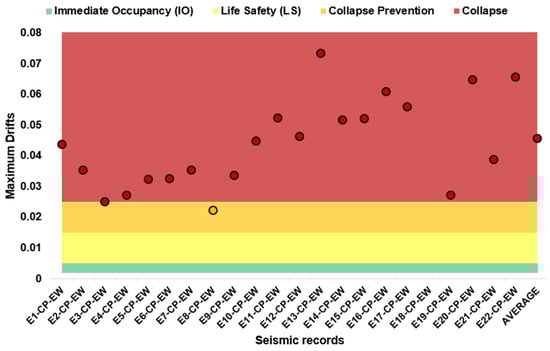
Figure 18.
Seismic demand for 975-year return period records (X direction).
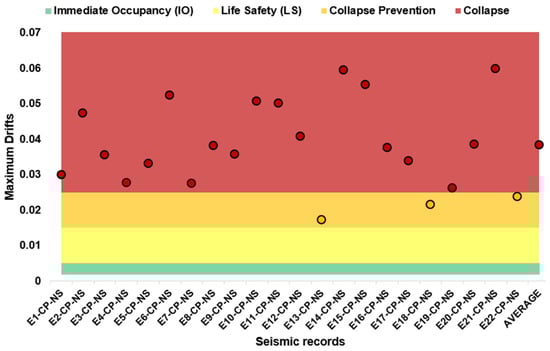
Figure 19.
Seismic demand for 975-year return period records (Y direction).
6. Structural Reliability
The structural reliability of the open-ground-story building analyzed in this paper is evaluated using the reliability index (), determined through a probabilistic approach that employs probability density functions (PDFs). The procedure begins with the collection of structural response data in terms of inter-story drift, obtained from nonlinear dynamic analyses conducted for each selected ground motion record. These data are used to construct histograms that represent the random behavior of the variable, which are then normalized to obtain an empirical probability distribution indicating the likelihood of different drift levels. A smooth curve corresponding to a theorical distribution is then fitted over this empirical distribution []. In this paper, 12 theorical distributions were considered for the fitting procedure (see Table 6). The fitting was performed using Equation (4), which corresponds to the Chi-squared goodness-of-fit test applied to the cumulative distribution function (CDFs) of these theorical distributions [].
where is a calculated value that follows a Chi-square distribution, is the number of times an inter-story drift was observed in interval , is the expected number of observations in that same interval, and is the total number of intervals into which the drift data was divided. To select the best-fit probability function, the one with the smallest value is chosen.
Table 6.
Theorical distributions used for the fitting procedure [].
To compute the reliability index (), it is necessary to define its relationship with the probability of unacceptable performance () and the probability of acceptable performance (), which characterize the unsafe and safe structural conditions, respectively. In this study, these parameters are evaluated based on the inter-story drift limits established by the PBSD framework.
The is computed by integrating the PDF fitted to the drift data within the interval defined by the thresholds and , as shown in Equation (5):
where represents the inter-story drift, is the PDF of the fitted distribution, and and correspond to the drift limits associated with the target performance level.
Subsequently, the is obtained as the complement of the :
Finally, the is expressed as a numerical value: the higher the value, the greater the reliability of the structure. Equation (7) presents the expression used for its calculation. A reference threshold of = 3.5 is adopted to assess the structural reliability of the building, a value consistent with international code recommendations and previous papers on buildings with similar structural typologies [].
where is the inverse of the CDF, evaluated for the best-fit distribution selected using the Chi-squared goodness-of-fit test.
The structural reliability assessment of the building focused on the inter-story drift response at the first story, as this level concentrates the highest inelastic demand during seismic events due to the vertical irregularity inherent in the structural configuration. This concentration of the deformation at the ground level, consistently observed across all analyzed seismic loading scenarios, represents the critical performance zone and thus serves as the most representative reference point for estimating structural reliability indices.
6.1. Structural Reliability at IO Performance Level
The structural response of the building to seismic records associated with a 72-year return period resulted in reliability values significantly below the minimum threshold of = 3.5. As shown in Table 7, the IO-level reliability analysis yielded mean values of 1.46 for the EW component and 1.30 for the NS component, with their corresponding standards deviations and coefficients of variation indicating considerable dispersion among records. These results show that the structure reaches only about half of the minimum required reliability for immediate occupancy, implying a high probability of damage under moderate seismic events, which is consistent with the deficient structural response observed in Figure 10 and Figure 11. One record even produced a negative value, meaning that the probability of unacceptable performance exceeded 50% as inter-story drift surpassed the IO threshold for more than half the record duration. For each seismic input, the probability distribution was selected based on the lowest value and p-values ≥ 0.005, ensuring a statistically acceptable fit of the drift data before computing the reliability index.
Table 7.
Structural reliability indices for IO performance level.
6.2. Structural Reliability at LS Performance Level
The structural reliability of the building under seismic events associated with a 475-year return period resulted in values well below the minimum acceptable threshold of = 3.5. As shown in Table 8, the EW and NS components exhibit average values of 1.62 and 1.65, respectively. To quantify the dispersion of the results, the standard deviations were found to be 1.46 for EW and 1.49 for NS, yielding coefficients of variation close to 0.90 in both directions. These high coefficients of variation indicate substantial record-to-record variability, meaning that the structural response is highly sensitive to the characteristics of each seismic record rather than showing a stable or uniform performance. This level of variability implies that, although some records result in moderate values, many others fall significantly below the average and approach critical performance conditions. Consequently, the structure shows a high probability of exceeding the inter-story drift limit of 0.015 under rare seismic events, reflecting insufficient reliability for the LS performance level. This interpretation is consistent with the performance trends shown in Figure 14 and Figure 15, where several analyses approach collapse-prevention conditions. Additionally, the Kernel distribution again provided the best statistical fit to the drift data, confirming a consistent non-parametric behavior across performance levels and reinforcing the robustness of the probabilistic modeling approach.
Table 8.
Structural reliability indices for LS performance level.
6.3. Structural Reliability at CP Performance Level
For the ground motion records associated with a 975-year return period, the structural reliability of the building yielded values far below the minimum threshold of = 3.5. As shown in Table 9, the EW component presented a mean of 1.39, while the NS component reached a mean of 2.05. The corresponding standards deviations (1.10 for EW and 1.66 for NS) and coefficients of variation (0.79 and 0.81, respectively) reveal a markedly high dispersion in the values, indicating not only a low average reliability but also a highly unstable and record-dependent structural response. In other words, the probability of unacceptable performance varies substantially among the seismic inputs, reflecting significant sensitivity of the structure to the characteristics of individual ground motions. These results demonstrate that, at the CP performance level, the structure consistently exceeds the inter-story drift threshold of 0.025 under very rare seismic events, implying a significant likelihood of collapse initiation. The interpretation aligns with Figure 18 and Figure 19, where the maximum drift demands surpass the prescribed limit and fall within the collapse range. Additionally, the p-values obtained for the best-fitting probability distributions (Kernel for all records) confirm statistically acceptable fits, supporting the reliability of the probabilistic representation of drift demands across the evaluated intensity levels.
Table 9.
Structural reliability indices for CP performance level.
7. Conclusions
This study provides a reliability-based seismic assessment of a mid-rise building with a soft reinforced-concrete first story and confined-masonry walls in the upper levels, a configuration that remains scarcely explored. The calibrated wide-column approach for masonry walls, combined with an extended probabilistic framework to estimate indices at different hazard levels, allows for a comprehensive understanding of the seismic performance of this type of structure.
The results highlight that vertical irregularities, particularly at the ground floor, significantly amplify seismic demands, with structural vulnerability closely linked to the design provisions of outdated codes. The nonlinear time-history analyses reveal that even moderate seismic events can produce inter-story drifts exceeding current performance thresholds, emphasizing the need for careful evaluation of similar existing structures.
The probabilistic assessment shows that the Kernel distribution provides the best fit for inter-story drift data, supporting robust estimates of reliability indices across different hazard levels. These findings demonstrate the applicability of a simplified probabilistic approach as a step in the right direction to guide structural engineers in detecting zones to retrofit in buildings affected by earthquake loading.
Finally, this study is limited to mid-rise buildings and focuses on inter-story drift, with model calibration based on available experimental data. Sensitivity evaluations of the model are recommended to improve the validity of results. Future research could extend the methodology to different building heights, additional structural response parameters, updated design codes, retrofit interventions to improve structural reliability, and the incorporation of uncertainties of material properties, damping ratios, or modeling assumptions. In addition, it is recommended to implement the methodology to other types of structural systems located in different seismic regions with high seismic activity.
Author Contributions
Conceptualization, A.G.-L., D.T. and F.V.-B.; methodology, J.R.G.-C., J.M.L.-G., J.B. and A.G.-L.; software, A.G.-L., J.R.G.-C. and D.T.; validation, A.G.-L., J.R.G.-C. and D.T.; formal analysis, A.G.-L., D.T. and F.V.-B.; investigation, J.R.G.-C., J.M.L.-G., J.B. and A.G.-L.; resources, J.R.G.-C., J.M.L.-G., J.B. and A.G.-L.; data curation, A.G.-L., D.T. and F.V.-B.; writing—original draft preparation, A.G.-L. and J.R.G.-C.; writing—review and editing, A.G.-L., F.V.-B., J.M.L.-G., J.B. and J.R.G.-C.; visualization, A.G.-L.; supervision, J.R.G.-C.; project administration, J.R.G.-C.; funding acquisition, A.G.-L. All authors have read and agreed to the published version of the manuscript.
Funding
This research was funded by Secretaría de Ciencia, Humanidades, Tecnología e Innovación (SECIHTI), under the grant number 934344, such funding was obtained by the first author of this publication as part of his PhD scholarship.
Data Availability Statement
The original contributions presented in this study are included in the article. Further inquiries can be directed at the corresponding author.
Acknowledgments
The authors would like to thank the Autonomous University of Sinaloa for providing the facilities used during the development of this research. Additionally, this work was supported by the SECIHTI (previously known as CONAHCYT), which is one of the branches of the Government of Mexico in charge of science and technology development. The grant number is 934344, corresponding to the financial support received by the first author as a scholarship.
Conflicts of Interest
The authors declare no conflicts of interest.
Appendix A. Characteristics of Ground Motion Records
Table A1.
Characteristics of ground motion records with a return period of 72 years.
Table A1.
Characteristics of ground motion records with a return period of 72 years.
| Return Period: 72 Years | ||||
|---|---|---|---|---|
| Designation | Seismic Station | Magnitude (Mw) | Component | PGA (g) |
| E1-IO | Las negras | 6.5 | NS | 0.18 |
| EW | 0.20 | |||
| E2-IO | Salina cruz | 6.1 | NS | 0.15 |
| EW | 0.17 | |||
| E3-IO | Chihuahua | 5.4 | NS | 0.22 |
| EW | 0.18 | |||
| E4-IO | Rio grande | 6.0 | NS | 0.22 |
| EW | 0.20 | |||
| E5-IO | Riito | 6.2 | NS | 0.24 |
| EW | 0.26 | |||
| E6-IO | Planta geotermica de cerro prieto | 5.8 | NS | 0.40 |
| EW | 0.24 | |||
| E7-IO | Caleta de Campos | 5.8 | NS | 0.27 |
| EW | 0.31 | |||
| E8-IO | La union | 6.8 | NS | 0.17 |
| EW | 0.15 | |||
| E9-IO | Jalapa del marques | 6.7 | NS | 0.21 |
| EW | 0.23 | |||
| E10-IO | Tamaulipas | 5.8 | NS | 0.19 |
| EW | 0.15 | |||
| E11-IO | Oaxaca Aeropuerto | 8.2 | NS | 0.13 |
| EW | 0.16 | |||
| E12-IO | Zacatula | 6.3 | NS | 0.23 |
| EW | 0.18 | |||
| E13-IO | Planta geotermica de cerro prieto | 5.0 | NS | 0.32 |
| EW | 0.34 | |||
| E14-IO | Michoacan de Ocampo | 6.2 | NS | 0.24 |
| EW | 0.29 | |||
| E15-IO | Tamazulapan | 6.5 | NS | 0.21 |
| EW | 0.25 | |||
| E16-IO | Raboso | 6.4 | NS | 0.13 |
| EW | 0.17 | |||
| E17-IO | Chihuahua | 6.2 | NS | 0.17 |
| EW | 0.22 | |||
| E18-IO | Aeropuerto Zihuatanejo | 6.3 | NS | 0.16 |
| EW | 0.14 | |||
| E19-IO | Huamelula | 4.9 | NS | 0.11 |
| EW | 0.10 | |||
| E20-IO | Caleta de Campos | 6.8 | NS | 0.14 |
| EW | 0.14 | |||
| E21-IO | Sicartsa Caseta Maestro | 7.0 | NS | 0.26 |
| EW | 0.30 | |||
| E22-IO | Volcan de cerro prieto | 5.8 | NS | 0.24 |
| EW | 0.25 | |||
Table A2.
Characteristics of ground motion records with a return period of 475 years.
Table A2.
Characteristics of ground motion records with a return period of 475 years.
| Return Period: 475 Years | ||||
|---|---|---|---|---|
| Designation | Seismic Station | Magnitude (Mw) | Component | PGA (g) |
| E1-LS | Las negras | 6.4 | NS | 0.22 |
| EW | 0.23 | |||
| E2-LS | Rio grande | 6.5 | NS | 0.26 |
| EW | 0.28 | |||
| E3-LS | Caleta de Campos | 6.4 | NS | 0.35 |
| EW | 0.38 | |||
| E4-LS | Planta geotermica de cerro prieto | 6.0 | NS | 0.34 |
| EW | 0.25 | |||
| E5-LS | Riito | 6.8 | NS | 0.32 |
| EW | 0.34 | |||
| E6-LS | Jalapa del marques | 7.1 | NS | 0.23 |
| EW | 0.26 | |||
| E7-LS | Planta geotermica de cerro prieto | 5.3 | NS | 0.27 |
| EW | 0.31 | |||
| E8-LS | Zacatula | 6.7 | NS | 0.27 |
| EW | 0.23 | |||
| E9-LS | Michoacan de Ocampo | 6.5 | NS | 0.32 |
| EW | 0.44 | |||
| E10-LS | Volcan de cerro prieto | 6.1 | NS | 0.25 |
| EW | 0.28 | |||
| E11-LS | Chihuahua | 6.4 | NS | 0.21 |
| EW | 0.25 | |||
| E12-LS | Sicartsa Caseta Testigo | 6.1 | NS | 0.27 |
| EW | 0.25 | |||
| E13-LS | Tamaulipas | 6.2 | NS | 0.23 |
| EW | 0.21 | |||
| E14-LS | Chihuahua | 6.1 | NS | 0.17 |
| EW | 0.29 | |||
| E15-LS | Delta | 5.8 | NS | 0.33 |
| EW | 0.22 | |||
| E16-LS | Ciudad Serdan | 6.0 | NS | 0.13 |
| EW | 0.12 | |||
| E17-LS | Planta geotermica de cerro prieto | 7.2 | NS | 0.29 |
| EW | 0.29 | |||
| E18-LS | Niltepec | 8.2 | NS | 0.41 |
| EW | 0.40 | |||
| E19-LS | Las vigas | 6.2 | NS | 0.27 |
| EW | 0.28 | |||
| E20-LS | Sicartsa Caseta Maestro | 7.0 | NS | 0.26 |
| EW | 0.30 | |||
| E21-LS | Sicartsa Caseta Testigo | 7.0 | NS | 0.27 |
| EW | 0.31 | |||
| E22-LS | Pinoteca nacional | 6.5 | NS | 0.23 |
| EW | 0.25 | |||
Table A3.
Characteristics of ground motion records with a return period of 975 years.
Table A3.
Characteristics of ground motion records with a return period of 975 years.
| Return Period: 975 Years | ||||
|---|---|---|---|---|
| Designation | Seismic Station | Magnitude (Mw) | Component | PGA (g) |
| E1-CP | Las negras | 6.7 | NS | 0.25 |
| EW | 0.27 | |||
| E2-CP | Rio grande | 6.8 | NS | 0.31 |
| EW | 0.30 | |||
| E3-CP | Salina cruz | 8.2 | NS | 0.25 |
| EW | 0.25 | |||
| E4-CP | Caleta de Campos | 6.5 | NS | 0.37 |
| EW | 0.40 | |||
| E5-CP | Planta geotermica de cerro prieto | 7.2 | NS | 0.29 |
| EW | 0.29 | |||
| E6-CP | Riito | 7.2 | NS | 0.38 |
| EW | 0.40 | |||
| E7-CP | Jalapa del marques | 8.2 | NS | 0.28 |
| EW | 0.30 | |||
| E8-CP | La union | 7.1 | NS | 0.21 |
| EW | 0.19 | |||
| E9-CP | Planta geotermica de cerro prieto | 6.0 | NS | 0.32 |
| EW | 0.43 | |||
| E10-CP | Zacatula | 6.7 | NS | 0.27 |
| EW | 0.23 | |||
| E11-CP | Michoacan de Ocampo | 7.2 | NS | 0.41 |
| EW | 0.54 | |||
| E12-CP | Volcan de cerro prieto | 6.2 | NS | 0.29 |
| EW | 0.34 | |||
| E13-CP | Chihuahua | 6.3 | NS | 0.21 |
| EW | 0.26 | |||
| E14-CP | Sicartsa Caseta Maestro | 7.1 | NS | 0.23 |
| EW | 0.29 | |||
| E15-CP | Sicartsa Caseta Testigo | 7.4 | NS | 0.32 |
| EW | 0.33 | |||
| E16-CP | Sicartsa Caseta Testigo | 6.7 | NS | 0.29 |
| EW | 0.27 | |||
| E17-CP | Tamaulipas | 7.2 | NS | 0.28 |
| EW | 0.22 | |||
| E18-CP | Chihuahua | 5.9 | NS | 0.19 |
| EW | 0.29 | |||
| E19-CP | Delta | 6.1 | NS | 0.43 |
| EW | 0.27 | |||
| E20-CP | Oaxaca Ciudad Universitaria | 8.2 | NS | 0.15 |
| EW | 0.20 | |||
| E21-CP | Ciudad Serdan | 6.4 | NS | 0.19 |
| EW | 0.18 | |||
| E22-CP | Xoxocotlan | 8.2 | NS | 0.21 |
| EW | 0.22 | |||
References
- Uva, G.; Porco, F.; Fiore, A.; Ruggieri, S. Effects in Conventional Nonlinear Static Analysis: Evaluation of Control Node Position. Structures 2018, 13, 178–192. [Google Scholar] [CrossRef]
- Ruggieri, S.; Uva, G. Accounting for the Spatial Variability of Seismic Motion in the Pushover Analysis of Regular and Irregular RC Buildings in the New Italian Building Code. Buildings 2020, 10, 177. [Google Scholar] [CrossRef]
- Ruggieri, S.; Uva, G. Extending the concepts of response spectrum analysis to nonlinear static analysis: Does it make sense? Innov. Infrastruct. Solut. 2024, 9, 235. [Google Scholar] [CrossRef]
- Ruiz, S.E.; Diederich, R. The Mexico Earthquake of 19 September 2024, 1985—The Seismic Performance of Buildings with Weak First Storey. Earthq. Spectra 1989, 5, 89–102. [Google Scholar] [CrossRef]
- Adalier, K.; Aydingun, O. Structural engineering aspects of the June 27, 1998 Adana–Ceyhan (Turkey) earthquake. Eng. Struct. 2001, 23, 343–355. [Google Scholar] [CrossRef]
- Arslan, M.H.; Korkmaz, H.H. What is to be learned from damage and failure of reinforced concrete structures during recent earthquakes in Turkey? Eng. Fail. Anal. 2007, 14, 1–22. [Google Scholar] [CrossRef]
- Galvis, F.A.; Miranda, E.; Heresi, P.; Dávalos, H.; Ruiz-García, J. Overview of collapsed buildings in Mexico City after the 19 September 2017 (Mw 7.1) earthquake. Earthq. Spectra 2020, 36 (Suppl. S2), 83–109. [Google Scholar] [CrossRef]
- Tena-Colunga, A.; Hernández-Ramírez, H.; Godínez-Domínguez, E.A.; Pérez-Rocha, L.E.; Grande-Vega, A.; Urbina-Californias, L.A. Seismic behavior of buildings in Mexico City during the 2017 Puebla–Morelos earthquake. Asian J. Civ. Eng. 2021, 22, 649–675. [Google Scholar] [CrossRef]
- Reinoso, E.; Quinde, P.; Buendía, L.; Ramos, S. Intensity and damage statistics of the 19 September 2017 Mexico earthquake: Influence of soft story and corner asymmetry on the damage reported during the earthquake. Earthq. Spectra 2021, 37, 1875–1899. [Google Scholar] [CrossRef]
- Gkournelos, P.D.; Triantafillou, T.C.; Bournas, D.A. Seismic upgrading of existing reinforced concrete buildings: A state-of-the-art review. Eng. Struct. 2021, 240, 112273. [Google Scholar] [CrossRef]
- Matiyas, S.; Workeluel, N.; Mohanty, T.; Saha, P. Review of different analysis and strengthening techniques of soft story buildings. Mater. Today Proc. 2023; in press. [Google Scholar] [CrossRef]
- Páez, D.; Zabala, J.; Rodríguez, Y. Piso blando, una falla común en el terremoto de pedernales. Ciencia 2018, 19, 58. [Google Scholar] [CrossRef]
- Alvarez, S. Informe Técnico Sismológico del Terremoto de San Salvador del 10 de Octubre de 1986. 1987. Available online: https://portafolio.snet.gob.sv/digitalizacion/pdf/spa/doc00018/doc00018.htm (accessed on 5 July 2025).
- Anderson, R.W. The San Salvador Earthquake of 10 October 1986—Review of Building Damage. Earthq. Spectra 1987, 3, 497–541. [Google Scholar] [CrossRef]
- Saatcioglu, M.; Palermo, D.; Ghobarah, A.; Mitchell, D.; Simpson, R.; Adebar, P.; Tremblay, R.; Ventura, C.; Hong, H. Performance of reinforced concrete buildings during the 27 February 2010 Maule (Chile) earthquake. Can. J. Civ. Eng. 2013, 40, 693–710. [Google Scholar] [CrossRef]
- Castañeda, A.E.; Mieles Bravo, Y. Una mirada al comportamiento estructural de columnas, vigas, entrepisos y edificaciones durante el sismo de Ecuador 2016. Rev. Ing. Constr. 2017, 32, 157–172. [Google Scholar] [CrossRef]
- Jara-Guerrero, J.M.; Hernández-Mazariegos, E.J.; Olmos-Navarrete, B.A.; Martínez-Ruiz, G.; Roa-García, M.I. Seismic Vulnerability and Retrofit Alternatives for Typical Soft-story Buildings in Earthquake Prone Areas. Struct. Eng. Int. 2020, 30, 33–42. [Google Scholar] [CrossRef]
- Mo, Y.L.; Chang, Y.F. Application of base isolation concept to soft first story buildings. Comput. Struct. 1995, 55, 883–896. [Google Scholar] [CrossRef]
- Ruiz, S.E.; Santos-Santiago, M.A.; Bojórquez, E.; Orellana, M.A.; Valenzuela-Beltrán, F.; Bojórquez, J.; Barraza, M. BRB retrofit of mid-rise soft-first-story RC moment-frame buildings with masonry infill in upper stories. J. Build. Eng. 2021, 38, 101783. [Google Scholar] [CrossRef]
- Negro, P.; Verzeletti, G. Effect of infills on the global behaviour of R/C frames: Energy considerations from pseudodynamic tests. Earthq. Eng. Struct. Dyn. 1996, 25, 753–773. [Google Scholar] [CrossRef]
- Esteva, L. Nonlinear Seismic Response of Soft-First-Story Buildings Subjected to Narrow-Band Accelerograms. Earthq. Spectra 1992, 8, 373–389. [Google Scholar] [CrossRef]
- Pang, W.; Ziaei, E. Nonlinear Dynamic Analysis of Soft-Story Light-Frame Wood Buildings. Struct. Congr. 2012, 2012, 1767–1777. [Google Scholar] [CrossRef]
- Dya, A.F.C.; Oretaa, A.W.C. Seismic Vulnerability Assessment of Soft Story Irregular Buildings Using Pushover Analysis. Procedia Eng. 2015, 125, 925–932. [Google Scholar] [CrossRef]
- Jara, J.M.; Hernández, E.J.; Olmos, B.A.; Martínez, G. Building damages during the September 19, 2017 earthquake in Mexico City and seismic retrofitting of existing first soft-story buildings. Eng. Struct. 2020, 209, 109977. [Google Scholar] [CrossRef]
- Shahsahebi, A.; Waezi, Z.; Hashemi, M.J. Seismic performance assessment of multi-story RC buildings with soft-story collapse mechanism equipped with gapped inclined bracing (GIB). Structures 2020, 28, 2448–2466. [Google Scholar] [CrossRef]
- NTCS. Technical Norms for Seismic Design. 2017. Available online: https://www.smig.org.mx/archivos/NTC2017/normas-tecnicas-complementarias-reglamento-construcciones-cdmx-2017.pdf (accessed on 27 July 2025).
- García-Ranz, F.; Gómez, R. The Mexico Earthquake of September 19, 1985—Seismic Design Regulations of the 1976 Mexico Building Code. Earthq. Spectra 1988, 4, 427–439. [Google Scholar] [CrossRef]
- Ruiz-García, J.; Cárdenas, Y. Seismic performance assessment of weak first-storey RC buildings designed with old and new seismic provisions for Mexico City. Eng. Struct. 2021, 232, 111803. [Google Scholar] [CrossRef]
- Jara, J.M.; García-Calzada, C.; Olmos, B.A.; Martínez, G. Seismic response and reliability index of RC weak story buildings on soft soils of Mexico City. J. Build. Eng. 2022, 50, 104199. [Google Scholar] [CrossRef]
- Ujwal, M.S.; Kumar, G.S.; Sathvik, S.; Ramaraju, H.K. Effect of soft story conditions on the seismic performance of tall concrete structures. Asian J. Civ. Eng. 2024, 25, 3141–3149. [Google Scholar] [CrossRef]
- Mori, N.; Muhammad, A.; Goda, K.; Yasuda, T.; Ruiz-Angulo, A. Probabilistic Tsunami Hazard Analysis of the Pacific Coast of Mexico: Case Study Based on the 1995 Colima Earthquake Tsunami. Front. Built Environ. 2017, 3, 1–16. [Google Scholar] [CrossRef]
- MDOC-CFE. Manual of Civil Structures Design. Earthqauke Design. 2015. Available online: https://pdfcoffee.com/cfe-mdoc-mds-2015pdf-10-pdf-free.html? (accessed on 5 August 2025).
- ETABS.v21 ETABS 2023—Integrated Software for Structural Analysis & Design. Computers and Structures, Inc. 2023. Available online: https://www.csiamerica.com/products/etabs (accessed on 7 August 2025).
- Pérez-Gavilán, J.J. Guía Para el anáLisis de Estructuras de Mampostería. 2015. Available online: https://www.researchgate.net/profile/Jose-Rangel-18/publication/262836016_Guia_para_el_Analisis_de_Estructuras_de_Mamposteria/links/00463538f6a3e4452e000000/Guia-para-el-Analisis-de-Estructuras-de-Mamposteria.pdf (accessed on 19 November 2025).
- MDOC-CFE. Manual of Civil Structures Design. Earthquake Design. 1993. Available online: https://www.scribd.com/document/127628449/CFE-Civil-Design-Manual-Seismic-English (accessed on 19 November 2025).
- MCBC. Mexico City Building Code: Reglamento de Construcciones para el Distrito Federal. 2004. Available online: https://paot.org.mx/centro/reglamentos/df/pdf/2015/RGTO_CONSTRUCCIONES_29_01_2004.pdf (accessed on 19 November 2025).
- SEAOC. Performance-Based Earthquake Engineering; Vision 2000 Committee; Structural Engineers Association of California: Sacramento, CA, USA, 1995. [Google Scholar]
- CTSSD. Complementary Technical Standards for Seismic Design. 2023. Available online: https://www.isc.cdmx.gob.mx/directores-res/cursos-de-actualizacion-2022/normas-tecnicas-complementarias-2023 (accessed on 25 August 2025).
- Baker, J.W.; Allin Cornell, C. Spectral shape, epsilon and record selection. Earthq. Eng. Struct. Dyn. 2006, 35, 1077–1095. [Google Scholar] [CrossRef]
- Travasarou, T.; Bray, J.D.; Abrahamson, N.A. Empirical attenuation relationship for Arias Intensity. Earthq. Eng. Struct. Dyn. 2003, 32, 1133–1155. [Google Scholar] [CrossRef]
- ASCE 41-17. Seismic Evaluation and Retrofit of Existing Buildings. 2017. Available online: https://ascelibrary.org/doi/book/10.1061/9780784414859 (accessed on 13 September 2025).
- Gonzales, G.; Aguilar, A.; Huaco, G. Incremental dynamic analysis of a 60 year old hospital with handmade brick masonry walls. In Proceedings of the LACCEI International Multi-Conference for Engineering, Education and Technology, Bogotá, Colombia, 27–31 July 2020. [Google Scholar] [CrossRef]
- Corrales, S. Ensayes Ante Carga Lateral de Muros Confinados de Mampostería de Block Reforzados con Fibra de Vidrio: 50%; Universidad Autónoma de Sinaloa: Culiacán, Mexico, 2023. [Google Scholar]
- NTC-Masonry. Complementary Technical Standards for the Design and Construction of Masonry Structures. 2023. Available online: https://www.isc.cdmx.gob.mx/directores-res/cursos-de-actualizacion-2022/normas-tecnicas-complementarias-2023 (accessed on 25 August 2025).
- Asgarkhani, N.; Kazemi, F.; Jankowski, R.; Formisano, A. Dynamic ensemble-learning model for seismic risk assessment of masonry infilled steel structures incorporating soil-foundation-structure interaction. Reliab. Eng. Syst. Saf. 2025, 267, 111839. [Google Scholar] [CrossRef]
- Gil-oulbé, M.; Al-Shaibani, F.A.N.A.; Lina, A.S. Performance-Based Seismic Design for buildings. Struct. Mech. Eng. Constr. Build. 2020, 16, 161–166. [Google Scholar] [CrossRef]
- Krawinkler, H.; Miranda, E. Earthquake Engineering; Bozorgnia, Y., Bertero, V.V., Eds.; CRC Press: Boca Raton, FL, USA, 2004. [Google Scholar] [CrossRef]
- Guerrero, H.; Ji, T.; Teran-Gilmore, A.; Escobar, J.A. A method for preliminary seismic design and assessment of low-rise structures protected with buckling-restrained braces. Eng. Struct. 2016, 123, 141–154. [Google Scholar] [CrossRef]
- Zameeruddin, M.; Sangle, K.K. Performance-based Seismic Assessment of Reinforced Concrete Moment Resisting Frame. J. King Saud Univ. Eng. Sci. 2021, 33, 153–165. [Google Scholar] [CrossRef]
- ASCE 41-23. Seismic Evaluation and Retrofit of Existing Buildings; American Society of Civil Engineers: Washington, DC, USA, 2023. [Google Scholar] [CrossRef]
- Monjardin-Quevedo, J.G.; Valenzuela-Beltran, F.; Reyes-Salazar, A.; Leal-Graciano, J.M.; Torres-Carrillo, X.G.; Gaxiola-Camacho, J.R. Probabilistic Assessment of Buildings Subjected to Multi-Level Earthquake Loading Based on the PBSD Concept. Buildings 2022, 12, 1942. [Google Scholar] [CrossRef]
- Ayyub, B.M.; McCuen, R.H. Probability, Statistics, and Reliability for Engineers and Scientists; CRC Press: Boca Raton, FL, USA, 2016. [Google Scholar]
- Vazquez-Ontiveros, J.R.; Vazquez-Becerra, G.E.; Quintana, J.A.; Carrion, F.J.; Guzman-Acevedo, G.M.; Gaxiola-Camacho, J.R. Implementation of PPP-GNSS measurement technology in the probabilistic SHM of bridge structures. Measurement 2021, 173, 108677. [Google Scholar] [CrossRef]
Disclaimer/Publisher’s Note: The statements, opinions and data contained in all publications are solely those of the individual author(s) and contributor(s) and not of MDPI and/or the editor(s). MDPI and/or the editor(s) disclaim responsibility for any injury to people or property resulting from any ideas, methods, instructions or products referred to in the content. |
© 2025 by the authors. Licensee MDPI, Basel, Switzerland. This article is an open access article distributed under the terms and conditions of the Creative Commons Attribution (CC BY) license (https://creativecommons.org/licenses/by/4.0/).