Abstract
This study presents the design and performance assessment of suction anchor foundations for an integrated offshore wind–solar–aquaculture system located in Jiangsu Sheyang, China. The project represents one of the first practical demonstrations of coupling renewable energy production with large-scale marine aquaculture on a shared floating platform. Using three-dimensional numerical simulations in FLAC3D and ABAQUS, the study evaluates the anchors’ bearing capacity, structural safety, and fatigue performance under ultimate (ULS), accidental (ALS), and fatigue (FLS) limit states. The analysis incorporates site-specific geotechnical conditions, seabed scour, and installation deviations, providing a realistic framework for foundation design in layered coastal sediments. Results confirm that the suction anchor system meets international safety requirements (DNV, CCS) and maintains robust performance throughout its service life. The findings demonstrate that scour depth and installation accuracy are critical factors governing anchor reliability and offer practical insights for updating offshore foundation design standards in future multifunctional renewable–aquaculture developments.
1. Introduction
Suction anchors have emerged as a versatile foundation solution for offshore wind turbines, floating platforms, and marine energy devices due to their cost-effectiveness, ease of installation, and environmental adaptability [1,2]. Originally developed for mooring oil and gas structures, their application has expanded significantly in the offshore renewable sector, especially in regions with complex seabed conditions [3,4]. Numerical simulation plays a central role in evaluating the performance of suction anchors. Tools such as FLAC3D and ABAQUS are widely used to assess bearing capacity under various loading conditions. Design codes such as DNV-RP-C208 provide detailed guidance for nonlinear finite element methods (FEM) that capture soil–structure interaction and failure mechanisms [5,6].
Scour and long-term morphodynamical changes further threaten anchor stability. Randolph et al. (2011) and Zhou et al. (2020) indicate that combined wave–current action can erode more than 1.5 pile diameters of embedment in clays or 10% of penetration depth in sands over a decade [7,8,9]. The long-term performance of suction anchor foundation is challenged by installation errors, seabed evolution, fatigue degradation, and eventual removal. Recent studies show that even modest deviations—small tilts (Andersen, 2009) and directional misalignments (Zhou et al., 2023)—can reduce horizontal or vertical capacity under cyclic loading [10,11,12]. Although these works establish the sensitivity of soft clays to such errors, systematic investigations covering layered or interbedded silt–sand deposits remain scarce [13,14,15,16].
Fatigue of the anchor and its welded joints is governed by standards such as DNVGL-RP-C203 (Det Norske Veritas, 2014), but the guidance is generic. Zhang et al. (2025) and Moan (2005) highlight that marine corrosion, multiaxial stresses, and variable-amplitude loading can accelerate crack growth beyond S–N predictions, yet dedicated fatigue data for suction anchors are still lacking [17,18,19]. Uplift or extraction resistance has been addressed only for idealized conditions. Houlsby and Byrne (2005) and Zhang et al. (2024) examined the installation mechanics and pull-out of caissons in sand, while Xu et al. (2024) showed that over-pressure can lower extraction resistance [20,21,22]. Although numerous international studies and several Chinese standards have addressed increasingly complex offshore foundation designs in response to the nation’s rapidly expanding wind power market, none have systematically examined the coupled effects of long-term soil consolidation, scour-induced embedment loss, and complex layered stratigraphy [23,24,25,26,27].
For scour monitoring, Tang and Zhao (2021) deployed a three-layer system (inclinometers/accelerometers) at the Jiangsu Rudong Offshore Wind Farm—revealing annual data patterns but no safety alerts, thus enabling proactive mitigation. Complementing this, Tola et al. (2023) reviewed direct (e.g., sonar/radar) and indirect (e.g., vibration-based) methods alongside ML(Machine Learning) for sensor data (e.g., accelerations/strains), offering a bridge-focused framework adaptable to offshore anchors that overcomes empirical limitations and facilitates probabilistic protection [28,29].
In contrast to previous single-focus studies centered on oil and gas applications or homogeneous soil conditions, this research integrates the coupled influences of scour, installation deviation, and fatigue within a unified numerical framework tailored for layered silt–sand seabeds, providing a more realistic foundation performance assessment for multifunctional offshore systems.
This study aims to address these gaps by conducting a comprehensive numerical investigation of suction pile foundations within an integrated offshore “wind–solar–aquaculture” system. It evaluates structural safety, fatigue resistance, and the influence of installation deviations under realistic oceanographic and geological conditions. The findings are expected to support improved design optimization and risk management in the next generation of multifunctional offshore platforms.
2. Engineering Background
2.1. Project Overview
The Jiangsu Sheyang Wind–Solar–Fishery Integrated Marine Ranch Demonstration Project is located within the existing Jiangsu Sheyang H2# offshore wind farm and plans to construct one semi-submersible aquaculture platform with a water capacity of no less than 10,000 cubic meters. The Sheyang H2 site has an average east–west length of approximately 23.5 km and a north–south width of about 2.0 km, covering a planned sea area of 48 square kilometers. The aquaculture platform is arranged within the H2 wind farm, with the cage located about 36 km offshore at a water depth of approximately 18–18.5 m. A safe distance is maintained between the aquaculture platform and the wind turbine foundations, with the location and specific layout shown in Figure 1.
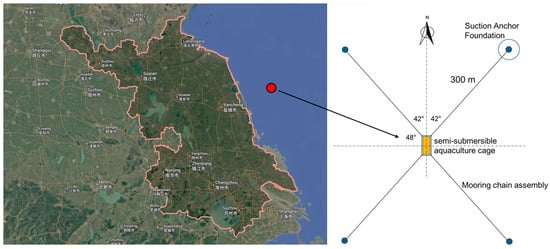
Figure 1.
Location and specific layout of the Sheyang aquaculture platform.
Unlike conventional offshore wind foundations, the integrated platform must withstand additional hydrodynamic drag and inertial loads from aquaculture cages. The large net-cage array produces variable horizontal drag (up to 10–15% of mooring tension under peak current), which is transferred through the floating frame to the mooring system. This load coupling modifies the mooring-line tension distribution and must be considered when evaluating anchor performance and fatigue.
2.2. Engineering Geology
The 300 MW demonstration project lies 8–15 km off Sheyang County (33.8° N, 120.3° E), in a tide-dominated section of the central Jiangsu coast. Water depths range from 17.9 to 18.2 m LAT; the seabed is a gently sloping shelf underlain by 800–1000 m of Quaternary marine silt and silty clay. Six geotechnical units to −44 m LAT consist of soft-plastic silty clay (upper 8 m), medium-dense silt, and interbedded clays. The upper strata are normally consolidated and susceptible to scouring and cyclic softening. The site is located on the stable Yanfu Depression within the Subei Depression, yet lies 30–80 km from several active coastal faults. The design PGA is 0.15 g (code-adjusted 0.165 g for Class IV soil); intensity VII, Tg = 0.75 s.
Regular semidiurnal tides (spring range 5.17 m; 50-year HHWL = 3.56 m) and strong reciprocating currents (max. 1.8 m s−1) drive persistent sediment transport. The 50-year design wave from the north reaches 10.56 m; prevailing ESE waves (Hmax 4.71 m) dominate the annual wave climate. Surface salinity ranges from 29 to 30 ‰, and temperature from 26 to 27 °C; no ice occurs. Seawater is strongly aggressive to concrete (crystallized-sulphate type) and moderately aggressive to steel. Pore-water chlorides and low electrical resistivity render the upper 8 m of soil mildly corrosive to concrete and highly corrosive to reinforcement.
2.3. Design Background and Loading Conditions
The design service life of the mooring foundation should align with that of the semi-submersible aquaculture cage and account for construction and decommissioning periods, totaling 22 years (1 year for construction, 20 years of operation, and 1 year for decommissioning). The semi-submersible cage is classified as a mobile platform, and the design sea state recurrence period is 10 years. The mooring foundation primarily uses DH36/DH36-Z35 marine steel plates, known for their good corrosion resistance, with a yield strength of 355 MPa and tensile strength between 490 and 630 MPa. According to the CCS classification standards for offshore floating facilities, the minimum safety factors for suction anchors are 1.60 (lateral) and 2.00 (axial) under the ultimate limit state (ULS), and 1.20 (lateral) and 1.50 (axial) under the accidental limit state (ALS). Corrosion protection is designed in accordance with the technical code for anticorrosion of offshore wind farm steel structures (NB/T 31006–2011), and based on structural zoning, the suction anchor’s corrosion protection system is designed for a service life of 21 years [25].
2.4. Geotechnical Design Parameters
Based on the results of laboratory geotechnical tests and in situ field tests, and with reference to the national standard code for design of building foundation (GB 50007–2011) and the industry standard Recommended Practice for Planning, Design, and Constructing of Offshore Fixed Platforms—Working Stress Design (SY/T 10030–2018), combined with local experience, the recommended geotechnical parameters are summarized in Table 1 [26,27].

Table 1.
Recommended design parameters for suction anchor foundations.
3. Research Methodology
3.1. Numerical Modeling
The semi-submersible aquaculture platform in this study used a four-point mooring configuration, consisting of four identical suction anchor foundations labeled sequentially from one to four in a clockwise arrangement. Each suction anchor features a cylindrical design with a diameter of 12 m, length of 11 m, a sidewall thickness of 25 mm, and top plate thickness of 26 mm. The mooring pad-eye is positioned 7.5 m below the anchor top along the external surface. The mooring system maintains a horizontal projection of 300 m between the platform and anchor pad-eyes, with a total cable length of 313 m (excluding installation fittings). All suction anchor foundations were designed and fabricated by Power China HuaDong Engineering Co., Ltd., specializing in offshore wind power and floating foundation manufacturing, located in Hangzhou City, Zhejiang Province, China. Detailed schematics of the anchor foundation layout and dimensional specifications are presented in Figure 2.
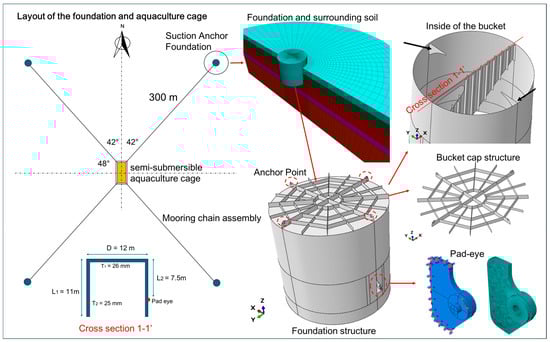
Figure 2.
Layout of the aquaculture cage and modeling of the suction anchor foundation.
Three-dimensional analysis was performed with the aid of the finite element software FLAC3D (version 9.0, 2024, Itasca Consulting Group Inc.) and ABAQUS (version 2024, Dassault Systèmes) to evaluate the load-bearing behavior of the structure and surrounding soil [30,31]. In the numerical model, the suction anchors were represented using structural elements, while the soil–anchor interaction was simulated through specialized interface elements. The computational analysis specifically examines the deformation behavior and load-bearing capacity under two critical operational scenarios: the ultimate limit state (ULS) and the accidental limit state (ALS). The simulation results confirm compliance with prescribed safety factors, thereby verifying adequate safety margins for the foundation system under extreme loading conditions.
3.2. Simulation of Structural Element Regarding Foundation
The foundation was simulated using a prefabricated structural elements liner. The liner structural element is a flat finite element that resists shear forces and bending moments. By attaching it to the mesh surface of the soil mass and defining the contact surface properties of the liner area, the liner structural element can calculate mutual friction between the structural element and the soil, as well as separation and re-contact with the soil. Figure 3 and Figure 4 illustrate the liner function.
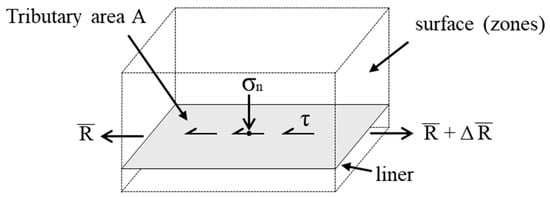
Figure 3.
Stresses acting on the liner elements surrounding a node.
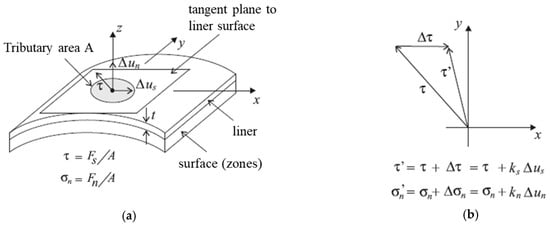
Figure 4.
Idealization of interface behavior at a liner node. (a) Shear stress, τ, and incremental relative shear and normal displacements, Δus and Δun, between liner and surface; (b) shear and normal stress update at each time step.
3.3. Design Conditions and Load Combinations
The design conditions for the suction anchor foundation primarily include the ultimate limit state (ULS) and the fatigue limit state (FLS). The ULS covers two scenarios: (a) intact mooring under design environmental conditions, where all mooring lines are operational; and (b) damaged mooring, where one mooring line has failed and the remaining system must maintain functionality—this corresponds to the accidental limit state (ALS). In the FLS, fatigue damage is assessed at the welded connection between the pad-eye and the anchor wall, which is subjected to long-term cyclic mooring forces. The mooring force at the pad-eye is determined using formulas from DNV-RP-E302, which analyze the interaction between the embedded chain and seabed soil. The chain assumes an inverted catenary shape due to lateral soil support, and different soil types (clay or sand) require different methods to calculate normal and tangential resistance forces.
The main load acting on the suction anchor after installation is the inclined tensile force at the pad-eye. According to mooring analysis, under the 10-year return period ULS, the tension reaches 8339.74 kN at 22.2°, while under ALS, it increases to 11,473.29 kN at 19.81°. Fatigue loads under various SN curve slopes are also summarized. Design requirements stipulate that the anchor’s vertical and horizontal bearing capacities must meet the safety factors outlined in CCS codes: not less than 2.0 (axial) and 1.6 (lateral) for ULS, and 1.5 (axial) and 1.2 (lateral) for ALS. Considering the seabed scour depth of 1–3 m observed over 33 years and environmental uncertainties, a conservative 2 m scour depth is adopted. If local scour exceeds this, protective measures must be implemented to ensure long-term stability.
4. Calculation Results and Analysis
4.1. Load-Bearing Behavior of Suction Anchor Foundations
4.1.1. Load-Bearing Behavior of Suction Anchor Foundations
The soil parameters used in the numerical simulation were determined based on Table 2, and structural parameters are shown in Table 3, encompassing five distinct soil strata from surface to bedrock: silty clay (0–5.7 m), silty sand with clay interbeds (5.7–9 m), clayey silt (9–15.5 m), sandy silt with clay interlayers (15.5–18.6 m), and clayey silt (18.6–27.5 m). The constitutive model adopted an ideal elastic–plastic formulation incorporating key geotechnical parameters—unit weight, cohesion, friction angle, elastic modulus, and Poisson’s ratio—with a systematic 20% reduction (factor of 0.8) applied to all soil properties to account for cyclic degradation effects. The suction anchor structure itself was simulated using linear elastic material properties, and the analysis considered three fundamental mechanical characteristics: elastic modulus, Poisson’s ratio, and mass density. This modeling approach ensures accurate representation of both the nonlinear soil–structure interaction behavior under operational loading conditions and the elastic response of the steel foundation components.
Table 2.
Material parameters of soil layers.
Table 3.
Suction anchor structural parameters.
4.1.2. Calculation Conditions
In accordance with DNV-OS-E301 (Position Mooring) and DNV-OS-C101 (Design of Offshore Steel Structures, General—LRFD Method), the installation and positioning of suction anchor foundations must be executed with precision. However, practical engineering constraints—including complex geological conditions, challenging construction environments, and equipment limitations—inevitably introduce installation deviations such as tilt and rotation, which subsequently affect structural performance. Consequently, strength verification at the pad-eye must account for both tilt installation error (±5°) and directional installation error (7.5°). While seabed slope influences tilt error, its effect can be neglected when the slope is less than 5°, as confirmed by bathymetric surveys showing a gently sloping seabed (18–18.5 m water depth variation) within the aquaculture net pen area. The analysis conservatively adopts ±5° tilt and 7.5° directional errors despite project specifications permitting only ±2° tilt and ±3° directional deviations during construction. The ultimate bearing capacity safety factor is derived from load–displacement curves under the most critical scenario, evaluated through a four-stage analytical approach (Figure 5):
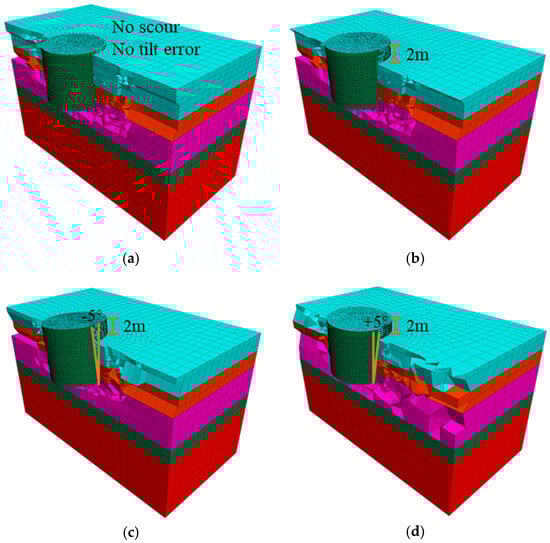
Figure 5.
3D modeling of foundation and surrounding soils under different scouring and tilt error conditions. (a) Foundation under 0 m scour condition; (b) foundation under 2 m scour condition; (c) foundation with 2 m scour and −5° tilt error; (d) foundation with 2 m scour and +5° tilt error.
(1) Comparison of seabed scouring conditions (0 m vs. 2 m);
(2) Assessment of tilt effects (−5° forward tilt toward net pens vs. +5° backward tilt) post-scour;
(3) Incorporation of 7.5° directional error atop the critical tilt–scour combination; and
(4) Determination of safety factors via load–displacement curves.
The worst-case scenario identification employs 10-year ULS loads amplified by a 2.0 safety factor (16,679.48 kN pad-eye force = 2.0 × 8,339.74 kN), with Figure 4 illustrating the 3D numerical models for scour and tilt conditions (directional error simulations involve only load component adjustments without geometric model alterations).
4.1.3. Calculation Results
- (a)
- Scour Impact Analysis
Under the 10-year ULS condition (with a 2.0 bearing capacity safety factor), numerical simulations were conducted for 0 m and 2 m seabed scour scenarios. Figure 6 (a) shows that with 0 m scour, the suction anchor exhibits backward tilting (5.0 cm pad-eye displacement, 5.67 cm soil displacement) with localized plastic zones while maintaining solution convergence. At 2 m scour, shown in Figure 6 (b), displacements increase significantly (7.5 cm pad-eye, 8.78 cm soil) with expanded plastic zones, confirming scour depth as a critical adverse factor for foundation performance. The observed capacity reduction under a 2 m scour depth in this study (approximately 18–20%) aligns well with results reported by Randolph and Gourvenec (2011) and Zhou et al. (2023), who found 15–25% reductions in ultimate capacity for caisson foundations in similar silt–sand conditions [7,12]. This agreement validates the numerical modeling approach and confirms that the adopted scour depth range represents a realistic long-term design scenario for the Sheyang site.
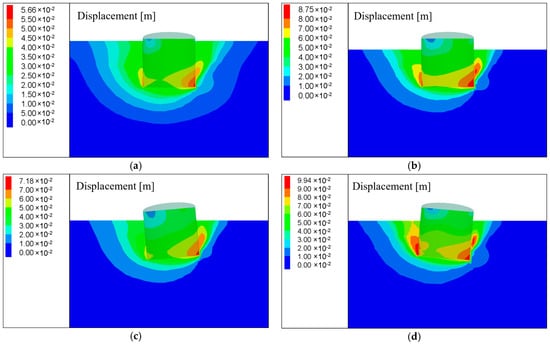
Figure 6.
Deformation of surrounding soils under different conditions based on numerical simulations for 10-year ULS conditions (safety factor 2.0): (a) 0 m scour, causing backward tilting with 5.0 cm pad-eye and 5.67 cm soil displacements, respectively; (b) 2 m scour, amplifying displacements to 7.5 cm (pad-eye) and 8.78 cm (soil); (c) 2 m scour with a −5° tilt error, resulting in displacements of 6.5 cm (pad-eye) and 7.18 cm (soil); (d) 2 m scour with a +5° tilt error, resulting in displacements of 9.1 cm (pad-eye) and 9.94 cm (soil).
- (b)
- Tilt Installation Error Effects
Building on the 2 m scour condition, ±5° tilt errors were analyzed. Forward tilt (−5°), shown in Figure 6c, reduces displacements (6.5 cm pad-eye, 7.18 cm soil) compared to vertical installation, while backward tilt (+5°), shown in Figure 6d, exacerbates deformations (9.1 cm pad-eye, 9.94 cm soil) with pronounced plastic zones. This establishes backward tilt as the governing unfavorable scenario, demonstrating 26% higher displacements than the no-tilt case.
- (c)
- Combined Directional Error Assessment
The critical 2 m scour with +5° backward tilt was further analyzed with a 7.5° directional error, as shown in Figure 7. Results reveal severe displacements (13.2 cm pad-eye, 15.1 cm soil) and extensive plasticity, yet the model achieves convergence. This represents the most adverse operational case, exhibiting 76% greater pad-eye displacement than baseline scour conditions while still satisfying DNV safety requirements through controlled plastic zone development.
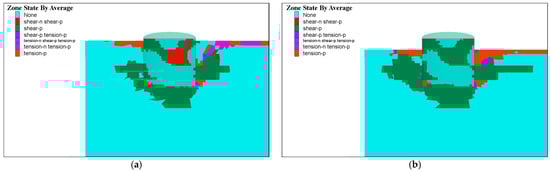
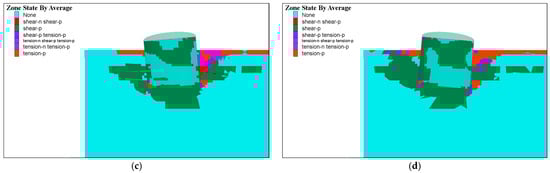
Figure 7.
Plastic zones in surrounding soils under varying conditions from numerical simulations with 10-year ULS loading (safety factor 2.0), illustrating progressive expansion: (a) foundation under 0 m scour condition; (b) foundation under 2 m scour condition; (c) foundation with 2 m scour and −5° tilt error; (d) foundation with 2 m scour and +5° tilt error.
4.1.4. Safety Factor of Bearing Capacity Under the Most Adverse Conditions
The integrated assessment of scour effects (0 m vs. 2 m), tilt installation errors ( ±5°), and directional deviation (7.5°) confirms that the most critical condition occurs under 2 m scour with combined +5° backward tilt and 7.5° directional misalignment, yielding maximum displacements of 13.2 cm (pad-eye) and 15.1 cm (soil) as shown in Table 4. The load–displacement curve (Figure 8) identifies 18,000 kN as the ultimate mooring capacity, beyond which rapid displacement escalation indicates failure.
Table 4.
Displacement of different load-bearing cases.
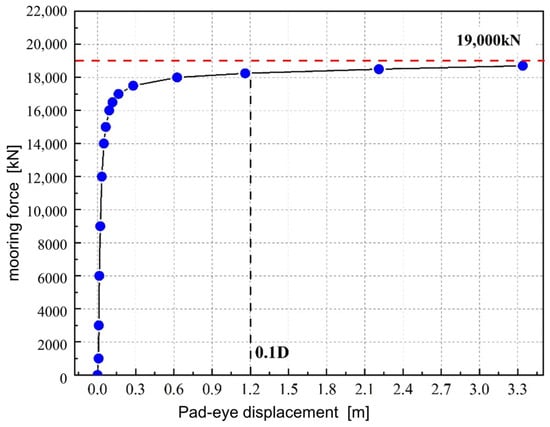
Figure 8.
Load–displacement curve at pad-eye of suction anchor foundation.
Under the 10-year return period scenario (Table 5), the suction anchor foundation demonstrates compliant safety margins: ULS conditions achieve a safety factor of 2.158 (>2.0 requirement), while ALS conditions attain 1.569 (>1.5 threshold). These margins persist even when applying the standard’s maximum mooring force limits (ULS: 2.048; ALS: 1.533), validating adherence to CCS specifications for mobile offshore aquaculture platforms. The results underscore the necessity of controlling scour depth and installation tolerances to ensure structural integrity.
Table 5.
Safety factors of different load-bearing cases.
4.2. Structural Analysis of Suction Anchor Foundations
4.2.1. Pad-Eye Structural Design and Loads
The mooring chain used in this project is R3 studless with a nominal diameter of 147 mm, an in-air mass of 436.50 kg/m, and a minimum breaking load (MBL) of 15,536 kN. The corresponding terminal pad-eye was selected with dimensions shown in Figure 2.
Since CCS standards do not specify pad-eye strength verification criteria, this study adopts DNV standards for assessment. According to DNV-OS-E301 (Position Mooring) and DNV-OS-C101 (Design of Offshore Steel Structures, General—LRFD Method), pad-eye strength verification must consider the chain breaking load with a load factor of 1.1. Given the fine mesh density in the local model, CCS (Rules for Classification of Mobile Offshore Units) permits the use of equivalent average stress over an area comparable to a 50 mm × 50 mm mesh for comparison with allowable stress. The stress control criteria are summarized in Table 6.
Table 6.
Stress control criteria for the pad-eye structure of suction anchor foundations.
4.2.2. Pad-Eye Structural Design Conditions
Following DNV-OS-E301 and DNV-OS-C101, the installation accuracy of suction anchors is critical. However, real-world conditions (e.g., complex seabed geology, construction constraints, and equipment limitations) introduce unavoidable tilt (±5°) and directional (7.5°) installation errors that affect pad-eye strength. The design conditions for pad-eye strength analysis are summarized in Table 7.
Table 7.
Summary of design conditions for pad-eye structure.
4.2.3. Pad-Eye Structural Strength Numerical Simulation
The pad-eye structural strength was numerically evaluated using solid element modeling with conservative fixed constraints at the edges as shown in Figure 9. Two loading approaches were implemented: uniform load distribution through a central reference point (demonstrating low, evenly distributed stresses) and detailed shackle pin contact modeling (revealing localized stress concentrations). The refined mesh (25 mm element size, 20,552 elements) ensured accurate stress characterization while maintaining computational efficiency.
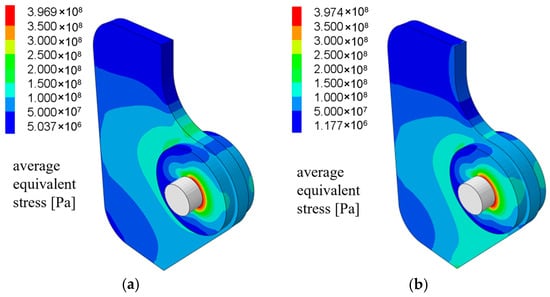
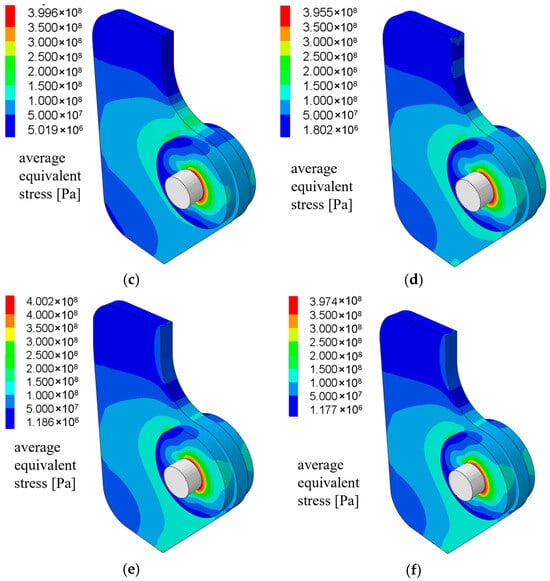
Figure 9.
Equivalent stress distributions in the pad-eye under uniform loading (17,089.6 kN tension at a 22.20° initial angle) from solid-element simulations (25 mm mesh, 20,552 elements) with fixed edge constraints: (a) Case 1–1 (0° tilt, 0° directional error); (b) Case 1–2 (0° tilt, 75° directional); (c) Case 2–1 ( +5° tilt, 0° directional); (d) Case 2–2 ( +5° tilt, 7.5° directional); (e) Case 3–1 (−5° tilt, 0° directional); (f) Case 3–2 (−5° tilt, 7.5° directional). All cases show stresses below the 319.5 MPa allowable limit after CCS averaging, confirming compliance with DNV/CCS standards even under installation tolerances.
Analysis of all design conditions showed general stress levels below the 319.5 MPa allowable limit, though localized pin-contact stresses exceeded this threshold. Applying CCS averaging methods over 50 mm × 50 mm areas confirmed compliance, with all cases exhibiting average equivalent stresses between 315 and 317 MPa. The worst-case scenario (7.5° directional + 5° tilt errors) maintained a 1.3% safety margin below the allowable stress.
The pad-eye structure fully satisfies DNV and CCS requirements across all operational conditions, demonstrating robust performance even with installation tolerances. Stress concentrations are limited to noncritical zones, while the primary load-bearing regions sustain stresses at 89–90% of the yield strength (355 MPa). This verification confirms the design’s adequacy for 10-year ULS/ALS conditions with inherent safety reserves.
4.3. Lifting Analysis of Suction Anchor Foundation
4.3.1. Lifting Arrangement Design
The suction anchor is lifted using a four-point arrangement, with slings inclined at 60° to the top cover. The lifting lugs are integrated with the main beams of the top cover and designed as trunnion-type pad-eyes, as shown in Figure 10a. A similar on-site lifting configuration is illustrated in Figure 10b.
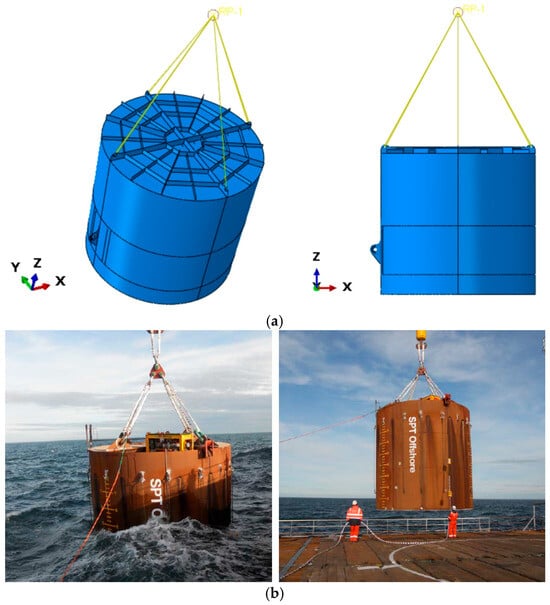
Figure 10.
3D modeling and on-site lifting of the suction anchor foundation: (a) 3D simulation of the process; (b) actual lifting of the suction anchor foundation.
4.3.2. Safety Standards and Load Factors
Per DNV-ST-N001 (Marine Operations and Marine Warranty), the lifting analysis incorporates dynamic amplification (DAF = 1.25), self-weight factor (1.1), and safety factor (1.3), resulting in a combined lifting factor of 1.7875. A 3% lateral load was also considered (Table 8).
Table 8.
Lifting load factors for suction anchor.
4.3.3. Numerical Simulation Analysis of Lifting Conditions
Finite element analysis was used to evaluate the structural strength of the lifting lugs and suction anchors under hoisting loads as shown in Figure 11 and Table 9. The applied loads incorporated the combined lifting factor (1.7875), with fixed constraints at the lifting points. Stress distribution confirmed that all components—main bucket structure (46.38 MPa), internal stiffeners (67.89 MPa), and top cover stiffeners (82.05 MPa)—exhibited stresses well below the allowable limit (319.82 MPa), validating compliance with design and regulatory standards.
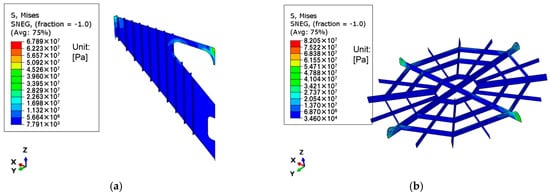
Figure 11.
Equivalent stress distributions in the suction anchor structure under hoisting loads (combined lifting factor 1.7875, fixed constraints at lifting points) from finite element analysis: (a) internal bucket structure (max. 67.89 MPa in stiffeners); (b) top bucket structure (max. 82.05 MPa in cover stiffeners). All components, including the main bucket (46.38 MPa), remain well below the 319.82 MPa allowable limit, confirming compliance with design and regulatory standards.
Table 9.
Stress summary under lifting conditions.
4.4. Fatigue Analysis of Suction Anchor Foundation
4.4.1. Fatigue Damage Calculation
According to the Guidelines for Fatigue Strength Assessment of Marine Structures (CCS), cumulative fatigue damage is computed using the Palmgren–Miner linear cumulative damage theory. This theory assumes that the rate of cumulative damage at any given stress level is independent of prior loading history, and the loading sequence does not affect the calculated fatigue life. The fatigue damage under long-term stress can be expressed as:
where:
- D = cumulative fatigue damage;
- k = number of stress blocks;
- ni = number of stress cycles in the ith stress block;
- = number of cycles to failure under constant-amplitude stress range Si;
- = fatigue safety factor.
The stress range S and corresponding number of cycles Ni are determined using S–N curves. This study employs a bilinear S–N curve (Figure 12), with the following governing equations:
where:
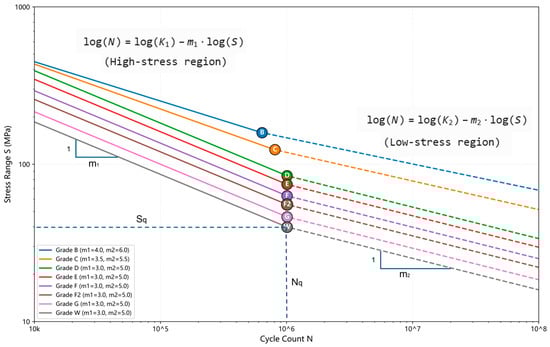
Figure 12.
S–N curves for fatigue analysis (DNVGL-RP-C203).
- N = predicted number of cycles to failure under stress range S;
- S = stress range;
- m1 and m2 are the slope of the S–N curve;
- log(K1) and log(K2) are the intercept of the S–N curve on the log(N) axis.
The S–N curves were selected in accordance with CCS Guidelines for Fatigue Strength Assessment of Marine Structures. For the pad-eye structure, the Class B S–N curve was applied. For all other regions—primarily butt welds and T-joint welds between stiffeners and the bucket shell/top cover (all double-sided, full-penetration groove welds)—the more conservative Class D S–N curve was adopted. Given the foundation’s marine-grade heavy-duty coating and sacrificial anode cathodic protection system, the S–N curves for seawater with effective cathodic protection, as illustrated in Figure 12, were used in the fatigue analysis.
4.4.2. Fatigue Analysis by Structural Zone
Critical structural regions of the suction anchor foundation include the bucket main structure and the pad-eye assembly. Based on weld distribution and structural analysis, fatigue assessment focuses on the pad-eye and the weld between the pad-eye and bucket shell. The fatigue assessment was conducted by applying equivalent fatigue tension loads at the pad-eye to determine principal stress distribution and fatigue damage in critical regions. The simulation results show:
- Pad-eye Structure: Under fatigue loading, the maximum principal stress reached 1.247 MPa (Figure 13), resulting in extremely low fatigue damage of 1.04×10⁻¹¹, well below the allowable limit of 1.0. The Class B S–N curve was applied, and the design fatigue safety factor of 3 was satisfied (Table 10).
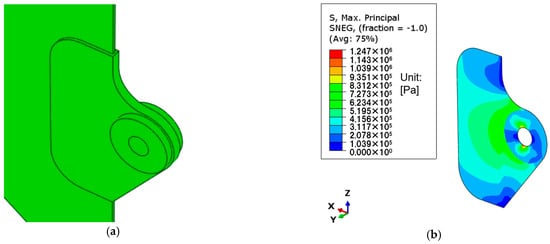 Figure 13. Principal stress of the pad-eye structure under fatigue loading conditions: (a) 3D model of pad-eye; (b) fatigue analysis of pad-eye.
Table 10. Fatigue damage assessment of pad-eye and weld joint zones.
Figure 13. Principal stress of the pad-eye structure under fatigue loading conditions: (a) 3D model of pad-eye; (b) fatigue analysis of pad-eye.
Table 10. Fatigue damage assessment of pad-eye and weld joint zones. - Pad-eye to Bucket Weld Joints: Two weld zones exhibited maximum principal stresses of 0.556 MPa and 0.458 MPa (Figure 14). The calculated fatigue damage values (4.30 × 10⁻¹⁰ and 1.63 × 10⁻¹⁰, respectively) are negligible and comply with the Class D S–N curve, with a safety factor of 3 (Table 10).
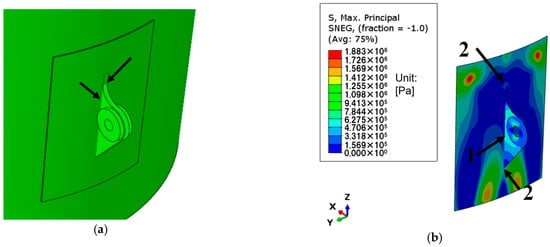 Figure 14. Principal stress at the welded connection between pad-eye and bucket under fatigue loading conditions: (a) 3D model of the welded connection; (b) fatigue analysis of the welded connection.
The predicted fatigue damage values in this study (10−10–10−11 range) are consistent with or lower than those observed in offshore jackets and floating wind foundations with similar welded joint classifications. Lotsberg (2016) reported fatigue damage on the order of 10−9–10−10 for comparable steel categories under North Sea conditions [15]. The lower damage in the present study reflects the moderate sea state and effective cathodic protection adopted in the design, further supporting the structural reliability of the suction anchor foundation.
5. Discussion and Conclusions
This study presents a comprehensive design and performance evaluation of suction anchor foundations for the Jiangsu Sheyang Wind–Solar–Fishery Integrated Marine Ranching Project. The four-point mooring system, using 12 m diameter suction anchors, meets all safety criteria under CCS codes, with safety factors of 2.16 (ULS) and 1.57 (ALS). Numerical analyses with FLAC3D (version 9) and ABAQUS (version 2024) indicate that seabed scour (≤2 m) and installation deviations (±5° tilt, 7.5° directional error) notably affect anchor behavior, while pad-eye stresses remain below allowable limits (≈315 MPa) and fatigue damage is negligible, ensuring a 22-year service life. Lifting analysis confirms structural integrity under a combined lifting factor of 1.79.
Compared with conventional oil-platform or monopile anchors, the integrated renewable–aquaculture platform exhibits greater sensitivity to scour and tilt, mainly due to shallower embedment and asymmetric mooring geometry. Hydrodynamic drag from aquaculture cages adds fluctuating loads to the mooring system, distinguishing it from single-purpose offshore designs. Extended numerical trials suggest that deeper scour (3–4 m) could reduce capacity by 15–20%, with cyclic degradation causing a further 8–10% stiffness loss. These findings help refine tolerable scour depth and installation deviation limits, supporting future revisions to DNV-OS-E301 and CCS offshore foundation codes. A pilot verification at the Jiangsu demonstration farm is planned to validate the results under real marine conditions.
From an environmental perspective, integrated systems may induce localized seabed disturbance, corrosion product dispersion, and nutrient accumulation from aquaculture operations. Mitigation strategies—such as biocompatible coatings, silt curtains, and controlled feeding—are recommended to ensure sustainable development.
Future work should focus on improving predictions of penetration resistance for interbedded silt–sand foundations, quantifying long-term scour and cyclic effects, and developing real-time monitoring and correction of installation deviations. Refining fatigue life models and multi-physics simulations will further enhance the safety, durability, and scalability of integrated offshore renewable–aquaculture platforms.
Author Contributions
Conceptualization, Y.C. and P.G.; methodology, B.W. and Z.J.; software, B.H. and W.C.; validation, G.X. and R.S.; formal analysis, X.G. and J.Z.; investigation, Q.M.; resources, P.G.; data curation, Y.C.; writing—original draft preparation, Y.C.; writing—review and editing, P.G. and B.W.; visualization, Z.J.; supervision, Y.C.; project administration, P.G. All authors have read and agreed to the published version of the manuscript.
Funding
This research received no external funding.
Data Availability Statement
The original data presented in this study is available on request from the corresponding author.
Acknowledgments
The authors would like to thank the colleagues from HDEC, HIC and PowerChina for their technical support and insightful discussions.
Conflicts of Interest
P.G., B.W., Z.J., B.H., G.X. and R.S. are employees of Power China Huadong Engineering Co, Ltd.; W.C. is an employee of Hydro-China Itasca R&D Center; Y.C. and X.G. are employees of Power China Huadong Engineering Co., Ltd. and Hydro-China Itasca R&D Center; J.Z. is an employee of Power China Beijing Engineering Co., Ltd. The other authors declare no conflicts of interest.
References
- Dai, G.L.; Zhu, W.B.; Gong, W.M.; Zhu, M.X.; Wan, Z.H. Model tests on uplift bearing capacity of gravitational reinforced composite suction caisson foundation. Chin. J. Geotech. Eng. 2020, 42, 1612–1621. [Google Scholar]
- Gomez Bautista, D.A. Cyclic Loading of Suction Caisson Anchors for Offshore Renewable Devices. Master’s Thesis, The University of Western Australia, Perth, Australia, 2017. [Google Scholar]
- Chen, Y.-H.; Yang, R.-Y. Study on Array Floating Platform for Wind Energy and Marine Space Optimization. Sustainability 2021, 13, 14014. [Google Scholar] [CrossRef]
- Mohiuddin, M.A.; Hossain, M.S.; Kim, Y.H.; Hu, Y.; Ullah, S.N. Insight into the Behavior of a Caisson Anchor under Cyclic Loading in Calcareous Silt. J. Geotech. Geoenviron. Eng. 2022, 148, 04022047. [Google Scholar] [CrossRef]
- Pillai, A.; Gordelier, T.; Thies, P.; Dormenval, C.; Wray, B.; Parkinson, R.; Johanning, L. Anchor loads for shallow water mooring of a 15 MW floating wind turbine—Part I: Chain catenary moorings for single and shared anchor scenarios. Ocean Eng. 2022, 266, 111816. [Google Scholar] [CrossRef]
- Det Norske Veritas. Determination of Structural Capacity by Non-Linear Finite Element Analysis Methods (DNVGL-RP-C208); DNV: Høvik, Norway, 2019; Available online: https://www.dnv.com/energy/standards-guidelines/dnv-rp-c208-determination-of-structural-capacity-by-non-linear-finite-element-analysis-methods/ (accessed on 30 September 2024).
- Randolph, M.F.; Gourvenec, S. Offshore Geotechnical Engineering; CRC Press: Boca Raton, FL, USA, 2011. [Google Scholar] [CrossRef]
- Zhou, Z.; O’Loughlin, C.D.; White, D.J.; Stanier, S.A. Improvements in plate anchor capacity due to cyclic and maintained loads combined with consolidation. Geotechnique 2020, 70, 732–749. [Google Scholar] [CrossRef]
- Sumer, B.; Whitehouse, R.J.; Tørum, A. Scour around coastal structures: A summary of recent research. Coast. Eng. 2001, 44, 153–190. [Google Scholar] [CrossRef]
- Andersen, K.H.A. Bearing capacity under cyclic loading—Offshore, along the coast, and on land. The 21st Bjerrum Lecture presented in Oslo, 23 November 2007. Can. Geotech. J. 2009, 46, 513–535. [Google Scholar] [CrossRef]
- Wang, L.; Zhang, T.; Cheng, X.; Xu, W.; Shen, Z.; Rui, S.; Tian, Y. Numerical investigation on the suction caisson response considering seabed trenches and cyclic loading. Ocean Eng. 2024, 315, 119839. [Google Scholar] [CrossRef]
- Zhou, M.; Yang, N.; Tian, Y.; Zhang, X. Inclined Pullout Capacity of Suction Anchors in Clay over Silty Sand. J. Geotech. Geoenviron. Eng. 2023, 149, 104549. [Google Scholar] [CrossRef]
- Cao, D.; Jiang, X.; Wu, H.; Qiang, X. Fatigue analysis of offshore steel structures: A systematic review. Structures 2025, 79, 109489. [Google Scholar] [CrossRef]
- Li, W.J.; Zhang, Q.; Liao, C.C.; Zhou, X.L.; Liu, C.C. Numerical analysis of local scour and protection of a single pile around a seabed under solitary wave and current. J. Shanghai Jiao Tong Univ. 2021, 55, 631–637. [Google Scholar]
- Lotsberg, I. Fatigue Design of Marine Structures; Cambridge University Press: Cambridge, UK, 2016. [Google Scholar]
- Ghorai, B.; Chatterjee, S. Estimation of Installation Resistance and Subsequent Short-Term Capacities of Offshore Skirted Foundations in Clay. Int. J. Géoméch. 2020, 20, 04020133. [Google Scholar] [CrossRef]
- Zhang, Y.; Chen, Y.; Li, D.; Hou, X.; Lai, Y. Lateral bearing characteristics of modified suction caisson embedded in layered soil. Appl. Ocean Res. 2025, 158, 104572. [Google Scholar] [CrossRef]
- Det Norske Veritas. Fatigue Design of Offshore Steel Structures (DNVGL-RP-C203); DNV: Høvik, Norway, 2014; Available online: https://www.dnv.com/energy/standards-guidelines/dnv-rp-c203-fatigue-design-of-offshore-steel-structures/ (accessed on 30 January 2025).
- Moan, T. Fatigue Reliability of Marine Structures, From the Alexander Kielland Accident to Life Cycle Assessment. Int. J. Offshore Polar Eng. 2007, 17, 1–21. [Google Scholar]
- Houlsby, G.T.; Byrne, B.W. Design procedures for installation of suction caissons in sand. Proc. Inst. Civ. Eng.-Geotech. Eng. 2005, 158, 135–144. [Google Scholar] [CrossRef]
- Zhang, P.; Mu, L.; Lu, Y.; Huang, M.; Sun, J. Microscopic insights into suction bucket installation in sand: Coupled coarse-grained CFD-DEM simulations. Comput. Geotech. 2024, 167, 106060. [Google Scholar] [CrossRef]
- Xu, W.; Wu, K.; Luo, H.; Liu, Z.; Dou, Z.; Hao, D. Uplift Performance of Suction Foundations in Sandy Soils for Offshore Platforms. Geotech. Geol. Eng. 2023, 42, 2845–2859. [Google Scholar] [CrossRef]
- Herduin, M. Multi-Directional Loading on Shared Anchors for Offshore Renewable Energy: Definition and Preliminary Investigation into Soil Behaviour and Anchor Performance. Doctoral Thesis, The University of Western Australia, Perth, Australia, 2019. [Google Scholar]
- Jimenez-Martinez, M. Fatigue of offshore structures: A review of statistical fatigue damage assessment for stochastic loadings. Int. J. Fatigue 2020, 132, 105327. [Google Scholar] [CrossRef]
- NB/T 31006-2011; Technical Code for Anticorrosion of Offshore Wind Farm Steel Structures. National Energy Administration of China (NEA): Beijing, China, 2011. Available online: https://std.samr.gov.cn/hb/search/stdHBDetailed?id=8B1827F1FEA9BB19E05397BE0A0AB44A (accessed on 30 October 2024). (In Chinese)
- GB 50007-2011; Code for Design of Building Foundation. Ministry of Housing and Urban-Rural Development of China (MOHURD): Beijing, China, 2011. Available online: https://ebook.chinabuilding.com.cn/zbooklib/bookpdf/probation?SiteID=1&bookID=61019 (accessed on 30 October 2024). (In Chinese)
- SY/T 10030-2018; Recommended Practice for Planning, Design, and Constructing of Offshore Fixed Platforms—Working Stress Design. National Energy Administration of China (NEA): Beijing, China, 2018. Available online: https://ebook.chinabuilding.com.cn/zbooklib/book/detail/show?SiteID=1&bookID=140210 (accessed on 30 October 2024). (In Chinese)
- Tola, S.; Tinoco, J.; Matos, J.C.; Obrien, E. Scour Detection with Monitoring Methods and Machine Learning Algorithms—A Critical Review. Appl. Sci. 2023, 13, 1661. [Google Scholar] [CrossRef]
- Tang, D.; Zhao, M. Real-time monitoring system for scour around monopile foundation of offshore wind turbine. J. Civ. Struct. Heal. Monit. 2021, 11, 645–660. [Google Scholar] [CrossRef]
- FLAC3D Version 9, Itasca Consulting Group Inc.: Minneapolis, MN, USA, 2024.
- ABAQUS/CAE, Dassault Systèmes Simulia Corp.: Providence, RI, USA, 2024.
Disclaimer/Publisher’s Note: The statements, opinions and data contained in all publications are solely those of the individual author(s) and contributor(s) and not of MDPI and/or the editor(s). MDPI and/or the editor(s) disclaim responsibility for any injury to people or property resulting from any ideas, methods, instructions or products referred to in the content. |
© 2025 by the authors. Licensee MDPI, Basel, Switzerland. This article is an open access article distributed under the terms and conditions of the Creative Commons Attribution (CC BY) license (https://creativecommons.org/licenses/by/4.0/).