Article

Numerical Study of Blast Load Acting on Typical Precast Segmental Reinforced Concrete Piers in Near-Field Explosions

1
State Key Lab of Explosion, Impact, Disaster Prevention and Mitigation, Army Engineering University of PLA, Nanjing 210007, China
2
Postdoctoral Research Station of Civil Engineering, Army Engineering University of PLA, Nanjing 210007, China
3
Engineering Research Center of Safety and Protection of Explosion & Impact of Ministry of Education, Southeast University, Nanjing 211189, China
*
Author to whom correspondence should be addressed.
CivilEng 2025, 6(4), 53; https://doi.org/10.3390/civileng6040053
Submission received: 12 August 2025 / Revised: 14 September 2025 / Accepted: 26 September 2025 / Published: 2 October 2025
(This article belongs to the Section Mathematical Models for Civil Engineering)

Abstract

Explosions, including those from war weapons, terrorist attacks, etc., can lead to damage and overall collapse of bridges. However, there are no clear guidelines for anti-blast design and protective measures for bridges under blast loading in current bridge design specifications. With advancements in intelligent construction, precast segmental bridge piers have become a major trend in social development. There is a lack of full understanding of the anti-blast performance of precast segmental bridge piers. To study the engineering calculation method for blast load acting on a typical precast segmental reinforced concrete (RC) pier in near-field explosions, an air explosion test of the precast segmental RC pier is firstly carried out, then a fluid–structure coupling numerical model of the precast segmental RC pier is established and the interaction between the explosion shock wave and the precast segmental RC pier is discussed. A numerical simulation of the precast segmental RC pier in a near-field explosion is conducted based on a reliable numerical model, and the distribution of the blast load acting on the precast segmental RC pier in the near-field explosion is analyzed. The results show that the reflected overpressure on the pier and the incident overpressure in the free field are reliable. The simulation results are basically consistent with the experimental results (with a relative error of less than 8%), and the fluid–structure coupling model is reasonable and reliable. The explosion shock wave has effects of reflection and circulation on the precast segmental RC pier. In the near-field explosion, the back and side blast loads acting on the precast segmental RC bridge pier can be ignored in the blast-resistant design. The front blast loads can be simplified and equalized, and a blast-resistant design load coefficient (1, 0.2, 0.03, 0.02, and 0.01) and a calculation formula of maximum equivalent overpressure peak value (applicable scaled distance [0.175 m/kg1/3, 0.378 m/kg1/3]) are proposed, which can be used as a reference for the blast-resistant design of precast segmental RC piers.

1. Introduction

Bridge structures are inevitably subjected to natural disasters and accidents during operation, including explosion threats. The main explosion threat comes from vehicle explosions, such as from car bombs during terrorist attacks or accidental explosions of hazardous chemical carriers. Explosions can cause partial damage or overall collapse of bridge structures. However, current domestic and international bridge design specifications [1,2] have not provided clear requirements for the blast-resistant design of bridge structures.
Thus far, researchers have investigated the explosion resistance of cast-in-place reinforced concrete (RC) bridge piers [3,4,5,6,7,8]. The U.S. Army Engineering Research and Development Center conducted experimental research on the explosion damage mechanisms and dynamic responses of highway bridge piers and proposed explosion protection measures for highway bridges [9,10,11,12]. Fujikura and Bruneau [4,13] conducted explosion tests on reinforced concrete bridge piers with earthquake resistance requirements. The results showed that the piers underwent base shear failure under explosion loads. Yi et al. [14,15,16]. conducted numerical simulation studies of explosions under reinforced concrete bridges, and the results showed that there are six different failure mechanisms for bridge piers, namely, erosion and peeling of concrete at the bottom of the pier, shear failure at the base of the pier, steel bar cutting, overall failure of the pier column, surface concrete peeling, and plastic hinge formation. Zong et al. [5,6,7,17] conducted explosion tests on RC bridge piers and piers with different forms of protection. The results showed that contact explosion caused shear damage to the piers and that external steel plate and carbon fiber cloth reinforcement improved their explosion resistance. Echevarria et al. [18] conducted explosion tests on FRP-reinforced pier columns, and the results showed that strengthening pier columns can reduce bending deformation and increase residual bearing capacity after explosions. Mutalib et al. [19] simulated and analyzed the reinforcement of RC pier columns with FRP, considering parameters such as FRP thickness. The results showed that FRP effectively reduced the residual displacement and failure of transverse pier columns and could improve the blast resistance performance of RC pier columns. Remennikov et al. [20] conducted near-field explosion tests and contact explosion tests on square steel reinforced concrete columns, and the results also showed that steel pipes can improve the blast resistance performance of pier columns. Zhang et al. [21] conducted blast resistance research on hollow steel tube concrete cylinders and square columns, considering the effects of outer steel tube thickness, inner steel tube thickness, and hollow ratio on hollow steel tube concrete. The results showed that the influence of outer steel tubes was greater than that of inner steel tubes, and the blast resistance performance of pier columns was weakened when the hollow ratio was greater than 0.5.
Compared with cast-in-place piers, segmental piers [22,23,24,25] (Figure 1) have garnered widespread attention owing to their precise factory production and rapid assembly-based construction [20]. Based on the “multi-hazard” design concept [26], segmental piers should not only have seismic performance but also good blast resistance. Hao et al. [27,28,29] began to explore the blast resistance of precast segmental bridge piers under explosive loads. They analyzed precast segmental RC piers with square cross-sections using Ls-Dyna software and concluded that precast segmental piers could dissipate explosion energy through the openings and relative angles between segments. Zhang et al. [30,31,32] conducted numerical simulations to analyze the blast resistance of RC segmental piers. They revealed the damage and failure mechanisms of segmental piers under explosion loads by changing the equivalent and distance of explosive loads. The research results showed that segmental bridge piers mainly exhibited shear failure and local failure. The large turning angles and displacements are generated between segments, causing lateral displacement of pier columns and weakening of segment sections. Pham and Do [33] analyzed the dynamic response and damage mechanisms of steel tube segmental piers under explosive loads through numerical simulations. The steel tubes could effectively protect the concrete and improve the blast resistance of the segmental piers. This study found that stress waves propagated along the height direction in the pier, and the sections blocked the propagation of strain waves. The deformation of a segment consisted of two stages, which manifested as compression of stress waves in concrete and tension of reflected waves, with failure usually occurring during the tension stage of reflected waves. Due to the limiting effect of steel pipes in concrete segments, they could effectively protect the concrete from peeling off due to the reflected wave tension, further transferring the local failure of concrete segments to the overall bending deformation of the pier, accompanied by the fracture of post-tensioned prestress. The fragmentation of the segment near the explosive will cause the overall collapse of the pier. Liu et al. [34,35,36] analyzed the effects of different parameters on the blast resistance of precast segmental RC piers through explosion experiments and numerical simulations. The local punching and cutting damage occurred in the bottom section of the segmental pier, and vertical cracks developed in the upper section when the explosive was detonated at the bottom of the column. The segmental pier experienced overall bending failure, characterized by typical bending deformation and detachment of the concrete protective layer in the middle section of the column, the development of vertical cracks in other sections, and concrete crushing when the explosive was detonated at the middle of the column. Meanwhile, increasing the number of segments could reduce the local residual deformation of the pier. The connection between rectangular shear keys and energy-absorbing steel bars between segments could reduce local residual deformation in the near-explosion zone of the pier, decrease concrete spalling, and reduce vertical cracks between segments. Increasing the initial axial pressure could reduce the overall residual deformation of segmental piers and alleviate vertical cracks between segments. Reducing the aspect ratio could improve the stiffness of the segmental piers and reduce the overall residual deformation of the pier. Ma et al. [37] studied the influence of factors such as the segmental number, the initial prestress, the shear keys, the energy-absorbing steel bars, and the explosion distance on the blast resistance performance of precast reinforced concrete bridge piers.
The explosion loads experienced by segmental piers have significant randomness. The structural dynamic responses and failure modes vary under different explosion conditions. Currently, there is no unified design load standard for the blast resistance of bridges. An accurate application of explosion loads is a prerequisite for research on blast-resistant protection of bridge piers. In 1949, the US Army released the technical manual “TM5-855-1”, which established the basic calculation method for explosive shock waves [38]. In 1969, the United States Navy, Army, and Air Force Command published the “Anti Accidental Explosion-Structural Design Manual” (TM5-1300), which detailed the selection of explosive loads, the dynamic response of components under explosive loads, and the basic methods of component anti-explosion design [39]. In 2008, the US Department of Defense published a unified facility standard titled “Structural Resistance to Accidental Explosion Effects (UFC 3-340-02)” by integrating relevant regulations from the Navy and Army [40]. Only the U.S. AASHTO LRFD [1] bridge code incorporates blast resistance-related details based on the NCHRP 645 [3] report. According to this code, blast design should consider factors such as the quantity of explosives and the distance of the explosion. However, there are no specific analysis methods. Henry et al. [41], Brode [42], Yang et al. [43], Lin et al. [44], and Zhang et al. [45] proposed corresponding prediction formulae for the explosion loads. These load models are based on the assumption of an infinite reflective surface for the interaction between the shock wave and the structure. The uniform load on the large plane calculated simultaneously is obtained through fitting, and there is no unified calculation method for building structures. However, for slender components, such as bridge piers, explosion loads are affected by shock wave diffraction, reflection, and other factors. NCHRP 645 [3] reported that the blast load could be used for the vertical distribution of triangles for blast design for a bridge pier when a vehicle bombing is at the bottom of the pier. This method is just for the integral poured pier, but it is definitely inappropriate and inaccurate for a precast segmental bridge pier, which requires consideration of its independence of segments. Hence, it is necessary to explore the distribution of explosion loads on the surface of bridge piers and develop engineering calculation methods for precast segmental bridge piers. Such efforts can help provide a basis for blast-resistant protection design of bridge piers.
With this background, free field blast experiments and numerical simulations were conducted on segmental precast RC bridge piers in this study. The aim was to explore the interaction between shock waves and segmental precast RC bridge piers. Based on a reliable numerical model of the fluid–structure interaction, numerical simulations on segmental precast RC bridge piers subjected to near-field explosions were conducted. This study analyzed the blast load distribution patterns on the segmental precast RC bridge piers under near-field explosive conditions. With the results obtained, an engineering calculation method for blast loads acting on typical segmental RC piers during near-field explosions was developed.

2. Blast Test

2.1. Test Overview

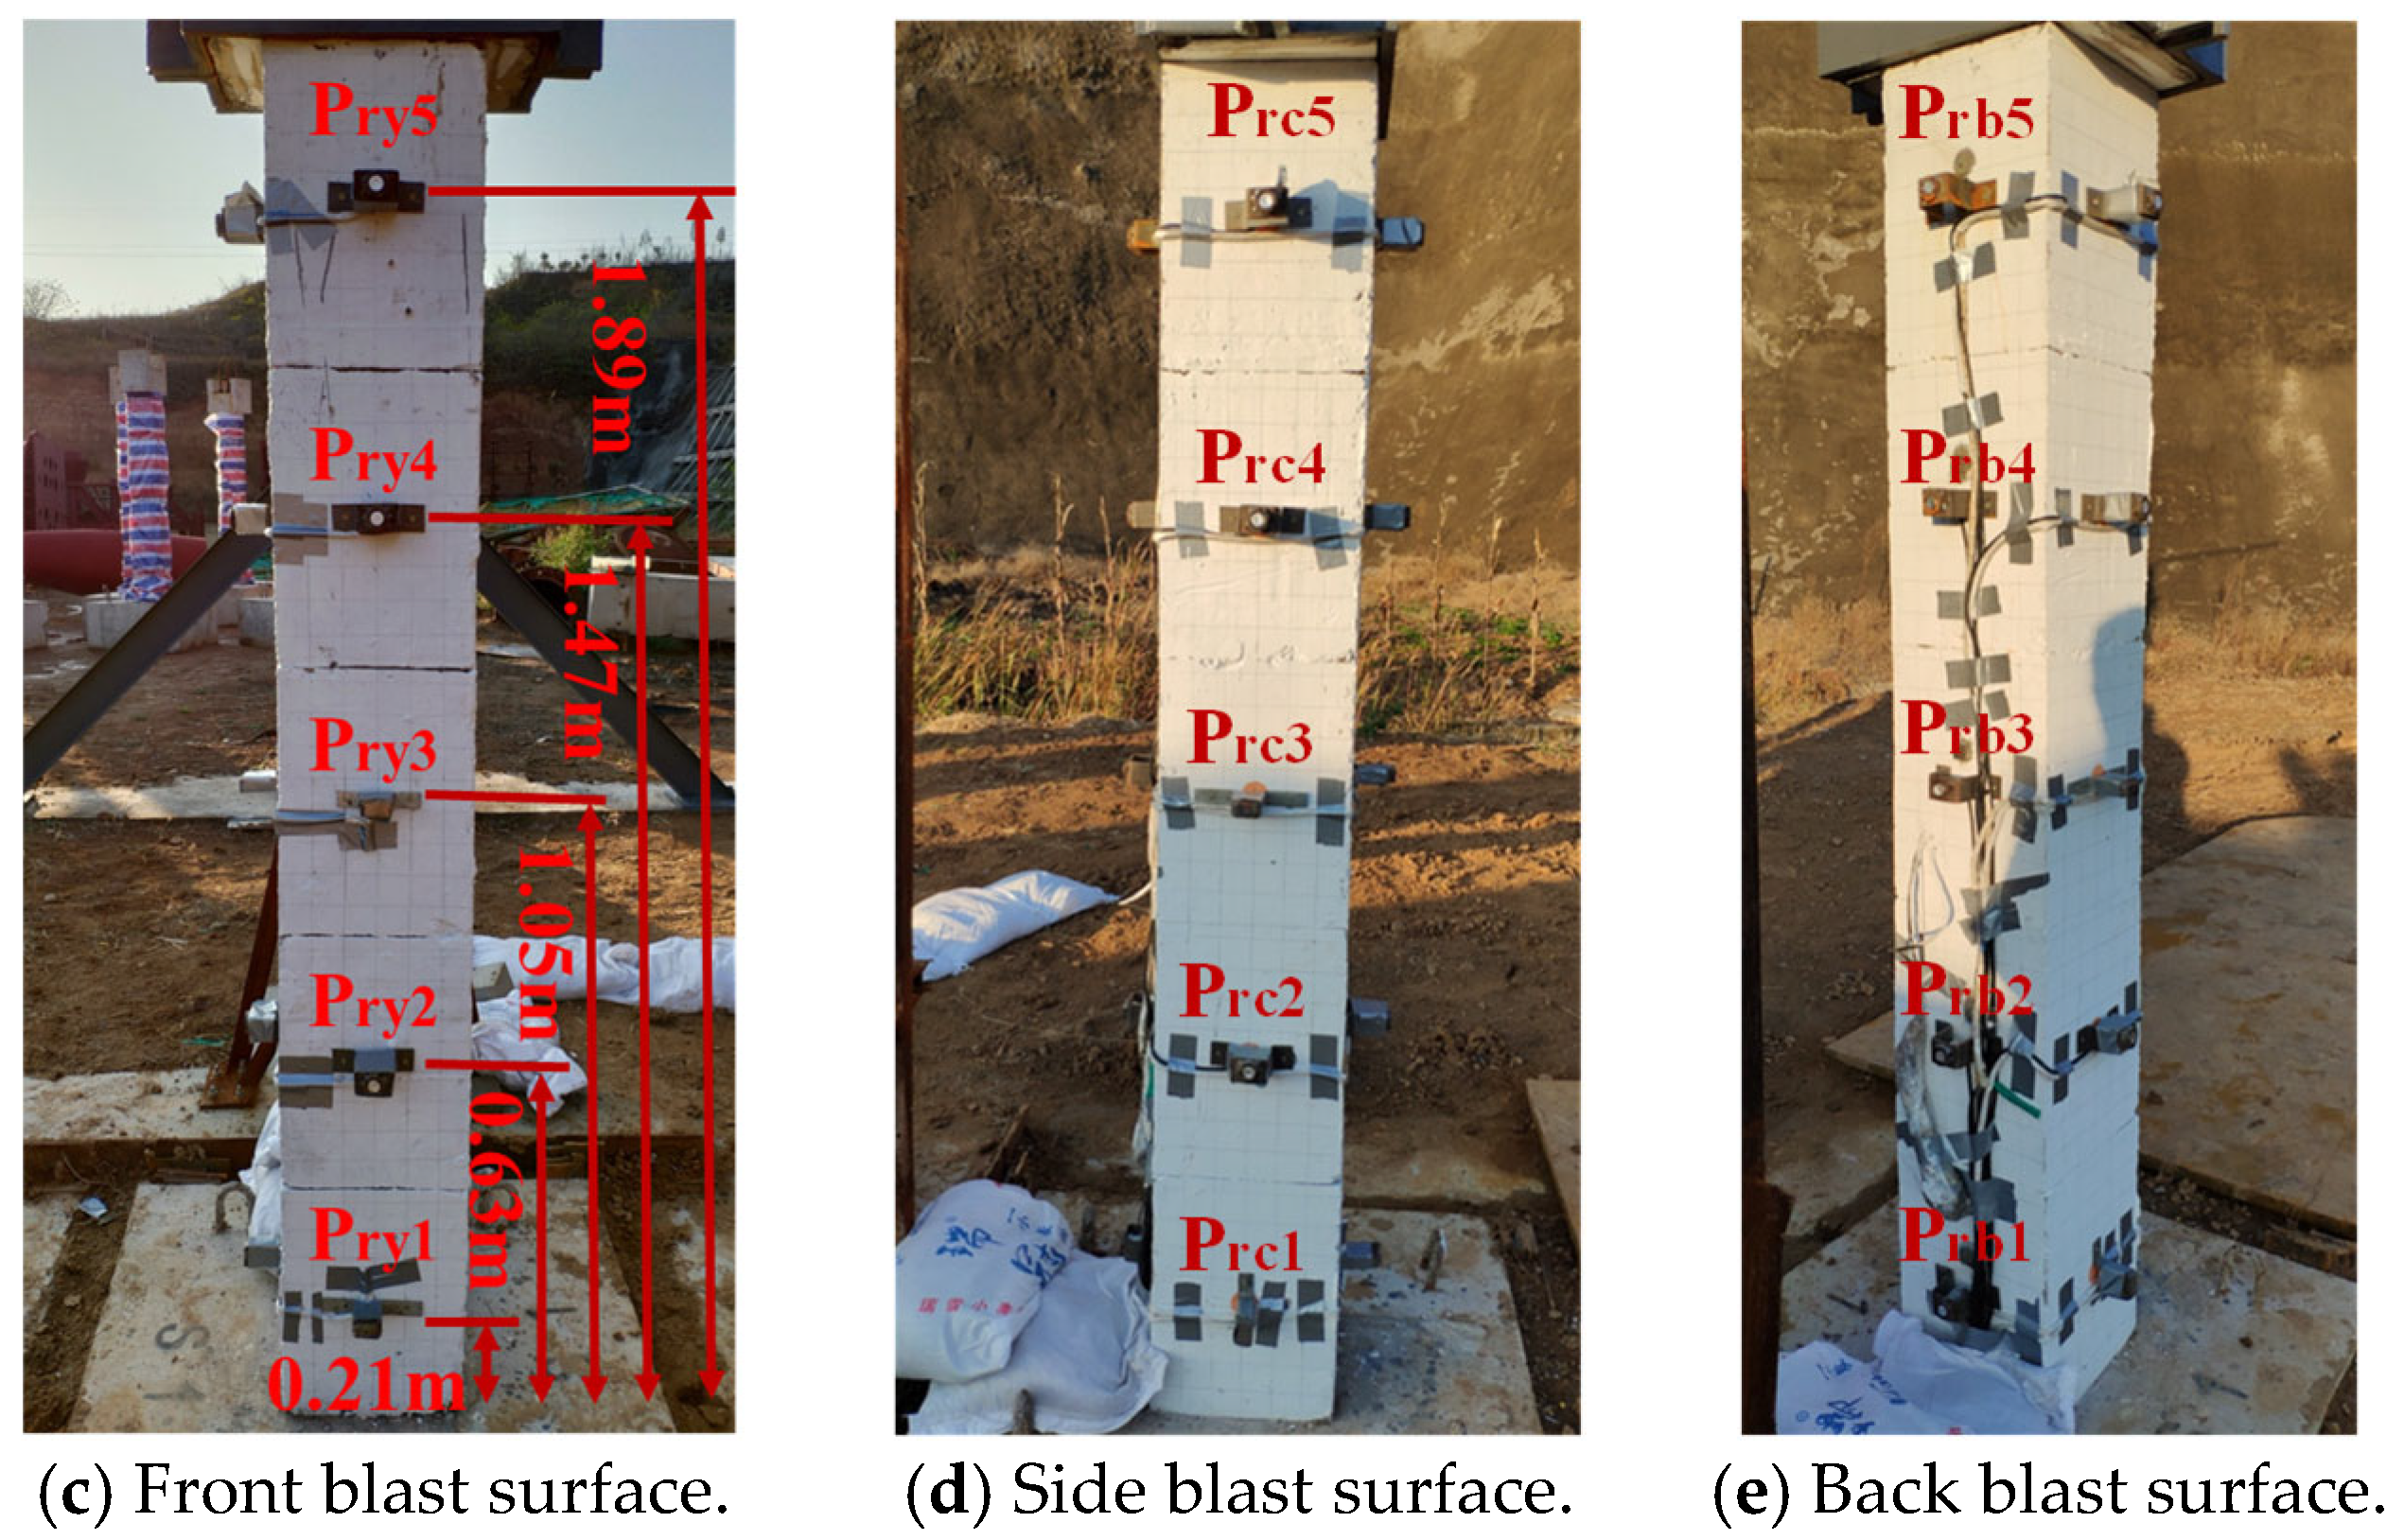
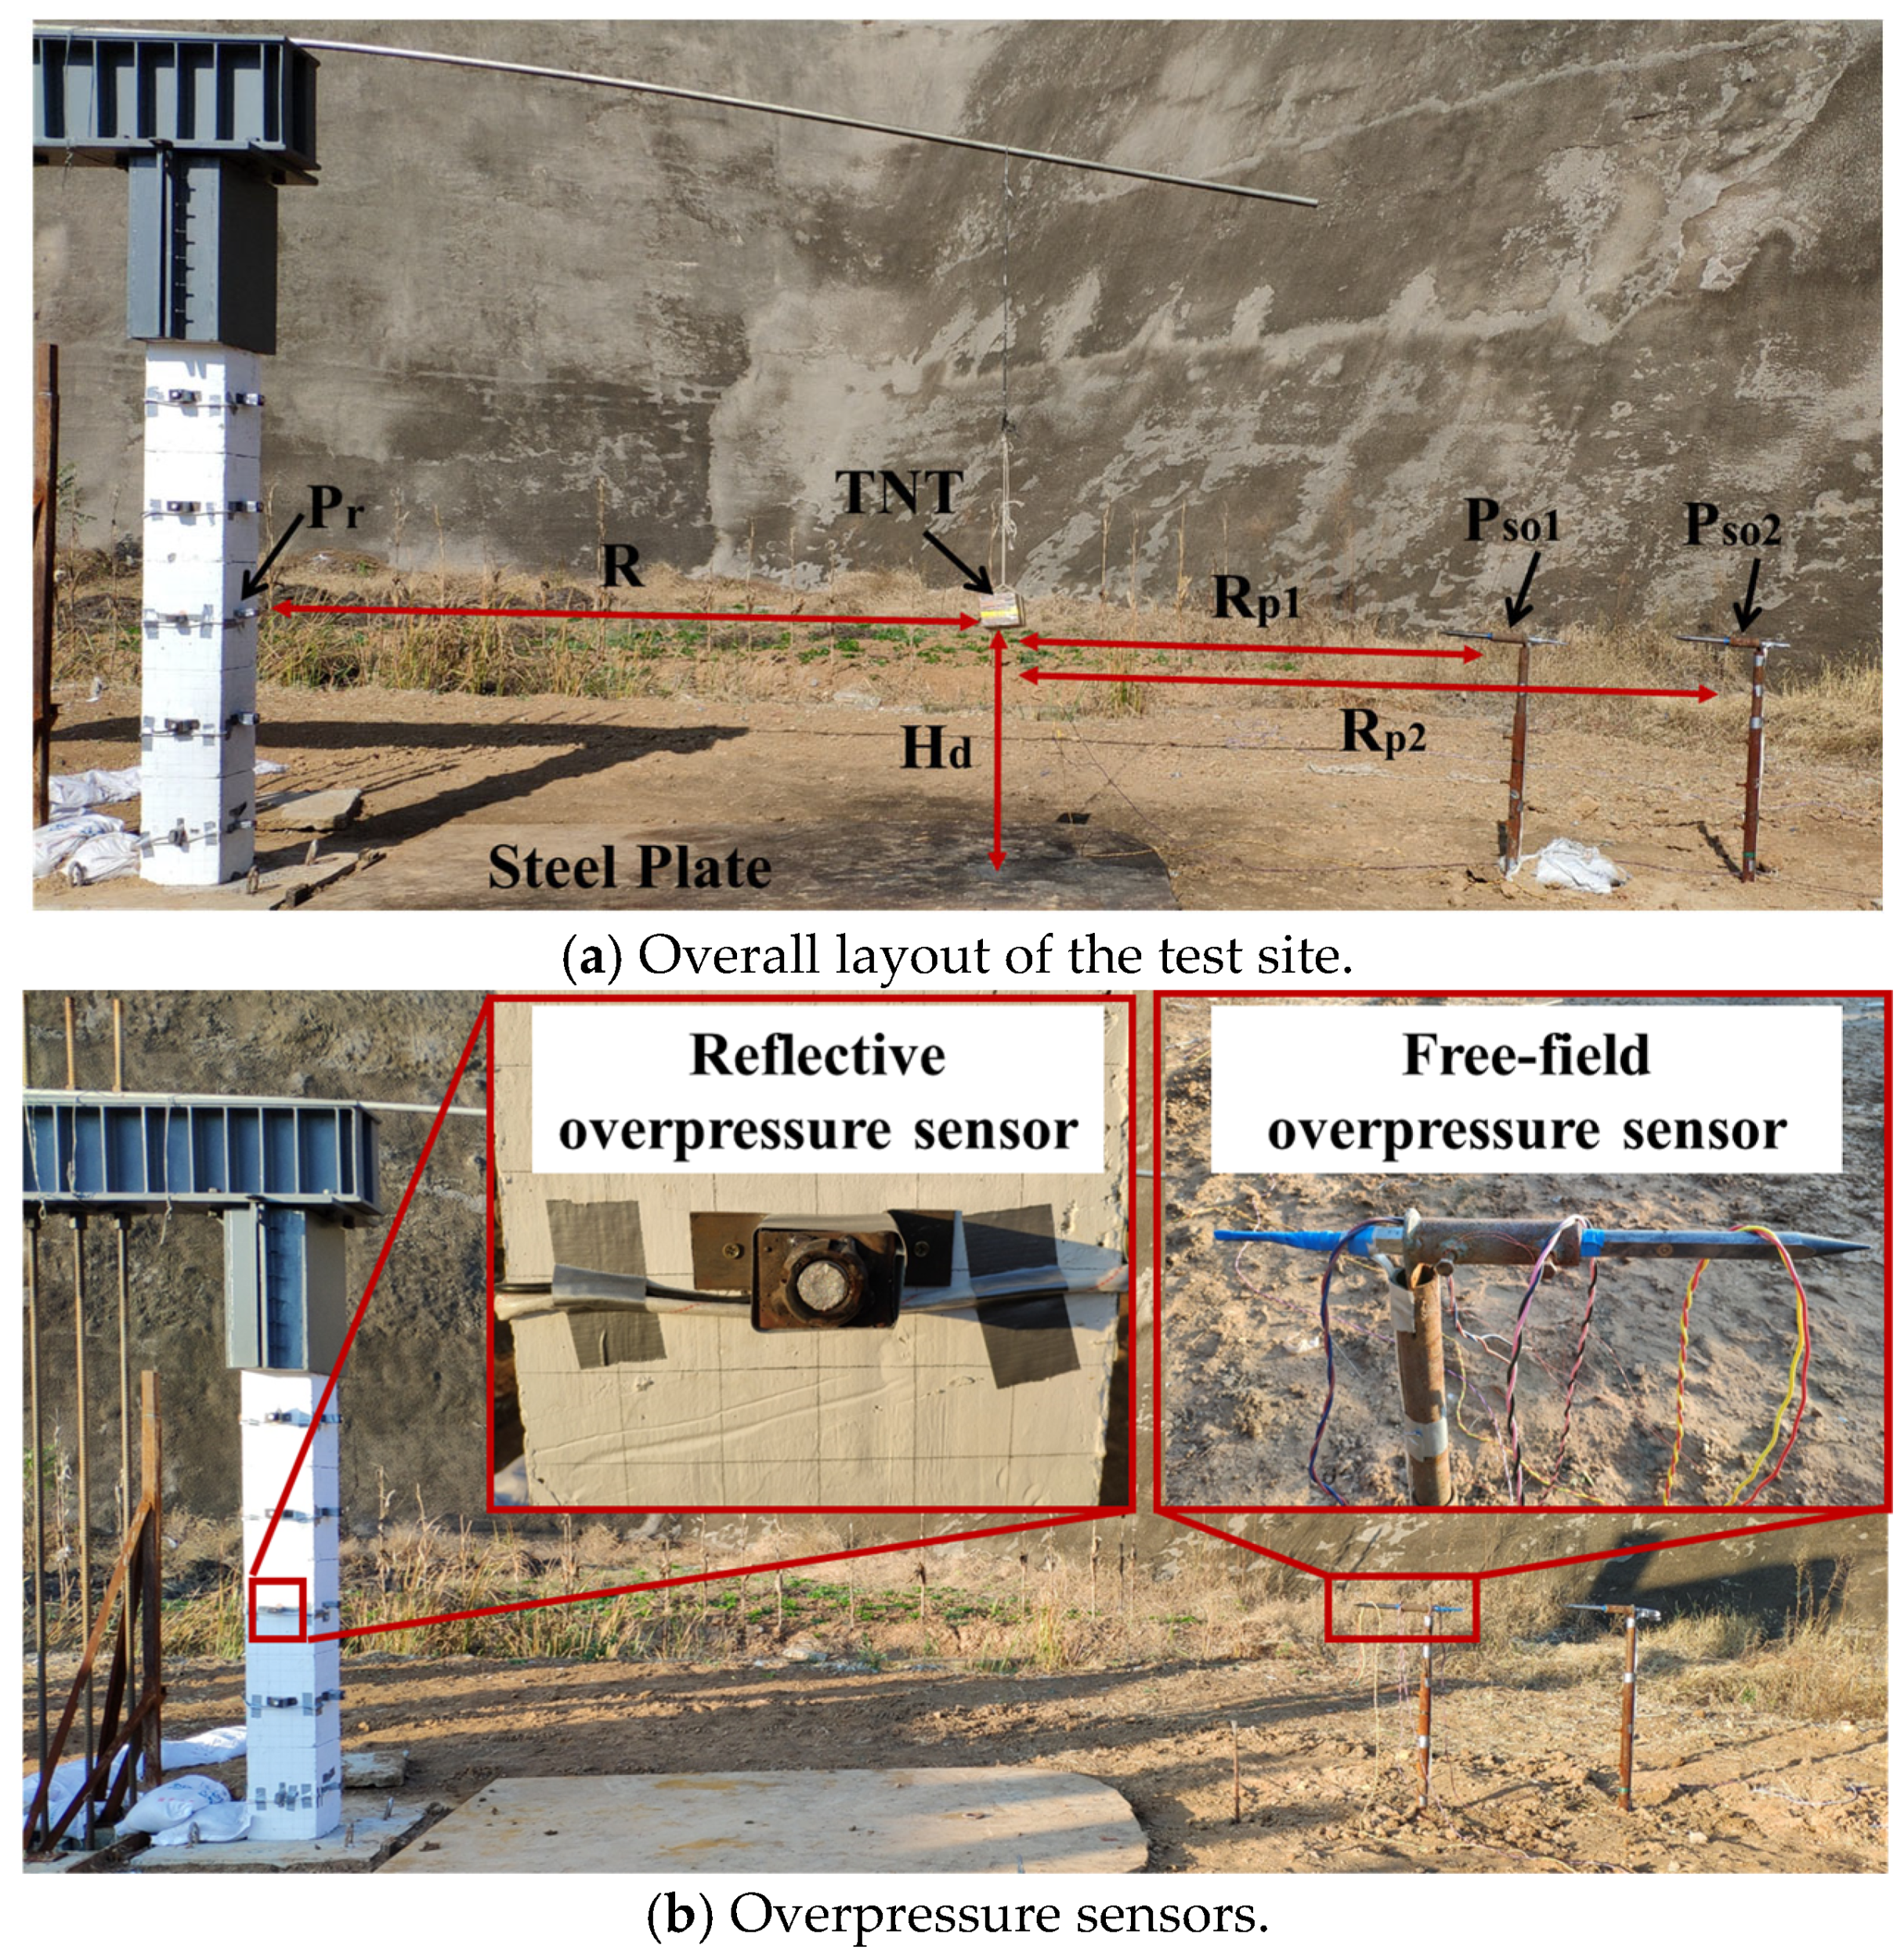
To investigate the distribution characteristics of explosion loads on the surface of segmental piers and to verify the accuracy of numerical simulations, explosion load tests were first conducted. Figure 2 shows the overall layout of the test site and the arrangement of overpressure sensors. The segmental pier comprises five segments with a square sectional dimension of 300 m × 300 m and an effective height of 2.1 m. The structural design of the segmental pier and the constraints were in accordance with [35]. The segments were connected by prestressing, and the geometric scale ratio of the segmental pier was 1:4.
In this study, trinitrotoluene (TNT) was used for blast loading, and the TNT masses were 1 kg, 2 kg, and 4 kg. In a bridge explosion accident, vehicle accidental explosion and vehicle-borne explosive explosion are believed to be the main explosive sources. Detonation distances herein are 2.0 m~3.0 m, which is a safe distance to protect the vehicle and people from destroying the pier. In addition, the blast shock wave can reflect on the ground, causing a large overpressure on the pier if the detonation height is quite low. The detonation height of 1.05 m is considered, because the pier failure deserves attention when the explosive is at the mid-height of the pier. The TNT is suspended in mid-air.
To prevent damage to the overpressure sensors and bridge piers from a near-field explosion, four mid-field explosion test conditions were selected. Table 1 presents the equivalent amount and positions of the TNT explosives. Overpressure sensors were placed at the centroid of the blast-facing surface of each pier segment, with the sensor heights shown in Figure 2a. The overpressure sensors on the side and rear blast surfaces were also positioned at the centroid of the cross-section, at the same height as those on the blast-facing surface, for a total of 15 overpressure sensors. Moreover, two free-field overpressure sensors were placed in an open area, with their specific locations listed in Table 2. During the test, a 1 cm thick steel plate was laid on the test site to create a rigid reflective surface and prevent damage to the sensors from flying sand and debris.

2.2. Test Results

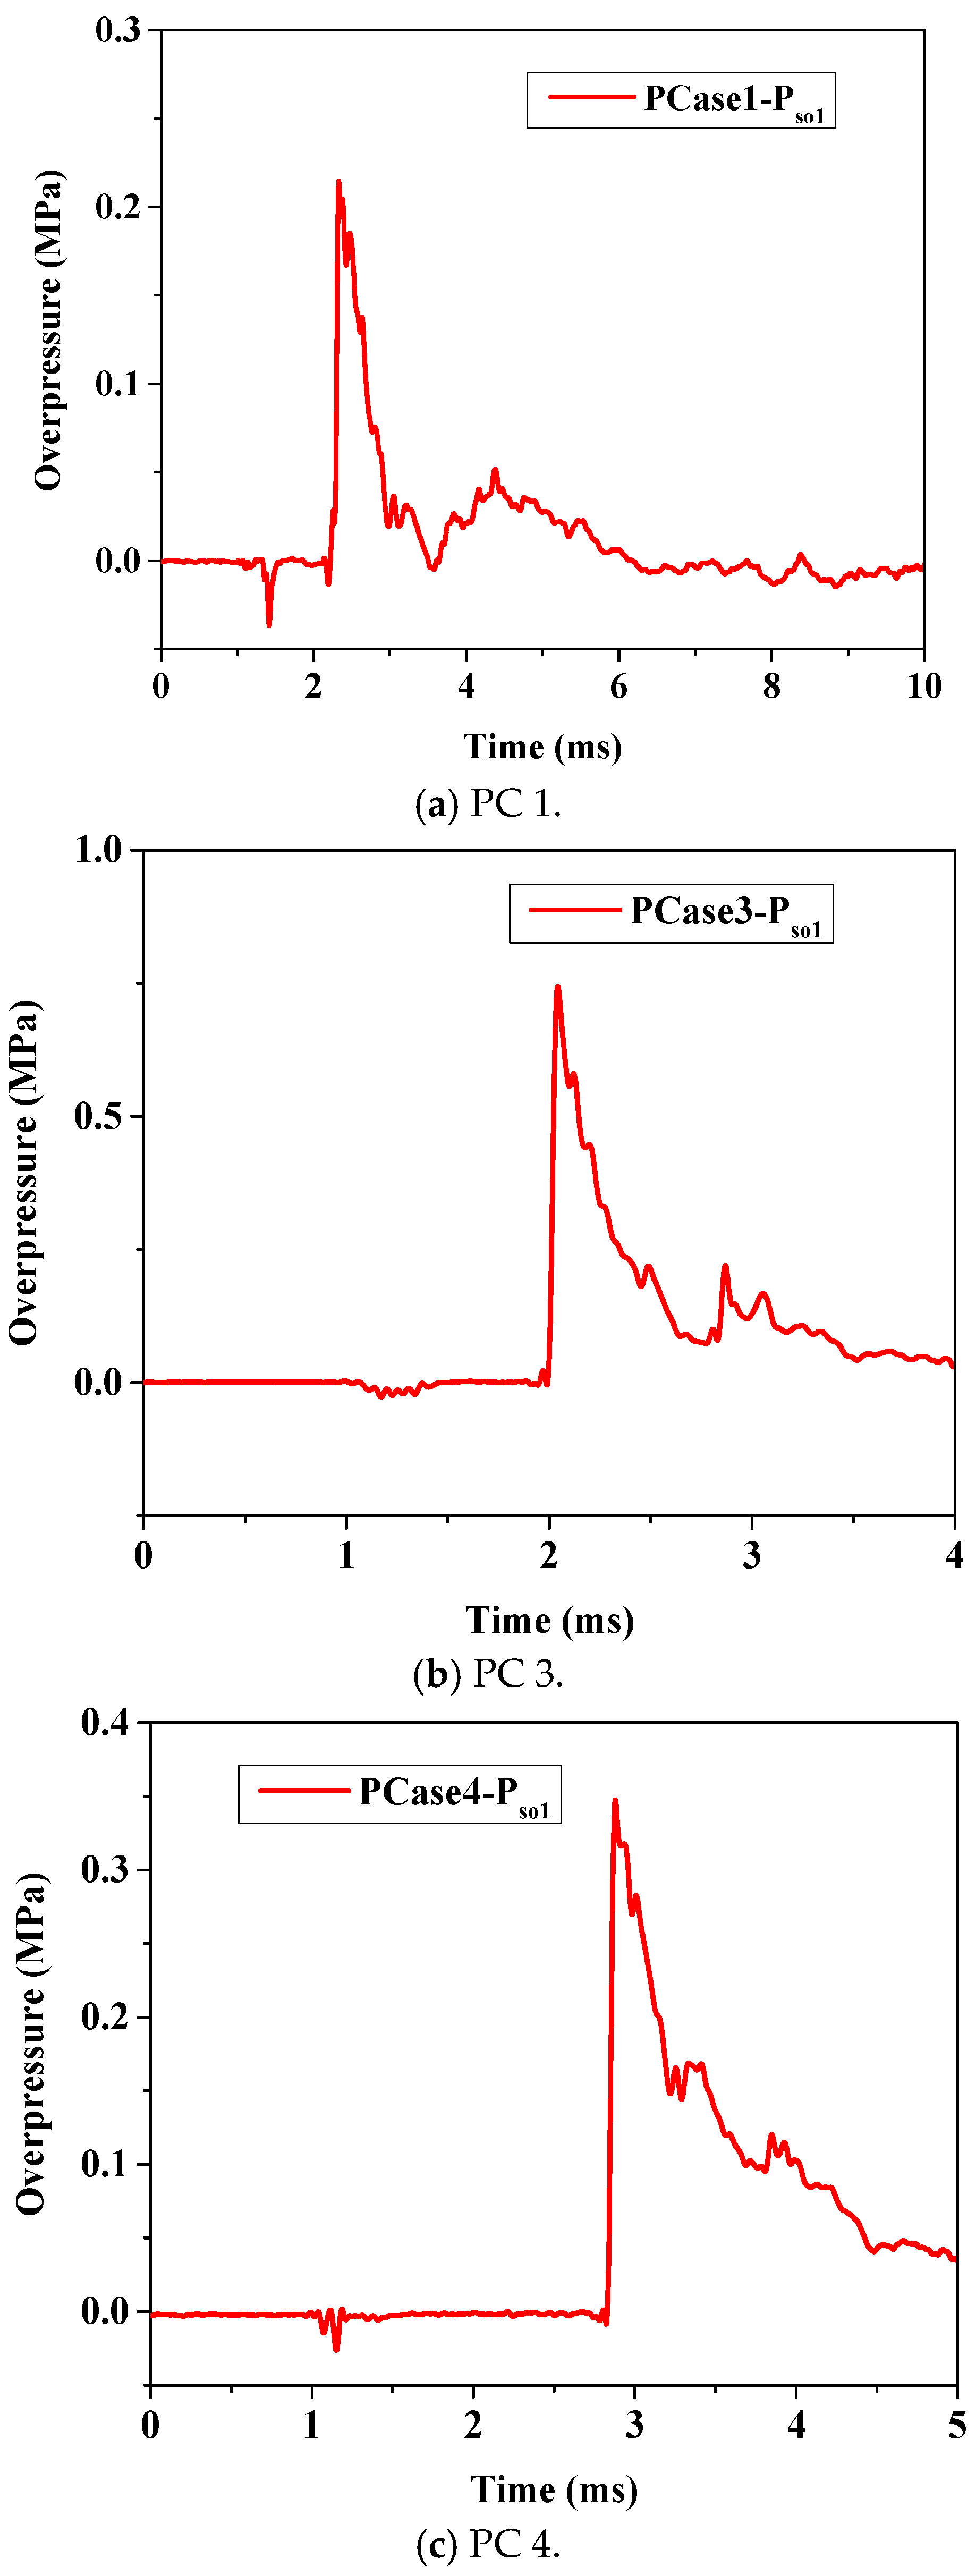
Despite having taken multiple measures to protect the overpressure sensors, the measured effective overpressure was still limited. Table 3 presents the peak overpressure values. In the free field, the overpressure values under conditions PC 1, PC 3, and PC 4 measured by sensor Pso1 were 0.214, 0.74, and 0.34 MPa, respectively. Figure 3 shows the free-field overpressure time history curves. The measured time history curves are consistent with the trend in the theoretical overpressure curves. Before the incident shock wave reached the sensor, it first impacted the ground, causing seismic movement and resulting in slight sensor vibrations. When the shock wave reached the detection point of the sensor, the time history curve generated the first peak. Shortly after, the reflected shock wave from the rigid ground reached the detection point of the sensor, producing a second peak in the time history curve.
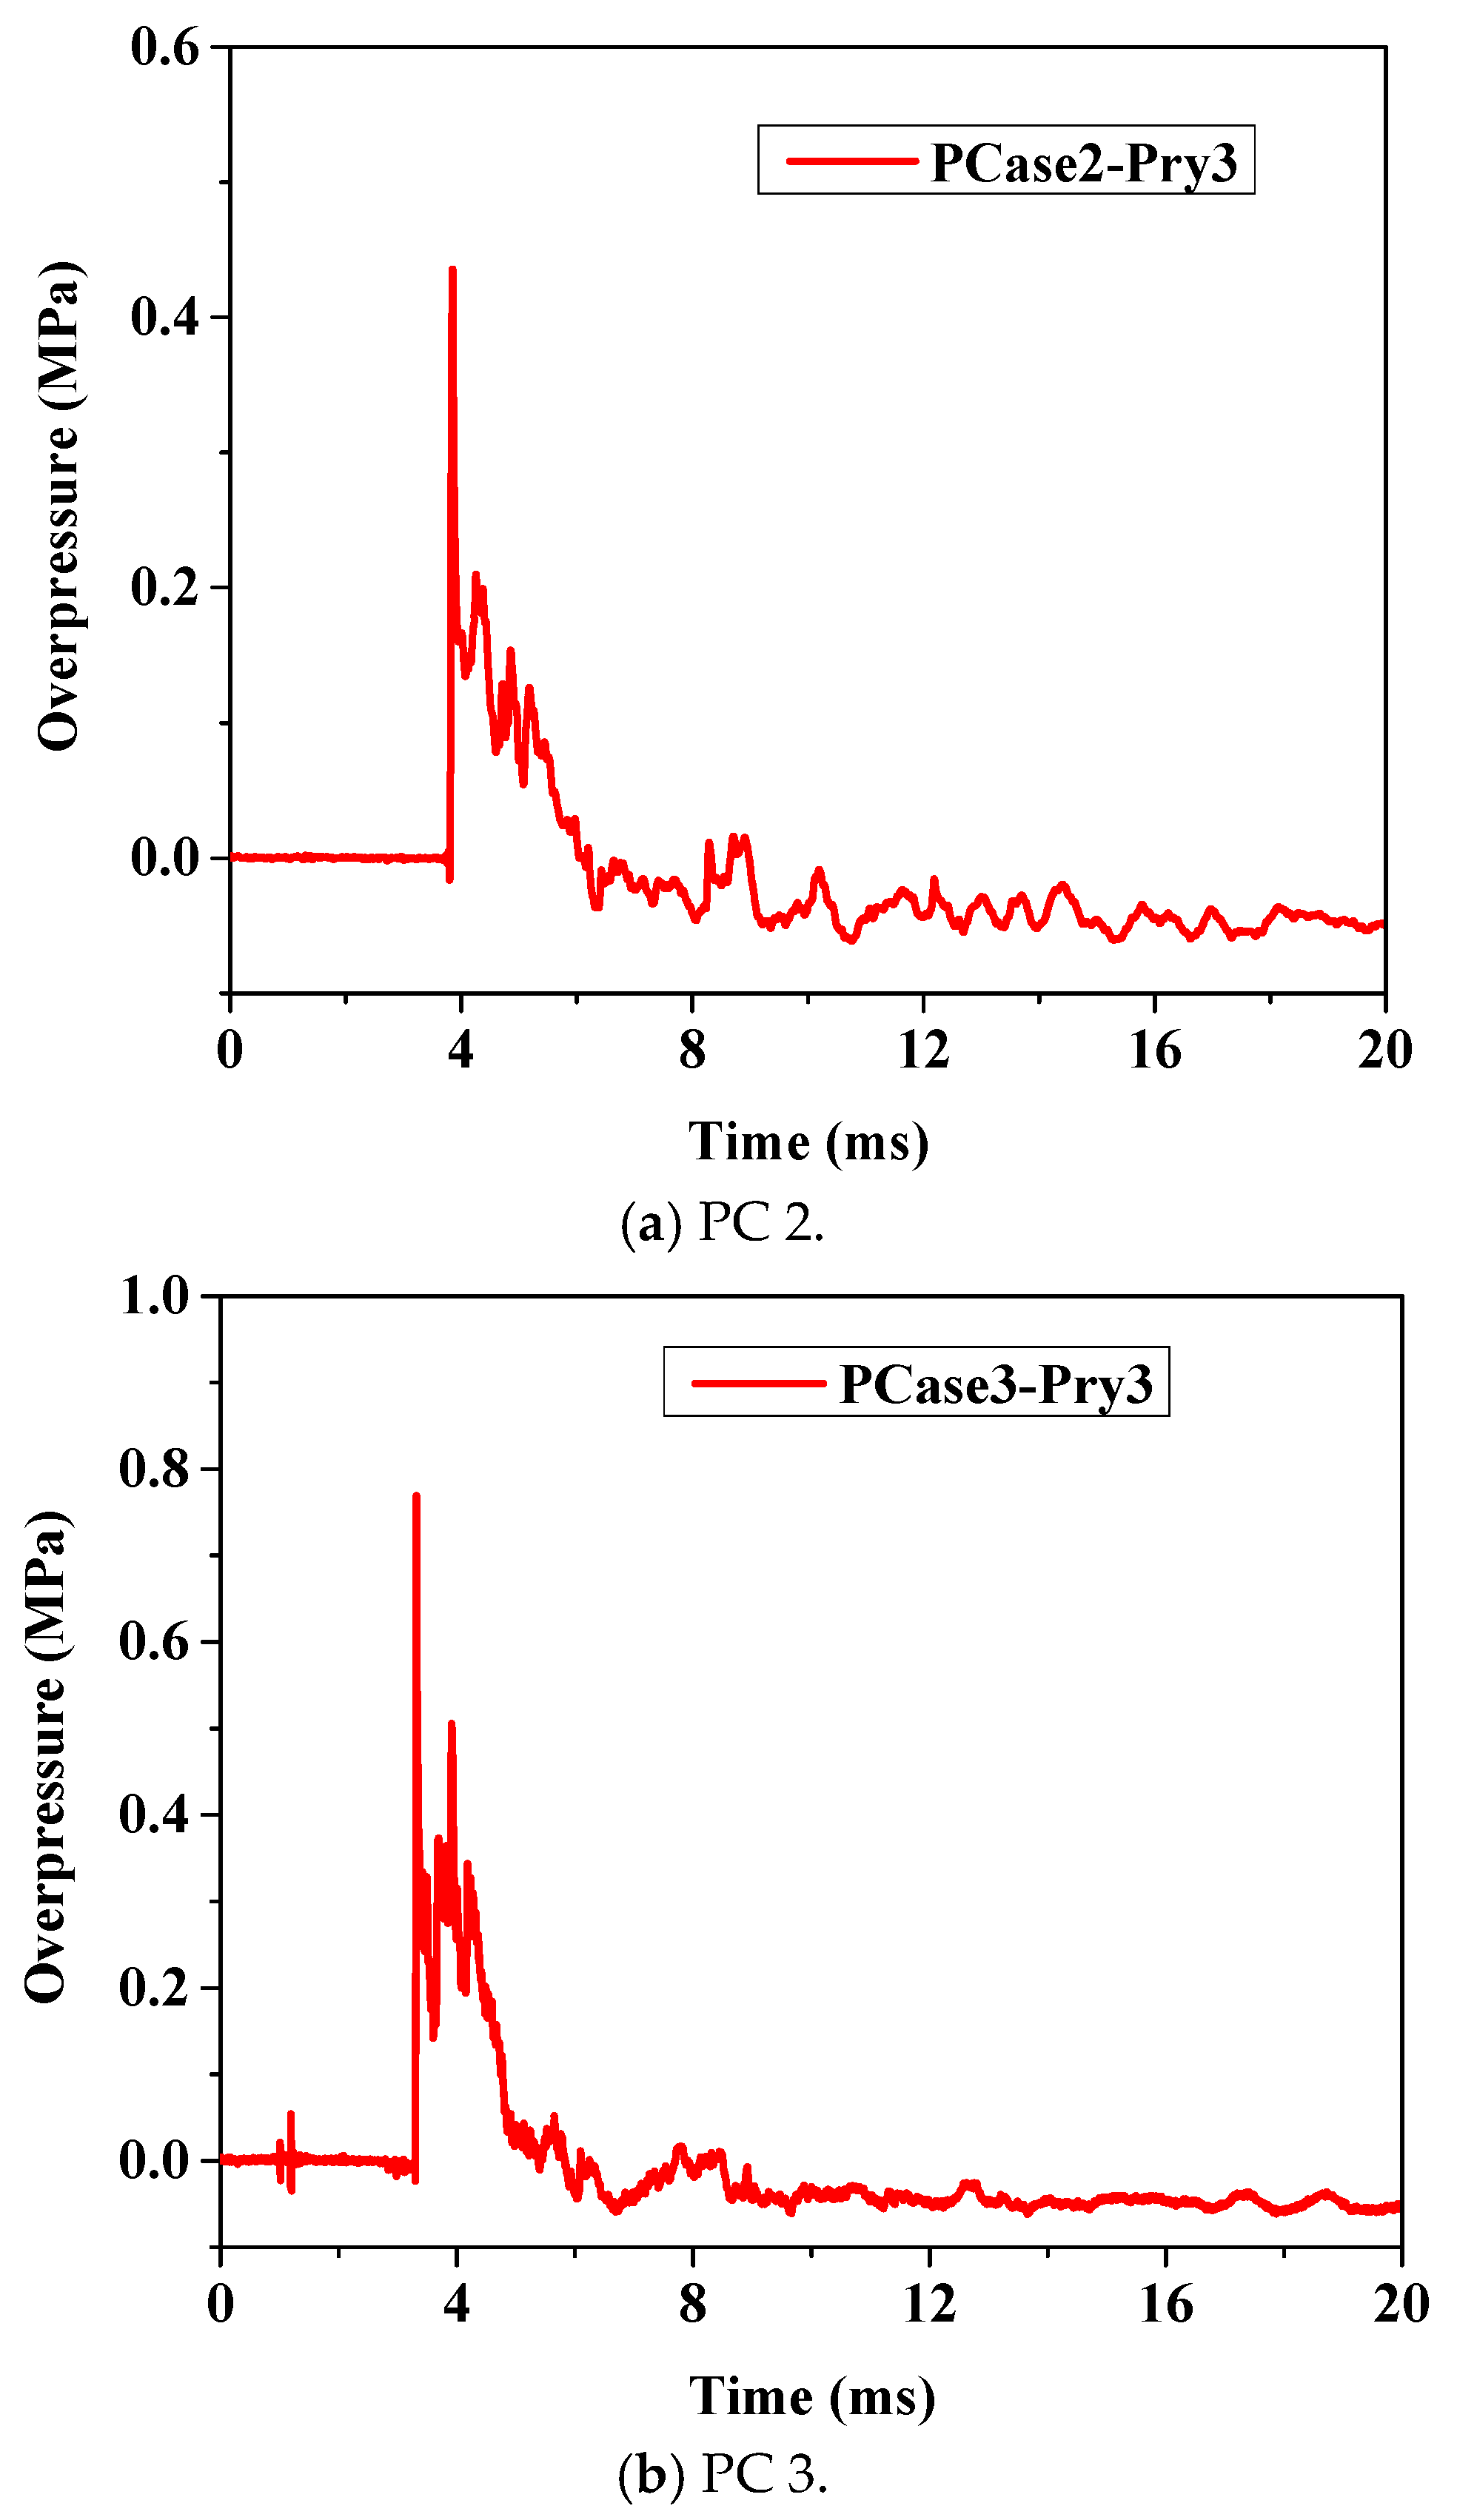
For the segmental pier, the partially reflected overpressure was measured under conditions PC 2 and PC 3. The side and rear surfaces were affected by the diffraction and reflection of shock waves, making it impossible to extract the effective overpressure from the measured data. Table 3 presents the peak overpressure values on the front blast-facing surface at heights of 0.63, 1.05, and 1.47 m. Figure 4 shows the time history curve of the overpressure at the mid-column height (1.05 m). In the measured reflected overpressure curve for the pier surface, a sudden peak was observed, which was a false peak. Therefore, the impulse I was obtained by integrating the measured time history curve. Subsequently, the actual peak overpressure was calculated using the relationship between the impulse I, duration t, and peak P, i.e., P = 2I/t.

2.3. Comparison with UFC

The overpressure sensors on the pier surface at the mid-column height and the free-field overpressure sensors were placed at the same height as the explosives. The measured peak overpressure values were compared with the U.S. UFC [40] standards, as shown in Table 4. The results showed that the measured free-field peak overpressure values were slightly higher than the standard values. The peak overpressure on the blast-facing surface of the pier was slightly lower than the standard values. All the peak overpressure errors were within 35.3%. The difference in the free-field overpressure values may have been due to the pen-type sensors affecting the shock wave overpressure measurement, which caused the measured values to be slightly higher than the actual values. The difference in the overpressure values on the front blast-facing surface of the pier is due to the different shapes of the explosives used in this study (square) compared with the standard (spherical). Although the shock wave generated by a square charge becomes more uniform as it propagates, it remains uneven at closer distances to the blast center, with the overpressure being significantly higher in certain directions. Moreover, uncertainties in the explosion test and the measurement accuracy of the sensors may influence the test results.

3. Blast Simulation

3.1. Finite Element-Numerical Model

The explosives and air were modeled using the Arbitrary Lagrangian–Eulerian (ALE) method. The segmental bridge pier was modeled using the Lagrangian method. The ALE and Lagrangian elements were coupled using CONSTRAINED_LAGRANGE_IN_SOLID. This allowed for simulating the propagation of the explosion shock wave through air and the interaction between the shock wave and the bridge pier.
P = A 1 ω R 1 V e R 1 V + B 1 ω R 2 V e R 2 V + ω E e V
For the explosives, the high-energy explosive material model MAT_HIGH_EXPLOSIVE_BURN (MAT_008) and the state equation EOS_JWL (EOS_002) were used for the simulation. The material model MAT_008 requires the following input parameters: the initial density ( ρ 0 ) of the material, detonation velocity (D), and the pressure on the detonation wave front P C J (C-J pressure). The JWL state equation is expressed as in Equation (1), where P is the pressure of the detonation products; V is the relative volume; E e is the energy per unit volume of the explosive; and ω , A, B, R1, and R2 are material constants related to the explosive material. Table 5 presents the material and state equation parameters used for the TNT explosives.
P = C 0 + C 1 μ + C 2 μ 2 + C 3 μ 3 + C 4 + C 5 μ + C 6 μ 2 E a
P = γ 1 ρ ρ 0 E a
Air was simulated using the MAT_NULL (MAT_009) material model and the linear polynomial state equation EOS_LINEAR_POLYNOMIAL (EOS_001). Air was assumed to be an ideal gas. The material model MAT_009 requires the initial density ( ρ 0 ) of the material as the input parameter. The linear polynomial state equation is expressed as in Equation (2), where C 0 ~ C 6 are the coefficients of the polynomial equation; μ = ρ / ρ 0 1 ,   ρ is the density of air, and ρ 0 is the initial density of air; and E a is the energy per unit volume of air. The ideal gas follows the state equation expressed in Equation (3), where C 4 = C 5 = γ 1 , γ is the adiabatic index, and γ = 1.4 for ideal air. Table 6 presents the material and state equation parameters for ideal air.
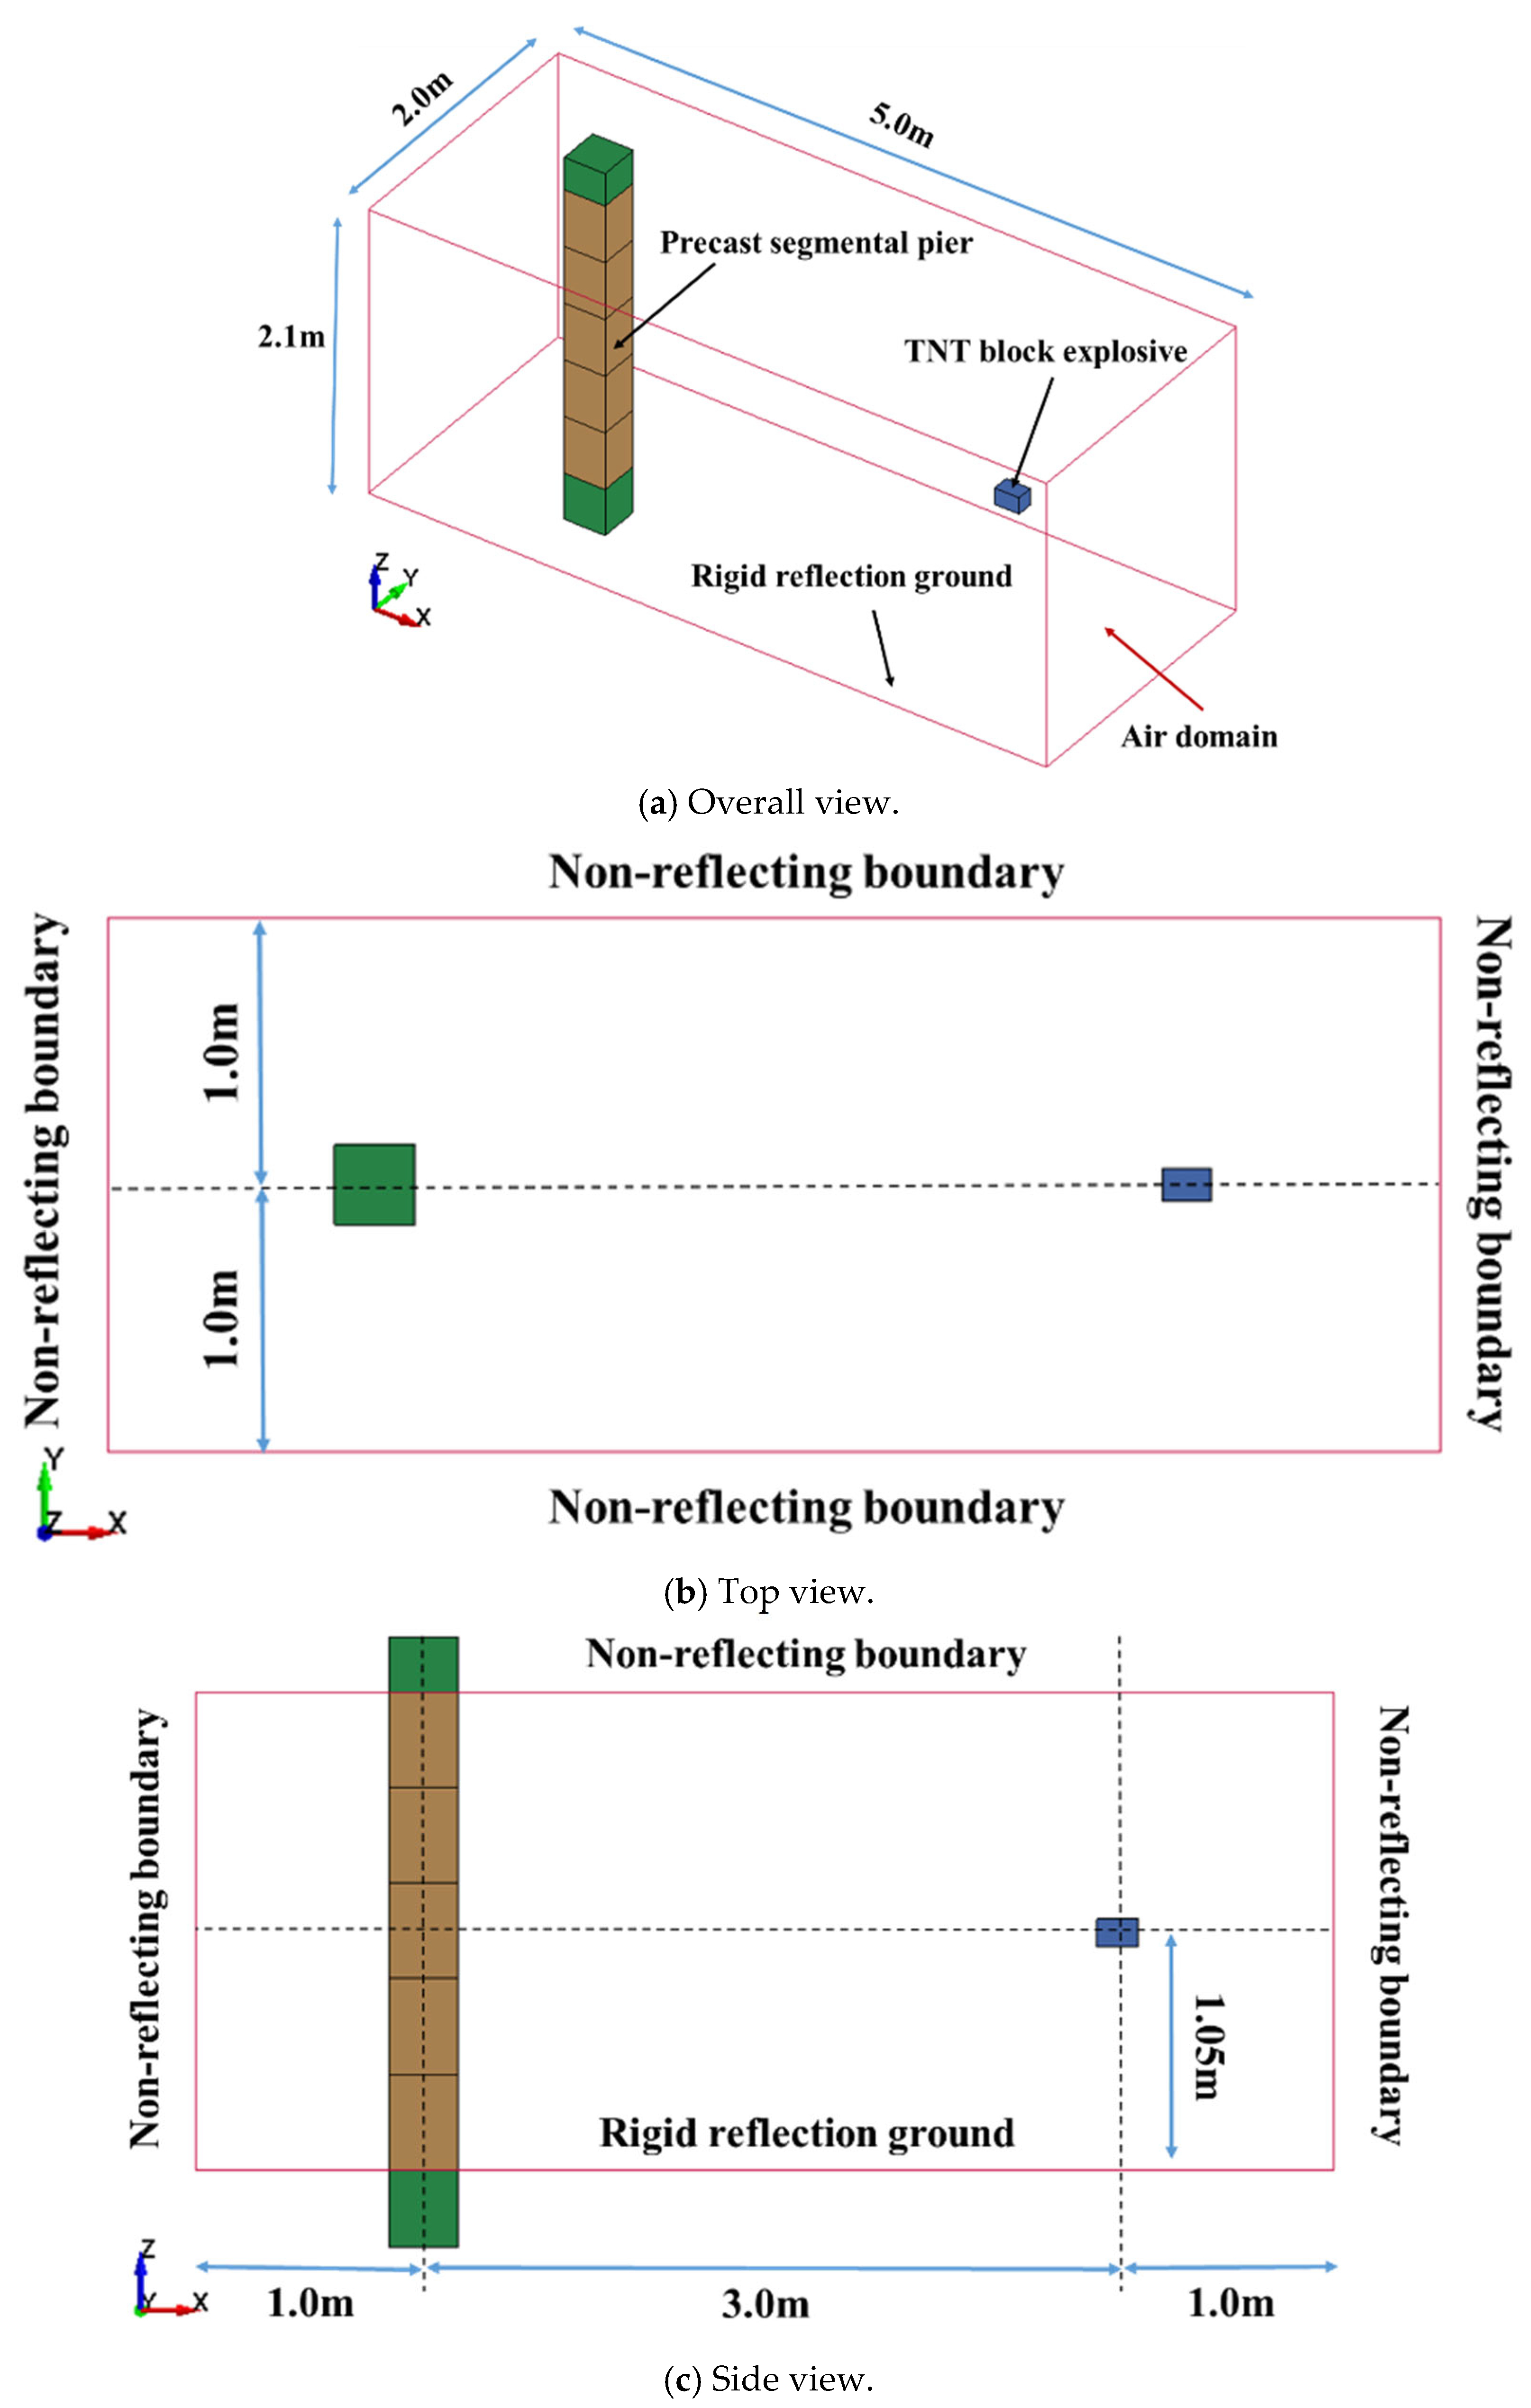
Both the explosive and air were modeled using SOLID164 hexahedral solid elements. The dimensions of the air domain were 5.0 m (X) × 2.0 m (Y) × 2.1 m (Z), and the explosive mass was 4 kg. Figure 5 shows the finite element model. To balance the computational cost and time, the mesh was divided into a size of 20 mm. The bottom surface of the air domain was fully constrained to simulate the complete reflection of the explosion shock wave by a rigid ground. All the boundaries of the air domain, except for the ground surface, were defined as non-reflecting boundaries. The BOUNDARY_NON_REFLECTING method was used to allow the shock wave to overflow from the boundaries, thereby eliminating the impact of boundary reflections on the results. The atmospheric pressure of the ideal air in the air domain was set to 0.1 MPa using the CONTROL_ALE keyword. The segmental pier was built, including the element model and material according to [34].

3.2. Model Validation

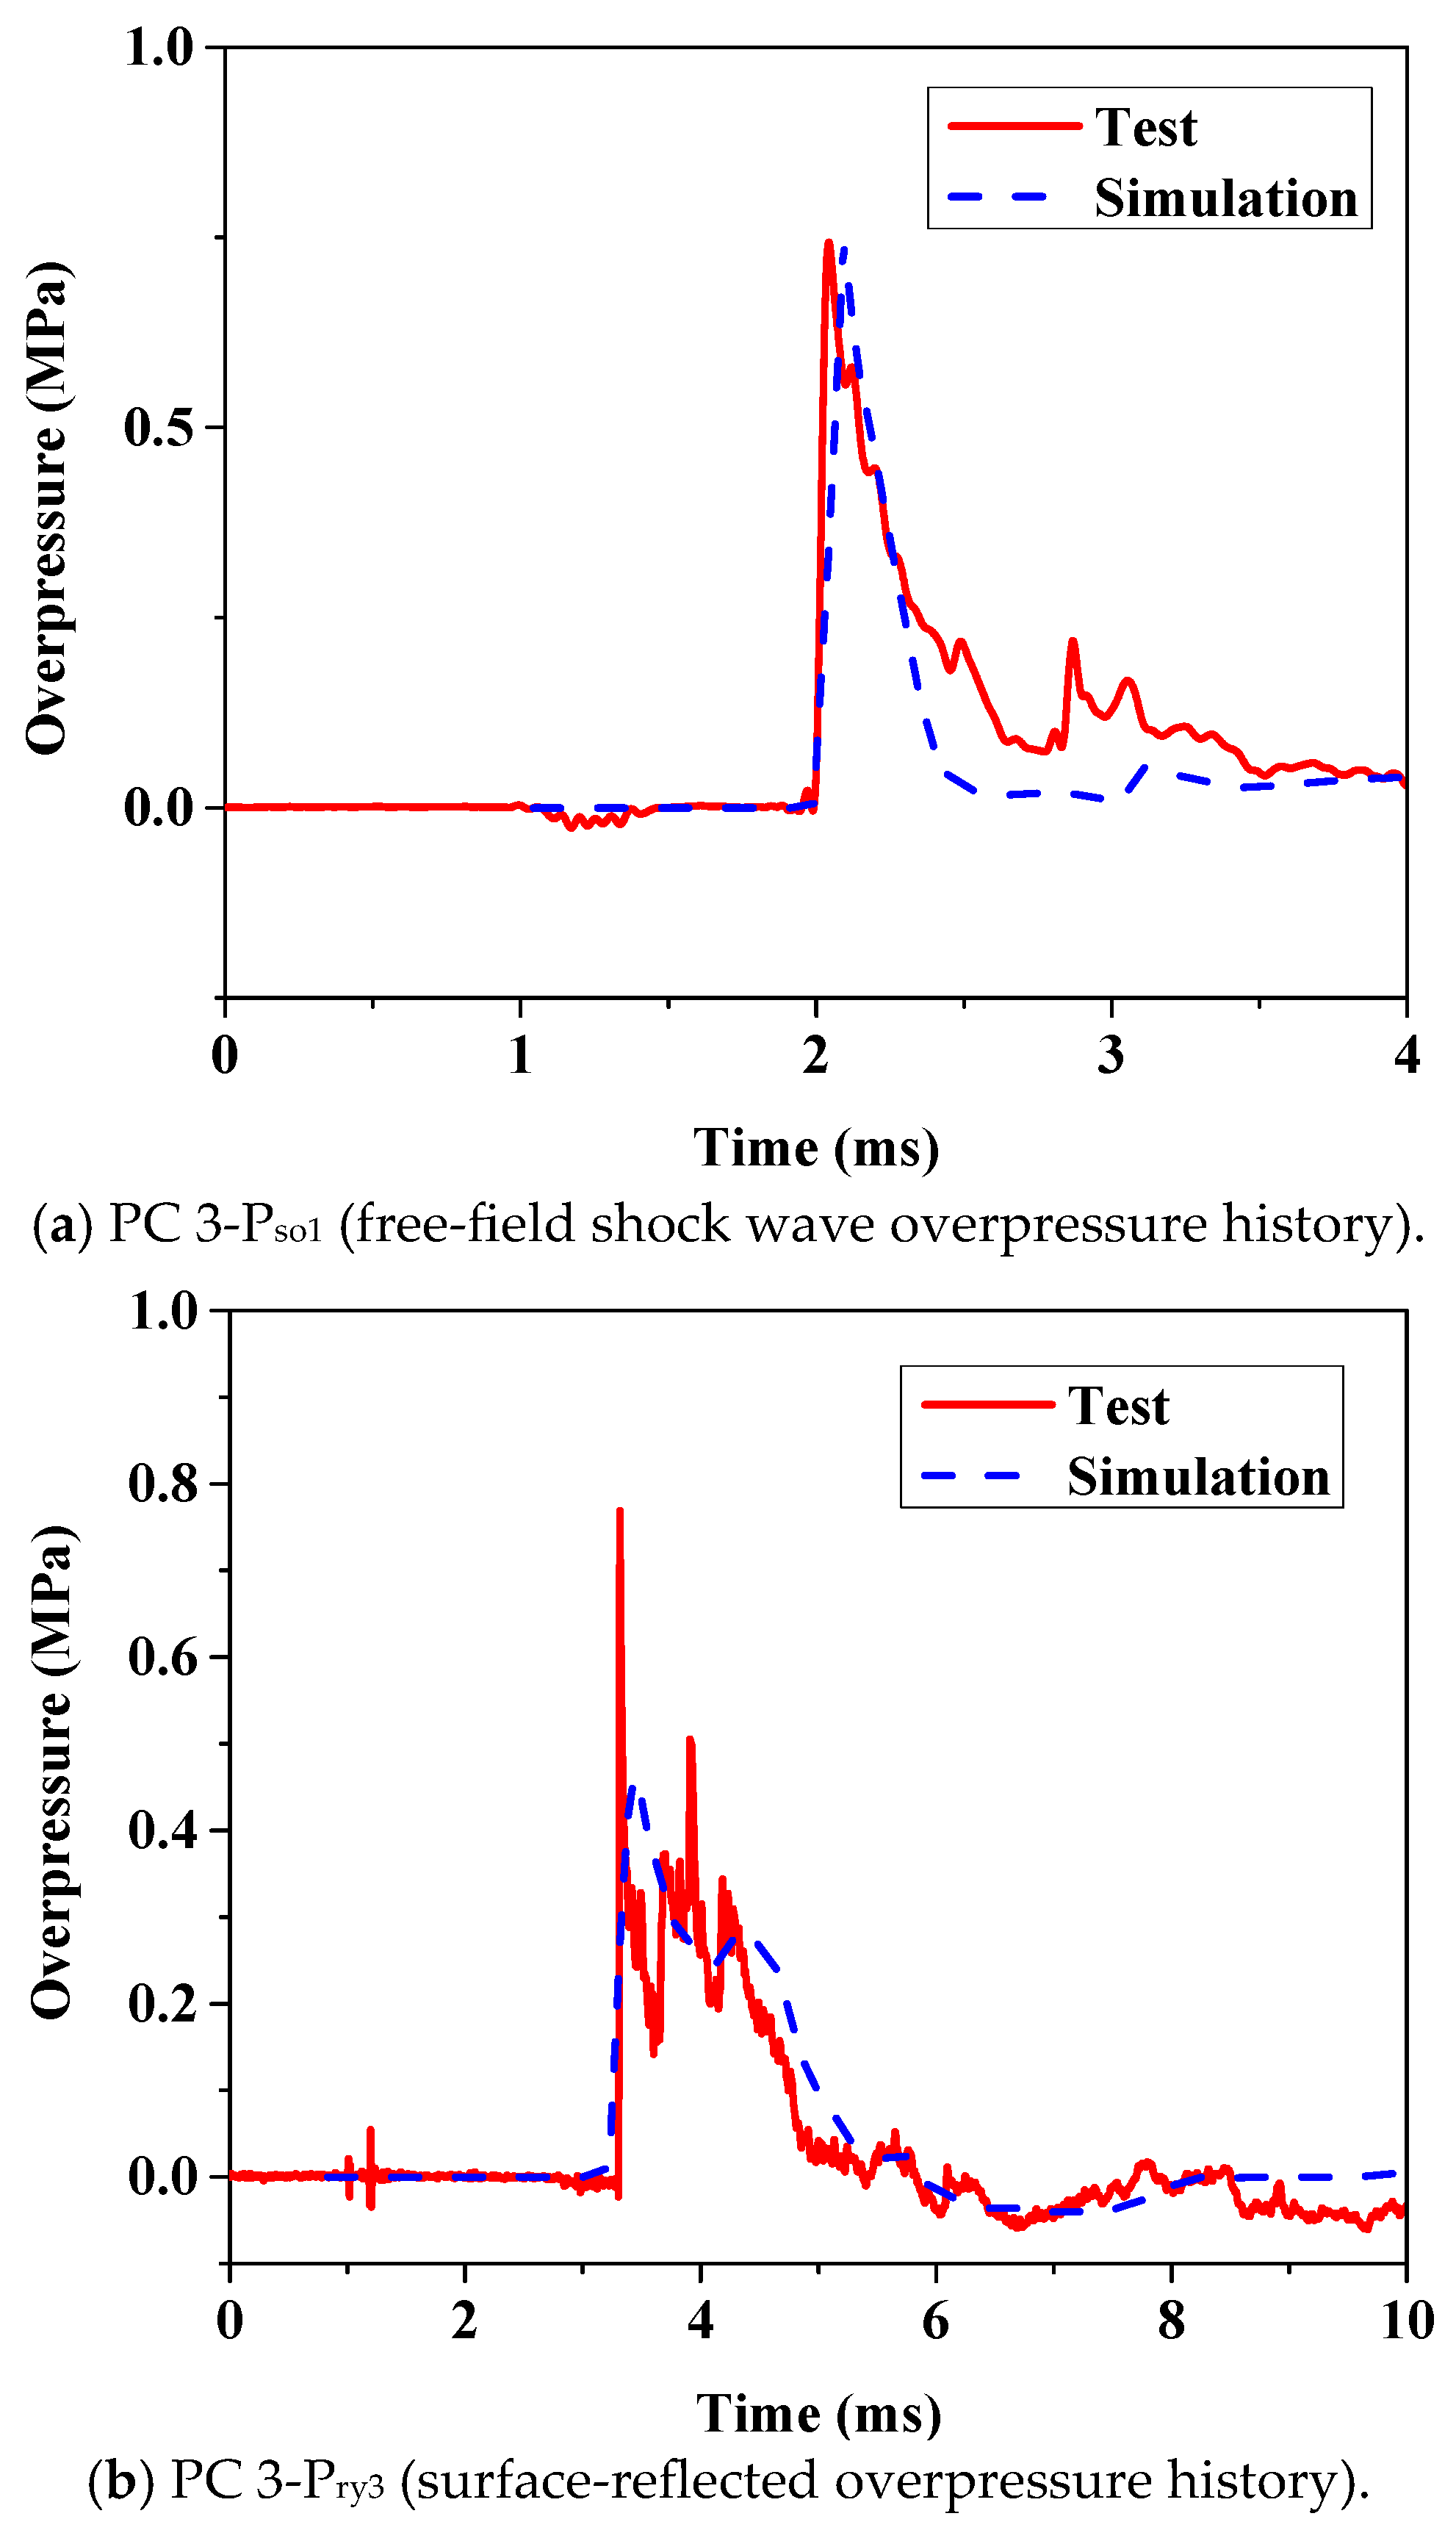
To verify the accuracy and reliability of the numerical simulation of the explosion shock wave, numerical simulations were conducted for valid test conditions. Figure 6 shows the overpressure time history curve under condition PC 3. As shown in Figure 6a, the numerical simulation of the free-field shock wave overpressure time history is consistent with the experimental results. The simulated peak overpressure was 0.744 MPa, while the measured value was 0.74 MPa, with a relative error of 0.54%. The positive duration and decay trend of the overpressure in the simulated time history curve were consistent with the experimental results. Figure 6b shows that the numerical simulation of the surface-reflected overpressure time history for the segmental pier also matches well with the experimental results. The simulated overpressure trend over time closely followed the experimental trend. The simulated peak overpressure was 0.462 MPa, while the measured value was 0.501 MPa, with a relative error of 7.78%.
Table 7 presents the simulated peak overpressure results for the other test conditions, with maximum and minimum errors of 36.4% and 0.54%, respectively. The reasons for the discrepancies between the simulated and measured values include the following: (1) There are differences in the shape, position, and detonation point of the explosives compared with the suspended explosives used in the experiment. (2) Variations exist between the ideal air medium and the actual air medium. (3) The sensors and their installation methods may have a certain impact. Pen-type sensors tend to measure slightly higher free-field values than the actual values. The overpressure sensors on the surface of the structure were installed with a certain gap from the surface. Moreover, the reflective area of the installation plane was limited. Consequently, there were differences between the measured and simulated results.
In summary, although there were certain discrepancies between the ALE numerical model and the experimental results, these differences were within an acceptable range. The deviations can be attributed to the limitations of the numerical simulation method, the uncertainty in the numerical simulation parameters, and the limitations of the experimental testing system. Therefore, the model was considered reasonable and reliable.

4. Discussion on Near-Field Explosion Loads

4.1. Interaction Between Shock Waves and Segmental Piers

Figure 7 illustrates the propagation and reflection of the explosion shock wave. After the detonation, the shock wave propagated outward in an irregular spherical shape due to the cubic form of the explosive. Since the explosive was closer to the ground, the shock wave first reached the rigid ground and produced a reflection. The reflected shock wave traveled upward and toward the pier. The ground-reflected shock wave caught up with the incident shock wave at a certain height, forming a Mach reflection wave. The incident shock wave in the middle of the pier first reached the surface of the pier, causing a reflection on the blast-facing side. The Mach wave from the ground acted on the bottom of the pier in a planar form. During the propagation of the shock wave, the area of the air it affected gradually increased, causing the unit energy to decrease. The velocity of the shock wave gradually reduced. This slowed the compression of the air, and the pressure zones of the shock wave progressively enlarged.
Figure 8 illustrates the circulation process of the explosion shock wave on the pier surface. The shock wave reflected off the blast-facing side of the square cross-section, forming vortices at the corners of the cross-section. These vortices wrapped around the corners and coupled with the incident shock wave to form Mach waves, which acted on the side faces of the pier. The Mach waves on the side faces then reflected and propagated toward the back face. At the corners of the square cross-section, the shock waves on both the side faces formed vortices again, wrapping around the corners and converging on the back face. The waves combined and reflected again, forming a new planar wave that propagated backward. The circulation of the shock wave on both the side faces of the cross-section was symmetrical. Therefore, the overpressures on both side faces were also symmetrical.

4.2. Determination of Explosion Conditions

In a near-field explosion, the distance between the vehicle and the pier is influenced by factors such as the safety distance, curb width, and the size of the vehicle itself. Road edges typically have barriers, landscaping, or restricted areas, with this range typically being 0.3–0.5 m. When a vehicle explodes, the size of the vehicle affects the position of the explosion center, and it cannot be in direct contact with the pier. The width of a small car is generally between 1.8 and 2.0 m. Assuming that the explosion center is at the centroid of a small vehicle, the minimum distance of the explosion center from the pier in a near-field vehicle explosion is estimated to be in the range of 1.2–1.6 m. Based on the geometric similarity ratio, the explosion center distance is calculated to range from 0.3 to 0.4 m.
In near-field explosions, the height of the explosion center from the ground is mainly affected by the vehicle itself. Vehicle bombs typically have their explosives centered around the vehicle chassis, with the charge center height generally ranging from 0.6 to 1.1 m [46]. Based on geometric similarity ratios, the blast center height is estimated to be between 0.15 and 0.275 m.
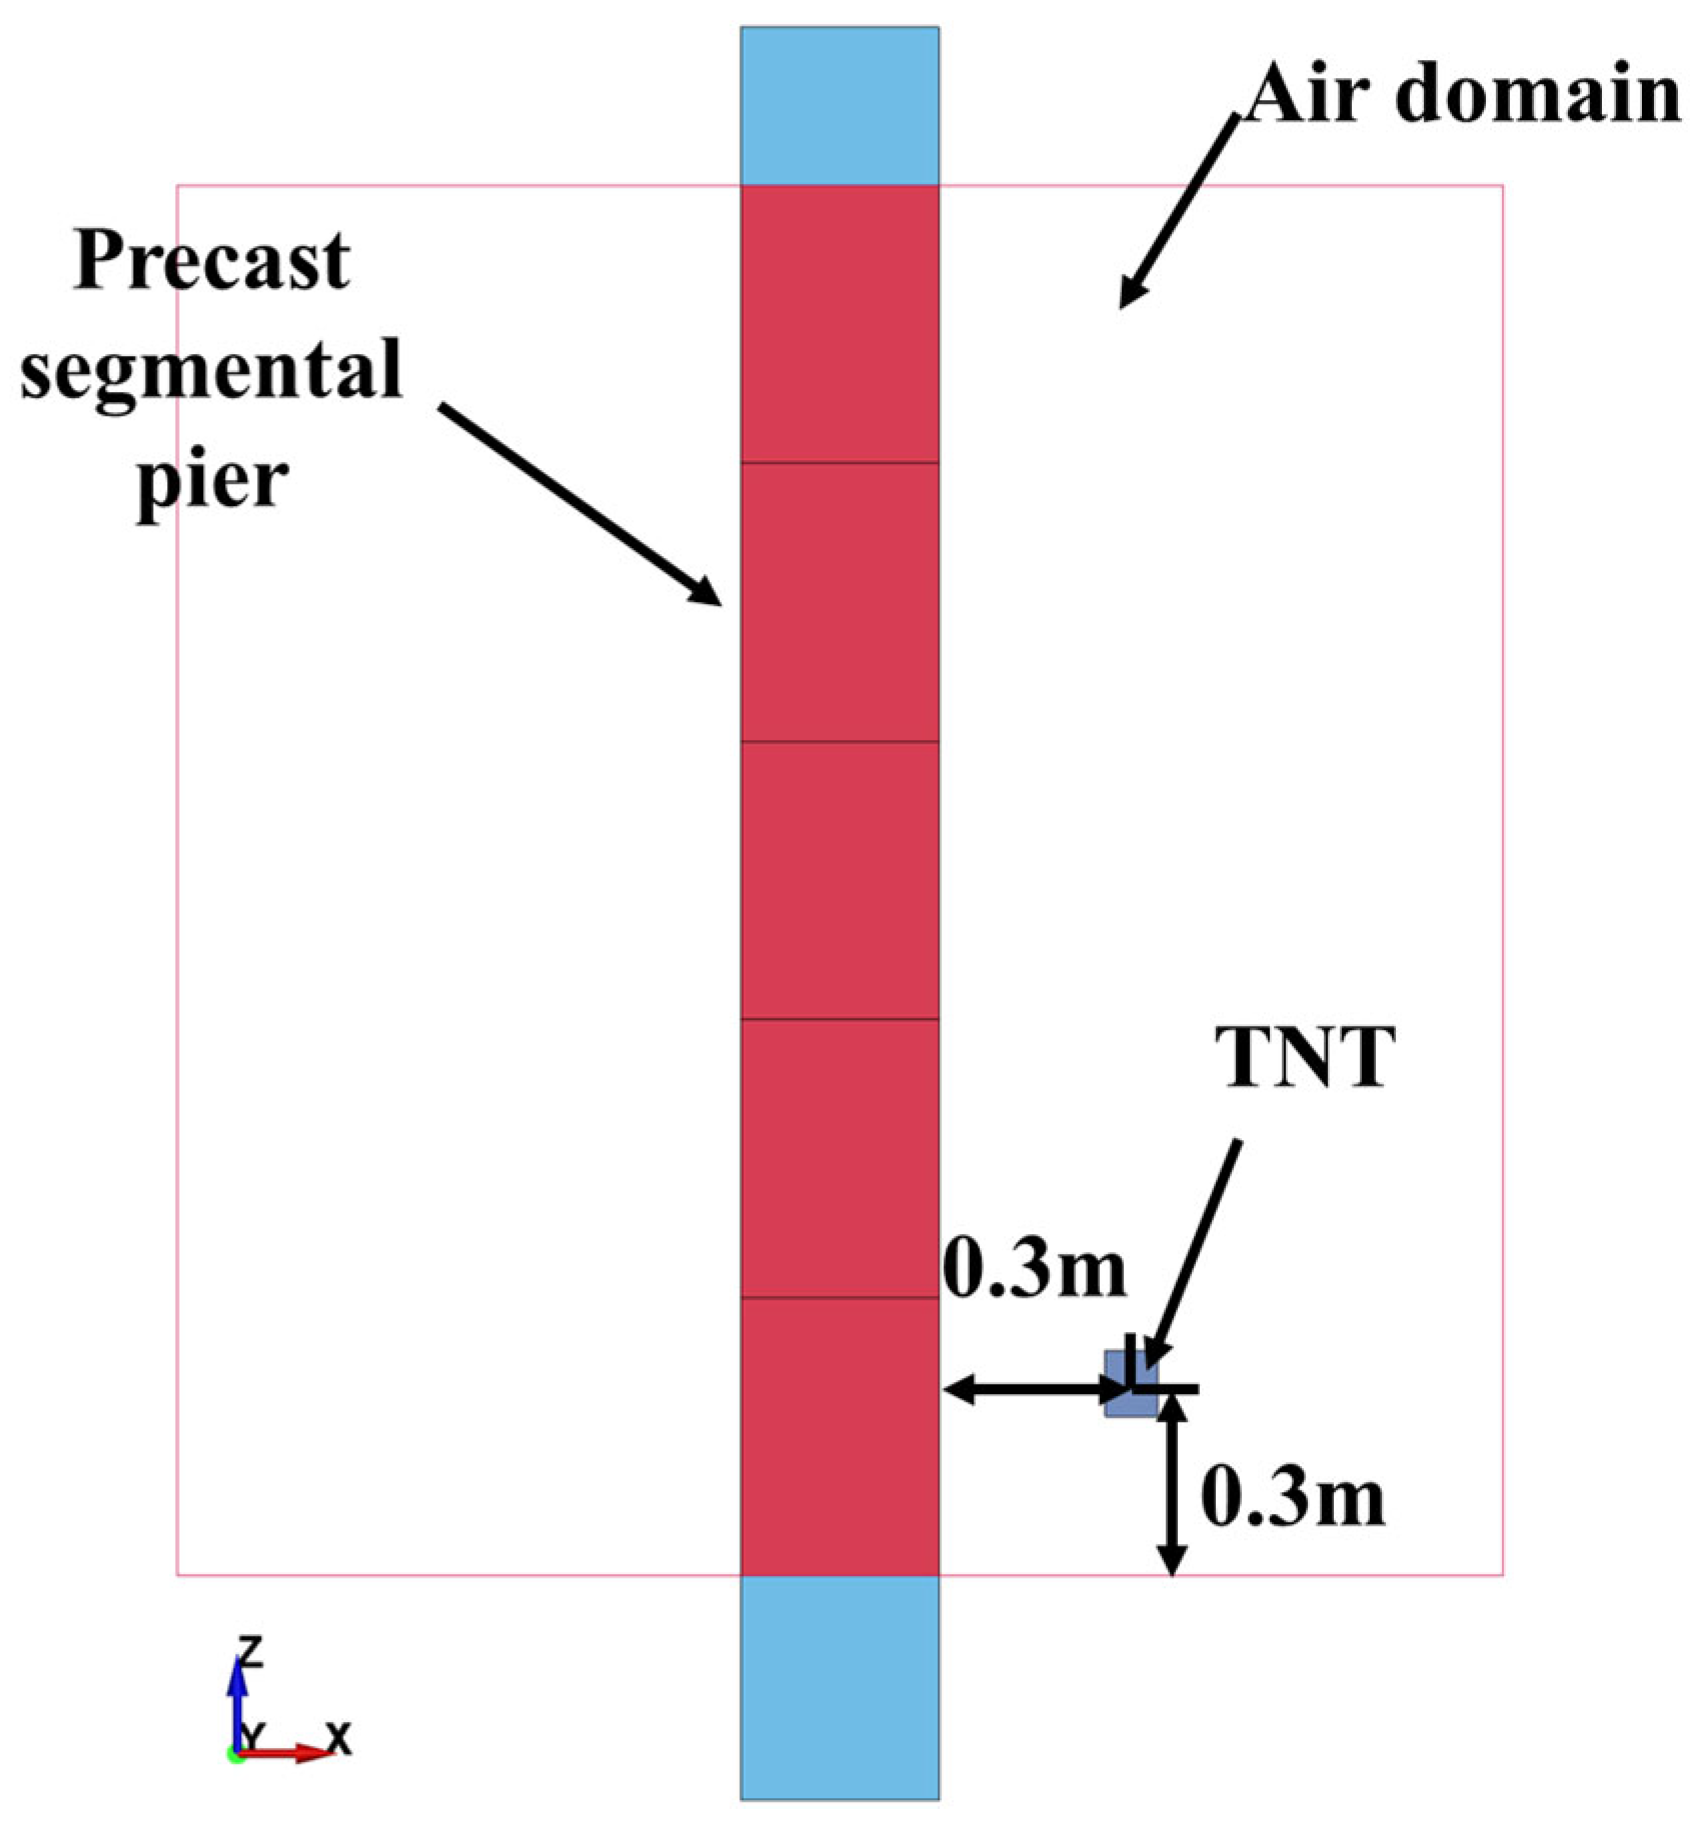
The explosive equivalent of a vehicle bomb varies widely, ranging from tens to hundreds of kilograms. The explosive energy depends on the type of explosive material used. The blast load level is typically measured in TNT equivalents. The authors in [35] conducted a near-field explosion test on scaled segmental precast piers. The results showed that when the TNT charge was 4 kg (distance-to-blast source of 0.3 m and height-to-blast source of 0.3 m), the segmental pier experienced punching shear failure, with partial spalling of the concrete at the pier base. Further studies found that when the TNT charge was increased to 5 kg, the blast load at the pier base did not increase significantly. Therefore, the maximum TNT equivalent in this study was set to 5 kg.
Given that the TNT explosive is in the form of a square block, larger amounts of TNT occupy a larger volume, and the centroid of the TNT is considered the blast center. Therefore, for a near-field explosion study, a distance-to-blast source of 0.3 m, a height-to-blast source of 0.3 m, and a TNT equivalent of 0.5–5.0 kg can be selected as the study conditions. Table 8 presents the near-field explosion conditions. Figure 9 shows the schematic of the explosive positions.

4.3. Distribution of Blast Loads

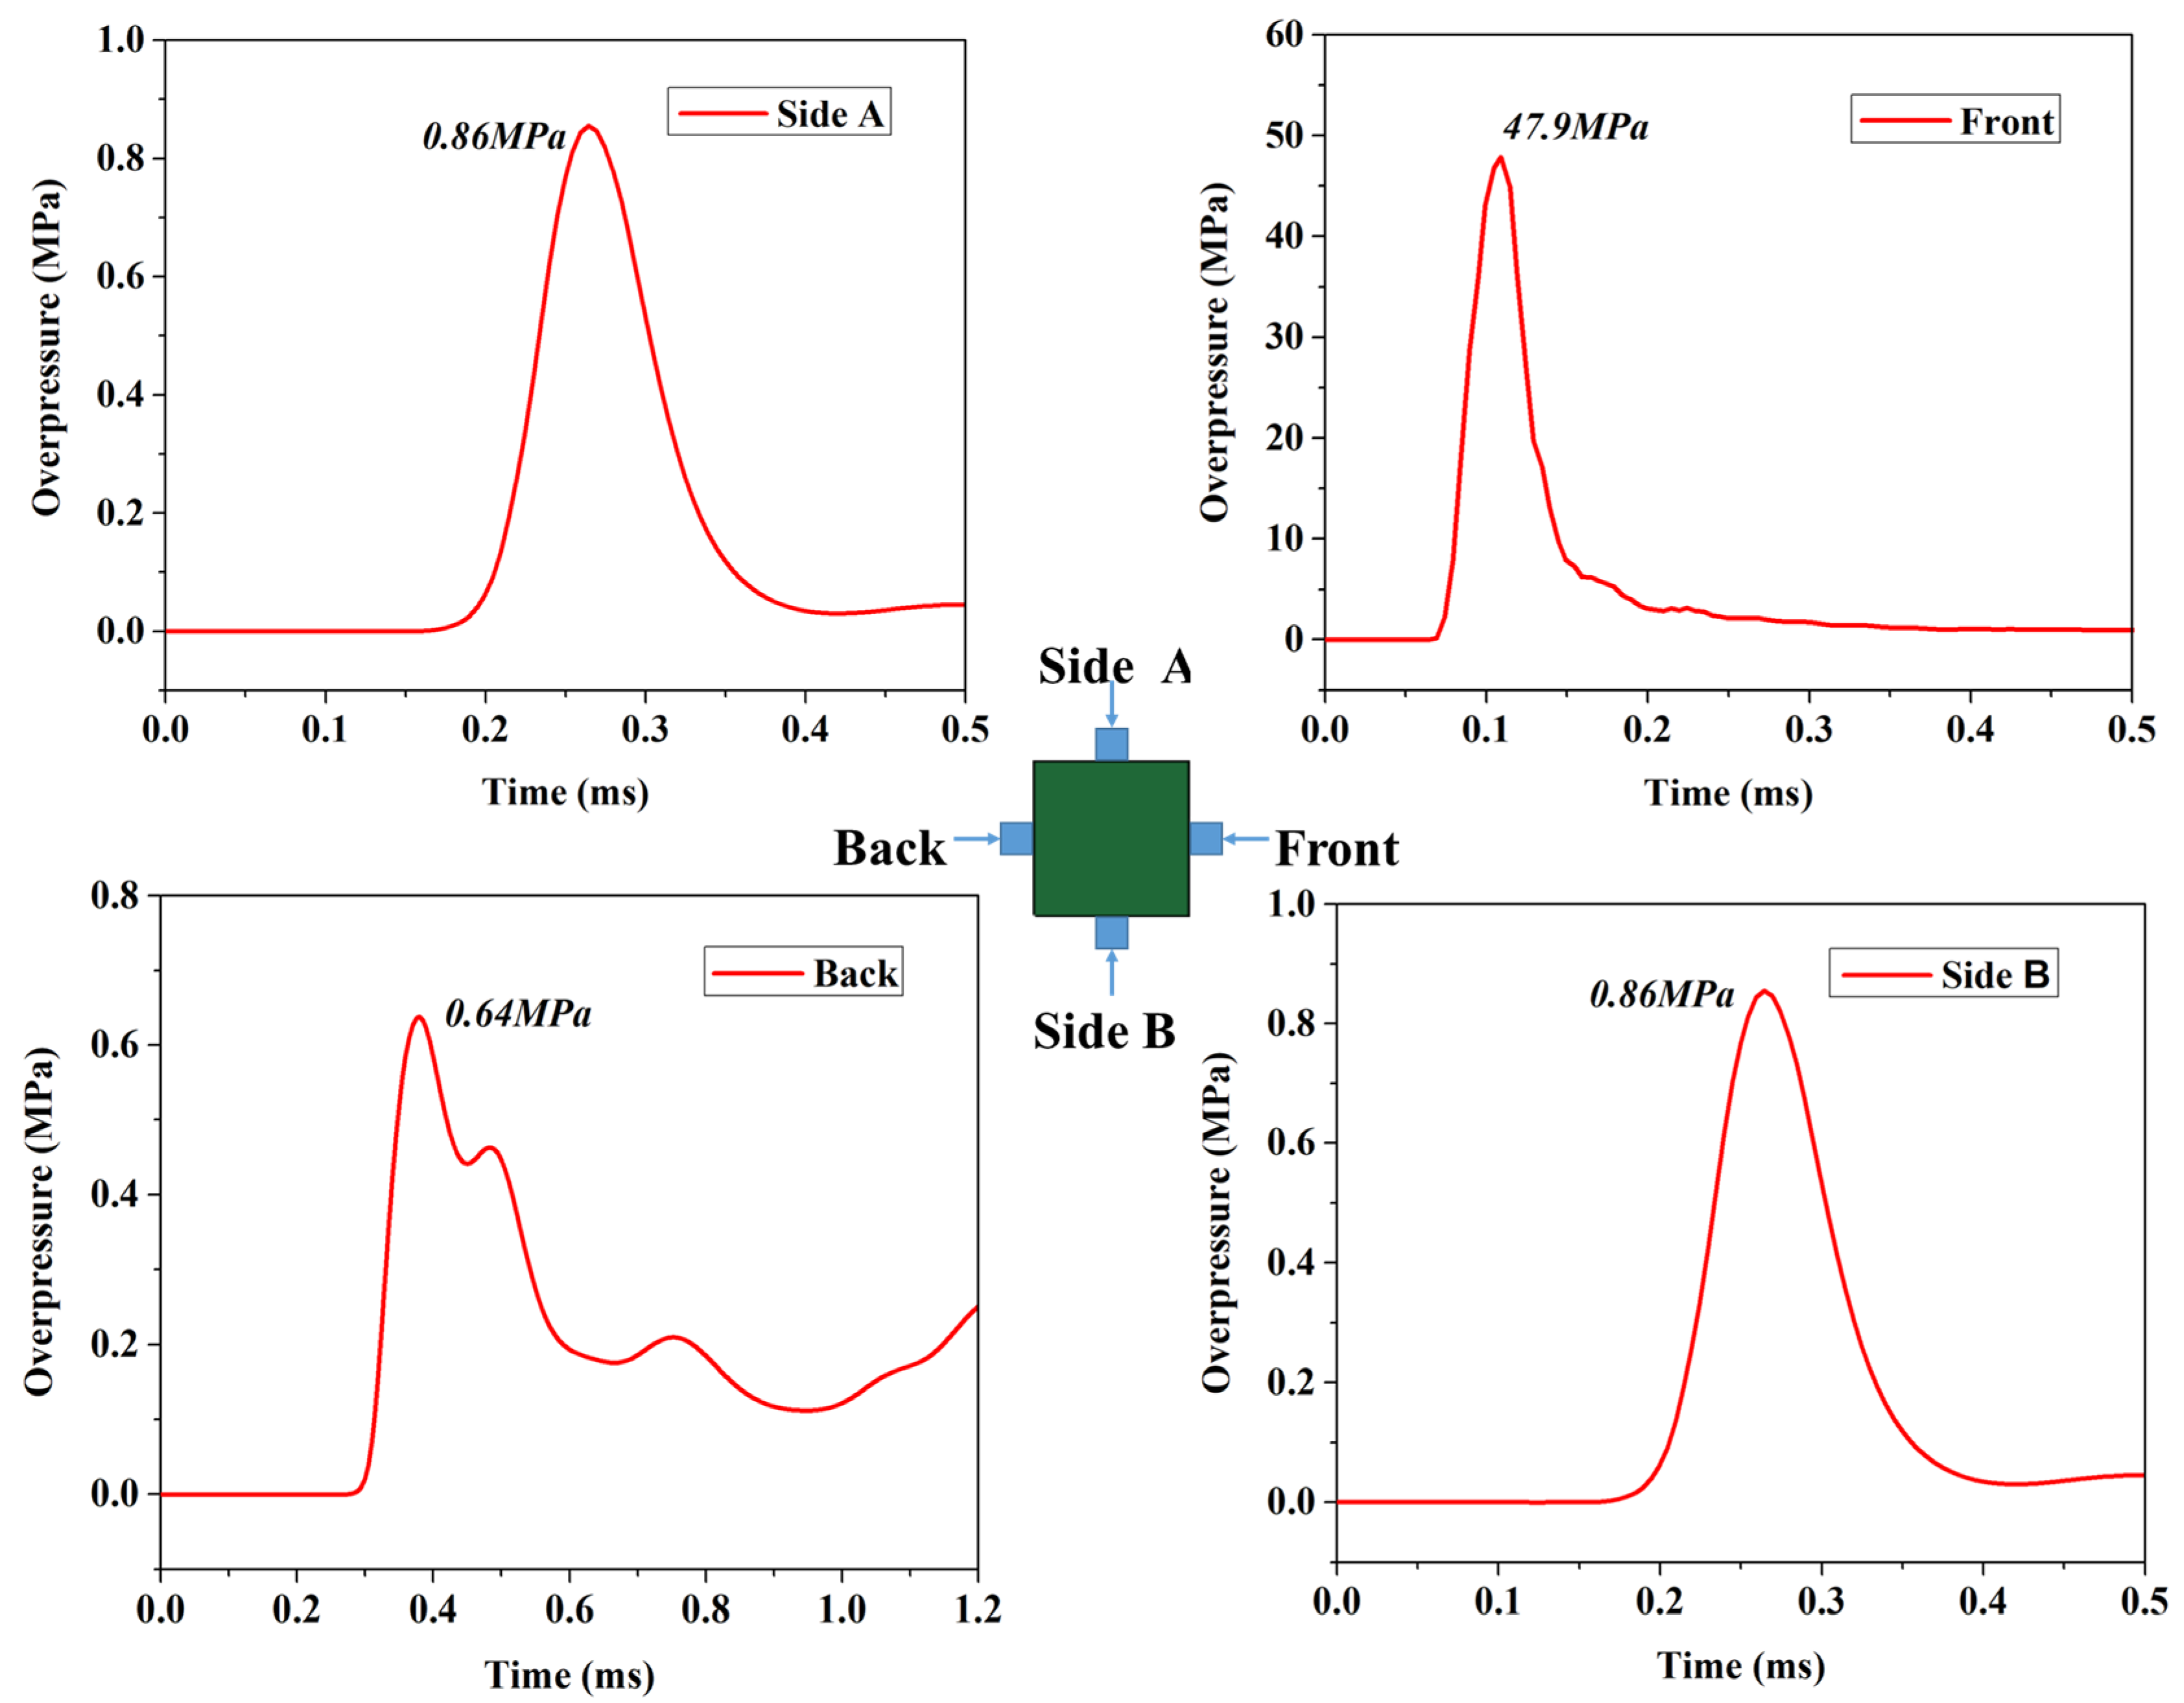
The reflected overpressure on the section under Condition 3 was used as an example. The section of the pier at the same height as the explosive was selected, as shown in Figure 10. The peak overpressure at the midpoint of the blast-facing surface was 47.9 MPa, with a positive overpressure duration of approximately 0.1 ms. Moreover, the overpressure direction was perpendicular to the blast-facing surface. The peak overpressures at midpoints A and B on the side blast surfaces were the same, i.e., 0.86 MPa, which was 1.8% of the peak overpressure on the blast-facing surface, with the overpressure directions being perpendicular to the side blast surface and opposing each other. The peak overpressure at the midpoint of the rear blast surface was 0.64 MPa, which was 1.3% of the peak overpressure on the blast-facing surface. Moreover, the direction was opposite to that of the overpressure on the blast-facing surface. In a near-field explosion, the pier directly blocks the shock wave and rapidly absorbs the energy, with only the diffracted shock wave causing overpressure on the side and rear blast surfaces. Therefore, in the blast-resistant design of the pier, the explosion load on the side blast surface is relatively low and can be symmetrically counteracted, and the explosion load on the rear blast surface can be considered negligible compared with that on the blast-facing surface. Subsequent research should only consider the explosion load on the blast-facing surface of the bridge pier.
Related research [47] has shown that the explosion load on the blast-facing surface of a flat panel is unevenly distributed. The maximum overpressure occurs at the blast center (panel center), and the overpressure at the edges of the panel is relatively lower than that at the blast center. In this study, the bridge pier was a slender component with a relatively small load-bearing area on the blast-facing surface. During the blast-resistant design of the bridge pier, it can be assumed that the uniform explosion load acts at the same height across the blast-facing surface of the pier, with the load magnitude taken as the overpressure at the center of the section as the design reference. In a near-field explosion, the explosion load arrives at different heights of the bridge pier at different times. However, the duration of the load application and the overpressure impact on the blast-facing surface are very short. Therefore, in the blast-resistant design of a bridge pier, it can be assumed that the explosion load acts simultaneously at different heights of the pier and that the overpressure duration is the same at all heights. Thus, the most critical aspect of the design is determining the distribution of the peak overpressure along the height of the bridge pier surface.
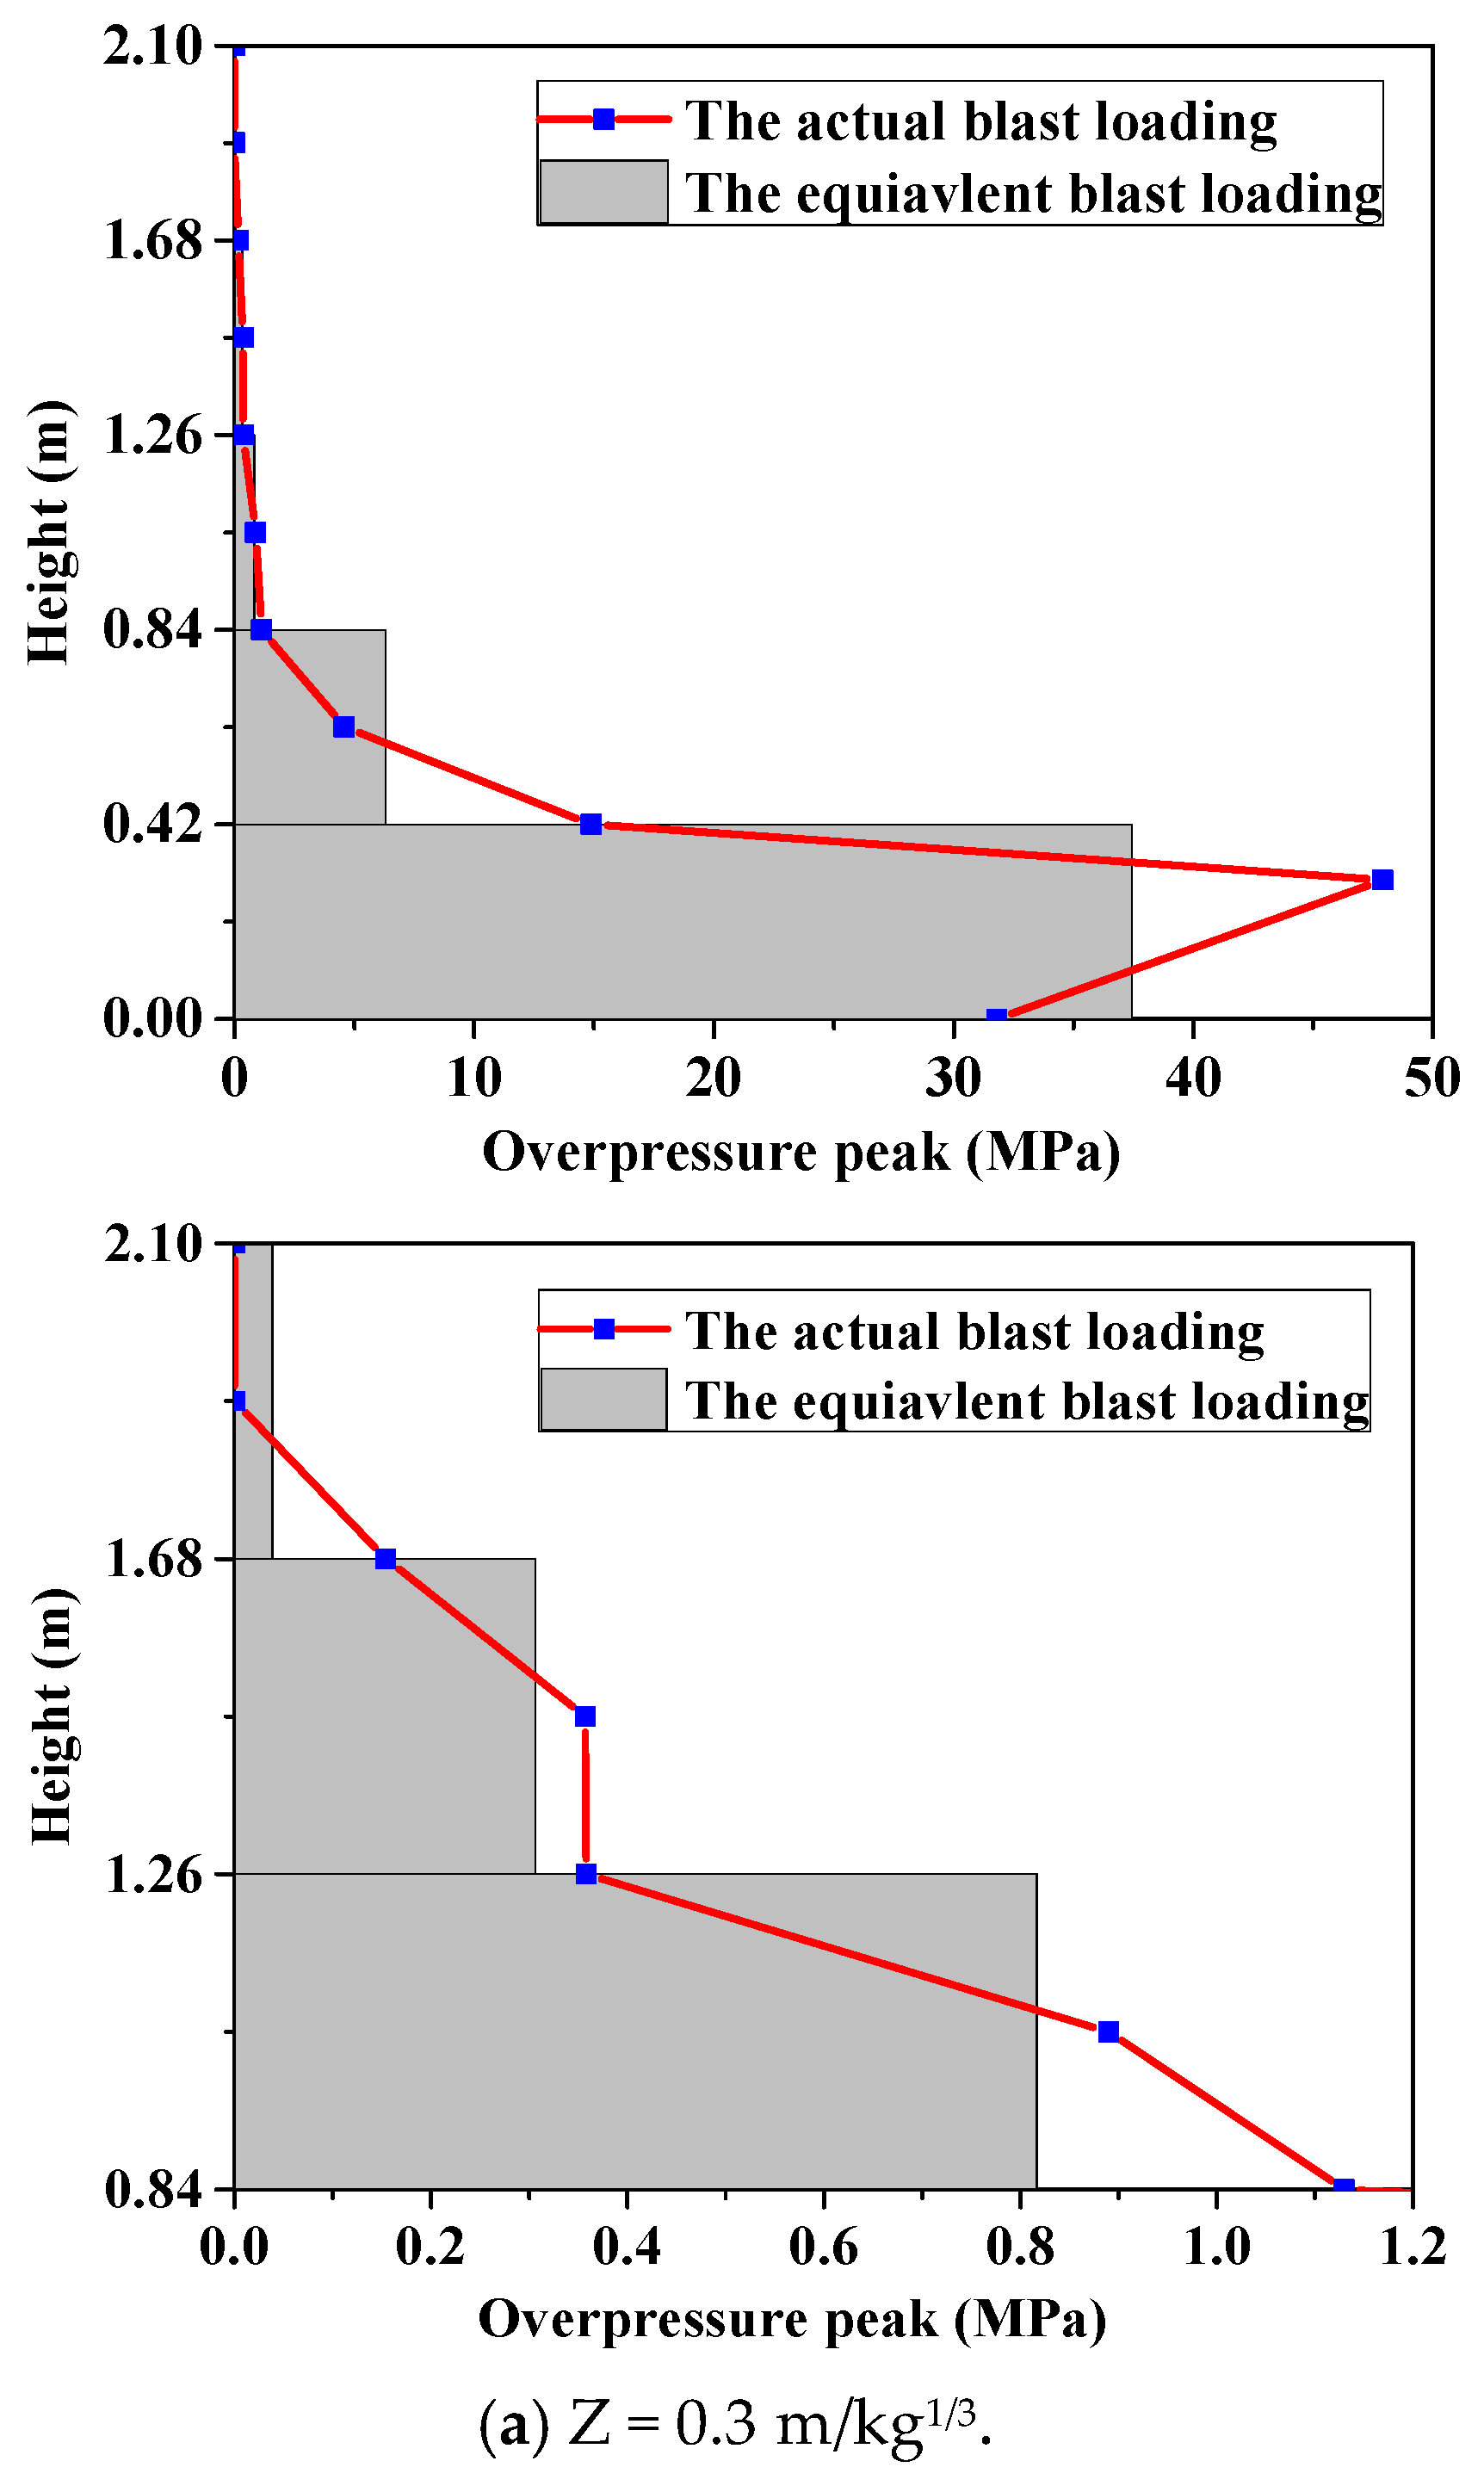
Based on the conditions listed in Table 8, the peak overpressures at different heights of the blast-facing surface were extracted. For Segment 1, the peak overpressures were extracted at the height of the blast source, at the bottom of the segment, and at the top of the segment. For the remaining segments, the peak overpressures were extracted at the segment center, the bottom of the segment, and the top of the segment. The peak overpressures for each segment were simplified, as shown in Figure 11.
The actual peak overpressures along the segment height were equivalently represented as uniform overpressure values. Table 9 presents the equivalent peak overpressures along the height of the segmental bridge pier. Figure 12 shows the distribution of the actual loads versus the equivalent loads at various scaled distances. For a scaled distance of 0.189 m/kg1/3, the equivalent peak overpressures for Segments 1–5 were 124.07, 24.118, 3.223, 2.113, and 1.296 MPa, respectively. Since Segment 1 was closest to the blast center, it experienced the maximum explosion load. In contrast, Segments 3, 4, and 5, being farther from the blast center, experienced lower explosion loads. It can be concluded that the explosion load on Segment 1 is the controlling load inflicting damage to the segmental bridge pier.
The explosion load for Segment 1 is the controlling load, with the maximum equivalent peak overpressure. The equivalent peak overpressure values for the segment were normalized by dividing them by the maximum equivalent peak overpressure (i.e., the equivalent peak overpressure of Segment 1). Table 10 presents the normalized factors. For a scaled distance of 0.175 m/kg1/3, the normalized factors for Segments 1–5 were 1, 0.164, 0.03, 0.021, and 0.011, respectively. Based on these normalization factors, the load coefficients for the blast-resistant design of segmental bridge piers were proposed. According to the design concept for the limit state of RC structural components, research indicates that with 5 kg of TNT (scaled distance of 0.175 m/kg1/3), the probability that the pier would collapse is 100%. Considering the explosion load before collapse, the load coefficients for Segments 1–5 were proposed to be 1, 0.2, 0.03, 0.02, and 0.01, respectively, as shown in Figure 13. These coefficients can be used to determine the explosion loads on different segment surfaces during the blast-resistant design of segmental bridge piers, simplifying the calculation of the explosion loads in the design process. This provides a reference for the blast-resistant design of bridge piers.
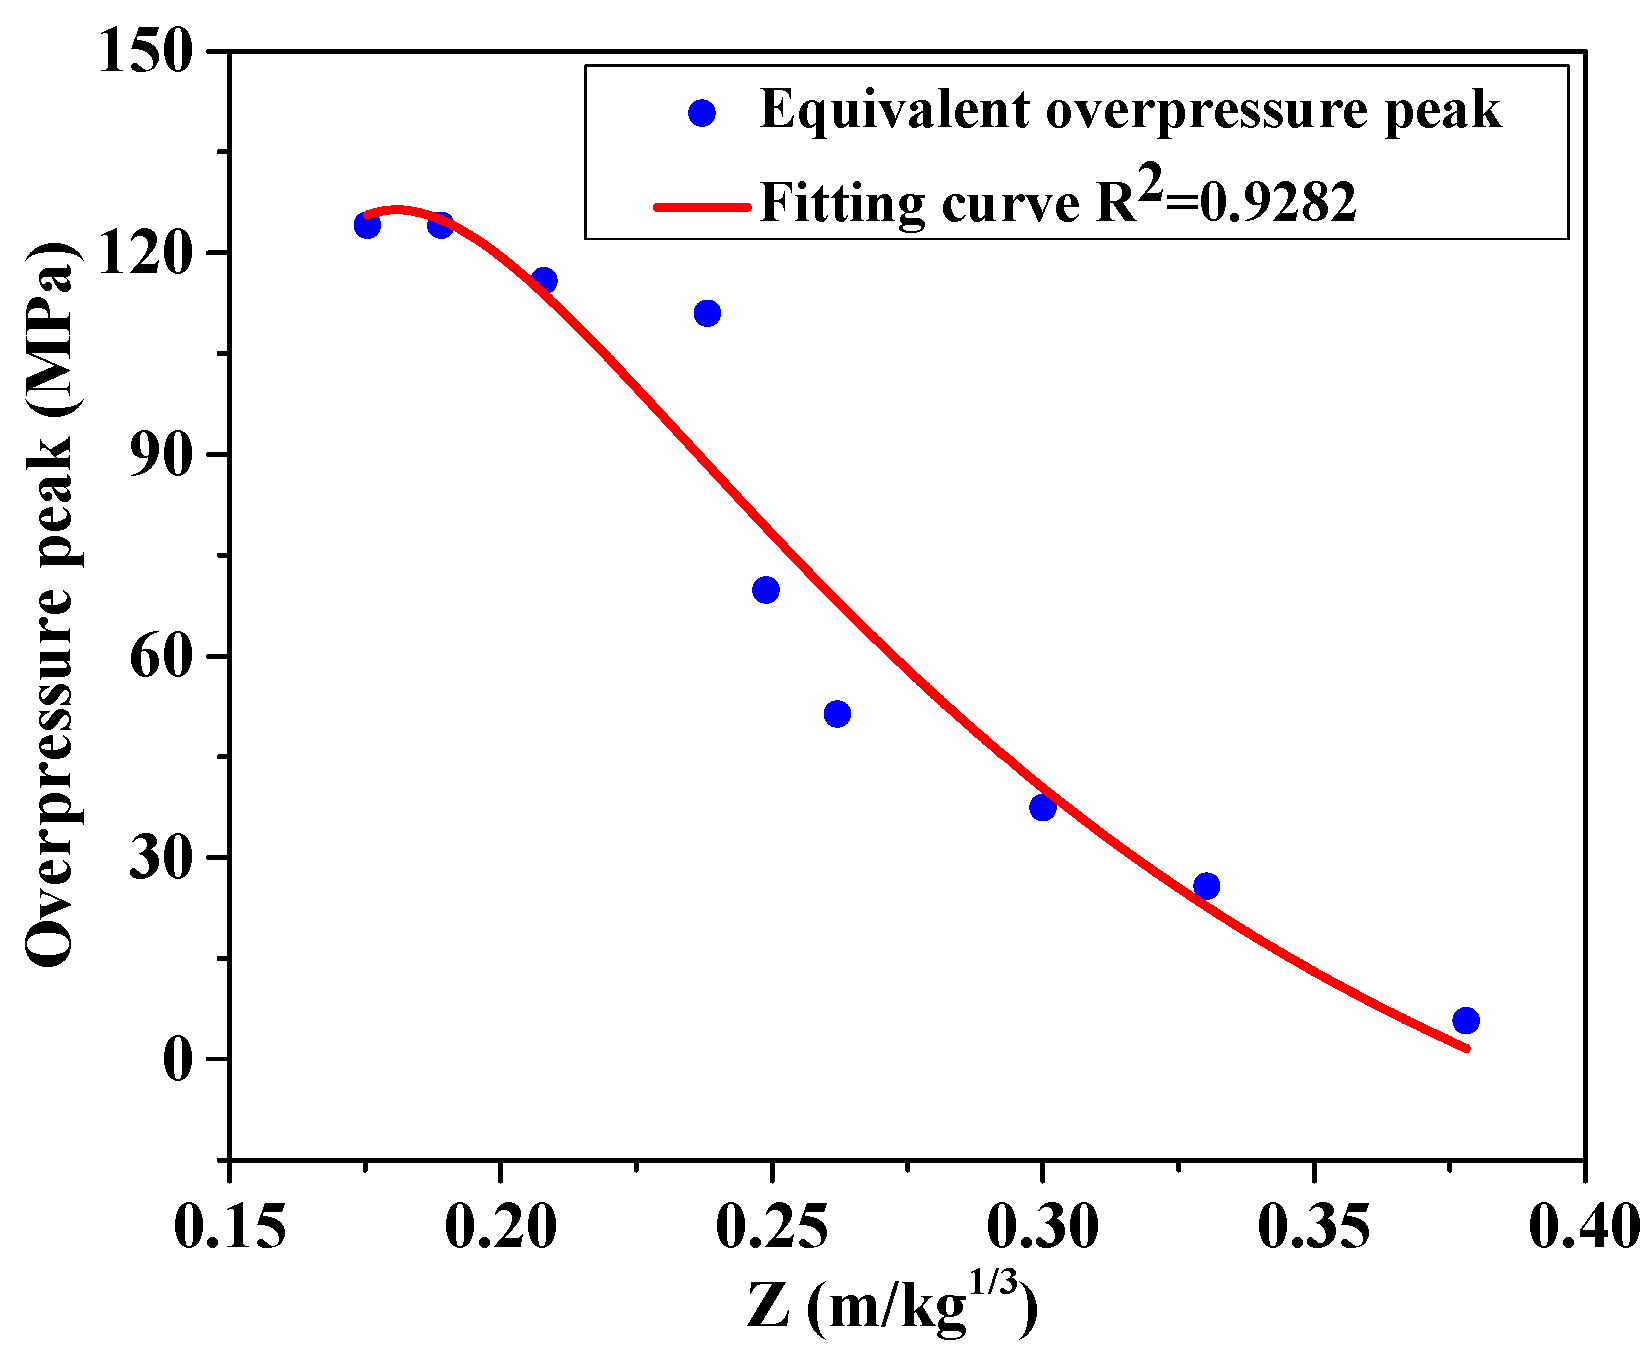
P e q = 79.78 Z + 41.23 Z 2 4.1 Z 3
0.175 m / k g 1 / 3 Z < 0.378 m / k g 1 / 3
Based on the equivalent peak overpressure values and the scaled distances for Segment 1 under the different conditions listed in Table 10, a fitting analysis was performed. Figure 14 shows the obtained fitting curve. The coefficient of determination R2 = 0.9282 indicates a good fit. Moreover, the fitting formula for the scaled distance and maximum equivalent peak overpressure is given by Equation (4), which is applicable to a range of 0.175 m / k g 1 / 3 Z < 0.378 m / k g 1 / 3 . With an explosive center height of 0.3 m, this formula can be used to determine the maximum equivalent peak overpressure for any scaled distance Z within the specified range.
It should be pointed out that the simplified calculation method for explosion reflection overpressure of precast segmental bridge piers in this article is mainly based on numerical analysis data and theoretical derivation. In the future, the overpressure on the bridge pier in the near-field explosion can be measured through blast experiments to further verify this simplified method and conduct further anti-explosion research if a near-field explosion test can be conducted and the overpressure obtained falls within the desired range of 0.175 m / k g 1 / 3 Z < 0.378 m / k g 1 / 3 . The blast-resistant design load coefficient and the maximum equivalent overpressure peak can serve as a reference for the blast-resistant engineering design of five-segmental precast RC piers.

5. Conclusions

This present study showed that the field explosion tests of a five-segmental precast pier were conducted to measure the reflected overpressure on the blast-facing surface of the bridge pier and the incident overpressure in the free field. The measured peak overpressure in the free field was slightly higher than the values specified by the UFC standard. In contrast, the measured peak reflected overpressure on the pier surface was slightly lower than the UFC standard. Overall, the test results could be considered reliable and used for verifying the reliability of numerical simulation. Then, a numerical model of the fluid–structure interaction was established using the ALE algorithm, incorporating the explosive, air domain, and five-segmental precast RC pier structure. The results showed the reflection and circulation interaction between the explosion shock wave and the segmental pier. The numerical simulation results closely matched the experimental results. This confirmed that the established model is reasonable and reliable.
  • Based on the reliable numerical model, simulations were conducted on five-segment precast piers under near-field explosive conditions. The results showed that the explosion load on the side and rear faces of the pier could be neglected when designing for blast resistance in near-field explosions.
  • Through the uniformization of actual overpressure on each segment and the normalization of the equivalent overpressure, a simplified equivalent blast load for the blast-facing surface of the pier was developed.
  • Based on the concept of blast-resistance design, the blast-resistant design load coefficients (1, 0.2, 0.03, 0.02, and 0.01) were proposed for five-segment precast RC piers. Also, a formula for the maximum equivalent peak overpressure (applicable to a range of 0.175 m / k g 1 / 3 Z < 0.378 m / k g 1 / 3 ) was fitted. The results can serve as a reference for the blast-resistant engineering design of five-segment precast RC piers.
In the following work, the blast-resistance design load coefficients of different segmental precast RC piers and their applicable ranges will be determined through additional experimental data and calculated working conditions. There is a wider range of engineering application methods for the blast-resistance design of the segmental precast bridge pier.

Author Contributions

L.L.: conceptualization, methodology, validation, investigation, resources, writing—original draft, writing—review and editing, project administration, supervision, and funding acquisition. Z.Z.: conceptualization. Y.S.: writing—original draft. Y.Y.: writing—review and editing. C.L.: writing—review and editing. Y.C.: validation. All authors have read and agreed to the published version of the manuscript.

Funding

This research was funded by the General Funding of China Postdoctoral Science Foundation (No. 2025M774475).

Data Availability Statement

Some or all data, models, or code that support the findings of this study are available from the corresponding author upon reasonable request, including the experimental data and simulation results presented in this paper.

Acknowledgments

This research is supported by the Postdoctoral Research Station of Civil Engineering, Army Engineering University of PLA.

Conflicts of Interest

The authors declare no conflicts of interest.

References

  1. American Association of State Highway and Transportation Officials. AASHTO LRFD Bridge Design Specifications, 4th ed.; AASHTO: Washington, DC, USA, 2007. [Google Scholar]
  2. JTG D60-2015; General Code for Design of Highway Bridges and Culverts. China Communications Press: Beijing, China, 2015.
  3. Williamson, E.B.; Bayrak, O.; Williams, G.D. Blast-Resistant Highway Bridges: Design and Detailing Guidelines (NCHRP645); Transportation Research Board: Washington, DC, USA, 2010. [Google Scholar]
  4. Fujikura, S.; Bruneau, M. Experimental investigation of seismically resistant bridge piers under blast loading. J. Bridge Eng. 2011, 16, 63–71. [Google Scholar] [CrossRef]
  5. Liu, L. Experimental Study of Differently Protective RC Piers Under Blast Loading. Master’s Thesis, Southeast University, Nanjing, China, 2016. [Google Scholar]
  6. Tang, B. Experimental Investigation of Reinforced Concrete Bridge Piers Under Blast Loading. Master’s Thesis, Southeast University, Nanjing, China, 2016. [Google Scholar]
  7. Zong, Z.H.; Tang, B.; Gao, C.; Liu, L. Experiment on blast-resistance performance of reinforced concrete piers. China J. Highw. Transp. 2017, 30, 51–60. [Google Scholar]
  8. Yang, S.; Zhong, W.; Wang, S.; Kong, W.; Tang, Z.; Tian, Z.; Zhang, R.; Yao, X. On dynamic analysis and damage evaluation for bridge girders under high-energy air burst. Structures 2022, 41, 1488–1500. [Google Scholar] [CrossRef]
  9. Williamson, E.B.; Bayrak, O.; Davis, C.; Williams, G.D. Performance of bridge columns subjected to blast loads. I: Experimental program. J. Bridge Eng. 2011, 16, 693–702. [Google Scholar] [CrossRef]
  10. Williamson, E.B.; Bayrak, O.; Davis, C.; Williams, G.D. Performance of bridge columns subjected to blast loads. II: Results and recommendations. J. Bridge Eng. 2011, 16, 703–710. [Google Scholar] [CrossRef]
  11. Williams, G.D.; Williamson, E.B. Procedure for predicting blast loads acting on bridge columns. J. Bridge Eng. 2012, 17, 490–499. [Google Scholar] [CrossRef]
  12. Williams, G.D. Analysis and Response Mechanisms of Blast-Loaded Reinforced Concrete Columns. Ph.D. Thesis, The University of Texas at Austin, Austin, TX, USA, 2009. [Google Scholar]
  13. Fujikura, S.; Bruneau, M. EXPERIMENTAL and Analytical Investigation of Blast Performance of Seismically Resistant Bridge Piers. Ph.D. Thesis, University at Buffalo, State University of New York, Buffalo, NY, USA, 2008. [Google Scholar]
  14. Yi, Z.; Agrawal, A.K. Blast load effects on highway bridges. I: Modeling and blast load effects. J. Bridge Eng. 2014, 19, 4013023. [Google Scholar] [CrossRef]
  15. Yi, Z.; Agrawal, A.K. Blast load effects on highway bridges. II: Failure modes and multihazard correlations. J. Bridge Eng. 2014, 19, 4013024. [Google Scholar] [CrossRef]
  16. Yi, Z. Blast Load Effects on Highway Bridges. Ph.D. Thesis, The City University of New York, New York, NY, USA, 2009. [Google Scholar]
  17. Liu, L.; Zong, Z.; Gao, C.; Lou, F.; Yuan, S.J. Experimental and numerical study of CFRP protective RC piers under contact explosion. Compos. Struct. 2020, 234, 111658. [Google Scholar] [CrossRef]
  18. Echevarria, A.; Zaghi, A.E.; Chiarito, V. Experimental comparison of the performance and residual capacity of CFFT and RC bridge columns subjected to blasts. J. Bridge Eng. 2016, 21, 4015026. [Google Scholar] [CrossRef]
  19. Mutalib, A.A.; Hao, H. Development of P-I diagrams for FRP strengthened RC columns. In. J. Impact Eng. 2011, 38, 290–304. [Google Scholar] [CrossRef]
  20. Remennikov, A.M.; Uy, B. Explosive testing and modelling of square tubular steel columns for near-field detonations. J. Constr. Steel Res. 2014, 101, 290–303. [Google Scholar] [CrossRef]
  21. Zhang, F.; Wu, C.; Zhao, X.-L.; Li, Z.-X.; Heidarpour, A.; Wang, H. Numerical modeling of concrete-filled double-skin steel square tubular columns under blast loading. J. Perform. Constr. Fac. 2015, 29, B4015002. [Google Scholar] [CrossRef]
  22. Xu, W.J. Experimental Studies of Precast Bridge Piers with UHPC Connection. Ph.D. Thesis, Tongji University, Shanghai, China, 2022. [Google Scholar]
  23. John, E.B. Design of Bridges for Urban Transportation. In Proceedings of the 16th Congress of IABSE, Lucerne, Switzerland, 18–21 September 2000; pp. 291–300. [Google Scholar]
  24. Zhang, K.D.; Jia, J.F.; Bai, Y.L. Numerical simulation analyses on quasi-stastic tests of precast segmental prestressed bridge columns. Eng. Mech. 2022, 39, 207–213. [Google Scholar]
  25. Moussa, A.M.A.; Fahmy, M.F.M.; Wu, Z. Innovative resilient system of precast segmental RC hollow bridge columns. Eng. Struct. 2021, 229, 111555. [Google Scholar] [CrossRef]
  26. Bruneau, M.; Lopez-Garcia, D.; Fujikura, S. Multihazard-Resistant Highway Bridge Bent. In Proceedings of the Structures Congress 2006: Structural Engineering and Public Safety, St. Louis, MO, USA, 18–21 May 2006; pp. 1–4. [Google Scholar]
  27. Li, J.; Hao, H.; Wu, C. Numerical study of precast segmental column under blast loads. Eng. Struct. 2017, 134, 125–137. [Google Scholar] [CrossRef]
  28. Xue, S.; Hao, H.; Hao, Y. Numerical evaluation of the impact performance of precast concrete segmental columns and strengthening techniques. Eng. Struct. 2021, 244, 112725. [Google Scholar] [CrossRef]
  29. Xue, S.; Hao, H.; Hao, Y. Numerical investigation for impact performance of precast concrete segmental piers subjected to vehicle collision. Eng. Mech. 2023, 40, 59–74. [Google Scholar]
  30. Yang, X.; Zhang, Y.Y.; Zhang, N. Dynamic response and damage analysis of precast segmental piers under blast impact. Expl. Shock Waves 2019, 39, 035104. [Google Scholar]
  31. Zhang, Y.Y.; Yang, X.; Feng, J. Failure mode and damage assessment of segmental assembled pier under blast impact. J. Vib. Shock. 2020, 39, 225–233. [Google Scholar]
  32. Chen, X.; Tu, H.Y.; Zhang, Y.Y. Dynamic response and damage assessment method of prefabricated assembly bridge piers with UHPC connections under blast impact. Prot. Eng. 2025, 47, 48–54. [Google Scholar]
  33. Do, T.M.; Pham, T.M.; Hao, H. Stress wave propagation and structural response of precast concrete segmental columns under simulated blast loads. Int. J. Impact Eng. 2020, 143, 103595. [Google Scholar] [CrossRef]
  34. Liu, L.; Ma, J.Z.; Zong, Z.; Tang, G. Blast response and damage mechanism of prefabricated segmental RC bridge piers. J. Bridge Eng. 2021, 26, 04021012. [Google Scholar] [CrossRef]
  35. Liu, L.; Zong, Z.; Ma, J.Z.; Qian, H.; Gan, L. Experimental study on behavior and failure mode of PSRC bridge pier under close-in blast loading. J. Bridge Eng. 2021, 26, 04020124. [Google Scholar] [CrossRef]
  36. Liu, L.; Zong, Z.; Zhou, H.; Chen, Z.; Tang, G. Vulnerability assessment of precast segmental RC bridge piers under near-field explosion. China J. Highw. Transp. 2024, 37, 212–223. [Google Scholar]
  37. Ma, W.Y.; Wu, H. Dynamic behavior of precast segmental RC pier under close-in blast loading. Eng. Mech. [CrossRef]
  38. U.S. Army. Corps of Engineers. Fundamental of Protective Design for Conventional Weapons; U.S. Army Engineers Waterways Experiment Station: Vicksburg, MS, USA, 1984. [Google Scholar]
  39. U. S. Army. TM5-1300. In Structures to Resist the Effects of Accidental Explosion; US Government Printing Office: Washington, DC, USA, 1969. [Google Scholar]
  40. UFC 3-340-02; Structures to Resist the Effects of Accidental Explosion. U.S. Department of Defense: Arlington, TX, USA, 2008.
  41. Henrych, J.; Major, R. The Dynamics of Explosion and Its Use; Elsevier: Amsterdam, The Netherlands, 1979. [Google Scholar]
  42. Brode, H.L. Blast wave from a spherical charge. Phys. Fluids. 1959, 2, 217–229. [Google Scholar] [CrossRef]
  43. Yang, X.; Shi, S.Q.; Cheng, P.F. Forecast and simulation of peak overpressure of TNT explosion shock wave in the Air. Blasting 2008, 25, 15–18. [Google Scholar]
  44. Lin, D.C.; Bai, C.H.; Zhang, Q. Overpressure functions of blast waves for explosions in air. Expl. Shock Waves. 2001, 21, 41–46. [Google Scholar]
  45. Zhang, Y.Y.; Xu, K.; Zhou, G.P. Analysis on the distribution characteristics of reflective overpressure of precast segmental piers under the impact of explosion. J. Disater Prev. Mitig. Eng. 2023, 43, 1358–1365. [Google Scholar]
  46. Wu, J.; Liu, J.B.; Du, Y.X. Elastic-plastic dynamic calculation and numerical analysis of assembling blast resistant wall under effect of vehicle bombs. J. Disaster Prev. Mitig. Eng. 2007, 27, 394–400. [Google Scholar]
  47. Wang, W. Study on Damage Effects and Assessments Method of Reinforced Concrete Structural Members Under Blast Loading. Ph.D. Thesis, National University of Defense Technology, Changsha, China, 2012. [Google Scholar]
Figure 1. The real conditions.
Civileng 06 00053 g001
Figure 2. Mid-field blast loading test.
Civileng 06 00053 g002aCivileng 06 00053 g002b
Figure 3. Overpressure history of the free-field.
Civileng 06 00053 g003
Figure 4. Overpressure history on the front of the pier.
Civileng 06 00053 g004
Figure 5. Finite element model of the explosive and air.
Civileng 06 00053 g005
Figure 6. Comparison between the numerical simulation and experimental results of the overpressure history.
Civileng 06 00053 g006
Figure 7. Reflection diagram of an explosion shock wave.
Civileng 06 00053 g007
Figure 8. Circulation diagram of explosion shock wave.
Civileng 06 00053 g008
Figure 9. Explosive location under near-field explosion case.
Civileng 06 00053 g009
Figure 10. Overpressure history of a square pier.
Civileng 06 00053 g010
Figure 11. Equivalent process of the overpressure peak.
Civileng 06 00053 g011
Figure 12. Distributions of the actual and equivalent loads.
Civileng 06 00053 g012aCivileng 06 00053 g012b
Figure 13. Anti-explosion design loading coefficient for precast segmental bridge pier.
Civileng 06 00053 g013
Figure 14. Fitting curve of maximum equivalent overpressure peak.
Civileng 06 00053 g014
Table 1. Blast loading during test.
Test ConditionTNT W/kgDistance to Blast Source R/mHeight to Blast Source Hd/mScaled Distance Z/(m/kg1/3)
PC 1131.053
PC 2231.052.38
PC 3431.051.89
PC 4421.051.26
Table 2. Free field overpressure sensors.
Test ConditionRso1/mRso2/mHd/m
PC 1231.05
PC 2231.05
PC 3231.05
PC 4341.05
Table 3. Effective overpressure peak measured during the test.
PC 1PC 2PC 3PC 4
Height/mPso1/MPaPry/MPaPry/MPaPso1/MPaPso1/MPa
1.470.290.504
1.050.2140.2570.5010.740.34
0.630.210.517
Table 4. Comparison between measured overpressure peak and UFC standard [40].
1.05 m HeightPC 1PC 2PC 3PC 4
Pso1Pry3Pry3Pso1Pso1
Measured value (MPa)0.2140.2570.5010.740.34
UFC value (MPa)0.20.360.730.640.22
Error (%)6.528.631.413.535.3
Table 5. Material model and state equation parameters of TNT.
MAT_008
ρ 0 D P C J
1630 kg/m36930 m/s2.1 GPa
EOS_002
V E e ω ABR1R2
1.0 7 × 10 9 J/m30.33.71 GPa3.23 GPa4.150.95
Table 6. Material model and state equation parameters of air.
MAT_009EOS_001
ρ 0 C 0 ~ C 3 , C 6 C 4 , C 5 E a
1.29 kg/m300.4 2.5 × 10 5 J/m3
Table 7. Comparison between the numerical simulation and experimental results of the overpressure peak.
1.05 m HeightPC 1PC 2PC 3PC 4
Pso1Pry3Pry3Pso1Pso1
Measured value (MPa)0.2140.2560.5010.740.34
Simulated value (MPa)0.1360.2110.4620.7440.24
Error (%)36.417.67.780.5429.4
Table 8. Near-field explosion cases.
ConditionsTNT Equivalent W (kg)Distance-to-Blast Source R (m)Height-to-Blast Source H (m)Scaled Distance Z (m/kg1/3)
Condition 10.50.30.30.378
Condition 20.750.30.30.33
Condition 31.00.30.30.3
Condition 41.50.30.30.262
Condition 51.750.30.30.249
Condition 62.00.30.30.238
Condition 73.00.30.30.208
Condition 84.00.30.30.189
Condition 95.00.30.30.175
Note: Z = R/W1/3.
Table 9. Equivalent overpressure peak value on segments under different scaled distances (MPa).
Z (m/kg1/3)Segment 5Segment 4Segment 3Segment 2Segment 1
0.3780.0240.1860.5051.9135.644
0.330.070.3290.7275.79825.75
0.30.0390.3060.8176.30337.44
0.2620.420.792.3210.9451.36
0.2490.3110.7051.44112.8169.82
0.2380.4990.9342.38521.84110.97
0.2080.961.633.37317.893115.82
0.1891.2962.1133.22324.118124.07
0.1751.3952.5683.7620.39124.09
Table 10. Normalization of the equivalent overpressure peak value on precast segmental pier.
Equivalent peak overpressure/maximum equivalent peak overpressureZ/(m/kg1/3)Segment 5Segment 4Segment 3Segment 2Segment 1
0.3780.0040.0330.0890.3391
0.330.0030.0130.0280.2251
0.30.0010.0080.0230.1681
0.2620.0080.0150.0450.2131
0.2490.0040.010.0210.1831
0.2380.0050.0080.0210.1971
0.2080.0080.0140.0290.1541
0.1890.010.0170.0260.1941
0.1750.0110.0210.030.1641
Blast-resistant design load coefficient0.010.020.030.21
Disclaimer/Publisher’s Note: The statements, opinions and data contained in all publications are solely those of the individual author(s) and contributor(s) and not of MDPI and/or the editor(s). MDPI and/or the editor(s) disclaim responsibility for any injury to people or property resulting from any ideas, methods, instructions or products referred to in the content.