Abstract
Although sulfonated acridines and acridones are valuable scaffolds in diagnostics and materials science, to our best knowledge, there is no comprehensive study that addresses how the degree of sulfonation depends on reaction parameters. To fill this gap, we investigated the sulfonation behavior of unsubstituted acridine and acridone under classical conditions, using sulfuric acid, oleum, and chlorosulfonic acid. A factorial experimental design was applied to systematically evaluate the influence of temperature and reagent excess on the extent of sulfonation, while keeping the reaction time constant. Products were analyzed by HPLC–MS/MS to determine the degree of sulfonation and its distribution. Regioselectivity and product isolation were not addressed in this study. Our results provide a foundational dataset for controlling sulfonation level for these heterocycles and can help future synthetic applications where defined sulfonation patterns are desired.
1. Introduction
Sulfonation is a widely used transformation in synthetic and medicinal chemistry, serving as a versatile tool to enhance molecular properties and expand chemical space. Introducing sulfonic acid groups (-SO3H) can dramatically increase aqueous solubility, enable salt formation, and modulate pharmacokinetic profiles. Sulfonated compounds are frequently used as drug candidates, intermediates, or solubilizing auxiliaries. Moreover, sulfonation provides chemically stable and strongly acidic functionalities, which can participate in hydrogen bonding, ionic interactions, or serve as anchoring units for further derivatization, including bioconjugation and immobilization strategies [1,2,3].
Acridine and acridone (Figure 1) are polycyclic nitrogen-containing heterocycles with broad utility in medicinal chemistry, materials science, and supramolecular chemistry. Their rigid, planar structures enable DNA intercalation [4], which underlies their use as scaffolds for anticancer [5], antimicrobial [6], and antiparasitic [7] agents.
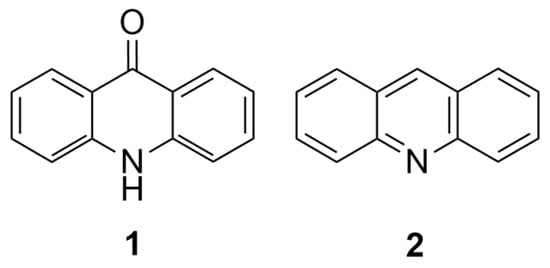
Figure 1.
The basic structure of acridone (1) and acridine (2).
Acridines also possess notable photophysical properties, serving as fluorescent dyes [8], photosensitizers [9], and redox-active materials [10]. Acridones, the oxidized analogs, show distinct hydrogen bonding and coordination behavior, making them valuable in chemosensor development and coordination chemistry. As highly fluorescent fluorophores with high quantum yield and strong environment-sensitive emission [11], acridones are attractive for media-responsive chromophores in biolabeling and imaging [12], and have been widely applied as solvatochromic probes and fluorescent markers in diagnostics [13]. Sulfonation of acridines and acridones represents a key modification strategy to enhance aqueous solubility and introduce functional handles for further derivatization. Despite the recognized importance of acridine and acridone scaffolds in medicinal and materials chemistry, relatively few studies have addressed their direct sulfonation. In particular, there is a lack of systematic investigations into how the degree of sulfonation can be controlled or optimized. The lack of comprehensive strategies to control sulfonation therefore represents a significant limitation for the broader synthetic utility and application of these scaffolds.
These electron-rich heterocycles undergo electrophilic aromatic substitution, typically favoring position 2 in acridones due to resonance stabilization by the carbonyl group. This positional preference was already observed in early studies, which demonstrated that heating phenylanthranilic acid in concentrated sulfuric acid at 85 °C for 30 min led to acridone formation, while prolonged heating promoted sulfonation predominantly at position 2, yielding acridone-2-sulfonic acid as the main product and the 4-substituted isomer to a lesser extent. The regioselectivity was confirmed by converting the sulfonic acid to the corresponding hydroxy derivative under alkaline conditions and comparing it with an authentic standard [14]. This outcome is consistent with the expected behavior based on the general directing rules of electrophilic aromatic substitution (SEAr) under thermodynamic control. Classical methods for the sulfonation of acridines and acridones employ concentrated sulfuric acid or oleum (20–30% SO3) at elevated temperatures (100–150 °C for 12–24 h), while more selective or milder protocols apply reagents such as chlorosulfonic acid (ClSO3H) or pyridine-SO3 complex in solvents like DMF or dioxane [15,16,17,18,19,20,21,22,23,24]. The latter approach allows for greater control over regioselectivity and functional group tolerance. Additionally, sulfonyl chlorides formed in situ by chlorosulfonation (typically between 50 and 100 °C for 12–24 h [15,23,24]) can be hydrolyzed to the corresponding sulfonic acids. These methods provide versatile access to sulfonated acridine/acridone scaffolds for applications in dyes, sensors, and biologically active compounds.
Sulfonated acridines and acridones have found increasing utility in chemical biology, diagnostics, and analytical chemistry, primarily due to their favorable photophysical properties and tunable water solubility. These compounds are widely applied as fluorescent tags in site-specific protein labeling, glycan profiling, and nucleotide sensing, where high quantum yield, environmental sensitivity, and chemical stability are essential [16,17,18]. Recent studies have demonstrated their integration into dual-modal biosensors for exosomal protein detection in cancer diagnostics [19], as well as their use in biacridine-based DNA probes [20] and ATP analogs for enzymatic activity monitoring [21]. The broad functionalizability of the acridone core—partly enabled by sulfonation—supports its role in the development of advanced fluorescent tools. Notably, the significant number of related patents underscores the industrial relevance of this compound class, particularly in the fields of biomolecular detection, ink and pigment formulation [22], and fluorescence-based analytical platforms.
In addition to monosulfonated derivatives, disulfonic acid analogs of acridines [25,26,27,28] and acridones [15] have also been reported and are relatively common. However, higher degrees of sulfonated derivatives—such as tri- or tetrasulfonic acid ones—have not been described as scaffolds. Furthermore, systematic studies exploring the relationship between sulfonation degree and reaction conditions are also lacking. To the best of our knowledge, no comprehensive investigation has been conducted to define the optimal parameters for selective mono- versus disulfonation or investigate the synthetic feasibility of higher sulfonated derivatives yet. To address this gap, we undertook a systematic study aimed at mapping the sulfonation behavior of acridine and acridone under diverse conditions, with the goal of establishing practical guidelines for controlled sulfonation at different substitution levels.
2. Experimental
2.1. General Procedure for Sulfonation Reactions
All starting materials and reagents were obtained from Sigma-Aldrich Corporation (Merck, Darmstadt, Germany) and used without further purification unless otherwise noted.
Acridine (2) or acridone (1) (10 mg) was weighed into a 5.0 mL glass vial, which was subsequently purged with argon and cooled in an ice–brine bath. To the cooled vial, 30% oleum was added dropwise in 1, 5, or 20 molar equivalents, depending on the experimental design. The vial was then placed in an aluminum heating block and the temperature was adjusted to −10 °C (using an ice–salt bath), 25 °C, or 200 °C, as required. Once the target temperature was reached, the reaction mixture was stirred for 2 h.
After completion, the reaction was quenched with 1 M aqueous BaCl2 solution (in 100-fold excess), and the resulting inorganic precipitate was removed by filtration. The filtrate was directly analyzed by HPLC-MS without further purification to assess the distribution of sulfonated products.
The sulfonated products were subjected to several isolation techniques, including preparative thin-layer chromatography (PTLC) and reversed-phase preparative thin-layer chromatography (RP-PTLC modified with octadecylsilyl (C18) groups). However, the increased polarity and high water solubility of the compounds strongly limited the applicability of these methods. In particular, RP-PTLC plates tolerate eluents with a maximum of ~30% water content, which was insufficient to dissolve the analytes adequately, resulting in poor separation. Consequently, pure fractions could not be obtained by these approaches.
9-Oxo-9,10-dihydroacridine-2,7-disulfonic acid:
1H-NMR (500 MHz, DMSO-d6): δ [ppm]: 11.98 (s, 1H), 8.40 (d J = 2.8 Hz, 2H), 7.83 (d, J = 10 Hz, 2H), 7.54 (d, J = 10.8 Hz, 2H).
9-Oxo-9,10-dihydroacridine-2,3,6,7-tetrasulfonic acid
1H-NMR (500 MHz, DMSO-d6): δ [ppm]: 12.05 (s, 1H), 8.44 (d, J = 3.0 Hz, 2H), 8.27 (d J = 2.8 Hz, 2H).
2.2. HPLC–MS Analysis
HPLC-MS analyses were performed on a Waters 2695 liquid chromatography system (Waters Corporation, Milford, MA, USA) coupled with a Waters Micromass Quattro Ultima Pt tandem quadrupole mass spectrometer (Waters Corporation, Milford, MA, USA). Detection was carried out using a Waters 2487 Dual λ Absorbance Detector at 240 and 270 nm. The detection wavelengths of 240 nm and 270 nm were chosen according to the UV absorption properties of the investigated compounds. Acridone and acridine both display strong absorption maxima near 240 nm (acridone: λmax ≈ 249 nm (ethanol), acridine: λmax ≈ 247 nm (ethanol)), while introduction of sulfonic acid substituents induces a bathochromic shift of the absorption maximum In aromatic systems, sulfonic acid substitution typically induces a 5–15 nm bathochromic shift, which can reach 20–30 nm in highly sulfonated derivatives, which led to 270 nm being chosen as the upper limit. Accordingly, monitoring at both 240 and 270 nm ensures optimal sensitivity across the different sulfonation states of the analytes. To account for differences in UV response among the sulfonated products, average absorbance values from both wavelengths were used for quantification. No purification of the crude reaction mixtures was performed prior to analysis, and product distributions were estimated directly from the UV chromatograms.
Chromatographic separation was achieved on a Waters XSelect CSH C18 column (Waters Corporation, Milford, MA, USA) (150 × 4.6 mm, 3.5 µm) maintained at 40 °C. The mobile phase consisted of 0.1% formic acid in water (eluent ‘A’) and acetonitrile–water (95:5 v/v) containing 0.1% formic acid (eluent ‘B’), delivered at a flow rate of 1.0 mL/min. The elution program included a linear gradient from 5% to 100% ‘B’ over 1–7 min, followed by an isocratic step at 100% ‘B’ (7–8 min), and a 2 min re-equilibration at 5% ‘B’. The injection volume was 5 µL.
Mass spectrometric detection was carried out using electrospray ionization (ESI) in positive ion scan mode (m/z 150–900). The ion source temperature was set to 350 °C, with a nitrogen drying gas flow rate of 5.5 L/min and a nebulizer pressure of 6 bar. The quadrupole temperature was 120 °C, the capillary voltage was 2500 V, and the fragmentor voltage was 60 V. Data acquisition and analysis were performed using MassLynx 4.0 software (Waters Corporation, Milford, MA, USA).
The sulfonated species were identified based on their molecular ions in the mass spectra; no further structural characterization was attempted. Positional isomerism of the sulfonic acid groups was not investigated. The retention times of the detected products were as follows: acridine derivatives: mono-3.368 min, di-1.835 min, tri-1.485 min; acridone derivatives: mono-4.796 min, di-1.735 min, tri-1.468 min, tetra-1.335 min.
2.3. NMR Analysis
In addition to UV-detected HPLC–MS analysis, NMR spectroscopy was also attempted for the characterization of the sulfonated derivatives. Under conventional workup conditions, the products showed partial decomposition during solvent evaporation, which hindered the acquisition of reproducible spectra. Lyophilization was also tested as an alternative, but this approach resulted in tarry residues and further degradation. In response, a gentler method was used; the reaction mixture was kept acidic, diluted with 10 volumes of tetrahydrofuran, and subsequently evaporated. Although decomposition was still observed to some extent (Figure 2), this procedure allowed us to record spectra for selected derivatives.
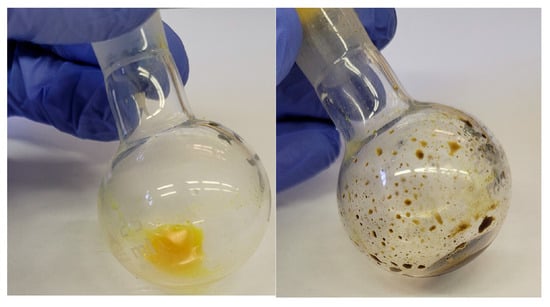
Figure 2.
The degradation of the products observed during workup.
For acridines, the di- and trisulfonated products could not be characterized by NMR without isolation because regioisomeric mixtures were present. For acridones, the di- and tetrasulfonated derivatives yielded clean spectra corresponding to single products. In particular, the disulfonated acridone could be unambiguously characterized, as two-dimensional heteronuclear multiple bond correlation (HMBC) and heteronuclear single quantum coherence (HSQC) NMR correlations confirmed the substitution pattern (Figure 3). Based on this, we were able to determine the substitution pattern of the tetrasulfonated derivative from its 1H-NMR spectra, since the meta coupling was observable, the positions of the two additional sulfonic acid groups could also be determined. This observation is consistent with the orientation rules of electrophilic aromatic substitution under thermodynamic control.
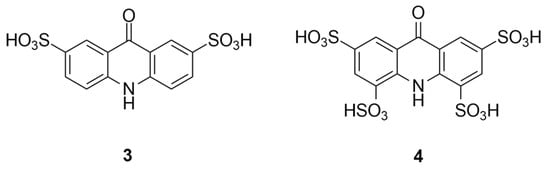
Figure 3.
Substitution patterns of the di-(3) and tetrasulfonated (4) acridone derivatives as determined by NMR analysis.
The monosulfonated products could not be analyzed by NMR, as they precipitated from all tested solvents and thus could not be maintained in solution at the required concentrations. Both NMR spectra can be found in the Supporting Information.
2.4. Design of Experiment Approach for Mapping the Reactivity Landscape
To systematically investigate the influence of temperature and reagent excess on the degree of sulfonation of acridone, a 32 full factorial design was employed using the Spotfire Statistica 14.2.0.18 software (TIBCO Software Inc., Palo Alto, CA, USA). The design included two factors (reaction temperature and equivalents of 30% oleum) at three levels each (−10 °C, 25 °C, and 200 °C; 1, 5, and 10 equivalents, respectively), resulting in a total of nine experimental conditions. A fixed reaction time of 120 min was applied in all experiments.
The outcome variable, the average degree of sulfonation, was calculated as a weighted mean based on the number of sulfonic acid groups in each identified product and their respective relative abundances in the UV chromatogram recorded at 240–270 nm. The formula for calculating the average degree of sulfonation can be found in the Supporting Information.
Product identification was based on mass spectrometric data, while the UV signal at 240–270 nm was used for semi-quantitative evaluation. No correction factors were applied for differences in molar absorptivity.
Statistical analysis of the model was carried out at a 95% confidence level. The ANOVA analysis indicated that both temperature and reagent excess were statistically significant factors influencing the degree of sulfonation.
3. Results and Discussion
3.1. Preliminary Screening of Sulfonating Agents
Sulfonation reactions were initially carried out using classical reagents—concentrated sulfuric acid (cc. H2SO4) and chlorosulfonic acid (ClSO3H)—in selected stoichiometries and temperature conditions. Both acridine and acridone were reacted with 1, 2, or excess equivalents of the sulfonating agent at room temperature, 50 °C, and 120 °C. In all cases, only mixtures of mono- and at most, disulfonated products were obtained, accompanied by significant formation of unidentified by-products.
Chlorosulfonic acid showed a reactivity pattern similar to that of sulfuric acid, but without any improvement in selectivity or conversion. All reactions were initially carried out for 120 min; however, conversion levels remained low. Extending the reaction time (overnight reactions) did not increase the degree or selectivity of sulfonation. Detailed information can be found in the Supplementary Materials.
Based on these observations, concentrated sulfuric acid and chlorosulfonic acid were excluded from further optimization studies, and only 30% oleum was used in subsequent experiments (Figure 4).
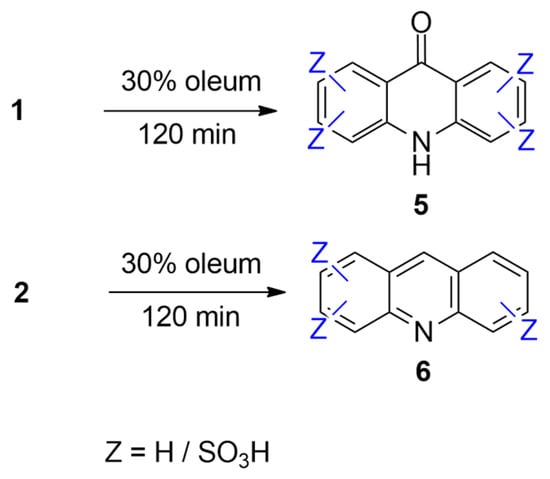
Figure 4.
The general reaction scheme for the sulfonation of acridone (1) and acridine (2) using 30% oleum.
The poor selectivity and low conversion observed with both concentrated sulfuric acid and chlorosulfonic acid highlighted the limitations of these reagents for controlled sulfonation. These outcomes are likely due to their relatively low free SO3 content and strong dehydrating nature, which favors side reactions and incomplete sulfonation. In contrast, oleum—containing a defined amount of free SO3—offers a more tunable sulfonation. Therefore, 30% oleum was selected as the sulfonating agent for further studies, providing better control over the degree of sulfonation under systematically varied conditions.
3.2. Effect of Temperature and Reagent Excess on the Sulfonation of Acridine (2)
To systematically investigate the effect of reaction conditions on the degree of sulfonation, acridine was reacted with 30% oleum in selected stoichiometric and thermal conditions. The number of reagent equivalents (1, 5, and 10) and the reaction temperature (−10 °C, 25 °C, and 200 °C) were systematically altered while maintaining a constant reaction time of 120 min. The upper temperature limit (200 °C) was chosen to approach the operational limits of the system without risking thermal degradation of the starting material or products [29,30].
The product distributions observed under the different conditions are summarized in Figure 5.
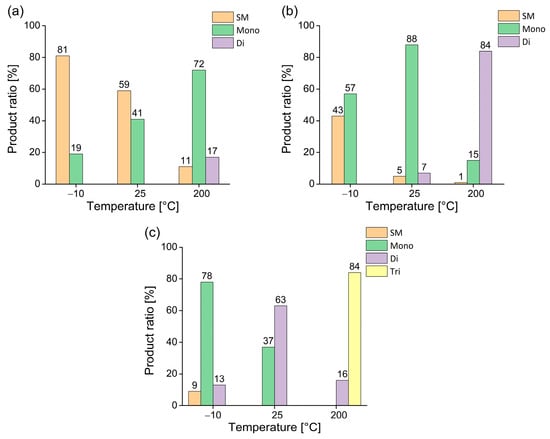
Figure 5.
Temperature-dependent sulfonation of acridine using different excesses of 30% oleum ((a): 1 equiv., (b): 5 equiv., (c): 10 equiv.) with fixed reaction time of 120 min. (SM denotes the starting material, while mono-, di-, and tri- denote the sulfonated product according to the corresponding degree of sulfonation).
As shown in Figure 5a, the use of one equivalent of 30% oleum led to low conversion at reduced temperature and room temperature. However, at 200 °C, selective formation of the monosulfonated acridine derivative was achieved with reasonable efficiency.
When five equivalents of sulfonating agent were applied (Figure 5b), approximately 60% conversion was observed at −10 °C, with the monosubstituted derivative accounting for about 40% of the mixture. At 25 °C, the reaction went cleanly to afford the monosulfonated product with excellent conversion and selectivity. At 200 °C, under the same conditions, the reaction ran with near-complete conversion and high selectivity, resulting in the disulfonated acridine as the dominant product, while the monosubstituted compound was only present in minor quantities.
Upon applying a large excess of sulfonating agent (10 equivalents, Figure 5c), the reaction at −10 °C yielded predominantly the monosulfonated product, accompanied by minor amounts of unreacted starting material and disubstituted compound. At room temperature, full conversion was achieved; however, despite the disubstituted acridine derivative being the major product, a significant amount (approximately 40%) of the monosubstituted one was still observed. Finally, the use of 10 equivalents of sulfonating agent at 200 °C led to the formation of the trisubstituted product with good selectivity, while only approximately 15% of the disulfonated derivative was present.
In summary, the degree of sulfonation of acridine could be tuned effectively by controlling both the reagent excess and the reaction temperature. Mild conditions favored mono- and disubstitution, while harsher thermal conditions and larger excesses led to higher degrees of sulfonation. These results provide a clear rationale for selecting temperature and stoichiometry as key variables in further optimization experiments.
3.3. Effect of Temperature and Reagent Excess on the Sulfonation of Acridone (1)
Following the systematic study of acridine, we applied the same experimental design to acridone to assess how the carbonyl functional group influences the sulfonation pattern under comparable conditions. Using 30% oleum in 1, 5, and 10 equivalents at −10 °C, 25 °C, and 200 °C with a constant reaction time of 120 min, we monitored the distribution of sulfonated products to determine the impact of temperature and reagent excess on the reaction outcome.
The corresponding product distributions obtained under these conditions are presented in Figure 6.
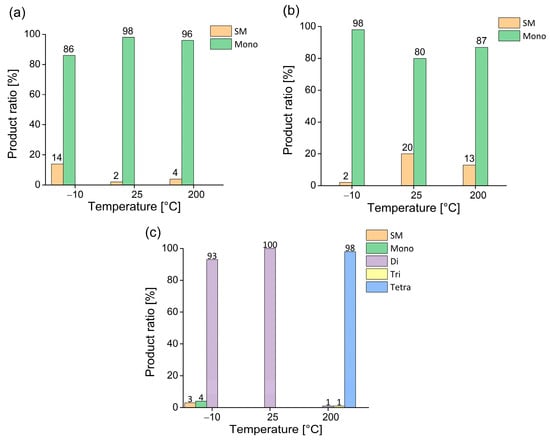
Figure 6.
Temperature-dependent sulfonation of acridone using selected excesses of 30% oleum ((a): 1 equiv., (b): 5 equiv., (c): 10 equiv.) with fixed reaction time of 120 min. (SM denotes the starting material, while mono-, di-, tri-, and tetra- denote the sulfonated products according to the corresponding degree of sulfonation).
In this case, it can be seen that both equimolar and slightly excessive amounts of sulfonating agent led to similar results. Regardless of the reaction temperature, the monosubstituted acridone derivative was consistently formed, with conversions ranging from moderate to nearly quantitative.
However, when a larger excess (10 equivalents, Figure 6c) of the sulfonating agent was applied, selective formation of the disulfonated product was achieved at both −10 °C and 25 °C. Moreover, at 200 °C, the reaction ran with excellent selectivity toward the tetrasulfonated derivative, which accounted for approximately 98% of the product mixture.
Specific sulfonated derivatives with different degrees of substitution could be obtained with high selectivity by varying the reaction parameters in the cases of both acridine and acridone. To systematically explore and visualize the optimal conditions for achieving each substitution level, we proceeded to apply a design of experiments (DoE) approach, enabling a continuous, multivariable analysis of these key parameters.
3.4. Multivariate Optimization for Sulfonation of Acridone (1) by DoE
To better understand and visualize how temperature and reagent excess jointly influence the sulfonation outcome, we applied a DoE approach to acridone. While the previous discrete experiments revealed clear trends in product selectivity, a continuous model allows the identification of optimal conditions for maximizing the formation of specific sulfonated derivatives.
By systematically varying the two main parameters—reaction temperature and equivalents of 30% oleum—within a defined range, we aimed to generate predictive surface plots for each degree of substitution. This multivariate analysis facilitates the rational selection of reaction conditions tailored to the targeted substitution pattern.
A 32 full factorial experimental design was constructed by varying the two selected parameters—reaction temperature and reagent excess—at three levels. This resulted in a total of nine experiments covering the full parameter space. The degree of sulfonation, expressed as a continuous outcome variable, was determined for each condition based on the relative distribution of the identified acridone sulfonation products.
The results were visualized as response surface plots, which enabled a detailed assessment of how the two parameters jointly influence the substitution pattern. This approach provided an intuitive and quantitative means of identifying the optimal conditions for achieving a desired level of sulfonation.
The results of the factorial experiment are presented in Figure 7, which shows the response surface plot of the average sulfonation degree of acridone as a function of reaction temperature and reagent excess.
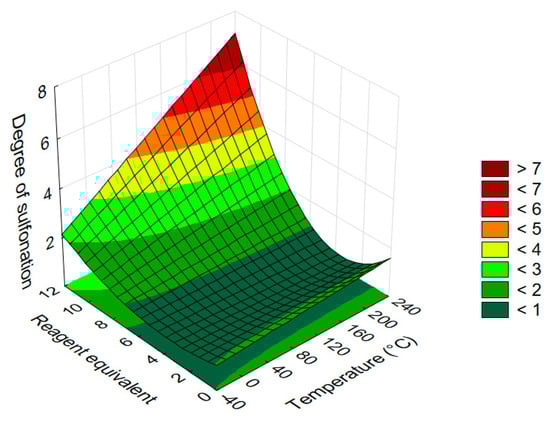
Figure 7.
Response surface diagram illustrating the effect of temperature and equivalents of 30% oleum on the average degree of sulfonation in acridone (1) (reaction time: 120 min).
Analysis of the response surface reveals that temperature exerts a linear, while reagent excess a quadratic influence on the average degree of sulfonation in acridone. In both cases, the degree of sulfonation increases monotonically with the respective parameter, although a slight decrease is suggested below ~3 equivalents, likely due to the curvature of the fitted model.
The effect of temperature becomes more pronounced at higher reagent excess; at lower equivalents (1–5 equiv.) and reduced temperatures, the impact of temperature is negligible. This can be attributed to the low conversion typically observed under such mild conditions, where the degree of sulfonation remains in the range of 0–1. Once higher conversions are reached, the influence of temperature becomes significant.
Within the tested range, the reagent excess exerts a stronger influence on the outcome than the temperature. Notably, the steep and convex response surface indicates that achieving intermediate levels of sulfonation with acridone is particularly challenging. Selective preparation of mono- and trisulfonated derivatives is the most demanding, based on the surface gradient.
Under harsh conditions, the enhanced reactivity of the aromatic ring leads to rapid formation of highly sulfonated products, making oversulfonation a realistic risk when selectivity is desired. At the same time, acridone derivatives with four sulfonic acid groups (or even more) can be obtained without the signs of degradation.
These findings highlight the inherent reactivity of acridone and the dominant role of reagent excess in governing the outcome of sulfonation. While higher substitution states can be accessed efficiently, fine-tuning for intermediate degrees of sulfonation remains challenging due to the steep response surface.
To assess whether similar trends are for acridine, an analogous experimental design was applied and evaluated.
3.5. Multivariate Optimization for Sulfonation of Acridine (2) by DoE
Following the optimization for acridone (1), a comparable response surface analysis was also performed for acridine (2) to investigate how the absence of the carbonyl group influences the sulfonation. The experimental design mirrored the previous setup, using temperature and reagent equivalents as continuous variables. The resulting surface plot (Figure 8) illustrates the predicted degree of sulfonation as a function of both parameters.
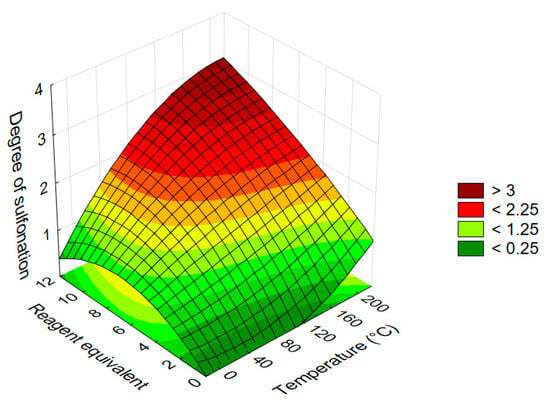
Figure 8.
Response surface diagram illustrating the effect of temperature and equivalents of 30% oleum on the average degree of sulfonation in acridine (2) (reaction time: 120 min).
Both temperature and reagent equivalency exhibited significant effects on the degree of sulfonation. Compared to acridone (1), the response surface for acridine showed a more concave shape with gentler slopes, indicating that intermediate substitution levels are easier to achieve with improved overall selectivity. This lower sensitivity to parameter changes can be attributed to the enhanced SEAr (electrophilic aromatic substitution) reactivity of acridine.
Between the two factors, the effect of reagent equivalents was found to be even more pronounced than in the acridone case. The degree of sulfonation increased monotonically across most of the studied parameter range. However, under harsher conditions, the response surface leveled off, indicating a saturation effect at a sulfonation degree of three; beyond this point, further substitution could not be achieved without exceeding the thermal stability limits of the molecule. Although the SEAr reactivity of acridine (2) is theoretically higher, the observed limitation in the achievable degree of sulfonation is likely due to protonation of the acridine (2) scaffold under strongly acidic conditions, which reduces its nucleophilicity and hampers further substitution.
From a selectivity point of view, the controlled synthesis of the disulfonated acridine derivative appears to be the most challenging, likely due to the narrow window in which it can be formed without progressing to over-substitution.
4. Conclusions
In this work, we systematically examined the sulfonation behavior of acridine (2) and acridone (1) with 30% oleum, mapping the influence of reaction conditions on substitution patterns. The resulting sulfonation map provides a basis for preparing derivatives with defined substitution degrees, thereby supporting the broader synthetic utility of these scaffolds in future applications. Our findings demonstrated that both heterocycles exhibited distinct sulfonation profiles. Acridine (2) showed a strong dependence on both temperature and reagent excess, with selective formation of mono-, di-, and even trisulfonated products achievable through appropriate tuning of the parameters. In contrast, acridone (1) displayed a more predictable and gradual increase in the degree of sulfonation, largely influenced by the excess of oleum rather than temperature alone.
For mapping the sulfonation landscape, we implemented a full factorial experimental design at three levels of temperature and reagent equivalence. The resulting response surface models provided a continuous, visual representation of the degree of sulfonation as a function of the two variables. These models allowed us to precisely identify the optimal reaction windows for the selective synthesis of mono-, di-, tri-, and even tetrasulfonated species. The comparison of sulfonation between acridine and acridone also highlighted the key differences in parameter sensitivity and selectivity trends, offering valuable insight for future synthetic applications.
Altogether, the study establishes a comprehensive sulfonation map for the degree of substitution from 1 to 4, providing a rational framework for the targeted preparation of sulfonated acridine and acridone derivatives. Stepwise functionalization allows gradual tuning of water solubility and provides versatile entry points for further transformations, supporting applications in medicinal chemistry, imaging, and supramolecular host design.
Supplementary Materials
The following supporting information can be downloaded at https://www.mdpi.com/article/10.3390/org6030043/s1, Figure S1: UV-detected HPLC-MS chromatogram recorded at 240 nm under the reaction conditions of acridine with 1 equivalent of 30% oleum at −10 °C; Figure S2: UV-detected HPLC-MS chromatogram recorded at 270 nm under the reaction conditions of acridine with 1 equivalent of 30% oleum at −10 °C; Figure S3: UV-detected HPLC-MS chromatogram recorded at 240 nm under the reaction conditions of acridine with 1 equivalent of 30% oleum at 25 °C; Figure S4: UV-detected HPLC-MS chromatogram recorded at 270 nm under the reaction conditions of acridine with 1 equivalent of 30% oleum at 25 °C; Figure S5: UV-detected HPLC-MS chromatogram recorded at 240 nm under the reaction conditions of acridine with 1 equivalent of 30% oleum at 200 °C; Figure S6: UV-detected HPLC-MS chromatogram recorded at 270 nm under the reaction conditions of acridine with 1 equivalent of 30% oleum at 200 °C; Figure S7: UV-detected HPLC-MS chromatogram recorded at 240 nm under the reaction conditions of acridine with 5 equivalents of 30% oleum at −10 °C; Figure S8: UV-detected HPLC-MS chromatogram recorded at 270 nm under the reaction conditions of acridine with 5 equivalents of 30% oleum at −10 °C; Figure S9: UV-detected HPLC-MS chromatogram recorded at 240 nm under the reaction conditions of acridine with 5 equivalents of 30% oleum at 25 °C; Figure S10: UV-detected HPLC-MS chromatogram recorded at 270 nm under the reaction conditions of acridine with 5 equivalents of 30% oleum at 25 °C; Figure S11: UV-detected HPLC-MS chromatogram recorded at 240 nm under the reaction conditions of acridine with 5 equivalents of 30% oleum at 25 °C (second measurement); Figure S12: UV-detected HPLC-MS chromatogram recorded at 270 nm under the reaction conditions of acridine with 5 equivalents of 30% oleum at 25 °C (second measurement); Figure S13: UV-detected HPLC-MS chromatogram recorded at 240 nm under the reaction conditions of acridine with 5 equivalents of 30% oleum at 25 °C (third measurement); Figure S14: UV-detected HPLC-MS chromatogram recorded at 270 nm under the reaction conditions of acridine with 5 equivalents of 30% oleum at 25 °C (third measurement); Figure S15: UV-detected HPLC-MS chromatogram recorded at 240 nm under the reaction conditions of acridine with 5 equivalents of 30% oleum at 200 °C; Figure S16: UV-detected HPLC-MS chromatogram recorded at 270 nm under the reaction conditions of acridine with 5 equivalents of 30% oleum at 200 °C; Figure S17: UV-detected HPLC-MS chromatogram averaged from measurements at 240 nm and 270 nm, recorded under the reaction conditions of acridine with 10 equivalents of 30% oleum at −10 °C; Figure S18: UV-detected HPLC-MS chromatogram averaged from measurements at 240 nm and 270 nm, recorded under the reaction conditions of acridine with 10 equivalents of 30% oleum at 25 °C; Figure S19: UV-detected HPLC-MS chromatogram averaged from measurements at 240 nm and 270 nm, recorded under the reaction conditions of acridine with 10 equivalents of 30% oleum at 200 °C; Figure S20: UV-detected HPLC-MS chromatogram recorded at 240 nm under the reaction conditions of acridone with 1 equivalent of 30% oleum at −10 °C; Figure S21: UV-detected HPLC-MS chromatogram recorded at 270 nm under the reaction conditions of acridone with 1 equivalent of 30% oleum at −10 °C; Figure S22: UV-detected HPLC-MS chromatogram recorded at 240 nm under the reaction conditions of acridone with 1 equivalent of 30% oleum at 25 °C; Figure S23: UV-detected HPLC-MS chromatogram recorded at 270 nm under the reaction conditions of acridone with 1 equivalent of 30% oleum at 25 °C; Figure S24: UV-detected HPLC-MS chromatogram recorded at 240 nm under the reaction conditions of acridone with 1 equivalent of 30% oleum at 200 °C; Figure S25: UV-detected HPLC-MS chromatogram recorded at 270 nm under the reaction conditions of acridone with 1 equivalent of 30% oleum at 200 °C; Figure S26: UV-detected HPLC-MS chromatogram recorded at 240 nm under the reaction conditions of acridone with 5 equivalents of 30% oleum at −10 °C; Figure S27: UV-detected HPLC-MS chromatogram recorded at 270 nm under the reaction conditions of acridone with 5 equivalents of 30% oleum at −10 °C; Figure S28: UV-detected HPLC-MS chromatogram recorded at 240 nm under the reaction conditions of acridone with 5 equivalents of 30% oleum at 25 °C; Figure S29: UV-detected HPLC-MS chromatogram recorded at 270 nm under the reaction conditions of acridone with 5 equivalents of 30% oleum at 25 °C; Figure S30: UV-detected HPLC-MS chromatogram recorded at 240 nm under the reaction conditions of acridone with 5 equivalents of 30% oleum at 25 °C (second measurement); Figure S31: UV-detected HPLC-MS chromatogram recorded at 270 nm under the reaction conditions of acridone with 5 equivalents of 30% oleum at 25 °C (second measurement); Figure S32: UV-detected HPLC-MS chromatogram recorded at 240 nm under the reaction conditions of acridone with 5 equivalents of 30% oleum at 25 °C (third measurement); Figure S33: UV-detected HPLC-MS chromatogram recorded at 270 nm under the reaction conditions of acridone with 5 equivalents of 30% oleum at 25 °C (third measurement); Figure S34: UV-detected HPLC-MS chromatogram recorded at 240 nm under the reaction conditions of acridone with 5 equivalents of 30% oleum at 200 °C; Figure S35: UV-detected HPLC-MS chromatogram recorded at 270 nm under the reaction conditions of acridone with 5 equivalents of 30% oleum at 200 °C; Figure S36: UV-detected HPLC-MS chromatogram averaged from measurements at 240 nm and 270 nm, recorded under the reaction conditions of acridone with 10 equivalents of 30% oleum at −10 °C; Figure S37: UV-detected HPLC-MS chromatogram averaged from measurements at 240 nm and 270 nm, recorded under the reaction conditions of acridone with 10 equivalents of 30% oleum at 25 °C; Figure S38: UV-detected HPLC-MS chromatogram averaged from measurements at 240 nm and 270 nm, recorded under the reaction conditions of acridone with 10 equivalents of 30% oleum at 200 °C; Figure S39: UV-detected HPLC-MS chromatogram averaged from measurements at 240 nm and 270 nm, recorded under the reaction conditions of acridine with 20 equivalents of cc. H2SO4 at 120 °C, showing only starting material; Figure S40: UV-detected HPLC-MS chromatogram averaged from measurements at 240 nm and 270 nm, recorded under the reaction conditions of acridone with 20 equivalents of cc. H2SO4 at 120 °C, showing mostly starting material and monosubstituted product; Figure S41: UV-detected HPLC-MS chromatogram averaged from measurements at 240 nm and 270 nm, recorded under the reaction conditions of acridone with 20 equivalents of HSO3Cl at 120 °C; Figure S42: UV-detected HPLC-MS chromatogram averaged from measurements at 240 nm and 270 nm, recorded under the reaction conditions of acridone with 20 equivalents of HSO3Cl at 120 °C, showing mostly the disubstituted product; Table S1: Product distribution of acridine with 1 equivalent of reagent at different temperatures; averaged area % at 240–270 nm from the UV-detected HPLC-MS chromatograms; Table S2: Product distribution of acridone with 1 equivalent of reagent at different temperatures; averaged area % at 240–270 nm from the UV-detected HPLC-MS chromatograms; Table S3: Product distribution of acridine with 5 equivalents of reagent at different temperatures; averaged area % at 240–270 nm from the UV-detected HPLC-MS chromatograms; Table S4: Product distribution of acridone with 5 equivalents of reagent at different temperatures; averaged area % at 240–270 nm from the UV-detected HPLC-MS chromatograms; Table S5: Product distribution of acridine with 10 equivalents of reagent at different temperatures; averaged area % at 240–270 nm from the UV-detected HPLC-MS chromatograms; Table S6: Product distribution of acridone with 10 equivalents of reagent at different temperatures; averaged area % at 240–270 nm from the UV-detected HPLC-MS chromatograms; Figure S43: 1H NMR spectrum of disulfonated acridine recorded in DMSO-d6, showing a regioisomeric mixture; Figure S44: 1H NMR spectrum of trisulfonated acridine recorded in DMSO-d6, showing a regioisomeric mixture; Figure S45: 1H NMR spectrum of disulfonated acridone recorded in DMSO-d6; Figure S46: 1H NMR spectrum of tetrasulfonated acridone recorded in DMSO-d6; Figure S47: HMBC spectrum of disulfonated acridone recorded in DMSO-d6; Figure S48: HSQC spectrum of disulfonated acridone recorded in DMSO-d6; Table S7: Table of all terms used in the significance analysis for acridone, including both significant and non-significant; Table S8: Table of statistically significant terms only for acridone; Figure S49: Normal probability plot for acridone; Table S9: Table of all terms used in the significance analysis for acridine, including both significant and non-significant; Table S10: Table of statistically significant terms only for acridine; Figure S50: Normal probability plot for acridine.
Author Contributions
Conceptualization, Á.G.; methodology, S.S. and Á.G.; formal analysis, P.K. and S.S.; investigation, P.K. and S.S.; resources, P.H.; writing—original draft preparation, P.K., S.S. and Á.G.; writing—review and editing, P.H.; visualization, P.K. and S.S.; supervision, P.H. and Á.G.; project administration, Á.G. All authors have read and agreed to the published version of the manuscript.
Funding
This research was supported by the Gedeon Richter Talentum Foundation within the framework of the Gedeon Richter Excellence PhD Scholarship. Further support was provided by the EKÖP-24-4-II-BME-63 and EKÖP-25-4-II-BME-136 University Research Fellowship Program. funded by the Ministry of Culture and Innovation through the National Research, Development and Innovation Fund. Project no. 2025-2.1.2-EKÖP-KDP-2025-00005 has been implemented with the support provided by the Ministry of Culture and Innovation of Hungary from the National Research, Development and Innovation Fund, financed under the EKÖP_KDP-25-1-BME-7 funding scheme.
Data Availability Statement
The original contributions presented in this study are included in the article/Supplementary Materials. Further inquiries can be directed to the corresponding author.
Acknowledgments
The authors express their gratitude to György Tibor Balogh for providing access to key instrumentation and measurement facilities. We also thank Zsombor Mohácsi, Balázs Decsi, and Gergő Dombi for their valuable assistance with HPLC-MS measurements and data evaluation. Further thanks to Eszter Kalydi and Soma Gergely Csik for their help with NMR measurements and data evaluation. Special thanks go to Norbert Krigler for his help in the preparative work. The authors further wish to thank Panna Vezse for her contributions to improving the language and style of the manuscript, as well as for her assistance with its editing.
Conflicts of Interest
The authors declare no conflicts of interest.
References
- Sharghi, H.; Shiri, P.; Aberi, M. An overview on recent advances in the synthesis of sulfonated organic materials, sulfonated silica materials, and sulfonated carbon materials and their catalytic applications in chemical processes. Beilstein J. Org. Chem. 2018, 14, 2745–2770. [Google Scholar] [CrossRef]
- Wang, M.; Jiang, X. Green Sulfonation. In Industrial Arene Chemistry: Markets, Technologies, Sustainable Processes and Case Studies of Aromatic Commodities; John Wiley & Sons, Inc.: Hoboken, NJ, USA, 2023; Volume 3, pp. 1701–1722. [Google Scholar]
- Dong, D.Q.; Han, Q.Q.; Yang, S.H.; Song, J.C.; Li, N.; Wang, Z.L.; Xu, X.M. Recent progress in sulfonylation via radical reaction with sodium sulfinates, sulfinic acids, sulfonyl chlorides or sulfonyl hydrazides. ChemistrySelect 2020, 5, 13103–13134. [Google Scholar] [CrossRef]
- Żamojć, K.; Milaș, D.; Grabowska, O.; Wyrzykowski, D.; Mańkowska, M.; Krzymiński, K. Insight into the intercalation of N-substituted acridine-9-amines into DNA based on spectroscopic and calorimetric analysis. Biochim. Biophys. Acta Gen. Subj. 2025, 1869, 130741. [Google Scholar] [CrossRef]
- Abouelenein, M.G.; Mohamed, M.B.I.; Elsenety, M.M.; El-Rashedy, A.A.; Ghalib, S.H.; Mohamed, F.A.E.; Ageeli, A.A. Facile and novel synthetic approach, molecular docking, molecular dynamics, and drug-likeness evaluation of 9-substituted acridine derivatives as dual anticancer and antimicrobial agents. Chem. Biodivers. 2024, 21, e202301986. [Google Scholar] [CrossRef]
- Elmusa, S.; Elmusa, M.; Mert, S.; Bayrakdar, A.; Taşlı, P.T.; Gülbandılar, A.; Kasımoğulları, R. Synthesis, characterization and in silico studies of some pyrazolo-acridine hybrid compounds as antimicrobial agents. J. Mol. Struct. 2025, 1340, 142558. [Google Scholar] [CrossRef]
- Osuna, A.; Ruiz-Perez, L.M.; Gamarro, F.; Rodriguez-Santiago, J.I.; Castanys, S.; Sharples, D.; Barbe, J. New antiparasitic agents: III. Comparison between trypanocidal activities of some acridine derivatives against Trypanosoma cruzi in vitro. Chemotherapy 1988, 34, 127–133. [Google Scholar] [CrossRef]
- Pordel, M.; Gheibi, H.; Sharif, A. Recent advances in the synthesis and optical applications of acridine-based hybrid fluorescent dyes. J. Fluoresc. 2024, 35, 4997–5034. [Google Scholar] [CrossRef]
- He, Y.J.; Shi, W.J.; Yan, J.W. Exploring acridine-quinolinium conjugates as near-infrared photosensitizers for the amyloid-β photo-oxidation. Sens. Actuators B Chem. 2025, 428, 137233. [Google Scholar] [CrossRef]
- Hirao, Y.; Taniguchi, T.; Teraoka, M.; Kubo, T. Redox/pH dual stimuli-responsive acridine spiropyran. Asian J. Org. Chem. 2019, 8, 863–866. [Google Scholar] [CrossRef]
- Pál, D.; Baranyai, P.; Leveles, I.; Vértessy, B.G.; Huszthy, P.; Móczár, I. An acridone-based fluorescent chemosensor for cationic and anionic species, and its application for molecular logic operations. ChemistrySelect 2019, 4, 11936–11943. [Google Scholar] [CrossRef]
- Chan, Y.C.; Li, C.Y.; Lai, C.W.; Wu, M.W.; Tseng, H.J.; Chang, C.C. Synthesis and application in cell imaging of acridone derivatives. Appl. Sci. 2020, 10, 8708. [Google Scholar] [CrossRef]
- Gonzalez-Garcia, M.C.; Peña-Ruiz, T.; Herrero-Foncubierta, P.; Miguel, D.; Giron, M.D.; Salto, R.; Orte, A. Orthogonal cell polarity imaging by multiparametric fluorescence microscopy. Sens. Actuators B Chem. 2020, 309, 127770. [Google Scholar] [CrossRef]
- Matsumura, K. Sulfonation of acridone. J. Am. Chem. Soc. 1935, 57, 1533–1536. [Google Scholar] [CrossRef]
- Pereira, R.C.; Pontinha, A.D.R.; Pineiro, M.; de Melo, J.S.S. A comprehensive spectral, photophysical and electrochemical study of synthetic water-soluble acridones. A new class of pH and polarity sensitive fluorescent probes. Dye Pigment. 2019, 166, 203–210. [Google Scholar] [CrossRef]
- Amersham Biosciences UK Limited. Acridone Derivatives as Labels for Fluorescence Detection of Target Materials. International Patent Application No. WO2002099424A2, 12 December 2002.
- Max-Planck-Gesellschaft zur Förderung der Wissenschaften e.V. Sulfonated 2(7)-Aminoacridone and 1-Aminopyrene Dyes and Their Use as Fluorescent Tags, in Particular for Carbohydrate Analysis. International Patent Application No. WO2020151804A1, 30 July 2020.
- Cotton, G. Site-Specific Labeling of Proteins Using Acridone and Quinacridone Lifetime Dyes. U.S. Patent US20040023409A1, 5 February 2004. [Google Scholar]
- Xia, Y.; Zhu, G.; Zhao, L.; Yan, C.; Huang, Z.; He, J.; Zhao, Q. Dual-modal aptasensor based on multifunctional acridone derivative for rapid detection of exosomal proteins and cancer diagnosis. Sens. Actuators B Chem. 2024, 407, 135517. [Google Scholar] [CrossRef]
- Zhang, J.; Chen, J.; Zhuang, H. Synthesis and application of biacridine DNA probe. Hecheng Huaxue 2005, 13, 588–590. [Google Scholar]
- Hammler, D.; Werner, S.; Hofmann, K.; Popp, O.; Marx, A. Fluorescently labelled ATP analogues for direct monitoring of ubiquitin activation. Chem. Eur. J. 2020, 26, 6279–6284. [Google Scholar] [CrossRef] [PubMed]
- Xerox Corporation. Five Member Ring Stabilizers for Quinacridone-Type Pigments in Solid Ink. U.S. Patent US20120140001A1, 28 May 2013.
- Markovich, Y.; Kudryavtseva, T.; Markovich, V.; Koroleva, I. Sulfonation of 10-carboxymethylene-9-acridanone under thermal and microwave conditions. Comparison of kinetic parameters. Russ. J. Gen. Chem. 2013, 83, 691. [Google Scholar] [CrossRef]
- Bisballe, N.; Laursen, B.W. What is the best strategy for water-soluble fluorescence dyes?—A case study using long fluorescence lifetime DAOTA dyes. Chem. Eur. J. 2020, 26, 15969–15976. [Google Scholar] [CrossRef]
- PerkinElmer Health Sciences, Inc. Preparation of NIR to SWIR Fluorescent Compounds for Imaging and Detection. International Patent Application No. WO2019067180A1, 4 April 2019.
- MGI Tech Co., Ltd.; Wuhan MGI Tech Co., Ltd. Fluorescent Dye, Synthesis Therefor and Use Thereof. International Patent Application No. WO2024240051A1, 28 November 2024. [Google Scholar]
- Poh, B.-L.; Quek, J.-Y.; Chan, K.-S. No distinction between host and guest—The case of cyclodextrins complexing with disodium 1,8-disulfonato-3,4,5,6-acridinetetracarboxylic acid. Tetrahedron Lett. 1996, 37, 7433–7436. [Google Scholar] [CrossRef]
- Blázquez, M.T.; Segura, J.L.; Alonso, A.; Gómez, R. Acridone heterocycles as fluorescent sensors for anions. Heterocycles 2006, 69, 73–81. [Google Scholar] [CrossRef]
- Le, H.T.; Saleah, R.; Kungwan, N.; Nghiem, M.-P.; Goubard, F.; Bui, T.-T. Synthesis, thermal, optical and electrochemical properties of acridone and thioxanthone based push-pull molecules. ChemistrySelect 2020, 5, 15180–15185. [Google Scholar] [CrossRef]
- Kumar, R.; Kaur, M.; Kumari, M. Acridine: A versatile heterocyclic nucleus. Acta Pol. Pharm. 2012, 69, 3–9. [Google Scholar] [PubMed]
Disclaimer/Publisher’s Note: The statements, opinions and data contained in all publications are solely those of the individual author(s) and contributor(s) and not of MDPI and/or the editor(s). MDPI and/or the editor(s) disclaim responsibility for any injury to people or property resulting from any ideas, methods, instructions or products referred to in the content. |
© 2025 by the authors. Licensee MDPI, Basel, Switzerland. This article is an open access article distributed under the terms and conditions of the Creative Commons Attribution (CC BY) license (https://creativecommons.org/licenses/by/4.0/).