Abstract
Cellular vehicle-to-everything (C-V2X) communication has recently gained attention in industry and academia. Different implementation scenarios have been derived by the 3rd Generation Partnership Project (3GPP) 5th Generation (5G) Vehicle-to-Everything (V2X) standard, Release 16. Quality of service (QoS) is important to achieve reliable communication and parameters which have to be considered are reliability, end-to-end latency, data rate, communication range, throughput and vehicle density for an urban area. However, it would be desirable to design a dynamic selecting system (with emphasis on channel coding parameters selection) so that all QoS parameters are satisfied. Having this idea in mind, in this work we examine nine V2X implementation scenarios using Long Term Evolution (LTE) turbo coding with a geometry−based efficient propagation model for vehicle-to-vehicle communication (GEMV), where we consider the above QoS parameters for SOVA, log-MAP and max-log-MAP decoding algorithms. Our study is suitable for 3GPP cooperative sensing, for the eight scenarios considering medium and large signal-noise-ratio (SNR) values. The proposed model is sustainable despite a doubled data rate, which results in a minimal bit error rate (BER) performance loss up to 1.85 dB. In this case tripling the data rate results in a further 1 dB loss. Moreover, a small loss up to 0.4 dB is seen for a vehicle speed increase from 60 km/h to 100 km/h. Finally, increasing vehicle density has no effect on the implemented 3GPP scenario considering end-to-end latency, irrespectively from the decoding algorithm.
1. Introduction and Related Work
Cellular vehicle-to-everything (C–V2X) communication represents the dominant technology for future cooperative automated driving and safety—related applications. The requirements in terms of QoS performance vary according to specific user cases that represent realistic 3GPP scenarios [1]. References [2,3] provide an overview on V2X standardization on the New Radio (NR) side−link design as part of 3GPP New Radio (NR) Release 16, which improves network architecture, security, physical layer and protocol aspects considering the reliability and low latency requirements. In [4] the authors provide a history of the 3GPP side−link technology together with an overview of NR V2X technology, with emphasis on Mode 2 for out of coverage operation and autonomous resource selection. Furthermore, [4] presents a system−level NR V2X standard−compliant simulator and it also provides a comparison of sensing−based resource selection (Release 16) and random selection (Release 17) for power saving purposes. Finally, [5] mentions that Release 16 cellular interface and NR side−link interface are designed to enable platooning, advanced driving, extended sensors and remote driving.
In [6] the authors mention that 5G NR V2X introduces advanced functionalities of 5G NR air interface which support connected and automated driving use cases with stringent requirements, while a survey on challenges and solutions for cellular−based V2X communications is presented in [7]. Furthermore, in [7] the authors mention that cellular−based V2X is gaining attention and they point out challenges in existing LTE infrastructure for supporting V2X communication (the physical layer structure represents such a challenge). In [8] the authors point out the new V2X features in 3GPP Release 15 and Release 16. They also conclude that future V2X and automotive radar systems can reuse common equipment, such as millimeter−wave antenna arrays. In [9] the authors summarize the most important aspects of 3GPP NR−V2X, focusing on Release 16 and the main aspects of future Release 17. Finally, the authors mention that the two main frequency bands that have been defined in Release 16 are 5.9 GHz and 2.5 GHz.
In [10] the authors discuss and evaluate the new features introduced in NR−V2X by comparative analysis with C–V2X. To compare the performance, an NR−V2X simulator (using ns−3 software) for sub−6 GHz band is also investigated. In [11] the authors investigate the evolution of vehicular communication systems towards 5G and how the applications and services follow that evolution. Specifically, the authors focus on the cellular−based solution and the way it is evolving from Release 14 (initial C–V2X system) towards Release 16 (a fully−operational 5G system).
In [12] an adaptive autonomous V2X model is proposed, which is based on a new optimization method to enhance the connectivity of vehicular networks. This model optimizes the inter−vehicle position to communicate with the autonomous vehicle or to relay information to everything. Based on the system QoS being achieved, a decision is taken whether the transmitting autonomous vehicle communicates directly to the destination or through cooperative communication. In [13] the authors identify relevant future 5G 3GPP enhancements, specifically for releases beyond Release 15, and they outline how these releases will support highly automated driving in cross−border corridors. For this study a set of scenarios is investigated together with the communication requirements and the most relevant 5G features are proposed. Moreover, the authors in [14] propose an LTE/NR coexistence technique in both downlink and uplink in order for the additional low−frequency spectrum to be deployed with LTE in near future.
In [15] the authors present a QoS aware decentralized resource allocation for V2X communication based on a deep reinforcement learning (DRL) framework. The authors propose a scheme which incorporates the QoS parameter that reflects the latency required in both user equipment and the base station and the aim is to maximize the throughput of all vehicle-to-infrastructure (V2I) links, while meeting the latency constraints of vehicle-to-vehicle (V2V) links. Reference [16] presents the novel Multi Level QoS (MLQ) feature, a candidate enhancement for 3GPP Release 16 specifications. MLQ feature aims at improving service availability and continuity, specifically targeting safety critical V2X services. In [17] the authors mention that in V2V communication, link reliability has been regarded as an important QoS performance metric and they analyze link reliability of the centralized mode (Mode 3) for LTE−based V2V from the physical and medium access control (MAC) layers perspectives. The authors also propose a resource size control (RSC) method for improving link reliability.
The enhancements in Release 14 of LTE−V2X support advanced automated driving services and adapt it to the high mobility environment of vehicular networks guaranteeing backward compatibility [18,19]. The 5G−V2X NR modifications designed to enhance side−link PC5 interface will include low density parity check (LDPC) and polar codes designed to offer higher robustness without increasing encoding and decoding complexity. The drawback of this channel coding technique is the channel overloading by hybrid automatic repeat request (ARQ) retransmission using incremental redundancy, where the network can retransmit erroneously received data and the device combines the soft information from multiple transmission attempts [14]. However, the coding gain from turbo codes lead to longer transmission range and a better V2V transmission efficiency especially for security−related autonomous driving applications.
However, none of the above works includes channel coding optimizations at physical layer so that the required QoS levels are met. Specifically, some papers focus on RSC methods [17], whereas other papers focus on radio resource management [15] and the last subcategory of papers optimize the QoS papers triggered by dynamic radio conditions [16]. The idea of focusing on physical layer channel coding process and particularly using turbo coding in 5G V2X systems has been initially discussed in [20,21,22,23] without, however, the channel coding parameters being optimized for realistic QoS indicators. Turbo decoding adds significant complexity to the system and the most popular algorithms to be used are log maximum a−posteriori (log-MAP), max-log-MAP and soft output Viterbi algorithm (SOVA). Turbo codes compensate complexity with BER performance and for large frame lengths complexity and latency are remarkable [24].
Considering 3GPP 5G V2X Release 16 implementation scenarios, the motivation of this work is to investigate LTE turbo coding performance for V2V transmission and small frame lengths. Particularly, we examine which of these scenarios can be implemented considering different QoS parameters. For this purpose, we simulate nine V2V simulation scenarios with LTE turbo coding at the physical layer and a geometry−based stochastic mobile channel (GEMV) appropriate for realistic urban scenarios. An initial approach has been investigated in [20], where only a small frame length of 128 bits is examined without the message size to be investigated in the simulation results. Additionally, not many vehicle density values are considered. In the present work we establish the nine V2V simulation scenarios in a way that they give a clear picture of QoS issues considering different vehicle speeds, density and data rates.
The general idea, according to [21], is to use the specific simulation results in a future system with real—time coding parameters dynamic prediction, which is based on the conditions of the external environment. In this case the specific QoS parameters of the specified scenarios have to be satisfied. Therefore, the main contributions of this paper are summarized as follows:
- Specific 3GPP 5G V2X scenarios of Release 16 are simulated applying the LTE turbo coding scheme, considering also different vehicle densities, vehicle speeds and frame sizes.
- For the implemented 3GPP V2X scenarios an optimization analysis was conducted for specific SNR values based on the channel decoding algorithm (log-MAP, max-log-MAP and SOVA). The aim is specific QoS specifications to be satisfied such as reliability, end-to-end latency and throughput.
- Finally, the simulation results of this paper can be used as reference for the training of a future dynamic physical layer channel coding selection scheme (which emphasizes on selecting the appropriate turbo coding parameters). This scheme will do the selections on a multi−level QoS parameter indicator depending on the observed traffic conditions using a machine learning (ML) procedure.
2. 3GPP 5G V2X QoS Scenarios and Proposed Dynamic System Model
The performance requirements for 3GPP 6 5G V2X scenarios are shown at Table 1 and are reproduced from [25,26,27,28]. It is useful to first define a few communication range terms. In reference [28] the communication range is considered to be “short” for distances smaller than 200 m, “medium” for distances between 200 m and 500 m and “long” for distances larger than 500 m.

Table 1.
3GPP 5G V2X scenarios.
A brief description of Table 1 scenarios follows, according to [26,28]. It is well known that reliability is affected by the required latency. Thus, the lower transmission latency requirement, the higher the required reliability value [28]. In scenario 1 (V2V/V2I mode) cooperative awareness is used, which represents warnings and environmental awareness, like emergency vehicle warnings and emergency electronic brake lights. It requires data rates between 5 kbps to 96 kbps and between 90 to 95% reliability. For scenario 2 (V2V/V2I mode) cooperative sensing is used and it requires data rates between 5 kbps to 25 Mbps and reliabilities greater than 95%. An example would be an exchange of sensor data in a crash mitigation scenario, where 25 Mbps of data are transmitted with very high reliability within 3 ms [28].
Scenario 3 (V2V/V2I mode) includes cooperative maneuvers, with data rates between 10 kbps and 5 Mbps and high reliability (>99%). Here, the goal is the coordination of the trajectories between vehicles and dense platooning represents an exemplary case. Hence, dense platooning has a latency requirement of 3 ms, reliability higher than 99% and a data rate higher than 25 Mbps if sensor sharing is used. Scenario 4 (vehicle-to-pedestrian or V2P mode) includes vulnerable road user cases (it represents notifications of pedestrians and cyclists). Here, we have data rates between 5 kbps to 10 kbps and 95% reliability. Scenario 4 cases are similar to scenario 1 in terms of latency and reliability requirements. The difference is that the receiver device is user equipment and the required data is low, which means that the corresponding data rate is also low [28].
For scenario 5 (vehicle-to-network or V2N/V2I mode), traffic efficiency is used and latency and reliability requirements are loosened, while data rate values are between 10 kbps and 2 Mbps. At uplink, every vehicle updates the traffic management server with location and road information (more efficient route selections). At downlink, the digital maps are updated. Finally, at scenario 6 (V2N mode) tele−operated driving is used and it requires data rates larger than 25 Mbps and high reliability. Therefore, a minimum 25 Mbps uplink data rate is required for the use of from two or more cameras and other sensor vehicle information. A reliability value higher than 99% (to avoid possible malfunctions) and a latency value of less than 20 ms (for vehicle control) are required [28].
We assume the system simulation model presented in [20]. There are several operating scenarios in spectrum usage for LTE V2X, which have been used in published literature. We simulate a system that consists of two moving vehicles as platoons of vehicles with small inter-vehicle distances (about 20 m) in an urban area. The vehicles interchange small cooperative awareness messages (CAMs) with critical information for safety applications (i.e., location, relative speed [29]) featuring as many as possible QoS requirements for the most common user defined 3GPP cases such as V2V, V2P, V2I, V2N communications [2]. The transmitting data messages are combined with its side−link control information (SCI), transmitted within the same subframe and conveying crucial information, which is appropriate for the decoding at the receiver side. At LTE−V2X Release 14, one CAM per time transmission interval (TTI) value of 1 ms is transmitted. The simulations are conducted in different channel and environmental conditions for a fairly large range of SNR values (0–10 dB) that incorporate high wireless interference/radio frequency (RF) jamming scenarios. In these scenarios the calculation of signal to interference and noise ratio (SINR) integrates the jamming/noise power into the denominator.
C–V2X with the use of turbo codes is designed to facilitate decoding capability even at lower SNR values whereas for other wireless standards dedicated short range communication (DSRC) with convolutional codes requires higher SNR for successful decoding. Therefore, turbo codes represent a strong interference−tolerant channel coding scheme [22]. At our simulation scenarios of Table 2, we evaluate C–V2X direct communications towards 5G NR which also support Release 14 and Release 15 for security reasons [18,19]. Specifically, the transmitter−receiver pair uses the 5G NR SL V2V unicast link and the transmitter vehicle shares information to the receiver for efficient maneuvers for cooperative driving. In addition, LTE−V2X is designed to enable the cooperative awareness service with the transmission of periodic messages by each vehicle to a road side unit (RSU) to inform about its status and movements [18,19]. Finally, at LTE−V2X the wireless transmission is combined with resource allocation, which is conducted by the RSU and is normally associated with a modulation and coding scheme (MCS) mechanism that selects parameters such as frame length, decoding algorithm, number of decoding iterations, etc.
Table 2.
Simulation scenarios with different parameters and constant vehicle density.
The proposed dynamic changing transmitter−receiver system, which uses 5G NR direct communication and is combined with an LTE network, can be seen at Figure 1. It also uses turbo channel coding scheme at physical layer. Based on Global Positioning System (GPS) and traffic−related information QoS performance indicators such as vehicle speed, data rate per vehicle, frame length and vehicle density (e.g., the specific value parameters from one of the 9 3GPP scenarios presented in Table 2) the MCS mechanism will dynamically select the appropriate channel coding parameters. Subsequently, all the QoS parameters results such as throughput and end-to-end latency from the direct communication between transmitter−receiver will be used for a recursive feedback loop in a real−time QoS−based ML prediction model. This predictive model will also be installed in a real—time mobile edge computing (MEC) development in an urban scenario [1]. Thus, in this case, MCS will select dynamically not only the modulation specifications but also the channel coding conditions.
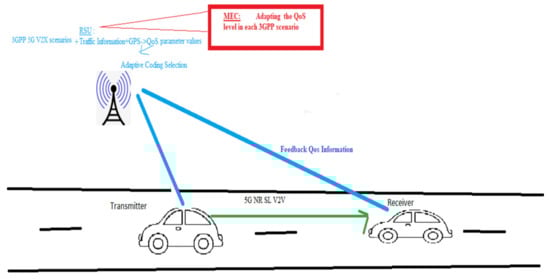
Figure 1.
Proposed dynamic selection channel coding system model.
Let’s give more information on the simulated transmission of the transmitter−receiver pair, where the transmission power is 100 mW and results in a transmission range of less than 500 m. Furthermore, in our simulation model we transmit a total of 1,000,000 bits, which are divided into appropriate data frames. Subsequently, they are turbo encoded and send every TTI, to the mobile channel similarly to [20,21,22]. C–V2X in the direct mode operates in what is known as the intelligent transport systems (ITS) frequency band at 5.9 GHz. Finally, C programming language has been used to build the simulation model.
For the simulated wireless channel model we do not use a simplistic deterministic path−loss model. On the contrary, we use a geometry−based stochastic channel model, which also considers environmental issues such as buildings and vehicles (they are denoted as scatters using the GEMV model) [30]. The geometric description of the environment is used to derive the channel parameters used by the real model and not by distributions. GEMV model calculates deterministically the large−scale signal variations with additional stochastic signal variations due to scattering. A carrier frequency GHz is also considered, similarly to [9].
At Table 2 9 simulation scenarios can be observed. The goal is to examine 5G V2X QoS issues and we consider four different parameters: short frame length, data rate per vehicle, vehicle speed (with the corresponding Doppler frequency and normalized fade rate) and vehicle density. The choice of most of these parameters is based on the 6 scenarios of Table 1. The two Table 2 frame lengths have been chosen similarly to [21,22], while the data rates are similar to those in [20]. The difference with [20] is that in this work the focus is on larger short frame lengths of 256 and 512 bits, while in [20] mainly a short frame length of 128 bits is considered. Additionally, more vehicle density values are considered to examine their effect on QoS issues and in this work throughput QoS parameter is examined in more detail compared to [20]. Finally, it must be mentioned that scenario number 9 of Table 2 is considered only at Section 3.1 QoS analysis, which follows.
3. QoS Analysis
Table 1 shows that 4 QoS parameters must be investigated for possible 5G V2X implementation: data rate, reliability, end-to-end latency and communication range, similarly to [19]. Additionally, our 5G V2X QoS analysis considers two extra parameters, vehicle density and throughput, similarly to [31].
3.1. Data Rate per Vehicle and Mobile Terminal Speed QoS Parameters
The BER performance of the simulated system can be seen at Figure 2 for scenarios 1, 2, 3 and 4 of Table 2 considering SOVA, log-MAP and max-log-MAP algorithms. Here, we investigate the effect of data rate per vehicle and mobile terminal speed. The short frame length is 256 bits and the number of turbo decoding iterations is considered to be 3, because in [22] it is shown that is adequate to achieve the lowest BER.
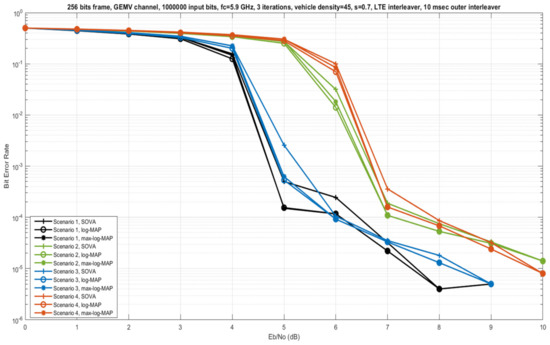
Figure 2.
BER vs. SNR for GEMV channel, 4 different Table 2 scenarios, different decoding algorithms, 3 iterations, frame length of 256 bits.
For an increase of data rate from 6 to 12 Mbps (comparison of scenarios 1 and 2 for terminal speed of 60 km/h), a loss of 1.8 dB at a BER of is seen for SOVA. At the same BER, a gain of 0.2 dB is observed using log-MAP or max-log-MAP compared to SOVA for 6 Mbps. For an increased data rate of 12 Mbps this gain remains the same. Similarly, for data rate increase from 6 to 12 Mbps (comparison of scenarios 3 and 4 for terminal speed of 100 km/h), a loss of 1.6 dB at a BER of is seen for SOVA. At the same BER, a gain of 0.45 dB is observed using log-MAP or max-log-MAP compared to SOVA for 6 Mbps (scenario 3). For an increased data rate of 12 Mbps (scenario 4) this gain decreases to 0.16 dB.
For vehicle speed increase from 60 to 100 km/h (comparison of scenarios 1 and 3 for data rate of 6 Mbps), a loss of 0.4 dB at a BER of is seen for SOVA. Similarly, for speed increase from 60 to 100 km/h (comparison of scenarios 2 and 4 for data rate of 12 Mbps), a loss of 0.2 dB at a BER of is seen for SOVA.
We follow the same approach at Figure 3, but here the frame length increases to 512 bits (scenarios 5, 6, 7, 8 and 9 of Table 2). As expected, the BER performance for the different SNR values is better, compared to Figure 2. For a data rate increase from 6 to 12 Mbps (comparison of scenarios 5 and 6 for terminal speed of 60 km/h), a loss of 1.85 dB at a BER of is seen for SOVA. At the same BER and for the same decoding algorithm, for a data rate increase from 12 to 18 Mbps (comparison of scenarios 6 and 9 for terminal speed of 60 km/h), a loss of 1 dB is observed.
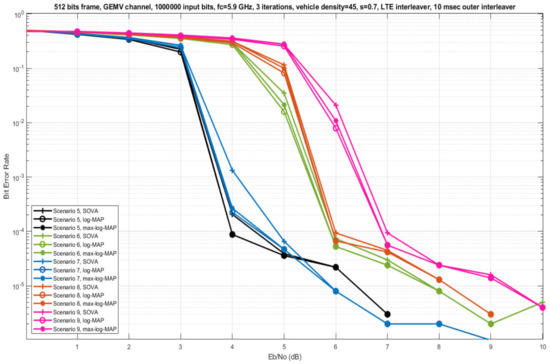
Figure 3.
BER vs. SNR for GEMV channel, 5 different Table 2 scenarios, different decoding algorithms, 3 iterations, frame length of 512 bits.
Similarly, for data rate increase from 6 to 12 Mbps (comparison of scenarios 7 and 8 for terminal speed of 100 km/h), a loss of 1.6 dB at a BER of is seen for SOVA. For vehicle speed increase from 60 to 100 km/h (comparison of scenarios 5 and 7 for data rate of 6 Mbps), a loss of 0.4 dB at a BER of is seen for SOVA. Using the same approach for terminal speed increase from 60 to 100 km/h (comparison of scenarios 6 and 8 for data rate of 12 Mbps), a loss of 0.15 dB at a BER of is seen for SOVA.
3.2. Link Reliability QoS Parameter
Generally, link reliability QoS parameter is affected by BER performance and the corresponding SNR value (the higher SNR value, the better reliability value) [20]. At Figure 4 and Figure 5 two histograms of link reliability (%) vs. Table 1 scenario and different SNR values are shown. The values are calculated using BER performance values from Figure 2 and Figure 3 and the link reliability formula from [20]. We show the results only for SOVA algorithm since for log-MAP and max-log-MAP we obtain similar results.
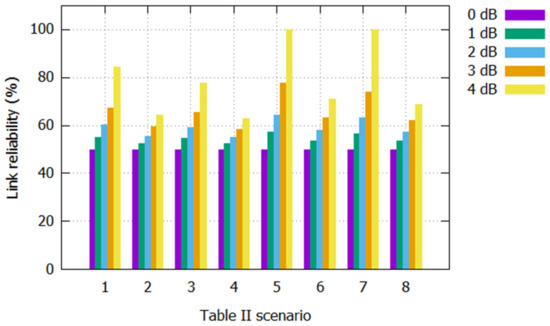
Figure 4.
Link Reliability (%) for the different Table 2 scenarios, considering BER for SNR values between 0 and 4 dB, SOVA decoding algorithm and GEMV channel.
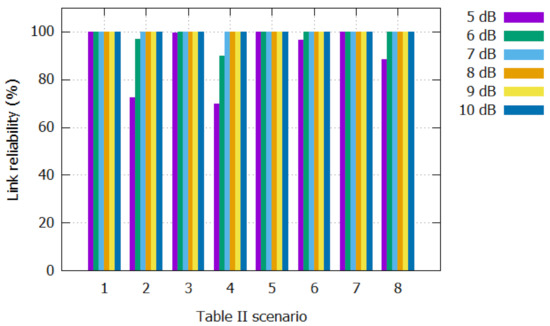
Figure 5.
Link Reliability (%) for the different Table 2 scenarios, considering BER for SNR values between 5 and 10 dB, SOVA decoding algorithm and GEMV channel.
For SNR values between 0 and 4 dB (small values), Figure 4 shows the calculated reliability values for the different scenarios, while at Figure 4 the SNR values are between 5 and 10 dB (larger values). It is obvious that as the SNR value increases, the reliability also increases. Particularly, at Figure 4 for SNR = 4 dB we observe that for scenarios 5 and 7 the reliability increases instantly to 100%. This is because in these two scenarios we have a large frame length of 512 bits and a small data rate of 6 Mbps, while terminal speed seems to have a small effect on BER and the resulting reliability. Moreover, at Figure 5 for SNR values higher than 7 dB the reliability reaches its highest value (100%) for all 8 scenarios.
At the same Figure for SNR = 5 dB and scenarios 1, 3, 5, 7 (6 Mbps data rate) the reliability is 100%, while at the other scenarios (12 Mbps) we observe that the reliability has smaller values. Furthermore, at Figure 5 for SNR = 6 dB and scenarios 1, 3, 5, 6, 7, 8 (6 Mbps data rate for both frame lengths and 12 Mbps only for 512 bits) the reliability is 100%, while at scenarios 2, 4 (12 Mbps and frame length of 256 bits) we observe that the reliability has smaller values. Thus, we conclude that data rate and frame length play an important role on the link reliability value mainly for medium SNR values (between 4 and 6 dB). On the other hand, mobile terminal speed’s effect on reliability is negligible.
Table 3 illustrates the recommended Table 1 scenarios for implementation scenarios 1 to 8 examined at Table 2 (rows of Table 5). Moreover, the recommended values are based on the accepted values mentioned for each scenario at Table 1, on SNR values from 0 to 10 dB (columns of Table 3) and on the calculated link reliability values for all three decoding algorithms (the reliability values for SOVA are shown at Figure 4 and Figure 5). Table 3 shows that for SNR values between 0 and 3 dB only scenario 5 from Table 1 can be established. Subsequently, we examine Table 1 scenarios that can be implemented for SNR values between 4 and 6 dB. Here, for these SNR values the choice of the suitable Table 1 scenario depends on data rate and on the decoding algorithm (SOVA is recommended). For high SNR values between 7 and 10 dB, scenarios 2, 3, 6 from Table 1 are recommended.
3.3. Traffic (Vehicle) Density Evaluation
An important parameter that can affect the performance of the proposed simulation model is traffic (vehicle) density. A range between 45 and 105 vehicles are normally distributed in order to simulate a moderate density and a high−density scenario, respectively. The goal is to test the robustness of real traffic considering the simulated 3GPP scenarios. In Figure 6, we compare the BER QoS performance for the considered traffic density scenarios. The most important observation is that BER performance worsens for low SNR values and low traffic congestion. Furthermore, we also note that the SNR value incorporates the interference from other vehicles as noise, which means that we actually have SINR values. This justifies the above remark.
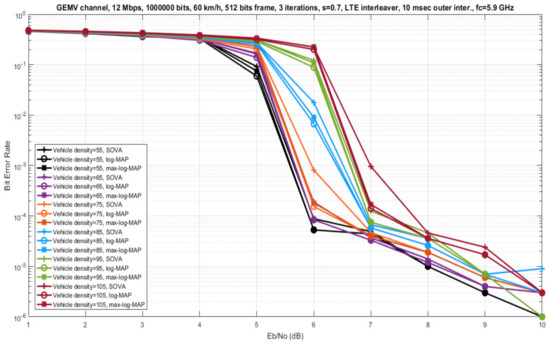
Figure 6.
BER vs. SNR for GEMV channel, 6 different vehicle density values, 12 Mbps data rate, 60 km/h vehicle speed, different decoding algorithms, 3 iterations, frame length of 512 bits.
We consider only SOVA decoding algorithm, because for this algorithm we observe the best end-to-end delay results with the simulated scenario 6 of Table 2 (a frame length of 512 bits, a data rate of 12 Mbps and a vehicle speed of 60 km/h) because the vehicle speed increase does not significantly affect the throughput performance, as shown at the following Section 3.4. We take two important metrics (BER and throughput) to measure whether the QoS is affected by the realistic traffic conditions on the road. These simulation results are presented in Figure 7 and Figure 8.
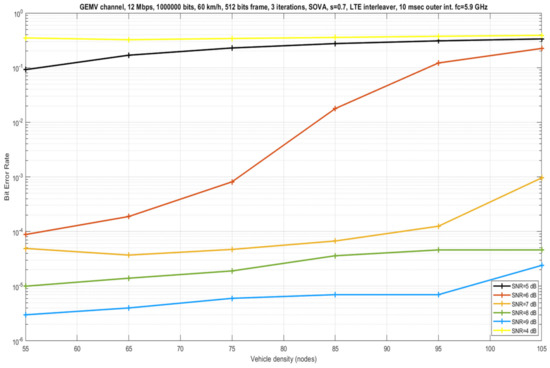
Figure 7.
BER vs. Vehicle density for GEMV channel, 6 different SNR values, 12 Mbps data rate, 60 km/h mobile terminal speed, SOVA algorithm, 3 iterations, frame length of 512 bits.
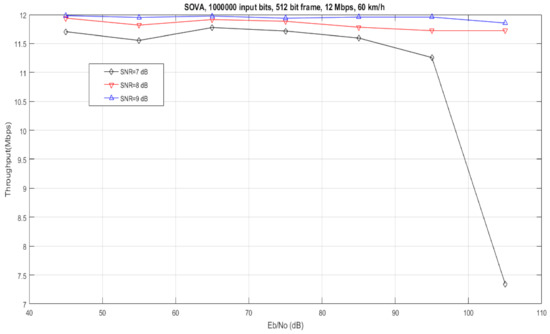
Figure 8.
Throughput vs. Vehicle density for GEMV channel, 3 different SNR values, 12 Mbps data rate, 60 km/h mobile terminal speed, SOVA algorithm, 3 iterations, frame length of 512 bits.
The main observations from Figure 7 and Figure 8 are that at low SNR values (1–5 dB) the BER values are so low that the addition of additional wireless interference due to traffic congestion does not affect either the reliability in the receiver (the BER values) or the throughput values. However, in the medium SNR values (between 5 and 7 dB), the influence of traffic density is most evident in BER and throughput performance. Specifically, in 6 dB SNR value an increase in the BER values at about dB is presented. In terms of throughput, also, an exponential decrease is presented in throughput values (from 11.5 Mbps to 7.3 Mbps) for the corresponding 85 to 105 traffic density values and a SNR value of 7 dB. These SNR values can be considered as threshold values, in which the desirable data rate exceeds the maximum channel capacity between transmitter and receiver. Of course, solutions for such problems have been proposed in the literature, in which the transmitter adapts accordingly the transmitting power in order to incorporate the wireless interference in the area [32]. However, these solutions are beyond the scope of this paper.
Finally, for large SNR values (8–10 dB), the desirable data rate can be supported by the channel capacity corresponding to these SNR values. In conclusion, the obtained results show that the required system QoS affects the number of the nodes that are located within the communication range of the pair transmitter−receiver and also the exact location of these additional nodes. Decreasing the number of interfering nodes that are located within the communication range of the transmitter−receiver pair, packet loss is also decreased due to channel conditions.
3.4. Throughput QoS Parameter
In this section we investigate the effect of the throughput QoS parameter for the implemented 3GPP scenarios of Table 2 for different SNR values. At Figure 9 the short frame length of 256 bits with a speed value 60 km/h is investigated (scenarios 1, 2). We observe that the lower data rate value (6 Mbps), the maximum capacity of the channel, a low SNR is required (over 4 dB) to achieve a throughput value over 2 Mbps for almost all decoding algorithms. On the other hand, the same performance can be achieved with a SNR value at about 6 dB using a higher data rate value per vehicle (12 Mbps) for almost all decoding algorithms, too.
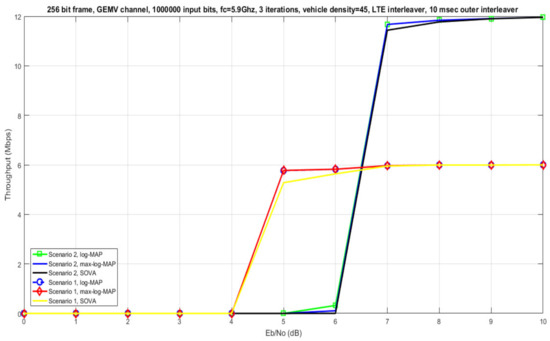
Figure 9.
Throughput vs. SNR for scenarios 1 and 2 of Table 2, considering different decoding algorithms, 3 iterations, frame length of 256 bits.
In Figure 10 the frame length of 256 bits with a speed value 100 km/h is investigated (scenarios 3, 4). We observe that with lower data rate values (scenario 3 with 6 Mbps data rate) a threshold SNR value of 4 dB is required to achieve a throughput value over 2 Mbps. On the other hand, the same performance can be achieved with a slightly smaller SNR value using a higher data rate value per vehicle (scenario 4 with 12 Mbps data rate), using SOVA algorithm. Using max-log-MAP, a very high SNR value is required in order to succeed the same throughput value at about 2 Mbps. Therefore, using max-log-MAP we can achieve a higher data rate closer to the channel capacity but with higher requirements in SNR. Finally, using SOVA we can improve the performance in throughput parameter at high SNR values.
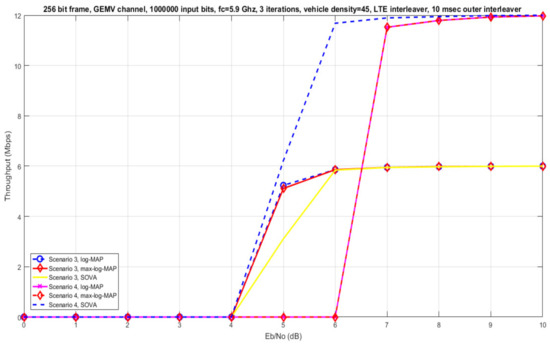
Figure 10.
Throughput vs. SNR for scenarios 3 and 4 of Table 2, considering different decoding algorithms, 3 iterations, frame length of 256 bits.
At Figure 11, we investigate simulation results with a frame length of 512 bits and a vehicle speed of 60 km/h (scenarios 5 and 6). Considering scenario 5, log-MAP and SOVA algorithms need a low SNR value (above 3dB) for a throughput performance at about 2 Mbps, while max-log-MAP algorithm reaches the same levels of throughput efficiency with a higher SNR value (at about 5 dB). Subsequently, for scenario 6, log-MAP and max-log-MAP need a low SNR value (above 5 dB) for a throughput performance at about 2 Mbps, while SOVA reaches the same levels of throughput efficiency with a higher SNR value (at about 6 dB). Therefore, increasing the required data rate, we observe a significant performance reduction for SOVA.
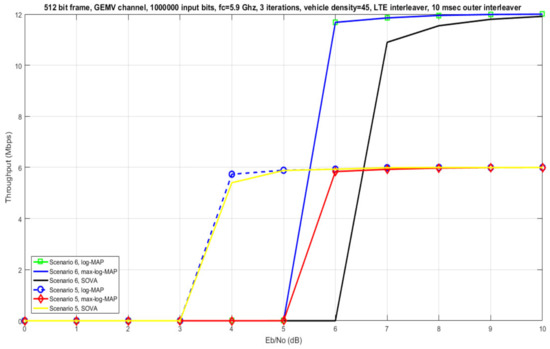
Figure 11.
Throughput vs. SNR for scenarios 5 and 6 of Table 2, considering different decoding algorithms, 3 iterations, frame length of 512 bits.
Finally, at Figure 12 simulation results with a frame length of 512 bits and a mobile terminal speed of 100 km/h are investigated (scenarios 7, 8). For scenario 7, we note that using SOVA we observe a non—zero throughput value with a lower SNR value at about 3 dB compared to the other two algorithms. On the other hand, considering scenario 8, only log-MAP can achieve the maximum channel capacity (12 Mbps) with the minimum SNR requirement (about 5 dB).
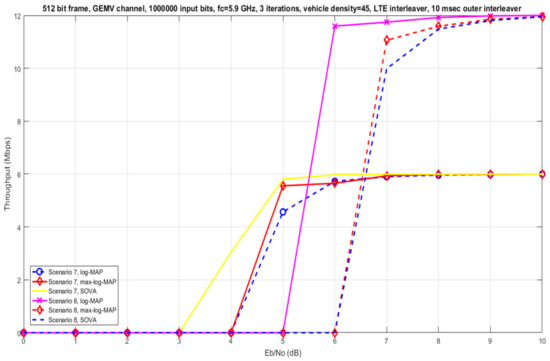
Figure 12.
Throughput vs. SNR for scenarios 7 and 8 of Table 2, considering different decoding algorithms, 3 iterations, frame length of 512 bits.
Summarizing, it is obvious that by increasing the data rate without increasing the transmitting power, the communication range will be smaller. This is reasonable because near neighbors’ vehicles get lower throughput values for short reaction time compared to more distant neighbors in cooperative communication. Therefore, the optimal location of the relay nodes that will replay the message sent by the transmitter must be investigated. Concluding, non−easily identifiable factors such as exact speed and location of vehicles, transmitting power, data rate, affect the selection of the optimal decoding algorithm in a dynamic adaptive scheme. Finally, packet losses due to the Doppler effect from increasing vehicle speed (from 60 km/h to 100 km/h) are not significantly reflected in performance due to the limitation of the channel capacity by the available data rate.
3.5. End-to-End Latency QoS Parameter
A close look at Table 1 in terms of end-to-end latency shows that a critical value which distinguishes scenarios 1 and 4 from scenario 3, is 100 ms. On the other hand, the scenario that tolerates higher latency values is scenario 5. Moreover, the scenarios that tolerate small latency values are 3 and 6. The calculation of end-to-end latency is performed using the equations that have been derived in [20]. These equations are as follows:
At Table 4 it is important to note that for the calculation of end-to-end latency for the first 8 scenarios of Table 2 we consider the worst case where all vehicles are involved. This is described from parameter. The notation represents latency using SOVA, represents latency using max-log-MAP and notation represents latency using log-MAP. Furthermore, the number of turbo decoding iterations is , the short frame size is , the data rate is and the TTI value is 1 ms (according to LTE turbo coding specifications) [20].
At Table 4 the calculated end-to-end latency values are shown using equations 1, 2 and 3. We consider the three decoding algorithms and the first 8 scenarios of Table 2. The first observation is that irrespectively of the different parameters for the scenarios of Table 2 (short frame length, data rate, decoding algorithm, vehicle speed), scenario 2 can be implemented in all cases. This observation is similar in [20], where mainly a short frame length of 128 bits is considered.
Additionally, our analysis shows that for scenarios 1, 3, 6 and 8 of Table 2, the implemented scenarios of Table 1 depend on the turbo decoding algorithm. At Table 5 our aim is to investigate the effect of vehicle density on the choice of Table 1 scenarios considering the calculated latency values. Here, we have constant values for frame length (512 bits), data rate (12 Mbps) and mobile speed (60 km/h). We notice that increasing vehicle density has no effect on the implemented Table 1 scenario considering end-to-end latency (scenarios 1, 2 and 4 can be implemented) irrespectively from the decoding algorithm.
Table 5.
Worst case end-to-end latency (ms) and corresponding Table 1 implementation scenario for each algorithm for different vehicle density values, frame length 512 bits, 12 Mbps data rate, 60 km/h speed.
3.6. Communication Range QoS Parameter
Considering the communication range QoS parameter, as explained in Section 2, we use 100 mW transmission power (which corresponds to less than 500 m transmission range). According to Table 1, it is obvious that mainly scenarios 1, 3 (communication range short to medium) can be implemented and probably scenarios 2, 4 (communication range short). We must note here that all Table 1 scenarios correspond to urban cases. In addition, the geometry-based channel model used, considers the fast−fading effects from reflections of mobile scatterers. As future work, we intend to extend our proposed scenarios in highways with very high vehicle speeds (about 250 km/h), where the effect is bigger due to Doppler shift. On the other hand, in this type of scenario a less complicated statistical channel can be used which will be based on a log-distance model for capturing the large scale fading of the transmitted signal.
3.7. Comparison of the Proposed Approach with Published Literature
At Table 6 we compare the proposed approach presented in this paper with recent published literature (since 2019), using 3GPP 5G V2X scenarios. These articles fall into different categories. Μost of these papers present specific 3GPP scenarios using the latest Release-16 of the LTE based services aiming at highly reliable and real-time communications for automotive safety use cases. Physical layer structure, resource allocations [15], security, RSC methods [17] and QoS optimization triggered by dynamic radio conditions [16] are the main challenges for LTE V2X communications. However, none of these papers considers channel coding parameters (e.g., different decoding algorithms, number of iterations) in the optimization process for the realistic QoS indicators to be satisfied. The idea of focusing on physical layer channel coding process and particularly using turbo coding in 5G V2X systems has been initially discussed in [20,21,22,23] without, however, the channel coding parameters being optimized for realistic QoS indicators. An initial approach has been investigated in [20,21], where only a small frame length of 128 bits is examined without the message size to be investigated in the simulation results and not enough vehicle density values are considered. In [21] different message frame lengths of 256 and 512 bits are also investigated. In [23], the authors add more realistic QoS parameters in the simulated scenarios such as different vehicle speeds (60 km/h and 100 km/h) and data rates for the V2V communication. Only the authors in [23] use turbo coding for V2V doubly−dispersive channels using IEEE 802.11p wireless standard with a QoS optimization procedure. From the above comparison presented in Table 6, only our proposed approach investigates LTE turbo coding performance for all the most common real traffic conditions such as (different message sizes, vehicle speeds, data rates and traffic densities). The aim is the specific QoS performance requirements for basic 3GPP 5G V2X scenarios to be met.
Table 6.
Comparison of our proposed approach with published literature.
4. Conclusions
The C–V2X approach corresponds to collaboration of existing cellular technology (e.g., LTE) with V2X communication. 3GPP 5G V2X Release 16 has specified six application scenarios considering the following four parameters: end-to-end latency, data rate, reliability and communication range. Additionally, according to published literature, throughput and vehicle density represent critical QoS issues. In this work we investigate all six of the above parameters and apply the LTE turbo coding scheme to these 5G V2X scenarios. Our approach considers nine realistic simulation scenarios with two short frame length values (256 and 512 bits), two mobile terminal speeds (60 and 100 km/h) and three data rates (6, 12 and 18 Mbps). We examine 6 QoS parameters in this work, starting from data rate per vehicle and mobile terminal speed QoS parameter, where we found that doubling the data rate results in up to 1.85 dB performance losses (in [20] for a short frame length of 128 bits the corresponding loss is 2 dB). Tripling the data rate results in a 1 dB loss, which means that when we increase the data rate, we observe that the performance losses decrease. For link reliability QoS parameter, data rate and frame length are important mainly for medium SNR values. On the other hand, mobile terminal speed’s effect on reliability is negligible. For small SNR values only scenario 5 from Table 1 can be established. For medium SNR values the choice of the suitable Table 1 scenario depends on data rate and on the decoding algorithm. For high SNR values, scenarios 2, 3, 6 from Table 1 are recommended. The influence of traffic density in QoS performance is evident only in the medium SNR values for the corresponding traffic density values between 85 and 105. Considering throughput QoS parameter, for a frame length of 512 bits and simulated scenarios 5, 6 of Table 2 (speed value of 60 km/h), the minimum SNR value of 3 dB can be satisfied to achieve non—zero throughput values. For end-to-end latency QoS parameter and scenarios 1, 3, 6 and 8 of Table 2, the scenarios of Table 1 depend on turbo decoding algorithm while for communication range QoS parameter, mainly Table 1 scenarios 1, 3 (communication range short to medium) can be implemented and probably scenarios 2, 4 (communication range short). The V2V communication model (with turbo coding and GEMV mobile channel) proposed in this work can be established because it satisfies the QoS limitations (considering all six of the above QoS parameters). The cooperative sensing 3GPP implementation scenario meets these QoS limitations for medium and large SNR values. Finally, the above analysis justifies the need for a dynamic physical layer channel coding selection scheme (which emphasizes on turbo coding). As a future work, we intend to implement a fully dynamic scheme that will do the selections on a multi—level QoS parameter indicator depending on the observed traffic conditions (considering simulation results) with the use of a ML procedure.
Author Contributions
Conceptualization, D.K. and C.C.; methodology, D.K. and C.C.; software, D.K. and C.C.; validation, D.K. and C.C.; formal analysis, D.K. and C.C.; investigation, D.K. and C.C.; resources, D.K., C.C. and I.K.S.; data curation, D.K., C.C. and I.K.S.; writing—original draft preparation, D.K. and C.C.; writing—review and editing, D.K. and C.C.; visualization, D.K. and C.C.; supervision, D.K. and C.C.; project administration, D.K. and C.C.; funding acquisition, D.K. and C.C. All authors have read and agreed to the published version of the manuscript.
Funding
This research received no external funding.
Institutional Review Board Statement
Not applicable.
Informed Consent Statement
Not applicable.
Conflicts of Interest
The authors declare no conflict of interest.
References
- Torres-Figueroa, L.; Schepker, H.F.; Jiru, J. QoS Evaluation and Prediction for C-V2X Communication in Commercially-Deployed LTE and Mobile Edge Networks. In Proceedings of the 2020 IEEE 91st Vehicular Technology Conference (VTC2020-Spring), Antwerp, Belgium, 25–28 May 2020; Institute of Electrical and Electronics Engineers (IEEE): Piscataway, NJ, USA, 2020; pp. 1–7. [Google Scholar]
- Ganesan, K.; Mallick, P.B.; Lohr, J.; Karampatsis, D.; Kunz, A. 5G V2X Architecture and Radio Aspects. In Proceedings of the 2019 IEEE Conference on Standards for Communications and Networking (CSCN), Granada, Spain, 28–30 October 2019; Institute of Electrical and Electronics Engineers (IEEE): Piscataway, NJ, USA, 2019; pp. 1–6. [Google Scholar]
- Liu, M.; Deng, H.; Li, Z.; Zhu, Y. Design aspects on physical layer structure for 5G V2X and related issues. In Proceedings of the 2021 IEEE 93rd Vehicular Technology Conference (VTC2021-Spring), Helsinki, Finland, 25–28 April 2021; Institute of Electrical and Electronics Engineers (IEEE): Piscataway, NJ, USA, 2021; pp. 1–5. [Google Scholar]
- Ali, Z.; Lagen, S.; Giupponi, L.; Rouil, R. 3GPP NR V2X Mode 2: Overview, Models and System-Level Evaluation. IEEE Access 2021, 9, 89554–89579. [Google Scholar] [CrossRef]
- Ashraf, S.A.; Blasco, R.; Do, H.; Fodor, G.; Zhang, C.; Sun, W. Supporting Vehicle-to-Everything Services by 5G New Radio Release-16 Systems. IEEE Commun. Stand. Mag. 2020, 4, 26–32. [Google Scholar] [CrossRef]
- Garcia, M.H.C.; Molina-Galan, A.; Boban, M.; Gozalvez, J.; Coll-Perales, B.; Sahin, T.; Kousaridas, A. A Tutorial on 5G NR V2X Communications. IEEE Commun. Surv. Tutor. 2021, 23, 1972–2026. [Google Scholar] [CrossRef]
- Gyawali, S.; Xu, S.; Qian, Y.; Hu, R.Q. Challenges and Solutions for Cellular Based V2X Communications. IEEE Commun. Surv. Tutor. 2021, 23, 222–255. [Google Scholar] [CrossRef]
- Petrov, V.; Fodor, G.; Andreev, S.; Do, H.; Sahlin, H. V2X Connectivity: From LTE to Joint Millimeter Wave Vehicular Communications and Radar Sensing. In Proceedings of the 2019 53rd Asilomar Conference on Signals, Systems, and Computers, Pacific Grove, CA, USA, 3–6 November 2019; Institute of Electrical and Electronics Engineers (IEEE): Piscataway, NJ, USA, 2019; pp. 1120–1124. [Google Scholar]
- Harounabadi, M.; Soleymani, D.M.; Bhadauria, S.; Leyh, M.; Roth-Mandutz, E. V2X in 3GPP Standardization: NR Sidelink in Release-16 and Beyond. IEEE Commun. Stand. Mag. 2021, 5, 12–21. [Google Scholar] [CrossRef]
- Saad, M.M.; Khan, M.T.R.; Shah, S.H.A.; Kim, D. Advancements in Vehicular Communication Technologies: C-V2X and NR-V2X Comparison. IEEE Commun. Mag. 2021, 59, 107–113. [Google Scholar] [CrossRef]
- Katsaros, K.; Dianati, M. Evolution of Vehicular Communications within the Context of 5G Systems. In Enabling 5G Communication Systems to Support Vertical Industries; Wiley: Hoboken, NJ, USA, 2019; pp. 103–126. [Google Scholar]
- Osman, R.A.; Abdelsalam, A.K. A Novel Adaptive Approach for Autonomous Vehicle Based on Optimization Technique for Enhancing the Communication between Autonomous Vehicle-to-Everything through Cooperative Communication. Appl. Sci. 2021, 11, 9089. [Google Scholar] [CrossRef]
- Velez, G.; Martín, Á.; Pastor, G.; Mutafungwa, E. 5G Beyond 3GPP Release 15 for Connected Automated Mobility in Cross-Border Contexts. Sensors 2020, 20, 6622. [Google Scholar] [CrossRef] [PubMed]
- Parkvall, S.; Dahlman, E.; Furuskar, A.; Frenne, M. NR: The New 5G Radio Access Technology. IEEE Commun. Stand. Mag. 2017, 1, 24–30. [Google Scholar] [CrossRef]
- Bhadauria, S.; Shabbir, Z.; Roth-Mandutz, E.; Fischer, G. QoS based Deep Reinforcement Learning for V2X Resource Allocation. In Proceedings of the 2020 IEEE International Black Sea Conference on Communications and Networking (BlackSeaCom), Odessa, Ukraine, 26–29 May 2020; Institute of Electrical and Electronics Engineers (IEEE): Piscataway, NJ, USA, 2020; pp. 1–6. [Google Scholar]
- Trivisonno, R.; Wei, Q.; Marquezan, C.C. QoS Enhancements for V2X Services in 5G Networks. In Proceedings of the 2020 IEEE 91st Vehicular Technology Conference (VTC2020-Spring), Antwerp, Belgium, 25–28 May 2020; Institute of Electrical and Electronics Engineers (IEEE): Piscataway, NJ, USA, 2020; pp. 1–5. [Google Scholar]
- Park, Y.; Kim, T.; Hong, D. Resource Size Control for Reliability Improvement in Cellular-Based V2V Communication. IEEE Trans. Veh. Technol. 2018, 68, 379–392. [Google Scholar] [CrossRef]
- Bazzi, A.; Cecchini, G.; Menarini, M.; Masini, B.M.; Zanella, A. Survey and Perspectives of Vehicular Wi-Fi versus Sidelink Cellular-V2X in the 5G Era. Future Internet 2019, 11, 122. [Google Scholar] [CrossRef] [Green Version]
- Bazzi, A.; Berthet, A.O.; Campolo, C.; Masini, B.M.; Molinaro, A.; Zanella, A. On the Design of Sidelink for Cellular V2X: A Literature Review and Outlook for Future. IEEE Access 2021, 9, 97953–97980. [Google Scholar] [CrossRef]
- Kosmanos, D.; Chaikalis, C.; Savvas, I.K.; Anagnostou, K.E.; Bargiotas, D. Investigating 5G V2X QoS using turbo codes. In Proceedings of the 2021 IEEE Microwave Theory and Techniques in Wireless Communications (MTTW), Riga, Latvia, 7–8 October 2021; Institute of Electrical and Electronics Engineers (IEEE): Piscataway, NJ, USA, 2021; pp. 68–73. [Google Scholar]
- Chaikalis, C.; Kosmanos, D.; Samaras, N.S. Utilizing turbo codes for secure 5G V2X. In Proceedings of the 2020 IEEE Microwave Theory and Techniques in Wireless Communications (MTTW), Riga, Latvia, 1–2 October 2020; Institute of Electrical and Electronics Engineers (IEEE): Piscataway, NJ, USA, 2020; Volume 1, pp. 30–34. [Google Scholar]
- Chaikalis, C.; Kosmanos, D.; Anagnostou, K.E.; Savvas, I.; Bargiotas, D. Enhancing the 5G V2X Reliability Using Turbo Coding for Short Frames; International Journal of Grid and Utility Computing, Inderscience Publishers: Geneva, Switzerland, 2021. [Google Scholar]
- Del Puerto-Flores, J.; Yllescas, L.C.; Parra-Michel, R.; Pena-Campos, F.; Cortez, J. Performance Evaluation of Turbo Decoding in DFTS-OFDM Systems Over V2V Channel. In Proceedings of the 2018 IEEE 10th Latin-American Conference on Communications (LATINCOM), Guadalajara, Mexico, 14–16 November 2018; Institute of Electrical and Electronics Engineers (IEEE): Piscataway, NJ, USA, 2018; pp. 1–5. [Google Scholar]
- Woodard, J.; Hanzo, L. Comparative study of turbo decoding techniques: An overview. IEEE Trans. Veh. Technol. 2000, 49, 2208–2233. [Google Scholar] [CrossRef] [Green Version]
- 3GPP TR 22.186 V16.2.0: Service Requirements for Enhanced V2X Scenarios (Release 16), 3GPP Std. Available online: https://www.etsi.org/deliver/etsi_ts/122100_122199/122186/16.02.00_60/ts_122186v160200p.pdf (accessed on 1 November 2021).
- Ahmadi, S. Chapter 7—Vehicle-to-Everything (V2X) Communications; 5G, NR; Ahmadi, A., Ed.; Academic Press Publishers: Cambridge, MA, USA, 2019; pp. 789–843. ISBN 9780081022672. [Google Scholar]
- Kanavos, A.; Fragkos, D.; Kaloxylos, A. V2X Communication over Cellular Networks: Capabilities and Challenges. Telecom 2021, 2, 1. [Google Scholar] [CrossRef]
- Boban, M.; Kousaridas, A.; Manolakis, K.; Eichinger, J.; Xu, W. Connected Roads of the Future: Use Cases, Requirements, and Design Considerations for Vehicle-to-Everything Communications. IEEE Veh. Technol. Mag. 2018, 13, 110–123. [Google Scholar] [CrossRef]
- Kosmanos, D.; Argyriou, A.; Maglaras, L. Estimating the Relative Speed of RF Jammers in VANETs. Secur. Commun. Netw. 2019, 2019, 1–18. [Google Scholar] [CrossRef]
- Boban, M.; Barros, J.; Tonguz, O.K. Geometry-Based Vehicle-to-Vehicle Channel Modeling for Large-Scale Simulation. IEEE Trans. Veh. Technol. 2014, 63, 4146–4164. [Google Scholar] [CrossRef] [Green Version]
- Abbas, F.; Fan, P.; Khan, Z. A novel reliable low-latency multipath routing scheme for vehicular ad hoc networks. EURASIP J. Wirel. Commun. Netw. 2018, 2018, 296. [Google Scholar] [CrossRef] [Green Version]
- Wu, X.; Sun, S.; Li, Y.; Tan, Z.; Huang, W.; Yao, X. A Power Control Algorithm Based on Outage Probability Awareness in Vehicular Ad Hoc Networks. Adv. Multimed. 2018, 2018, 1–8. [Google Scholar] [CrossRef] [Green Version]
Publisher’s Note: MDPI stays neutral with regard to jurisdictional claims in published maps and institutional affiliations. |
© 2022 by the authors. Licensee MDPI, Basel, Switzerland. This article is an open access article distributed under the terms and conditions of the Creative Commons Attribution (CC BY) license (https://creativecommons.org/licenses/by/4.0/).