Abstract
The rapid development of electronic devices has led to increasing requirements for higher-performance thermal interface materials (TIMs). Based on the finite element method, this study investigates the heat transfer enhancement mechanism of polymer-based TIMs reinforced by carbon fiber and boron nitride fillers. An ordered aggregation algorithm and a collision detection algorithm were developed to construct representative volume element models, enabling filler volume fractions exceeding 50 vol% in the simulation. A predictive thermal resistance model was developed and validated, demonstrating good agreement with experimental results. Then, the effects of filler ratio, orientation angle, and size on thermal conductivity were systematically analyzed. Results demonstrate that a high CF/BN ratio can construct more efficient thermal conduction pathways and the optimal ratio is 4 (13.72 W/m∙K). The thermal conductivity exhibits extreme sensitivity to filler orientation, showing an increase of 17.68 times when the angle decreases from 45° to 0°. Meanwhile, the BN particle diameters have less impact on heat transfer; thermal conductivity only increased by 19.9% when DBN rose from 10 μm to 45 μm. The predictive model based on thermal resistance theory was developed, and the average prediction error was only 5.18%. These findings provide quantitative design principles for developing high-efficiency thermal interface materials through rational filler selection and structural optimization.
1. Introduction
In modern electronic devices, semiconductors, optoelectronic equipment, and high-performance computing systems, the increasing functionality and operating frequencies have caused thermal management to be a critical factor constraining their performance and reliability. Reducing the operating temperature and eliminating hot spots are the urgent issues that need to be addressed in thermal management [1]. Thermal interface materials (TIMs), as a crucial component of thermal management technologies, have become the one of the most effective solutions to address this challenge [2,3]. Filled into the gap between heat sources and heat dissipation devices, TIMs works to reduce thermal resistance and enhance heat transfer efficiency, thereby effectively reducing the operating temperature of devices and improving its stability and lifespan [4].
Conventional TIMs mainly use metals or inorganic compounds [5]. However, with the application of high-power density electronic devices, the performance requirements for TIMs have become increasingly stringent. In the current thermal management scenarios (such as chips, power devices, and efficient heat exchangers), polymer-based thermal interface materials with flexibility and easy installation are the best choice, and these advantages are not possessed by traditional metal or inorganic thermal interface materials.
To achieve more efficient heat conduction in complex operating environments, researchers have turned their attention to polymer-based composites, particularly focusing on enhancing thermal conductivity through the incorporation of various fillers into polymer matrices [6,7]. Li et al. [8] added h-BNNS and spherical BN(S-BN), respectively, to the polydimethylsiloxane. The thermal conductivity of h-BNNS with surface contact was higher than that of S-BN with point contact under the same filler content. The addition of high thermal conductivity fillers such as boron nitride (BN, piece), carbon fiber (CF, rod), and aluminum oxide (Al2O3, sphere) has been demonstrated to significantly improve the overall thermal conductivity of polymer-based TIMs [9,10]. The thermal conductivity of these fillers is much higher than that of polymers (~0.2 W/m∙K). Yang et al. [9] achieved a remarkable thermal conductivity of 12.11 W/m∙K by incorporating large-sized BN (20 μm) into a polydimethylsiloxane (PDMS) matrix at 75 wt% filler loading, followed by rolling, shearing, and stacking processes. Compared with the PDMS with a thermal conductivity of 0.2 W/m·K, it has been improved by 60 times. Dong et al. [10] employed an ice-templating method to align the CF. By the regular growth of ice crystals, the CF is pressed into the gaps between the ice crystals to achieve orientation. This method results in the composites with a thermal conductivity of 9.07 W/m∙K at 15.71 vol% CF content. Wu et al. [11] greatly enhanced the thermal conductivity of Al2O3/SR composites by optimizing filler parameters. The type, morphology, and distribution of these fillers, and their interfacial interactions with the matrix, have been shown to significantly influence the thermal conductivity [12]. Consequently, the rational design of composite structures to optimize thermal conduction while maintaining mechanical properties has become a crucial research focus in the field of TIMs.
In recent years, the incorporation of multi-dimensional fillers has emerged as an effective strategy to enhance the thermal conductivity of polymer-based composites. The introduction of multi-dimensional fillers not only improves the thermal conductivity but also enhances the flexibility and stability of the materials to a certain extent. In the work of Fu et al. [13], based on the SR, a combination of CF and Al2O3 was employed to construct thermal pathways, resulting in oriented TIMs with a remarkable thermal conductivity of 18.50 W/m∙K at 20 wt% CF content. In the SR matrix, Huang et al. [14] utilized flow shear forces to align CF, which were then combined with Al2O3, achieving an impressive thermal conductivity of 21.29 W/m∙K at a mere 12.1 wt% filler loading. Ji et al. [15] developed the composites by incorporating BN and Al2O3 into SR through a process involving extrusion, stacking, hot pressing, and shearing. The resulting material exhibits a thermal conductivity of 9.50 W/m∙K with BN and CF contents of 54.55 wt% and 4.76 wt%, respectively. Meanwhile, the material maintains excellent electrical insulation properties because the content of CF is relatively low and does not exceed the percolation threshold. However, the combination of three-dimensional fillers has received limited attention, and there remains a lack of comprehensive analysis regarding the interactions between fillers and matrices and their impact on the thermal conductivity of TIMs.
Simulation techniques have become indispensable tools in current research to gain deeper insights and predict the thermal conduction of multi-dimensional filler composite TIMs [16]. Through methodologies such as the representative volume element (RVE) hypothesis [17] and finite element analysis (FEA), researchers can investigate the interactions between fillers and polymer matrices at macroscopic scales, quantify the influence of various factors on thermal conduction performance, and optimize filler selection and composite ratios, thereby providing theoretical guidance for material design. In the study of Zong [18], the composite was prepared by using Al2O3/SR. Compared with the SR with a thermal conductivity of 0.2 W/m·K, it has been improved by 9 times. These approaches ultimately contribute to the development of efficient thermal management solutions for practical applications. The primary challenge in employing finite element methods for thermal conduction simulation lies in constructing a high-quality RVE that accurately reflects the macroscopic properties of composites without excessive computational resource consumption. For composites, the complex morphology and large quantity of particles necessitate sophisticated particle distribution generation algorithms and collision detection algorithms for RVE generation.
The most classical algorithm for generating particle distributions is the random sequential adsorption (RSA) algorithm. Tarantino et al. [19] utilized the RSA algorithm to generate microstructural models of porous composites. This algorithm typically yields models with filler loading rates below 30 vol% due to its inherent jamming limit [20]. To address this limitation, Tian et al. [21] propose a novel algorithm to improve computational efficiency and enable the generation of filler-oriented models by incorporating gradient descent. Bahmani et al. [22] developed the non-uniform sequential mobile packing algorithm, accompanied by a collision detection algorithm for cylinders, facilitating the generation of distributions for various filler types (rod and sphere) and enabling the construction of microstructural models for heterogeneous materials. Tian et al. [23] proposed a sequential absorption algorithm based on molecular dynamics, which significantly surpassed the limitations of the RSA algorithm, achieving model filler loading rates exceeding 50 vol%. The advantage of the MD algorithm is that it can achieve a high filling rate. Increasing the filling rate of high thermal conductivity fillers is the most direct and effective way to enhance thermal conductivity. However, the strategies for increasing the filling rate in simulations are not the same as those in actual production. For non-spherical fillers, the filling rate required in actual production (which may reach 50–70 vol%) is much higher than the current algorithm’s level (20–50 vol%). Therefore, we need to propose new algorithms that can increase the filling rate of the fillers. Meanwhile, with the application of materials such as fibers, nanosheets, and graphene, the simulation of composite materials requires efficient algorithms for filling non-spherical fillers. However, there is still relatively little research on this type of algorithm at present.
In this work, an ordered aggregation algorithm and a collision detection algorithm were proposed to enhance both efficiency and accuracy in detecting collisions between cylinders and other geometric shapes. The RVE geometric models for TIMs with various filler compositions were successfully established on the basis of the two algorithms. Through FEA, the steady-state heat conduction process in these composites was simulated. Subsequently, the influence of filler ratio, orientation angle, and size on the thermal conductivity of composites was analyzed by thermal conductivity variations and heat flux contour maps. Finally, a predictive thermal resistance model was developed to evaluate and optimize composite thermal properties. This comprehensive approach provides valuable insights into the structure–property relationships of advanced TIMs, and offers a framework for optimizing their thermal performance.
2. Method
2.1. Generation of Geometric Model
2.1.1. Ordered Aggregation Algorithm
In this study, the finite element method was applied to simulate the steady-state thermal conduction process in polymer-based TIMs reinforced by multi-dimensional fillers. The RVE is utilized as the geometric model to characterize the microstructural features of the composites which incorporate a polymer matrix and fillers as a cube. Its generation process is based on an enhanced version of the RSA algorithm [19], namely, the ordered aggregation algorithm (as shown in Figure 1a). The OAA has an additional process of sorting and aggregating particles compared to the RSA [22]. This algorithm initializes all particles according to the size of the region, target volume fraction, particle type, size, and ratio to generate an initial particle distribution within the initial region (slightly larger than the target region) and sorts the particles based on their distance from the center of the initial region. The particles then sequentially aggregate towards the center of the region while detecting potential overlaps. If overlaps occur, particle positions are adjusted accordingly until all particles are absorbed, satisfying both the non-overlapping condition and periodic boundary condition, ultimately yielding the desired particle distribution. The specific steps are as follows [22]:
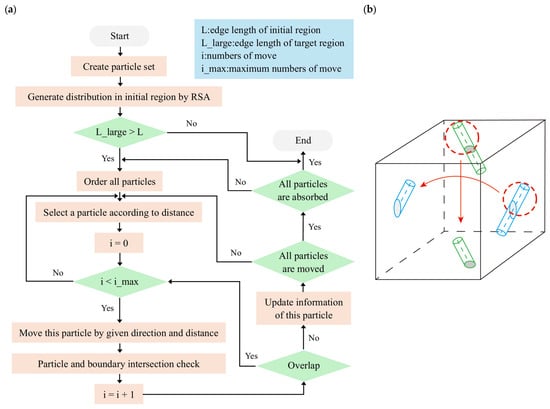
Figure 1.
(a) Flowchart of ordered aggregation algorithm. (b) The periodic boundary condition.
Firstly, an array, which is named particle set, is created to save the geometry parameter and other necessary parameters. There are three types of particle—rod, plate, and sphere—in the particle set. Both rod and plate belong to cylinder. The information on the size of particles, such as diameter and length, is defined in this step. Before initializing the position, it is essential to shuffle the particle sets, which are generated in sequence. The target volume fraction is achieved in a cubic region with side length L. The distribution of particles is attempted to be formed by the RSA algorithm. If the time spent in this process is less than constrained, it means the volume fraction is below the limitation of the RSA algorithm and the distribution can be adopted. The constraint of time on generating distribution is set to 5 s. When the required computation time exceeds the predefined limit, the algorithm initiates an expansion process by increasing the edge length of the filling region to L_large, with each iteration expanding the edge length by 20% of the original length L until the distribution generation time falls below the limit. The target region is partitioned into six pyramidal sub-regions corresponding to the six faces of the cube, to facilitate particle aggregation from six distinct directions toward the center. The coordinates of all particles relative to the center of the RVE were calculated. The minimum value of {|x|, |y|, |z|} is taken as the distance between the particle and the center of the RVE. Then, the particles were sorted in ascending order based on this distance. Based on the sorting result from the previous step, the particles were selected one by one to carry out the subsequent movement operations. For each particle movement, a direction vector and displacement distance are determined through an optimization process. The direction vector is established by randomly selecting a reference particle from those positioned ahead of the target particle and calculating the coordinate difference between them. The initial displacement distance is set as the distance between the starting and target positions, which is then halved in each subsequent iteration. If the moved particle intersects with any boundary, an extra particle will be generated in the corresponding position (being relative to the intersected boundary) as the periodic images (detailed in Figure 1b). The algorithm executes up to 25 iterations (statistical analysis revealed that the computational process achieves optimal efficiency within a range of 17 to 25 iterations) for each movement attempt to achieve a valid displacement, defined as a movement where neither the particle nor its periodic images collide with other particles. For invalid movements, the particle reverts to its pre-movement position. Valid movements are further evaluated to determine if the new position lies within the filling region, thereby confirming successful particle placement. Each particle completes its movement cycle either by achieving a valid displacement or reaching the maximum iteration limit. The algorithm progresses sequentially through the particle set, and, upon completion of the final particle’s movement, the system evaluates the filling status. If all particles are successfully placed within the filling region, the algorithm terminates and outputs the final particle distribution. Otherwise, a new major cycle commences, repeating the entire particle set iteration process until convergence is achieved.
The ordered aggregation algorithm can generate the distribution of the multi-morphology fillers model. Compared with other filling algorithms, there is no need to obtain the accurate distance between particles in most cases for ordered aggregation. As with the algorithm based on molecular dynamics, the moving time is calculated based on the distance between particles. Among the algorithms which gather particles to achieve higher volume fraction, the order operation in this algorithm enhances the calculation efficiency greatly. In current algorithms, there are many steps full of randomness that result in the emergence of unnecessary calculation steps. The ordered aggregation algorithm decreases the use of random processes while ensuring the randomness of the particle distribution.
2.1.2. Particle Collision Detection Algorithm
In this study, the geometric shapes used to simulate particle morphologies are spheres and cylinders. For the collision detection between two spheres, it is only necessary to determine whether the distance between the centers of the two spheres is greater than the sum of their radius. This can be expressed as follows:
where Check is a Boolean variable, Dij is the distance between particle i and j, and di and dj are the diameters of particles i and j, respectively. Solving the analytical solution of the distance between a cylinder and other geometric entities presents significant computational challenges, as it typically requires solving high-order equations. Consequently, collision detection involving cylinders generally uses a projection method that can reduce the dimensionality of the geometric problem. This approach achieves collision determination through multiple two-dimensional geometric analyses.
The Rodrigues transformation [24] was implemented as a preliminary step in the collision detection process. This transformation maintains the relative positions of the geometric entities while aligning the reference cylinder’s coordinates and directional vector with the origin and z-axis, respectively. The secondary geometric entity undergoes an identical transformation about the same rotation axis and angle. Subsequently, both entities are projected onto the z-axis and x-y plane. The absence of overlap in both projections indicates no collision between the geometric entities. The Rodrigues transformation is mathematically expressed as follows:
where p is the target vector, k is the rotation axis, and θ is the rotation angle. After rotating p around k by angle θ, the result is pr.
The algorithm process of collision detection between a cylinder and a sphere is as follows:
(1) Move the reference cylinder to the origin and obtain the transformed sphere coordinates p′, as shown in Figure 2a.
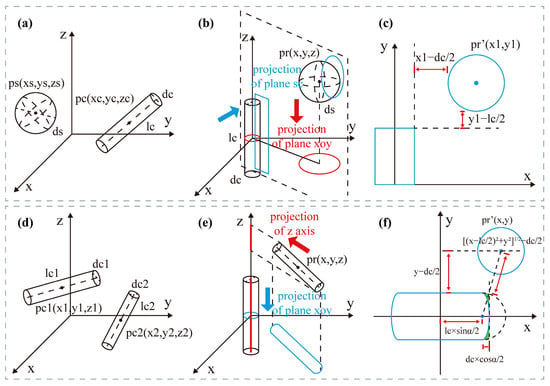
Figure 2.
(a–c) Collision check of cylinder and sphere (d–f). Collision check of cylinder and cylinder.
(2) Use the normal vector of the plane formed by the cylinder axis and the sphere’s position vector as the rotation axis, denoted as k. The angle between the cylinder axis and the z-axis is denoted as θ. Rotate the coordinate system by angle θ around the axis k, and obtain the transformed sphere coordinates pr (see Figure 2b).
(3) Project the geometries onto the x-y plane. Define the plane containing the cylinder axis and the sphere’s center as the sc plane, and project the geometries onto this plane. Referring to Figure 2c, if the shapes overlap, no collision occurs.
The algorithm process of collision detection between two cylinders is as follows:
(1) Calculate the distance between the axes of the two cylinders. If the distance is smaller than the sum of the radii, a collision occurs. Otherwise, proceed to the next step.
(2) Choose one cylinder as the reference. Translate the coordinate system to move the reference cylinder to the origin, and obtain the transformed coordinates of the other cylinder p’ (detailed in Figure 2d). Use the normal vector of the plane formed by the reference cylinder’s axis and the position vector of the second cylinder as the rotation axis, denoted as k, and the angle between the cylinder axis and the z-axis as θ. Rotate the coordinate system by angle θ around the axis k, and obtain the transformed coordinates pr, as shown in Figure 2e.
(3) Project the cylinders onto the z-axis to check if they overlap (see Figure 2e).
(4) Project the cylinder onto the x-y plane and translate the coordinate system to the center of the projection of the non-reference cylinder, and then perform a 2D Rodrigues transformation to align the capsule-shaped region of the second cylinder along the x-axis. The non-semicircular boundaries at the ends of the capsule are replaced by a combination of a line and a circle to simplify the overlap check (Figure 2f).
(5) Choose the other cylinder as the reference. Repeat steps 2–4. If the projections do not overlap, no collision occurs.
In the multi-fillers model, the fillers whose shapes were a rod or piece were used frequently. Both of them can be simulated to a cylinder in the RVE because of the sharp aspect ratio. More flexible algorithms that are suitable for irregular geometry usually spend a lot of time on the crude solution. The collision detection algorithm in this work breaks down the three-dimensional collision detection into some two-dimensional collision detection by dimensionality reduction and Rodrigues transformation. By the above method, our algorithm shortens the runtime significantly. The dimensionality reduction approach is similarly applied in other collision detection algorithms. As in Bahmani [22], the algorithm projects the cylinder onto the x-y, y-z, and z-x planes. The core challenge lies in detecting collisions between sub-figures after projection. The proposed algorithm exhibits an obvious advantage in efficiency compared with existing techniques with a similar solution [22]. Referring to Figure 3, the maximum volume fraction was increased. Compared with the work of Bahmani et al., the change in the dimension reduction strategy of the collision detection algorithm in this paper has improved the efficiency of the algorithm. In the oriented case, the maximum volume fraction increased from 52 vol% to 55 vol%; in the random case, the maximum volume fraction increased from 20 vol% to 24 vol%, an increase of 5.8% and 16.7%, respectively. Reducing the random process greatly improved the efficiency of the algorithm, saving a considerable amount of computing time. When the filler was oriented and the volume fraction was 52 vol%, the running time decreased from 131 s to 50 s. When the filler was random and the volume fraction was 20 vol%, the running time decreased from 78 s to 37 s.
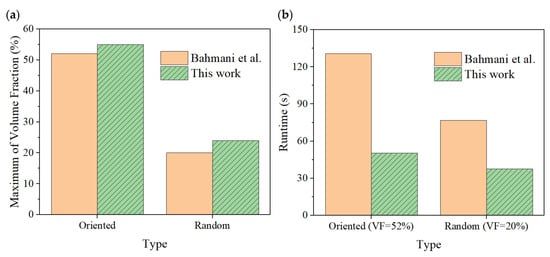
Figure 3.
Comparison of the performance of different algorithms [22]: (a) maximum volume fraction (b) runtime of the same case.
2.2. Finite Element Analysis
Steady-state heat conduction was simulated by the finite element method. The RVE was constructed based on different filler ratios. In the study of Xue [25], the oriented BN was highly ordered, which was observed in the SEM images. According to this result, it is sufficient to assume that the BN is parallel. So, the BN particles generated in the RVE are all parallel to each other. Then, the geometric models were imported into the commercial software COMSOL 6.1 for numerical simulation. In numerical calculation, the temperature field of the composites was solved through the steady-state heat conduction differential equation:
where λ is the thermal conductivity of the fillers and matrix and T is the temperature of the composites. The surface temperature of the chip is typically around 343.15 K and the ambient temperature is 293.15 K. The top and bottom surfaces of the RVE are the surface temperature of the chip and the ambient temperature, respectively. The surfaces are set to constant temperature boundaries Ttop = 343.15 K and Tbottom = 293.15 K, respectively. The surrounding surfaces are set to be adiabatic, meaning that the heat flux is zero. Firstly, based on the particle distribution calculated in Matlab, the geometric structure was drawn using the interface between Matlab and Comsol. Then, the thermal conductivity, density, and other material properties of the matrix and filler were set. The minimum grid unit was set to about 0.5 μm and the number of grids was approximately 2 × 10⁶. The steady-state heat conduction differential equation was solved to obtain the temperature field and heat flux distribution, and the equivalent thermal conductivity is calculated as follows:
where q is the heat flux distribution, S is the cross-sectional area in the heat transfer direction, Ω is any area on the cross-section, L is the distance between the top and bottom surfaces, and Ttop and Tbottom are the temperatures of the top and bottom surfaces, respectively. To ensure the reliability of the numerical solutions, it is necessary to verify that the results are independent of mesh density. In this case, the same filler ratio VFCF/VFBN = 8:2 was applied and the total volume fraction of the fillers was 30 vol%. The result confirms that thermal conductivity stabilizes when the element number is greater than 2 × 10⁶, as shown in Figure 4. In the calculation, properties of fillers are selected as shown in Table 1.
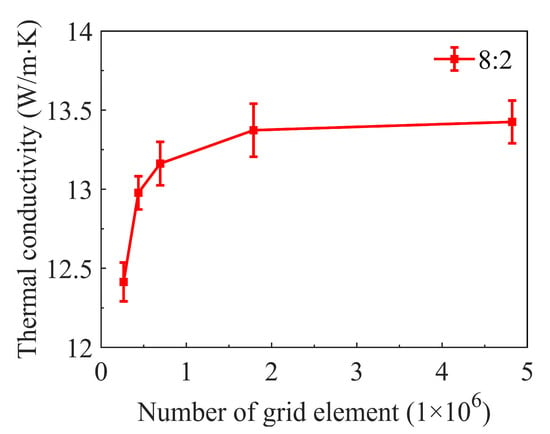
Figure 4.
Grid independence validation.

Table 1.
The physical property parameter of fillers.
2.3. Model Validation
To validate the reliability of the multi-dimensional filler packing model, this study selected the CF-BN composite system [26] and BN-Al2O3 composite system [27] as validation objects. The data from the experiments are detailed in Table 2.

Table 2.
The ratio of fillers in the experiment [23,24].
In the boundary condition setup, the walls of the RVE were set as adiabatic boundaries, while the upper and lower surfaces were subjected to constant wall temperature boundary conditions. The properties of the materials are shown in Table 1. The temperature field distribution was obtained through steady-state thermal conduction simulation. Based on Fourier’s law of heat conduction, the effective thermal conductivity of the composites was calculated from the temperature field distribution.
Two sets of validation experiments were conducted using different filler combinations which encompass all filler types utilized in the model. By comparing the calculated results with the experimental data in Figure 5, the maximum errors that are highlighted by a green circle were found to be 6.44% and 8.14%, respectively. Regarding the errors, on the one hand, it could be that there are errors in the experimental measurements; on the other hand, it could be that the orientation of the model used in the simulation differs from the actual orientation of the filler. The consistent agreement between the two sets of validation results collectively demonstrates the reliability of the multi-dimensional filler packing model in simulating the thermal conductivity of the composites.
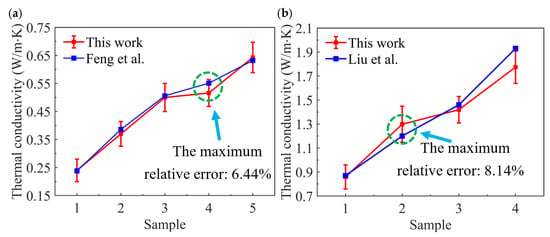
Figure 5.
Comparison of experiment and simulation: (a) BN + Al2O3 [24] (b) CF + BN [23].
3. Results and Discussion
3.1. Effects of BN/CF Volume Fraction Ratio
In the study of the performance of TIMs, the volume fraction of fillers is one of the most critical factors. In multi-dimensional filler systems, the synergistic effects of different types of fillers on the thermal conductivity of composites cannot be ignored. However, research on the influence of varying filler proportions on heat conduction remains insufficient. In this section, the total volume fraction of filler is set to 30 vol% (total volume fraction are all 30 vol% in other sections below unless otherwise stated), and models are generated with a varied volume fraction ratio of CF to BN (VFCF/VFBN) to calculate the effective thermal conductivity. The detailed calculation results are shown in Figure 6.
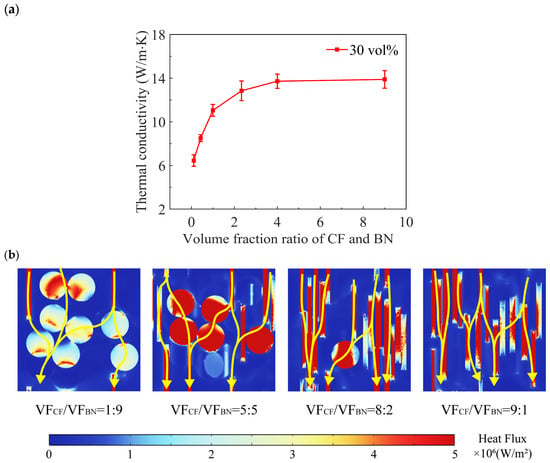
Figure 6.
(a) Correlation of thermal conductivity and volume fraction of CF and BN. (b) Heat flux contour map of simulation.
Figure 6a shows that the thermal conductivity of composites exhibits a pronounced dependence on VFCF/VFBN. When VFCF/VFBN increases from 0.11 to 9, the thermal conductivity increases by 137.8% (from 5.84 W/m∙K to 13.89 W/m∙K). VFCF/VFBN has little effect on thermal conductivity when it approaches 4 (13.72 W/m∙K), and only a 1.2% improvement can be observed at a VFCF/VFBN of 9. The y-z plane heat flux distributions (detailed in Figure 6b) reveal distinct heat conduction mechanisms at varying CF volume fraction. At low volume fractions, BN particles predominantly form thermal conduction pathways. However, due to their relatively low aspect ratio in the heat transfer direction, these BN-based pathways exhibit limited effectiveness, resulting in relatively low composite thermal conductivity, which only reaches 5.84 W/m∙K. As the CF content increases, a significant transition in heat conduction occurs. The CF begins to actively participate in heat conduction, establishing a network architecture where BN particles serve as nodal points interconnected by CF bridges. In this regime, the interconnections of fillers becomes directly proportional to the CF volume fraction, leading to a corresponding increase in composite thermal conductivity. Therefore, a 135.0% enhancement in thermal conductivity occurs as VFCF/VFBN increases from 0.11 to 4. At high CF concentrations, the thermal conductivity enhancement rate decreases significantly due to insufficient BN nodes available for additional pathways. The saturation of bridging sites severely limits further thermal pathway development, resulting in only a 1.2% conductivity increase when VFCF/VFBN rises from 4 to 9. This three-stage behavior (bridge between nodes—transition—node connects bridges) fundamentally illustrates the interaction between filler morphology, concentration, and network architecture in determining the thermal transport properties of composites.
3.2. Effect of the Orientation Angle
Orientation is a crucial strategy for enhancing the thermal conductivity of TIMs. The fillers with high thermal conductivity, such as graphene and CF, were frequently applied in high-performance TIMs, and commonly exhibit anisotropic thermal conductivity. Optimal thermal performance is achieved when the high-conductivity axis of these fillers aligns with the heat flux direction. The orientation angle, defined as the angle between the filler’s principal axis and the heat flux direction, serves as a critical parameter in determining thermal transport efficiency. The same VFCF/VFBN = 8:2 was applied in this section and other sections below.
In Figure 7a, the thermal conductivity shows a rapid decline from 13.82 W/m∙K at 0° to 0.74 W/m∙K at 45° orientation, representing a 94.7% reduction. To describe this behavior, we decomposed the heat flux into two components: pathway flux (parallel to the filler’s principal axis) and penetration flux (normal to the principal axis). The pathway flux, whose magnitude correlates strongly with effective thermal pathway length, dominates at small orientation angles, while the penetration flux propagating along the filler’s low-conductivity direction becomes increasingly significant at larger angles. Detailed analysis of x-z plane heat flux distributions (see Figure 7b) provides compelling evidence for this transition mechanism. At 72° orientation, fillers essentially fail to establish continuous thermal pathways. Both CF and BN exhibit anisotropy. As the orientation angle increases, the angle between the heat flow direction and the high thermal conductivity direction of the filler also increases, and the thermal resistance along the heat flow direction subsequently increases, ultimately resulting in minimal heat flux (about 0.1 × 10⁷ W/m2) and extremely low thermal conductivity (0.42 W/m∙K). This condition continues at 54°. However, when the orientation decreases at 36°, approximately half of the fillers experience a sudden heat flux surge to approximately 0.9 × 10⁷ W/m2, accompanied by a 150.0% thermal conductivity increase (1.05 W/m∙K) relative to 72°. The enhancement becomes even more pronounced at 18° orientation, where thermal conductivity exhibits a 10.43 times improvement. The result indicates that pathway flux decreases with increasing orientation angle, and penetration flux shows the opposite trend. The variation in penetration flux remains lower than pathway flux across all orientations, which explains the weakness in thermal transport performance at a higher orientation angle.
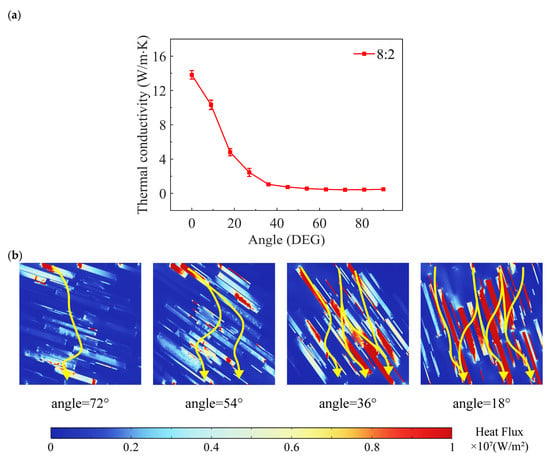
Figure 7.
(a) Correlation of thermal conductivity and angle. (b) Heat flux contour map of simulation.
3.3. Effect of the BN Particle Diameter
The thermal pathway theory, widely recognized as the predominant mechanism governing heat conduction in filler-reinforced TIMs, points out that heat primarily propagates along low-thermal-resistance pathways formed by interconnected filler networks, flowing from high- to low-temperature regions. Among the various factors influencing the quality of these thermal pathways, filler size is also a critical parameter. This section focuses on investigating the effect of BN particle diameter on thermal conductivity through simulations of CF-BN binary models with varying BN diameters. The simulation results demonstrate a positive correlation between thermal conductivity and diameter, as illustrated in Figure 8.
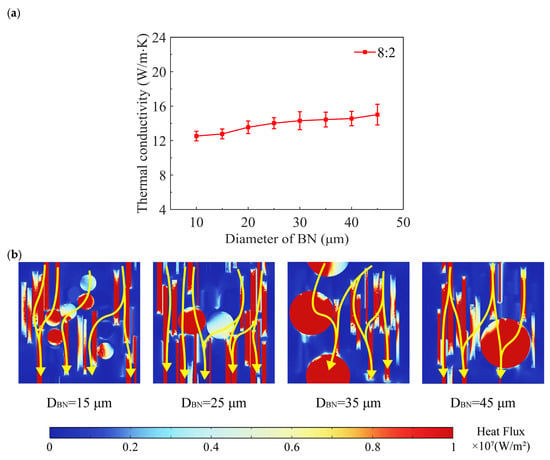
Figure 8.
(a) Correlation of thermal conductivity and diameter of BN (b). Heat flux contour map of simulation.
As shown in Figure 8a, the thermal conductivity reached 12.53 and 15.02 W/m∙K for DBN of 10 and 45 μm, respectively. While DBN rose 4.5 times, the corresponding thermal conductivity exhibited only 19.9% enhancement. The findings suggest that BN diameter is not a primary optimization parameter for enhancing the thermal conductivity of composites. The y-z plane heat flux distribution (detailed in Figure 8b) reveals that particle size significantly affects the heat flux carried by CF within the thermal pathways. Specifically, at DBN of 25 μm, CF exhibits great capacity of heat flux loadings, while the unfavorable effect of CF on the heat-carrying capacity of BN decreases with increasing size. Detailed analysis shows that, at DBN of 15 μm and 25 μm, some fillers exhibit heat flux values around 0.4 × 10⁷ W/m2, which is more pronounced for smaller DBN. This result is probably due to the fact that smaller BN particles create substantial interfacial thermal resistance, which markedly hinders the synergistic heat conduction between fillers. The synergistic effect of these mechanisms results in an overall improvement in thermal pathway quality with increasing diameter, ultimately leading to the observed positive correlation between thermal conductivity and diameter. This finding suggests that BN particle size is still of some importance in thermal conductivity optimization when considering its influence on filler synergistic effects.
3.4. Effect of the Al2O3 Volume Fraction
While the benefits of the two types of dimension filler systems in constructing thermal pathways have been extensively documented, the synergistic effects of the three types of dimension filler systems remain largely unexplored. This section investigates the thermal conduction behavior of CF-BN-Al2O3 ternary composite models, with a focus on the relationship between thermal conductivity and Al2O3 volume fraction, as illustrated in Figure 9.
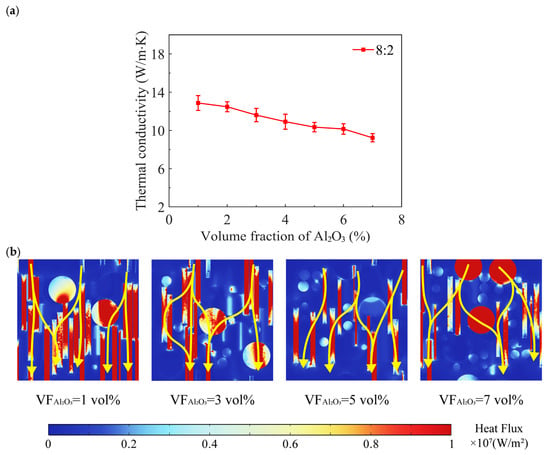
Figure 9.
(a) Correlation of thermal conductivity and volume fraction of Al2O3. (b) Heat flux contour map of simulation.
The results (Figure 9a) demonstrate that the ternary composites achieves maximum thermal conductivity (13.72 W/m∙K) in the absence of Al2O3 filler, as shown in Figure 6a. The thermal conductivity exhibits a decreasing trend with increasing Al2O3 volume fraction, showing an average reduction rate of 0.60 W/m∙K per 1 vol% Al2O3 addition. Moreover, this decreasing trend remains largely unchanged with higher loadings. Combined with the previous analysis, it can be preliminarily concluded that fillers with high aspect ratios are more effective in constructing efficient thermal pathways. The Al2O3 is isotropic material, and this property enables it to have a certain heat-conducting ability in all directions. However, during the heat-conduction process, the role of the heat-conducting path is to transfer heat from the hot end to the cold end. Materials with a high aspect ratio are more likely to form such a path, so alumina plays a relatively smaller role in constructing the thermal pathway. As the sphere volume fraction increases, the proportion of thermal resistance caused by heat flux penetrating the matrix also increases, degrading the overall quality of the thermal pathways. The y-z plane heat flux analysis (according to Figure 9b) demonstrates that spherical filler carries significantly less heat flux compared to BN and CF, approximately 0.3 × 10⁷ W/m2, and with small variation as its volume fraction increases. This indicates that its contribution to the thermal pathway of Al2O3 within the pathways is less than that of BN and CF. The research findings demonstrate that, while the morphology of the sphere facilitates excellent dispersion within the composite matrix, it simultaneously decreases its capability to construct efficient thermal pathways in filler-reinforced composites. This finding significantly elevates the importance of filler morphology in optimizing thermal pathway architecture and enhancing the overall performance of composites.
3.5. Equation of Thermal Conductivity
Inspired by the research of Ngo [28], a method was discovered for calculating thermal resistance by arranging the fillers in a regular pattern to simulate their distribution. Based on the comprehensive analysis of influencing factors, we have established a predictive model for thermal conductivity that incorporates key parameters and their physical relationships, as observed from heat flux distribution patterns. The model is an empirical correlation which requires fitting parameters for a given data set to be described. Recognizing the computational intensity of finite element methods for practical applications, we propose a thermal resistance-based model derived from thermal pathway theory. The filler orientation model consists of the following equations:
where subscripts 1, 2, and 3 denote rod, plate, and spherical fillers, respectively. k is thermal conductivity, v is volume fraction, l is characteristic dimension, k0 is matrix thermal conductivity, d, e, and f are morphology coefficients for respective filler shapes, and g is the contact resistance coefficient. Equation (7) is the thermal conductivity correlation when the orientation angle is 0° In Section 3.3, the fact that thermal conductivity is sensitive to orientation angle has been verified. The heat flux through the fillers is decomposed to horizontal to the filler and vertical to the filler. As the orientation angle varies, the horizontal flux and vertical flux are relative to cosine of angle and sine of angle, respectively. Meanwhile, taking into account the influence of particle morphology, the equation was modified. The modified equation is as follows:
where x is the orientation angle in radians, coefficient a is intrinsic thermal conductivity factor, and coefficient b and c are horizontal and vertical shape factor, respectively. When orientation angle is 0°, the correlation of thermal conductivity is Equation (7). In Equation (8), effective thermal conductive is a/2 when x is 0. So, incorporating the above correlation (Equations (7) and (8)), the final equation becomes the following:
Through curve fitting, the following coefficients are obtained: b = 40.81, c = −8.05, d = 10.23, e = 6.28, f = 1.51, and g = 3.05, respectively. Validation against FEA simulation results (shown in Figure 10) demonstrates excellent agreement, with the maximum error being 22.31%. As can be seen from Figure 10, when one type of packing material is too much and the other is too little, a relatively large error occurs in the fitting. According to the study of Sriharsha [29], when the volume fraction of the filler is too small or too large, the contact thermal resistance will increase, thereby reducing the thermal conductivity. However, the correlation formula proposed in this paper does not take this into account, resulting in the excessive thermal conductivity on both sides of the image in Figure 10. The average error of correlation is 5.18%. This confirms the effectiveness of this model in predicting thermal conductivity while considering filler volume fraction, size, and orientation angle. The proposed model offers a computationally efficient alternative to FEA, facilitating a rapid evaluation and optimization of composite thermal properties in practical applications.
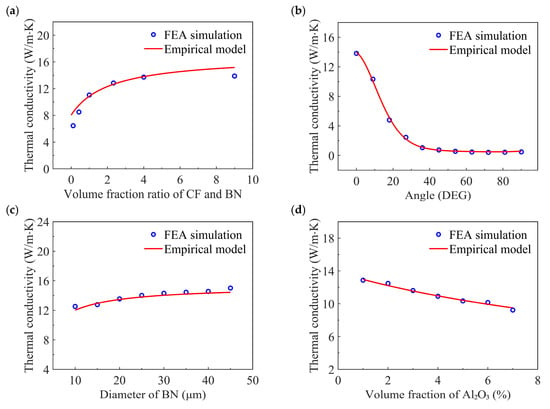
Figure 10.
The fitting result (a) BN/CF volume fraction ratio, (b) orientation angle, (c) BN diameter, and (d) Al2O3 volume fraction.
4. Conclusions
It has been verified that the thermal conductivity analysis method of the filled model, which combines the particle distribution generation algorithm proposed in this paper with the finite element method, can accurately reflect the heat transfer process of the multi-dimensional filler composite RVE model. It can predict the thermal conductivity of composites within an acceptable error range while proving the feasibility of using RVE to simulate the thermal conductivity properties of materials. Using the above method, the effects of the filler volume fraction, orientation angle, and size on the thermal conductivity of composites are investigated. The conclusions are as follows:
- Fillers with high aspect ratios, such as CF and BN, are more effective in constructing thermal pathways. In the CF-BN binary system, BN acts as nodes, and CF serves as bridges, with optimal performance achieved at a CF/BN volume fraction ratio of 4, reaching a thermal conductivity of 13.72 W/m∙K.
- The orientation angle of fillers critically influences thermal conductivity, with a 17.68 times increase observed when the angle decreases from 45° to 0°, reaching the value of 13.82 W/m∙K. A mathematical model (Equation (8)) was established to quantify this correlation.
- As the diameter of BN increases, the thermal conductivity gradually increases, but the rate of increase is small. The diameter of BN affects the synergistic effect between CF and BN, with larger diameters of BN being more beneficial for the construction of thermal pathways.
- The ternary system (CF-BN-Al2O3) shows no significant advantage, as the thermal conductivity decreases by 0.60 W/m∙K per 1 vol% increase in Al2O3, indicating that two-dimensional fillers satisfy the requirements of constructing thermal pathways.
- The developed predictive model, based on thermal resistance theory, provides a computationally efficient tool for evaluating and optimizing composite thermal properties. The model’s accuracy is confirmed by its agreement with numerical results, offering practical utility for material design.
Author Contributions
H.L.: Writing—original draft, Methodology, Code. B.L.: Writing—review and editing, Methodology, Supervision. W.D.: Validation, Software. X.Z.: Validation, Investigation. X.J.: Validation, Resources. L.C.: Supervision. All authors have read and agreed to the published version of the manuscript.
Funding
This research was funded by the Beijing Natural Science Foundation grant number L241002.
Data Availability Statement
The original contributions presented in this study are included in the article. Further inquiries can be directed to the corresponding author.
Conflicts of Interest
The authors declare no conflicts of interest.
References
- Guo, Y.; Ruan, K.; Gu, J. Controllable thermal conductivity in composites by constructing thermal conduction networks. Mater. Today Phys. 2021, 20, 100449. [Google Scholar] [CrossRef]
- Chung, D.D.L. Performance of Thermal Interface Materials. Small 2022, 18, e2200693. [Google Scholar] [CrossRef] [PubMed]
- Atinafu, D.G.; Yun, B.Y.; Kim, Y.U.; Kim, S. Nanopolyhybrids: Materials, Engineering Designs, and Advances in Thermal Management. Small Methods 2023, 7, e2201515. [Google Scholar] [CrossRef] [PubMed]
- Zhang, X.D.; Zhang, Z.T.; Wang, H.Z.; Cao, B.Y. Thermal Interface Materials with High Thermal Conductivity and Low Young’s Modulus Using a Solid-Liquid Metal Codoping Strategy. ACS Appl. Mater. Interfaces 2023, 15, 3534–3542. [Google Scholar] [CrossRef]
- Sarvar, F.; Whalley, D.C.; Conway, P.P. Thermal Interface Materials—A Review of the State of the Art. In Proceedings of the 1st Electronic Systemintegration Technology Conference, Dresden, Germany, 5–7 September 2006. [Google Scholar]
- Zhao, C.; Li, Y.; Liu, Y.; Xie, H.; Yu, W. A critical review of the preparation strategies of thermally conductive and electrically insulating polymeric materials and their applications in heat dissipation of electronic devices. Adv. Compos. Hybrid Mater. 2022, 6, 27. [Google Scholar] [CrossRef]
- Yang, J.; Shen, X.; Yang, W.; Kim, J.K. Templating strategies for 3D-structured thermally conductive composites: Recent advances and thermal energy applications. Prog. Mater. Sci. 2023, 133, 101054. [Google Scholar] [CrossRef]
- Li, M.; Wang, M.; Hou, X.; Zhan, Z.; Wang, H.; Fu, H.; Lin, C.-T.; Fu, L.; Jiang, N.; Yu, J. Highly thermal conductive and electrical insulating polymer composites with boron nitride. Compos. Part B Eng. 2020, 184, 107746. [Google Scholar] [CrossRef]
- Yang, R.; Wang, Y.; Zhang, Z.; Xu, K.; Li, L.; Cao, Y.; Li, M.; Zhang, J.; Qin, Y.; Zhu, B.; et al. Highly oriented BN-based TIMs with high through-plane thermal conductivity and low compression modulus. Mater. Horiz. 2024, 11, 4064–4074. [Google Scholar] [CrossRef]
- Dong, H.; Liu, Z.; Guo, J.; Lv, S.; Huang, H.; Jiang, X. Vertically aligned carbon fiber/polydimethylsiloxane composites prepared by lyophilization with exceptional thermal conductivity and electromagnetic interference shielding performance. Chem. Eng. J. 2024, 490, 151620. [Google Scholar] [CrossRef]
- Wu, J.; Song, X.; Gong, Y.; Yang, W.; Chen, L.; He, S.; Lin, J.; Bian, X. Analysis of the heat conduction mechanism for Al2O3/Silicone rubber composite material with FEM based on experiment observations. Compos. Sci. Technol. 2021, 210, 108809. [Google Scholar] [CrossRef]
- Ma, H.; Gao, B.; Wang, M.; Yuan, Z.; Shen, J.; Zhao, J.; Feng, Y. Strategies for enhancing thermal conductivity of polymer-based thermal interface materials: A review. J. Mater. Sci. 2020, 56, 1064–1086. [Google Scholar] [CrossRef]
- Fu, L.; Kong, N.; Huang, M.; Tian, Y.; Yan, Y.; Wen, B.; Ye, C.; Huang, D.; Han, F. Compressible thermal interface materials with high through-plane thermal conductivity from vertically oriented carbon fibers. J. Alloys Compd. 2024, 987, 174200. [Google Scholar] [CrossRef]
- Huang, F.; Qin, W.; Shu, D.; Sun, J.; Li, J.; Meng, D.; Yue, W.; Wang, C. Steppingstone-inspired construction of high vertical thermal conductivity material with low carbon fiber content. Ceram. Int. 2023, 49, 32971–32978. [Google Scholar] [CrossRef]
- Ji, Y.; Han, S.; Zhang, Q.; Wu, H.; Guo, S.; Zhang, F.; Qiu, J. Constructing a highly vertically aligned network of h-BN/CF in silicone rubber composites: Achieving superior through-plane thermal conductivity and electrical insulation. Compos. Part B Eng. 2023, 266, 111024. [Google Scholar] [CrossRef]
- Yang, M.; Li, X.; Kang, G.; Chen, W. Understanding macroscopic thermal conduction in composites reinforced with 2D nanosheets. Compos. Sci. Technol. 2024, 248, 110450. [Google Scholar] [CrossRef]
- Sun, C.T.; Vaidya, R.S. Prediction of composite properties from a representative volume element. Compos. Sci. Technol. 1996, 56, 171–179. [Google Scholar] [CrossRef]
- Zong, R.; Liu, B.; Wang, S.; Jia, X.; Li, S.; Huai, X. Numerical simulation of heat transfer of highly filled composites with spherical alumina fillers. Compos. Sci. Technol. 2025, 263, 111064. [Google Scholar] [CrossRef]
- Tarantino, M.G.; Zerhouni, O.; Danas, K. Random 3D-printed isotropic composites with high volume fraction of pore-like polydisperse inclusions and near-optimal elastic stiffness. Acta Mater. 2019, 175, 331–340. [Google Scholar] [CrossRef]
- Ghossein, E.; Lévesque, M. A fully automated numerical tool for a comprehensive validation of homogenization models and its application to spherical particles reinforced composites. Int. J. Solids Struct. 2012, 49, 1387–1398. [Google Scholar] [CrossRef]
- Tian, W.; Chao, X.; Fu, M.W.; Qi, L. An advanced method for efficiently generating composite RVEs with specified particle orientation. Compos. Sci. Technol. 2021, 205, 108647. [Google Scholar] [CrossRef]
- Bahmani, A.; Nooraie, R.Y.; Willett, T.L.; Montesano, J. A sequential mobile packing algorithm for micromechanical assessment of heterogeneous materials. Compos. Sci. Technol. 2023, 237, 110008. [Google Scholar] [CrossRef]
- Tian, W.; Chao, X.; Fu, M.W.; Qi, L. An algorithm for generation of RVEs of composites with high particle volume fractions. Compos. Sci. Technol. 2021, 207, 108714. [Google Scholar] [CrossRef]
- Dai, J.S. Euler–Rodrigues formula variations, quaternion conjugation and intrinsic connections. Mech. Mach. Theory 2015, 92, 144–152. [Google Scholar] [CrossRef]
- Xue, Y.; Li, X.; Wang, H.; Zhao, F.; Zhang, D.; Chen, Y. Improvement in thermal conductivity of through-plane aligned boron nitride/silicone rubber composites. Mater. Des. 2019, 165, 107580. [Google Scholar] [CrossRef]
- Liu, H.; Su, X.; Fu, R.; Wu, B.; Chen, X. The flexible film of SCF/BN/PDMS composites with high thermal conductivity and electrical insulation. Compos. Commun. 2021, 23, 100573. [Google Scholar] [CrossRef]
- Feng, Q.k.; Zhang, D.L.; Zha, J.w.; Yin, L.j.; Dang, Z.m. Thermal, electrical, and mechanical properties of addition-type liquid silicone rubber co-filled with Al2O3 particles and BN sheets. J. Appl. Polym. Sci. 2020, 137, 49399. [Google Scholar] [CrossRef]
- Ngo, I.-L.; Byon, C. A generalized correlation for predicting the thermal conductivity of composite materials. Int. J. Heat Mass Transf. 2015, 83, 408–415. [Google Scholar] [CrossRef]
- Sudhindra, S.; Kargar, F.; Balandin, A.A. Noncured Graphene Thermal Interface Materials for High-Power Electronics: Minimizing the Thermal Contact Resistance. Nanomaterials 2021, 11, 1699. [Google Scholar] [CrossRef]
Disclaimer/Publisher’s Note: The statements, opinions and data contained in all publications are solely those of the individual author(s) and contributor(s) and not of MDPI and/or the editor(s). MDPI and/or the editor(s) disclaim responsibility for any injury to people or property resulting from any ideas, methods, instructions or products referred to in the content. |
© 2025 by the authors. Licensee MDPI, Basel, Switzerland. This article is an open access article distributed under the terms and conditions of the Creative Commons Attribution (CC BY) license (https://creativecommons.org/licenses/by/4.0/).