Abstract
Background/Objectives: Insulin resistance (IR) in adolescents contributes to the development of metabolic and immunological alterations. These alterations can lead to chronic, systemic, low-grade inflammation in adulthood. Evidence suggests that alterations in miRNA expression play a significant role in the onset of IR by influencing insulin signaling pathways. Therefore, identifying specific miRNAs may aid in the early diagnosis of cardiometabolic risk, particularly during the transition from adolescence to adulthood. Methods: This population-based study aimed to analyze the expression of 21 miRNAs in the plasma of adolescents. We considered IR status, overweight, sex, and age for the analyses. The study measured miRNA expression in plasma samples from 187 adolescents aged 12 to 19 years from the cross-sectional study of the 2015 São Paulo Health Survey (ISA-Nutrition). MiRNA expression was assessed using Exiqon® assays on Fluidigm® technology (Les Ulis, France). Statistical analyses were performed to identify differences in miRNA expression and correlations between variables, using a complex research design to ensure representativeness at the population level. Results: The incidence of IR and overweight was high in adolescents (44% and 33%, respectively). High-sensitivity C-reactive protein (hs-CRP) concentration was higher in overweight adolescents. IR was correlated with higher plasma expression of miR-122 and miR-139-3p. Furthermore, miR-486, miR-363, miR-30d, miR-28, miR-223, miR-21, miR-146, miR-130b, miR-126, miR-122, and miR-139-3p showed specific correlations with individual risk for IR, sex, and adolescent stage. Conclusions: The miRNAs showed differential expression according to sex and adolescent stage, and were correlated with cardiometabolic risk factors, suggesting their potential utility for early screening in adolescents. The study highlights age- and sex-related differences in miRNA levels between adolescents with IR and overweight. The cross-sectional design is a limitation of this study, as we cannot infer causality for the associations observed here.
1. Introduction
Insulin resistance (IR) is characterized by impaired responsiveness to insulin in target tissues, resulting in reduced glucose uptake in specific tissues, such as skeletal muscle and white adipose tissue, and consequently, an increase in insulin production by pancreatic beta cells [1,2,3]. IR is associated with several metabolic alterations, including hyperglycemia, hyperinsulinemia, endothelial dysfunction, dyslipidemia, arterial hypertension, and elevated levels of inflammatory biomarkers [1]. These processes preceded the development of metabolic syndrome (MetS), non-alcoholic liver disease, and type 2 diabetes (T2D) [4].
Excess body fat is the primary risk factor for the development of IR, although genetic factors also contribute to its occurrence [1]. Metabolic disorders resulting from abdominal obesity are driven by chronic low-grade systemic inflammation [4,5,6,7,8,9], which occurs due to adipocyte hypertrophy and subsequent release of chemokines like monocyte chemotactic protein 1 (MCP-1), and pro-inflammatory cytokines such as tumor necrosis factor (TNF)-α, interleukin (IL)-1β and IL-6. Elevated levels of these inflammatory markers are associated with impaired insulin signaling pathway [5,6]
Identifying predictive biomarkers associated with type 2 diabetes (T2D) is crucial for early diagnosis, disease management, and understanding the underlying metabolic pathways [7,8]. Being endogenous non-coding RNA molecules containing 18 to 25 nucleotides and involved in the regulation of gene expression through post-transcriptional mechanisms, microRNAs (miRNAs) [9,10,11] may be important biomarkers for the detection of IR [12,13]. Importantly, miRNAs are found in body fluids, including blood [14], associated with exosomes (small extracellular vesicles of endosomal origin), microvesicles, lipoproteins, or ribonucleoproteins [15].
MiRNAs play a significant role in the development and pathophysiology of various metabolic diseases. Studies have reported distinct patterns of miRNA expression in serum and plasma associated with atherosclerotic disease [16], T2D [17,18,19,20], progression from prediabetes to diabetes [21,22], obesity [23,24,25,26], IR [27,28], arterial hypertension [29,30], and MetS [8,31]. Understanding the role that miRNA plays in the metabolic regulation of a disease before its development may contribute to public health in the context of early diagnosis and treatment.
Although previous studies have demonstrated the role of miRNAs in adults [7] and older adults with metabolic diseases [32], evidence remains limited regarding their expression in adolescents [33,34,35]. The data generated in adults may not fully translate to younger populations due to developmental differences that influence disease progression and therapeutic responses [34,35]. Throughout childhood and adolescence, individuals experience significant changes related to growth, development, and maturation [34]. In this context, expanding our understanding of how miRNA expression influences these processes is essential for clarifying their role in both normal development and the onset of disease during these stages [34,35]. Furthermore, the complex regulation of puberty indicates that miRNAs may play a role in these processes, emphasizing the need for further study [35].
Our study is the first population-based investigation in Brazil to provide novel evidence on circulating miRNA in adolescents according to age, sex and factors associated with IR. Thereby, we provide evidence that emphasizes key aspects of development and may contribute to the early identification of cardiometabolic risk at younger ages.
2. Materials and Methods
2.1. Population
In this study, we utilized data from 200 adolescents aged 12 to 19 years, participants in the São Paulo Health Survey with a focus on Nutrition (ISA-Nutrition), a population-based cross-sectional study conducted in 2015. The sample of adolescents was selected using a stratified probability method among residents of the urban area of the city of São Paulo, Brazil, and all participants consented in writing to participate in the research. Additional details of the method were previously described elsewhere [36,37].
This study was approved by the Ethics Committee of the School of Public Health at the University of São Paulo (CAAE 49221221.2.0000.5421) (approval date 21 August 2021). It was conducted in accordance with the principles outlined in the Declaration of Helsinki. Adolescents with acute inflammatory diseases and cancer using drugs likely to interfere with the evaluated biomarkers (anti-inflammatories, antibiotics, antiretrovirals, immunomodulators, and anorectics), consuming alcoholic beverages, pregnant/lactating women, smokers, and individuals using enteral/parenteral diet were excluded from the study.
2.2. Anamnesis and Clinical Evaluation
Standard protocols were used to measure weight, height, and waist circumference. The Body Mass Index (BMI) was classified according to the WHO z-score. Blood pressure was measured in triplicate from the right arm using a meter model Omron HEM-712C (Omron HealthCare, Kyoto, Japan). Fasting blood samples were collected, and plasma glucose and insulin levels were analyzed by colorimetric assay (Cobas; Roche Diagnostics GmbH, Mannheim, Germany) and multiplex immunoassay (LINCOplex®, Linco Research Inc., St. Charles, MO, USA), respectively.
The concentrations of total cholesterol, LDL-cholesterol, HDL-cholesterol, and triacylglycerols (TG) were measured in serum by enzymatic colorimetric assay (Cobas—Roche Diagnostics GmbH® (Mannheim, Germany). VLDL-c concentrations were calculated by dividing the TG values by 5, as established in the literature [36]. Plasma protein C concentrations were obtained by ELISA (Cat. No. HEA821Hu; CloudClone Corp., Houston, TX, USA).
The homeostasis model assessment index of insulin resistance (HOMA-IR) was calculated using the formula: [fasting glucose (mg/dL) X fasting serum insulin (µIU/mL)/405], according to the literature [38]. The cutoff points used for the HOMA-IR and definition of IR in adolescence were corrected for age and sex, as identified by Nogueira-de-Almeida et al. [39], where >2.65 for boys and >3.02 for girls aged 11–12.9 years; >3.21 for boys and >3.46 for girls aged 13–14.9 years; >2.39 for boys and >2.89 for girls aged 15–17.9 years. For participants aged ≥18 years, adult categorization was used (HOMA-IR > 2.7) [40].
Hyperinsulinemia was classified according to sex- and age-specific criteria, with fasting insulin values above the established cutoffs: 11–12.9 years: 12.18 μU/mL (boys) and 13.26 μU/mL (girls); 13–14.9 years: 13.74 μU/mL (boys) and 14.85 μU/mL (girls); 15–17.9 years: 10.27 μU/mL (boys) and 13.13 μU/mL (girls) [39]. High blood glucose was defined as fasting glucose levels between 100 and 126 mg/dL [40].
2.3. Procedures for Measurement of miRNA Expression
The measurement of miRNA expression was performed using Exiqon® assays on Fluidigm® technology (Les Ulis, France). The selection of the 21 miRNAs analyzed in this study was based on a systematic literature search to identify miRNAs in human plasma that showed significant associations with overweight and glycemic, lipid, and inflammatory profiles. The descriptions of the evaluated miRNAs are presented in Table 1.

Table 1.
Nomenclature of miRNA extracted from the plasma of adolescents.
2.4. Hemolysis Control
Hemolysis control was previously performed in all samples by measuring free hemoglobin at 414 nm, using a NanoQuant plate in a TECAN spectrophotometer (Männedorf, Switzerland).
2.5. RNA Extraction
RNA was extracted from 400 µL of plasma using Norgen® (Thorold, ON, Canada) Plasma/Serum Circulating and Exosomal RNA Purification Kit (Slurry Format) (Cat. 42800), following the manufacturer’s recommendations. All samples were added 2.7–4 µM cel-miR-39-3p (IDT) as an extraction control, and the RNA was eluted in 80 µL of elution buffer.
2.6. Reverse Transcription
For reverse transcription, 15 µL of eluted RNA solution and the miRCURY LNA RT kit (Cat. 339340), Qiagen-France, were used according to the supplier’s instructions. UniSP6 was used in all reactions (Spike-in kit Cat. 339390; Qiagen-France, Courtaboeuf, France).
2.7. Preamplification
For the 21 miRs analyzed, Spike-in UniSp6 and Spike-in Cel-miR-39 were used as PCR assay primers, and miRCURY LNA miRNA (Cat. 339306) from Qiagen-France (Courtaboeuf) was used for the pre-amplification step. The reverse transcription product was purified with Exonuclease I (Cat. M0293; New England Biolabs France, Evry, France) and diluted 1/10. After that, 1.25 µL of diluted cDNA was added to the primer mix in a 5 µL reaction volume. Fluidigm PreAmp Master mix (Cat 100-5580) was used for pre-amplification according to the supplier’s specifications (Les Ulis, France).
2.8. qPCR
qPCR was performed in triplicate for each assay from 1.5 µL of diluted preamplification product (1/10) using Biotium Fast Probe Master Mix (Fremont, CA, USA, Cat. 310005) in dynamic arrays 96 × 96 IFC (Cat. BMK-M-96.96) on a BiomarkTM instrument (Fluidigm, Paris, France) according to the supplier’s protocol. Raw Ct values greater than 40 were excluded from the analysis. The ΔCt method was used to estimate relative expression levels, and the normalization steps were performed as follows:
ΔCt = Ct (target miR) − Ct [(UniSP6 + cel-miR-39-3p)/2],
ΔΔCt = ΔCt (target miR) − mean ΔCt (target miR),
2−ΔΔCt (fold change) = (−ΔΔCt)2.
The fold change values calculated from the normalized ΔCt data were used for statistical analysis, with values between 0 and 1 considered as reduced expression and values > 1 considered as increased expression.
2.9. Target Gene Prediction
Targets for the miRNAs were predicted using TargetScanHuman 8.0 (http://www.targetscan.org) (accessed on 11 June 2023).
2.10. Statistical Analyses
Complex sampling procedures were employed in the statistical analyses to ensure representativeness at the population level for São Paulo, Brazil. Details of the sample selection procedures used in the ISA-Nutrition survey can be found in previous studies [36,37]. Non-parametric tests and histograms were used to analyze the distribution of variables, and the adjusted Wald test was employed to assess differences between nested models. Analyses were performed for the entire sample and for participants grouped according to adolescent stage (early (10–14 years) / middle (15–17 years) and late (18–19 years)), sex (male/female), and BMI status (Normal weight/Overweight + Obesity). Correlations (and their confidence intervals) between miRNA expression and lipid, inflammatory, and anthropometric parameters were estimated using Kendall’s tau-a. Correction for multiple comparisons was not required for this analysis per recommendations for hypothesis-generating research data analysis [41]. p-values < 0.05 were considered significant, and data were presented as mean ± SEM (standard error of the mean). All analyses were performed using Stata/SE 14.0 and all graphs were generated using GraphPad Prism 7.0.
3. Results
The participants’ characteristics are summarized in Table 2. Ten individuals with hemolyzed samples and three individuals with outlier values were excluded from the study, resulting in a final sample of 187 adolescents out of the initial 200. Underweight participants (n = 8) were excluded from analyses stratified by BMI status (normal weight and overweight + obesity). In addition, the absence of detectable miR-139-3p expression in some individuals resulted in a final sample of 149 adolescents for this specific miRNA analysis. Most participants were female (55%) and aged between 10 and 14 years (44%). IR was observed in 44% of adolescents, and 33% were classified as being overweight.
Table 2.
Clinical and anthropometric characteristics of study participants categorized according to insulin-resistant status (IR) and Body Mass Index status.
Adolescents with IR and/or being overweight exhibited higher WC, VLDL, TG, PAI-1, glycemia, and insulinemia compared with their counterparts. Overweight was additionally associated with higher systolic and diastolic blood pressure, elevated total cholesterol, and reduced HDL-c concentrations (Table 2).
Plasma miRNA expression differed according to IR and BMI status (Figure 1, Table 2). miR-122 levels were higher in adolescents with IR (fold change 2.4 ± 0.4) than in those without IR (fold change 1.1 ± 0.1; p = 0.0034). miR-139-3p expression was also elevated in the IR group (fold change 1.6 ± 0.2 vs. 1.1 ± 0.1; p = 0.0479) and in overweight adolescents compared with those of normal weight (fold change 1.9 ± 0.3 vs. 1.1 ± 0.1; p = 0.0100) (Figure 1B).
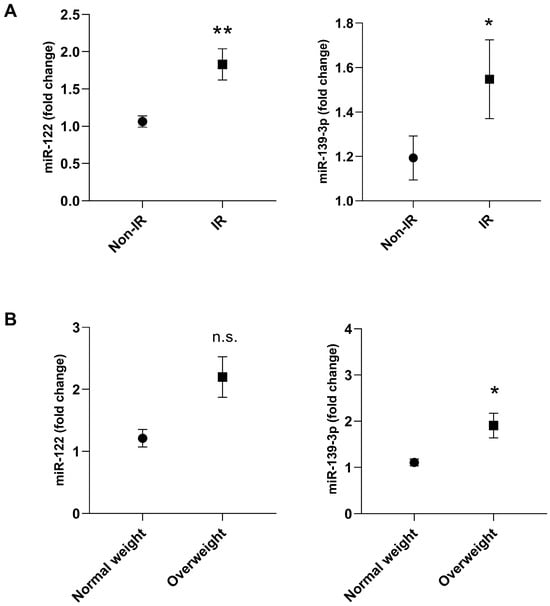
Figure 1.
Plasma miRNA expression of miR-122 and miR-139-3p in adolescents with insulin resistance (IR) and non-IR (A) or normal weight and overweight (B). Group non-IR or Normal weight: represented by the circle; Group IR or Overweight: represented by the square. Participants with underweight (n = 8) and those with no detectable miR-139-3p expression (n = 30) were excluded. Final sample for miR-122: normal weight (n = 121) and overweight(n = 58)/non-IR (n = 104) and IR (n = 83). Final sample for miR-139-3p: normal weight (n = 104) and overweight (n = 45)/non-IR (n = 89), and IR (n = 68). Differences between groups were assessed using the adjusted Wald test. The data are presented as mean ± SEM. Asterisks denote statistical significance: * p < 0.05; ** p < 0.01; n.s. = indicates not significant.
The remaining 19 miRNAs evaluated showed no statistically significant differences between the groups, as shown in Table 3.
Table 3.
Plasma expression of 19 miRNAs in non-insulin resistant (non-IR), insulin resistance (IR), normal weight, and overweight adolescents.
Male adolescents with IR showed higher expression levels of miR-122 (fold change = 2.9 ± 0.1) compared with the group without IR (fold change = 1.1 ± 0.6; p = 0.0026) (Figure 2A). When miRNA expression was analyzed according to the age group and IR status, it was observed that miR-122 showed higher expression in adolescents with IR at early (10–14 years) (fold change = 2.1 ± 0.3 vs. 1.4 ± 1.1; p= 0.0409) and middle adolescence (15–17 years) (fold change = 2.8 ± 0.9 vs. 0.8 ± 0.1; p= 0.0240) (Figure 2B).
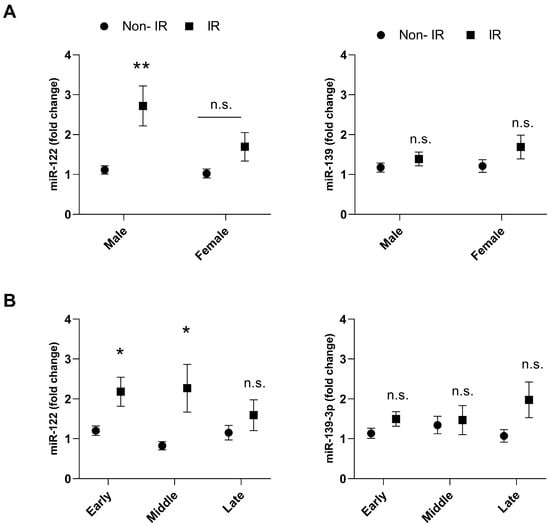
Figure 2.
Plasma expression of miR-122 and miR-139-3p in adolescents with insulin resistance (IR), and non-IR according to sex (A) and age (B). Group non-IR: represented by the circle; Group IR: represented by the square. Early (10–14 years), middle (15–17 years), and late (18–19 years) adolescent stages. Final sample for miR-122: non-IR male (n = 50), non-IR female (n = 54), IR male (n = 36), IR female (n = 47), non-IR early (n = 48), non-IR middle (n = 35), non-IR late (n = 21), IR early (n = 38), IR middle (n = 34), IR late (n = 11). Final sample for miR-139-3p: non-IR male (n = 44), non-IR female (n = 45), IR male (n = 32), IR female (n = 36), non-IR early (n = 41), non-IR middle (n = 30), non-IR late (n = 18), IR early (n = 32), IR middle (n = 27), IR late (n = 9). Differences between groups were assessed using the adjusted Wald test. The data presented as mean and SEM. Asterisks denote statistical significance: * p < 0.05; ** p < 0.01. n.s. = indicates not significant.
Overweight adolescents showed higher miR-122 levels at early (10–14 years) (fold change = 2.5 ± 0.4 vs. 1.4 ± 0.2; p = 0.0430) and late (18–19 years old) (fold change = 1.7 ± 0.3 vs. 1.0 ± 0.2; p = 0.0322) adolescence compared with normal weight group (Figure 3A). In addition, higher levels of miR-139-3p were observed in male overweight adolescents at a late age (18–19 years) (fold change = 2.0 ± 0.4 vs. 0.9 ± 0.1; p = 0.0144) versus adolescents with normal weight (Figure 3A,B).
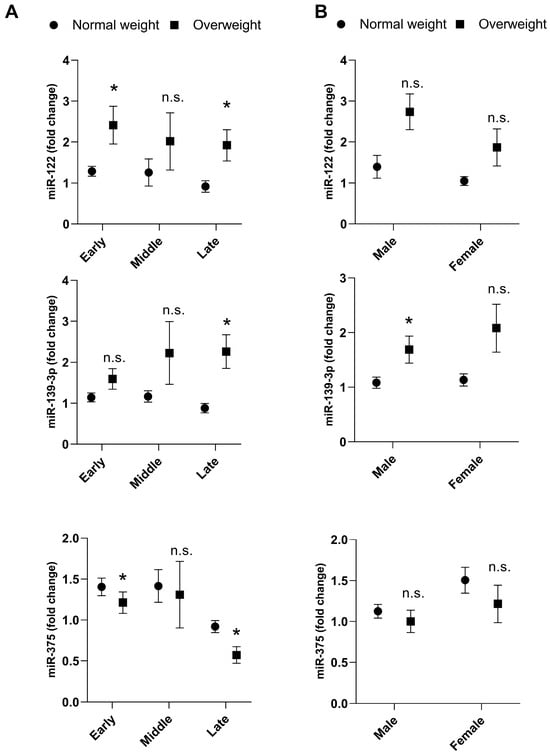
Figure 3.
Plasma expression of miR-122, miR-139-3p and miR-375 in normal weight and overweight adolescents according to adolescent stage (A) and sex (B). Underweight participants (n = 8) were excluded from analyses stratified by BMI status (normal weight and overweight + obesity). Final sample for miR-122 and miR-375: normal weight male (n = 57), normal weight female (n = 64), overweight male (n = 22), overweight female (n = 36), normal weight early (n = 52), normal weight middle (n = 48), normal weight late (n = 21), overweight early (n = 29), overweight middle (n = 19), overweight late (n = 10). Final sample for miR-139-3p: normal weight male (n = 49), normal weight female (n = 55), overweight male (n = 20), overweight female (n = 11), normal weight early (n = 45), normal weight middle (n = 42), normal weight late (n = 17), overweight early (n = 23), overweight middle (n = 13), overweight late (n = 9). A comparison of miRNA expressions between groups was obtained using the adjusted Wald test. The data presented as mean and SEM. Asterisks denote statistical significance: * p < 0.05; n.s. = indicates not significant.
On the other hand, overweight adolescents presented lower miR-375 expression in early (fold change = 1.1 ± 0.1 vs. 1.4 ± 0.1; p = 0.0489) and late (fold change = 0.5 ± 0.1 vs. 0.9 ± 0.1; p= 0.0020) adolescent stages compared with normal weight (Figure 3A).
The miR-122 was positively correlated with the concentrations of VLDL-c, triacylglycerol, IL-1β, IL-6, and IL-10. The miR-139-3p was negatively correlated with adiponectin concentration and positively with SBP and DBP (Table 4).
Table 4.
Correlation between plasma expression of miR-122 and miR-139 with lipid, inflammatory, and anthropometric characteristics of the study participants.
When the analysis was repeated among adolescents with IR, miR-139 expression was correlated with DBP (Coef.: 0.13, p = 0.04), LDL-c (Coef.: 0.12, p = 0.04), non-HDL cholesterol (Coef.: 0.12, p = 0.04), and ICAM (Coef.: 0.12, p = 0.04). On the other hand, in the subgroup of adolescents with overweight, the limited sample size (n = 45) likely contributed to the loss of statistical significance in the miR-139 correlations. Regarding miR-122, the correlations were consistent when comparing the total sample with the subgroup of adolescents with IR or overweight.
Upregulation of 11 out of the 23 evaluated miRNAs was observed under hyperinsulinemia/hyperglycemia conditions, with these changes occurring mainly in the middle adolescent group (15–17 years) (Figure 4). The observed alterations in the concentrations of these miRNAs may be explained by their predicted targets, which are linked to the regulation of glucose and energy metabolism, as well as inflammatory pathways (Figure 5).
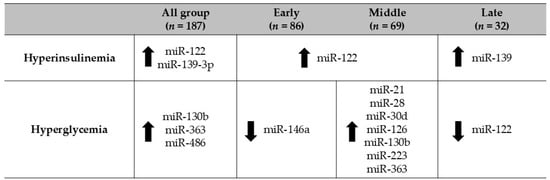
Figure 4.
Regulation of miRNAs in adolescents with hyperinsulinemia/hyperglycemia according to age group. The adjusted Wald test was used to evaluate differences in miRNA levels according to hyperinsulinemia/hyperglycemia status and across early adolescence (10–14 years), middle adolescence (15–17 years), and late adolescence (18–19 years).
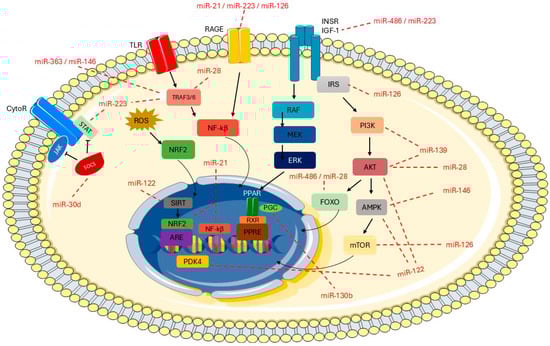
Figure 5.
Overview of metabolic pathways and predicted miRNAs targets. Predicted targets were identified using TargetScanHuman 8.0 (http://www.targetscan.org). The image was partly generated using Servier Medical Art, which is licensed under CC BY 4.0 (https://creativecommons.org/licenses/by/4.0/, accessed on 10 September 2025).
Figure 5 describes the potential target genes of the assessed miRNAs and their relationship with insulin signaling and inflammation pathways. Toll-like receptors (TLRs) activate TRAF3 and/or TRAF6 through the adaptor proteins TRIF or MyD88, which in turn phosphorylate nuclear factor kappa B (NF-κB). In this context, miR-28, miR-146, miR-223, and miR-363 have been identified as potential negative regulators of the genes TRAF3 and/or TRAF6, leading to decreased NF-κB activation and reduced production of proinflammatory cytokines. In addition, RAGE receptor genes can be regulated by miR-23, miR-126, and miR-223, resulting in downregulation of intracellular signaling cascades and suppression of NF-κB. The target gene RAGE is related to low-grade systemic inflammation, which plays an important role in the development of obesity. Another important signaling pathway is the JAK/STAT pathway, in which miR-223 may contribute to the downregulation of STAT genes, leading to suppression of cytokine-responsive gene transcription. In addition, miR-30d is associated with inflammation by targeting SOCS proteins. The potential target gene for miR-486 and miR-223 is the insulin receptor IGF-1, which activates intracellular signaling cascades involving IRS receptors and triggers downstream pathways such as PI3K/Akt, AMPK/mTOR, and MAPK/ERK. These pathways are related to insulin signaling, energy metabolism, and cell proliferation, differentiation, and survival. Several other miRNAs are also involved in this signaling cascade, including miR-126, miR-28, miR-139, miR-146, and miR-122. Moreover, miR-122 targets the PDK4 gene, which is linked to insulin resistance and altered inflammatory and glycemic profiles. Regarding the miR-130b target genes, these include PGC, which controls energy metabolism and lipid processing.
4. Discussion
The present study identified differences in miR-122 and miR-139-3p levels among adolescents, based on age group, sex, and the presence of IR. These miRNAs may serve as potential biomarkers for monitoring adolescents, given their association with inflammatory response, insulin signaling pathway, and glucose metabolism. Our findings suggest that both miR-122 and miR-139-3p play an important role in the mechanism of IR, overweight and inflammation in adolescents, since altered expression was detected across different associated factors. It is worth highlighting that this population-based cross-sectional study is the first to evaluate circulating miRNAs according to demographic factors and IR-related factors in Brazilian adolescents.
The occurrence of IR in adolescents contributes to the development of metabolic and immunological alterations that result in chronic, systemic, and low-grade inflammation in adulthood [42]. Overweight in adolescence is an important risk factor for other diseases or complications in adulthood, such as T2D, dyslipidemia, and MetS [31,43,44,45]. Such facts are closely associated with hypertrophy and hyperplasia of the white adipose tissue, which promotes the exacerbated secretion of adipokines with emphasis on pro-inflammatory cytokines such as TNF-α and IL-6, and triggers the state called metabolic inflammation [46]. In the present study, it was observed that the incidences of IR and overweight are high in adolescents, 44% and 33%, respectively. In addition, hs-CRP concentrations were higher in adolescents with overweight, which is consistent with a pro-inflammatory state.
Higher hs-CRP levels indicate systemic inflammation and have been linked to T2D and cardiovascular disease [45,47]. The determination of hs-CRP is not a specific biomarker; however, it indicates the occurrence of an inflammatory process and thus ends up predicting type 2 diabetes, cardiovascular disease [48,49,50], and insulinemia [51,52]. In addition, a higher concentration of PAI-1 was observed in adolescents with overweight and IR. It should be mentioned that the concentration of PAI-1 is higher in individuals with obesity, MetS, and T2D [53]. Studies showed that with the improvement of insulin sensitivity or the reduction in total weight and body fat, there is a reduction in the plasmatic concentration of PAI-1, showing a relationship between body weight and IR [53,54,55].
In this context, miRNAs have emerged as important post-transcriptional regulators, since they can regulate gene expression in pathways associated with inflammation and glucose metabolism [8,9,11,17,56]. The miR-122 and miR-139 can modulate inflammation and endothelial dysfunction [12]. In this study, the miR-122 plasma expression was higher in adolescents with IR. In addition, miR-122 showed a positive association with the cytokines IL-1β, IL-6, and IL-10. Previous studies demonstrated higher plasmatic miR-122 expression in individuals with T2D, showing positive associations with obesity, inflammatory markers, and a negative association with adiponectin [57,58].
Although the recognized relationship of miR-122 with the pathophysiology of T2D, the exact mechanisms through which miR-122 modulates the inflammatory response and the glicemic metabolism have yet to be fully elucidated [27,57]. Peripheral action of insulin may be regulated by numerous cytokines, which inhibit insulin receptor signaling and disrupt its downstream signal propagation [59]. One well-known example is TNF-α, which activates the JNK and IKK-β signaling pathways, leading to alterations in the insulin signaling and, ultimately, to the development of IR [59]. Furthermore, we suggest here that miR-122 is related to the control of glucose metabolism and inflammatory response, with target genes involved in the inflammatory response (SIRT) and insulin signaling (PDK4, AMPK, and AKT).
In addition, our results showed that miR-139-3p levels were higher in adolescents with IR and exhibited a positive association with blood pressure and a negative association with adiponectin concentration. Adiponectin, a cytokine secreted by adipose tissue, plays a broad metabolic role, being involved in the regulation of glucose and lipid metabolism, energy regulation, and inflammation [60]. Given this, adiponectin improves insulin sensitivity by promoting TG reduction in adipose tissue, liver, and muscle, through enhanced fatty acid oxidation and energy expenditure via PPAR-α activation [60]. On the other hand, reduced adiponectin concentrations are associated with IR and T2D [60,61,62].
An additional role of miR-139-3p in the regulation of glycemic metabolism and the inflammatory response has been suggested, as its predicted target genes are involved in insulin signaling (IRS1/2, PDK2, PI3K, AKT1). In mouse hepatocytes, miR-139 modulated the action of the transcription factor FOXO1 by reducing its gene expression [63].
The upregulation of miR-223 observed in our study is consistent with previous reports showing increased expression in the visceral adipose tissue of morbidly obese and IR individuals, where it modulates macrophage phenotype via TLR4/FBXW7 [64]. This upregulation has been proposed as a compensatory mechanism to suppress the inflammatory cascade in adipose tissue macrophages, acting in both pro- and anti-inflammatory pathways. In macrophage cell culture, miR-223 also regulates STAT3 expression and pro-inflammatory cytokines, including IL-1β and IL-6 [65].
We suggest that miR-21 has as potential target genes NF-Kβ and NRF2 related to inflammation. The higher expression of miR-21 may be a response to a pro-inflammatory environment [66,67]. Increased miR-21 expression enhances insulin-induced glucose uptake, downregulates PTEN, and promotes AKT (Ser473) and GSK3β (Ser9) phosphorylation, as well as GLUT4 translocation in adipocytes. This evidence supports the role of miR-21 in reducing IR through the PTEN-AKT pathway [68].
The miR-126 has as a possible target gene mTOR linked to energy metabolism and insulin resistance. Under hyperglycemic conditions, the anti-inflammatory effects of miR-126 may be related to the decreased expression of TNF-α and ROS, as well as reduced NADPH oxidase activity, as demonstrated in endothelial cells [69] and exosomes derived from mesenchymal stem cells [70]. The role of miR-126 in the inflammatory response has been widely reported, showing anti-inflammatory and immunoregulatory functions through the modulation of molecules involved in inflammation, cell proliferation, differentiation, and immune cell function [71,72]. In contrast, miR-375 positively regulates the TLR4 receptor and induces the activation of NF-κB, which promotes the inflammatory response [73]. Additionally, miR-375 plays a role in regulating insulin secretion in pancreatic cells [74].
Thus, the findings reported in this study corroborate the literature and suggest that circulating miRNAs are closely associated with metabolic parameters, involved in diverse metabolic pathways, including those related to the MetS (e.g.,: BMI, serum cholesterol and TG concentrations) [7,8,24,26,56,57,58,59]. Such associations underscore their potential as biomarkers for the early detection of metabolic alterations, suggesting that they can be used as an approach for disease diagnosis and prognosis, while also facilitating the development of improved therapeutic strategies [75,76].
However, other factors need to be considered when evaluating miRNA expression, such as demographic characteristics and lifestyle, in conjunction with clinical variables [7,33,34,35,77]. It is known that miRNA expression patterns undergo dynamic changes from childhood to adulthood and can be modulated by many factors, such as developmental stage, the concentration and action of developmental stage-specific hormones, diet, among others [33,34,35,77].
We could suggest that pubertal development patterns and hormone concentrations, for example, could be one of the factors influencing the modulation of miRNA expression observed here. A recent review reported the regulation of several miRNAs in the hypothalamus at the onset of puberty and their modulation of circulating miRNA expression as puberty progressed [35]. Sex-driven miRNA regulation has been observed in both gonadal organs, such as the testes and ovaries, and somatic organs, including the liver, lungs, and brain [35]. Furthermore, the hormones estrogen and androgen can modulate miRNA expression, influencing sex-specific responses to various stimuli [35].
Although pubertal stage was not directly assessed using established methods, the distribution of adolescents by age group was used as an indirect indicator of this variable, acknowledging the limitations of this approach due to individual variability in the onset and progression of puberty. Furthermore, additional limitations of the study include the inability to infer causal relationships due to its cross-sectional design. However, the study design is appropriate for its objectives, providing an overview of the study population and representing the first population-based investigation of miRNA expression in Brazilian adolescents and their association with metabolic variables, thus generating hypotheses for future research. Additionally, the relatively small number of individuals in each group may have limited our ability to detect potential associations. We also relied on web-based tools to predict the specific targets (or origin) of miRNAs rather than measuring them directly. Moreover, this study highlights the importance of assessing adolescents’ diet, as it is a factor associated with body fat accumulation and the development of IR, which were observed in a significant portion of the sample.
Nevertheless, these findings provide a significant contribution to the field, highlighting the associations of miR-122, miR-139-3p, miR-375, miR-223, miR-21, miR-126, and others with alterations in lipid, inflammatory, and glycemic profiles in adolescents with IR and overweight. We assume that our hypothetical cell secreted the microRNAS described in our study.
5. Conclusions
Our study demonstrated the modulation of circulating miRNAs in various contexts, including body fat accumulation, dysregulation of glucose metabolism, age, and biological sex, in a representative sample of Brazilian adolescents. In this context, we predominantly observed the upregulation of miRNAs (miR-21, miR-28, miR-30d, miR-122, miR-126, miR-139, miR-130b, miR-223, and miR-363) under conditions of hyperglycemia and hyperinsulinemia. Moreover, we identified associations between circulating miRNA levels and factors related to inflammatory, lipid, and anthropometric profiles.
The use of circulating miRNAs as biomarkers offers several advantages, as they can capture both biological and environmental profiles, supporting personalized medical approaches. In addition, they are non-invasive and can be assessed through body fluids, with alterations detectable years before changes in conventional diagnostic biomarkers. Given the growing evidence supporting their application in cancer and neurodegenerative diseases, their use in cardiometabolic conditions is also a promising possibility.
Author Contributions
Conceptualization, T.B.P. and M.M.R.; Data curation, T.B.P., P.N.B.-L., G.B.d.C. and R.M.F.; Investigation, T.B.P., P.N.B.-L. and G.B.d.C.; Methodology, T.B.P., P.N.B.-L., G.B.d.C., F.M.S., R.M.F. and M.M.R.; Supervision, M.M.R.; Writing—original draft, T.B.P. and M.M.R.; Writing—review and editing, T.B.P., P.N.B.-L., G.B.d.C., F.M.S., R.M.F. and M.M.R. All authors have read and agreed to the published version of the manuscript.
Funding
This work was funded by the National Council for Scientific and Technological Development—CNPq [Grant 150834/2020-9]; São Paulo Research Foundation—FAPESP [Grant 2017/05125-7, Grant 2020/03104-5|Grant 2019/22934-1]. The funding agencies had no role in the study design, data collection, data analysis, data interpretation, report writing, or the decision to submit the article for publication.
Institutional Review Board Statement
This study was approved by the Ethics Committee of the School of Public Health at the University of São Paulo (CAAE 49221221.2.0000.5421) (approval date 21 August 2021). It was conducted in accordance with the principles outlined in the Declaration of Helsinki.
Informed Consent Statement
Informed consent was obtained from all subjects involved in the study.
Data Availability Statement
The data presented in this study are available on request from the corresponding author due to privacy.
Conflicts of Interest
The authors declare no conflicts of interest.
References
- Freeman, A.M.; Acevedo, L.A.; Pennings, N. Insulin Resistance. In StatPearls; StatPearls Publishing: Treasure Island, FL, USA, 2023. [Google Scholar]
- Brown, J.C.; Harhay, M.O.; Harhay, M.N. The Value of Anthropometric Measures in Nutrition and Metabolism: Comment on Anthropometrically Predicted Visceral Adipose Tissue and Blood-Based Biomarkers: A Cross-Sectional Analysis. Nutr. Metab. Insights 2019, 57, 191. [Google Scholar] [CrossRef]
- Seong, J.; Yun, J.; Ji, K.; Sun, S.; Woo, K.; Kim, K.W. Hypothalamic inflammation and obesity: A mechanistic review. Arch. Pharm. Res. 2019, 42, 121–135. [Google Scholar] [CrossRef]
- Hotamisligil, G.S. Inflammation and metabolic disorders. Nature 2006, 444, 860–867. [Google Scholar] [CrossRef]
- McArdle, M.A.; Finucane, O.M.; Connaughton, R.M.; McMorrow, A.M.; Roche, H.M. Mechanisms of obesity-induced inflammation and insulin resistance: Insights into the emerging role of nutritional strategies. Front. Endocrinol. 2013, 4, 52. [Google Scholar] [CrossRef]
- Velloso, L.A. O controle hipotalâmico da fome e da termogênese-Implicações no desenvolvimento da obesidade. Arq. Bras. Endocrinol. Metabol. 2006, 50, 165–176. [Google Scholar] [CrossRef]
- Brandão-Lima, P.N.; de Carvalho, G.B.; Payolla, T.B.; Sarti, F.M.; Fisberg, R.M.; Malcomson, F.C.; Mathers, J.C.; Macedo, M.R. Circulating microRNAs Showed Specific Responses according to Metabolic Syndrome Components and Sex of Adults from a Population-Based Study. Metabolites 2022, 13, 2. [Google Scholar] [CrossRef]
- Lischka, J.; Schanzer, A.; Hojreh, A.; Ba-Ssalamah, A.; de Gier, C.; Valent, I.; Item, C.B.; Greber-Platzer, S.; Zeyda, M. Circulating microRNAs 34a, 122, and 192 are linked to obesity-associated inflammation and metabolic disease in pediatric patients. Int. J. Obes. 2021, 45, 1763–1772. [Google Scholar] [CrossRef]
- Etheridge, A.; Lee, I.; Hood, L.; Galas, D.; Wang, K. Extracellular microRNA: A new source of biomarkers. Mutat. Res. Fundam. Mol. Mech. Mutagen. 2011, 717, 85–90. [Google Scholar] [CrossRef]
- Matin, F.; Jeet, V.; Moya, L.; Selth, L.A.; Chambers, S.; Australian Prostate Cancer BioResource; Clements, J.A.; Batra, J. A Plasma Biomarker Panel of Four MicroRNAs for the Diagnosis of Prostate Cancer. Sci. Rep. 2018, 8, 6653. [Google Scholar] [CrossRef] [PubMed]
- Ajit, S.K. Circulating microRNAs as biomarkers, therapeutic targets, and signaling molecules. Sensors 2012, 12, 3359–3369. [Google Scholar] [CrossRef] [PubMed]
- Ambros, V. The functions of animal microRNAs. Nature 2004, 431, 350–355. [Google Scholar] [CrossRef] [PubMed]
- Wronska, A.; Kurkowska-Jastrzebska, I.; Santulli, G. Application of microRNAs in diagnosis and treatment of cardiovascular disease. Acta Physiol. 2015, 213, 60–83. [Google Scholar] [CrossRef] [PubMed]
- Garavelli, S.; Bruzzaniti, S.; Tagliabue, E.; Prattichizzo, F.; Di Silvestre, D.; Perna, F.; Sala, L.L.; Ceriello, A.; Mozzillo, E.; Fattorusso, V.; et al. Blood co-circulating extracellular micrornas and immune cell subsets associate with type 1 diabetes severity. Int. J. Mol. Sci. 2020, 21, 477. [Google Scholar] [CrossRef]
- Vickers, K.C.; Palmisano, B.T.; Shoucri, B.M.; Shamburek, R.D.; Remaley, A.T. MicroRNAs are transported in plasma and delivered to recipient cells by high-density lipoproteins. Nat. Cell Biol. 2011, 13, 423–435. [Google Scholar] [CrossRef]
- Fichtlscherer, S.; De Rosa, S.; Fox, H.; Schwietz, T.; Fischer, A.; Liebetrau, C.; Weber, M.; Hamm, C.W.; Röxe, T.; Müller-Ardogan, M.; et al. Circulating microRNAs in patients with coronary artery disease. Circ. Res. 2010, 107, 677–684. [Google Scholar] [CrossRef]
- La Sala, L.; Crestani, M.; Garavelli, S.; de Candia, P.; Pontiroli, A.E. Does microRNA perturbation control the mechanisms linking obesity and diabetes? Implications for cardiovascular risk. Int. J. Mol. Sci. 2021, 22, 143. [Google Scholar] [CrossRef]
- Higuchi, C.; Nakatsuka, A.; Eguchi, J.; Teshigawara, S.; Kanzaki, M.; Katayama, A.; Yamaguchi, S.; Takahashi, N.; Murakami, K.; Ogawa, D.; et al. Identification of circulating miR-101, miR-375, and miR-802 as biomarkers for type 2 diabetes. Metabolism 2015, 64, 489–497. [Google Scholar] [CrossRef]
- Prabu, P.; Rome, S.; Sathishkumar, C.; Aravind, S.; Mahalingam, B.; Shanthirani, C.S.; Gastebois, C.; Villard, A.; Mohan, V.; Balasubramanyam, M.; et al. Circulating miRNAs of ‘Asian Indian phenotype’ identified in subjects with impaired glucose tolerance and patients with type 2 diabetes. PLoS ONE 2015, 10, e0128372. [Google Scholar] [CrossRef]
- Sucharita, S.; Ashwini, V.; Prabhu, J.S.; Avadhany, S.T.; Ayyar, V.; Bantwal, G. The role of circulating microRNA in the regulation of beta cell function and insulin resistance among Indians with type 2 diabetes. Indian J. Endocrinol. Metab. 2018, 22, 770–773. [Google Scholar] [CrossRef] [PubMed]
- De Candia, P.; Spinetti, G.; Specchia, C.; Sangalli, E.; Sala, L.; Uccellatore, A.; Lupini, S.; Genovese, S.; Matarese, G.; Ceriello, A.; et al. A unique plasma microRNA profile defines type 2 diabetes progression. PLoS ONE 2017, 12, e0188980. [Google Scholar]
- Párrizas, M.; Brugnara, L.; Esteban, Y.; González-Franquesa, A.; Canivell, S.; Murillo, S.; Gordillo-Bastidas, E.; Cussó, R.; Cadefau, J.A.; García-Roves, P.M.; et al. Circulating miR-192 and miR-193b are markers of prediabetes and are modulated by an exercise intervention. J. Clin. Endocrinol. Metab. 2015, 100, E407–E415. [Google Scholar] [CrossRef]
- Cui, X.; You, L.; Zhu, L.; Wang, X.; Zhou, Y.; Li, Y.; Wen, J.; Xia, Y.; Wang, X.; Ji, C.; et al. Change in circulating microRNA profile of obese children indicates future risk of adult diabetes. Metabolism 2018, 78, 95–105. [Google Scholar] [CrossRef] [PubMed]
- Iacomino, G.; Russo, P.; Marena, P.; Lauria, F.; Venezia, A.; Ahrens, W.; De Henauw, S.; De Luca, P.; Foraita, R.; Günther, K.; et al. Circulating microRNAs are associated with early childhood obesity: Results of the I. Family Study. Genes Nutr. 2019, 14, 2. [Google Scholar] [CrossRef] [PubMed]
- Doumatey, A.P.; He, W.J.; Gaye, A.; Lei, L.; Zhou, J.; Gibbons, G.H.; Adeyemo, A.; Rotimi, C.R. Circulating MiR-374a-5p is a potential modulator of the inflammatory process in obesity. Sci. Rep. 2018, 8, 7680. [Google Scholar]
- Hijmans, J.G.; Diehl, K.J.; Bammert, T.D.; Kavlich, P.J.; Lincenberg, G.M.; Greiner, J.J.; Stauffer, B.L.; DeSouza, C.A. Influence of Overweight and Obesity on Circulating Inflammation-Related microRNA. MicroRNA 2018, 7, 148–154. [Google Scholar] [CrossRef]
- Wang, R.; Cao, Y.; Hong, J.; Shi, J.; Gu, W.; Zhang, Y.; Wang, W. Elevated Circulating MicroRNA-122 Is Associated with Obesity and Insulin Resistance in Young Adults. Eur. Soc. Endocrinol. 2015, 172, 291–300. [Google Scholar] [CrossRef]
- Corona-Meraz, F.I.; Vázquez-Del Mercado, M.; Ortega, F.J.; Ruiz-Quezada, S.L.; Guzmán-Ornelas, M.O.; Navarro-Hernández, R.E. Ageing influences the relationship of circulating miR-33a and miR-33b levels with insulin resistance and adiposity. Diabetes Vasc. Dis. Res. 2019, 16, 244–253. [Google Scholar]
- Badawy, H.K.; Abo-Elmatty, D.M.; Mesbah, N.M. Association between serum microRNA-605 and microRNA-623 expression and essential hypertension in Egyptian patients. Meta Gene 2018, 16, 62–65. [Google Scholar]
- Shi, J.; Ren, Y.; Liu, Y.; Cheng, Y.; Liu, Y. Circulating miR-3135b and miR-107 are potential biomarkers for severe hypertension. J. Hum. Hypertens. 2021, 35, 343–350. [Google Scholar] [CrossRef]
- Al-Rawaf, H.A. Circulating microRNAs and adipokines as markers of metabolic syndrome in adolescents with obesity. Clin. Nutr. 2019, 38, 2231–2238. [Google Scholar] [CrossRef]
- de Carvalho, G.; Payolla, T.; Brandão-Lima, P.; Sarti, S.; Fisberg, R.; Rogero, M. Association between circulating micro-ribonucleic acids and metabolic syndrome in older adults from a population-based study. Clin. Nutr. ESPEN 2023, 58, 320–325. [Google Scholar] [CrossRef]
- Redling, D.; Bialak, S.; El ghormli, L.; Chernausek, S.D.; Jones, K.; Tryggestad, J.B. Circulating MicroRNAs as Predictors of Beta Cell Function in Youth-onset Type 2 Diabetes: The TODAY Study. J. Clin. Endocrinol. Metab. 2024, 109, 3027–3035. [Google Scholar] [CrossRef]
- Jeong, H.R.; Hwang, I.T. MicroRNAs as novel biomarkers for the diagnosis and treatment of pediatric diseases. Clin. Exp. Pediatr. 2024, 67, 119–125. [Google Scholar] [CrossRef]
- Jeong, H.R.; Hwang, I.T. The role of MicroRNAs as fine-tuners in the onset of puberty: A comprehensive review. Ann. Pediatr. Endocrinol. Metab. 2024, 29, 211–219. [Google Scholar] [CrossRef]
- Fisberg, R.M.; Sales, C.H.; Fontanell Mde, M.; Pereira, J.L.; Alves, M.C.G.P.; Escuder, M.M.L.; César, C.L.G.; Goldbaum, M. Health Survey of São Paulo with Focus on Nutrition: Rationale, Design, and Procedures. Nutrients 2018, 10, 169. [Google Scholar] [CrossRef]
- Alves, M.C.G.P.; Escuder, M.M.L.; Goldbaum, M.; Barros, M.B.A.; Fisberg, R.M.; Cesar, C.L.G. Sampling plan in health surveys, city of São Paulo, Brazil, 2015. Rev. Saúde Pública 2018, 52, 81. [Google Scholar] [CrossRef]
- Matthews, D.R.; Hosker, J.P.; Rudenski, A.S.; Naylor, B.A.; Treacher, D.F.; Turner, R.C. Homeostasis model assessment: Insulin resistance and β-cell function from fasting plasma glucose and insulin concentrations in man. Diabetologia 1985, 28, 412–419. [Google Scholar] [CrossRef] [PubMed]
- Nogueira-de-Almeida, C.A.; de Mello, E.D. Different criteria for the definition of insulin resistance and its relation with Dyslipidemia in overweight and obese children and adolescents. Pediatr. Gastroenterol. Hepatol. Nutr. 2018, 21, 59–67. [Google Scholar] [CrossRef] [PubMed]
- Geloneze, B.; Vasques, A.C.; Stabe, C.F.; Pareja, J.C.; Rosado, L.E.; Queiroz, E.C.; Tambascia, M.A. Índices HOMA1-IR e HOMA2-IR para identificação de resistência à insulina e síndrome metabólica-Estudo Brasileiro de Síndrome Metabólica (BRAMS). Arq. Bras. Endocrinol. Metabol. 2009, 53, 281–287. [Google Scholar] [CrossRef] [PubMed]
- Streiner, D.L.; Norman, G.R. Correction for multiple testing: Is there a resolution? Chest 2011, 1, 16–18. [Google Scholar] [CrossRef]
- Furman, D.; Campisi, J.; Verdin, E.; Carrera-Bastos, P.; Targ, S.; Franceschi, C.; Ferrucci, L.; Gilroy, D.W.; Fasano, A.; Miller, G.W.; et al. Chronic inflammation in the etiology of disease across the life span. Nat. Med. 2019, 25, 1822–1832. [Google Scholar] [CrossRef] [PubMed]
- Cook, S.; Weitzman, M.; Auinger, P.; Nguyen, M.; Dietz, W.H. Prevalence of a Metabolic Syndrome Phenotype in Adolescents: Findings from the third National Health and Nutrition Examination Survey, 1988–1994. Arch. Pediatr. Adolesc. Med. 2003, 157, 821–827. [Google Scholar] [CrossRef] [PubMed]
- Strauss, R.S.; Pollack, H.A. Epidemic Increase in Childhood Overweight. JAMA 2001, 286, 2845–2848. [Google Scholar] [CrossRef]
- Casagrande, S.S.; Lawrence, J.M. Cardiovascular disease risk factors and their associations with inflammation among US adolescents: NHANES, 2015 to March 2020. BMJ Open Diabetes Res. Care 2024, 12, e004148. [Google Scholar] [CrossRef] [PubMed]
- Dali-Youcef, N.; Mecili, M.; Ricci, R.; Andrès, E. Metabolic inflammation: Connecting obesity and insulin resistance. Ann. Med. 2013, 45, 242–253. [Google Scholar] [CrossRef]
- Visser, M.; Bouter, L.M.; McQuillan, G.M.; Wener, M.H.; Harris, T.B. Elevated C-Reactive Protein Levels in Overweight and Obese Adults. JAMA 1999, 282, 2131–2135. [Google Scholar] [CrossRef]
- Devaraj, S.; Singh, U.; Jialal, I. Human C-reactive protein and the metabolic syndrome. Curr. Opin. Lipidol. 2009, 20, 182–189. [Google Scholar] [CrossRef]
- den Engelsen, C.; Koekkoek, P.S.; Gorter, K.J.; van den Donk, M.; Salomé, P.L.; Rutten, G.E. High-sensitivity C-reactive protein to detect metabolic syndrome in a centrally obese population: A cross-sectional analysis. Cardiovasc. Diabetol. 2012, 11, 25. [Google Scholar] [CrossRef]
- Festa, A.; D’Agostino, R.; Howard, G.; Mykkänen, L.; Tracy, R.P.; Haffner, S.M. Chronic subclinical inflammation as part of the insulin resistance syndrome: The insulin resistance atherosclerosis study (IRAS). Circulation 2000, 102, 42–47. [Google Scholar] [CrossRef]
- Vu, J.D.; Vu, J.B.; Pio, J.R.; Malik, S.; Franklin, S.S.; Chen, R.S.; Wong, N.D. Impact of C-reactive protein on the likelihood of peripheral arterial disease in United States adults with the metabolic syndrome, diabetes mellitus, and preexisting cardiovascular disease. Am. J. Cardiol. 2005, 96, 655–658. [Google Scholar] [CrossRef]
- Freeman, D.J.; Norrie, J.; Caslake, M.J.; Gaw, A.; Ford, I.; Lowe, G.D.O.; O’Reilly, D.S.; Packard, C.J.; Sattar, N. C-reactive protein is an independent predictor of risk for the development of diabetes in the West of Scotland coronary prevention study. Diabetes 2002, 51, 1596–1600. [Google Scholar] [CrossRef]
- Juhan-Vague, I.; Alessi, M.C.; Mavri, A.; Morange, P.E. Plasminogen activator inhibitor-1, inflammation, obesity, insulin resistance and vascular risk. J. Thromb. Haemost. 2003, 1, 1575–1579. [Google Scholar] [CrossRef] [PubMed]
- Alessi, M.C.; Juhan-Vague, I. PAI-1 and the metabolic syndrome: Links, causes, and consequences. Arterioscler. Thromb. Vasc. Biol. 2006, 26, 2200–2207. [Google Scholar] [CrossRef] [PubMed]
- Folsom, A.R.; Qamhieh, H.T.; Wing, R.R.; Jeffery, R.W.; Stinson, V.L.; Kuller, L.H.; Wu, K.K. Impact of weight loss on plasminogen activator inhibitor (PAI-1), factor VII, and other hemostatic factors in moderately overweight adults. Arterioscler. Thromb. 1993, 13, 162–169. [Google Scholar] [CrossRef] [PubMed]
- Shah, R.; Murthy, V.; Pacold, M.; Danielson, K.; Tanriverdi, K.; Larson, M.G.; Hanspers, K.; Pico, A.; Mick, E.; Rei, J.; et al. Extracellular RNAs are associated with insulin resistance and metabolic phenotypes. Diabetes Care 2017, 40, 546–553. [Google Scholar] [CrossRef]
- Mohany, K.M.; Al Rugaie, O.; Al-Wutayd, O.; Al-Nafeesah, A. Investigation of the levels of circulating miR-29a, miR-122, sestrin 2 and inflammatory markers in obese children with/without type 2 diabetes: A case control study. BMC Endocr. Disord. 2021, 21, 152. [Google Scholar] [CrossRef]
- Zeinali, F.; Aghaei Zarch, S.M.; Jahan-Mihan, A.; Kalantar, S.M.; Vahidi Mehrjardi, M.Y.; Fallahzadeh, H.; Hosseinzadeh, M.; Rahmanian, M.; Mozaffari-Khosravi, H. Circulating microRNA-122, microRNA-126-3p, and microRNA-146a are associated with inflammation in patients with pre-diabetes and type 2 diabetes mellitus: A case control study. PLoS ONE 2021, 16, e0251697. [Google Scholar] [CrossRef]
- Wu, H.; Ballantyne, C.M. Metabolic Inflammation and Insulin Resistance in Obesity. Circ. Res. 2020, 126, 1549–1564. [Google Scholar] [CrossRef]
- Khoramipour, K.; Chamari, K.; Hekmatikar, A.A.; Ziyaiyan, A.; Taherkhani, S.; Elguindy, N.M.; Bragazzi, N.L. Adiponectin: Structure, Physiological Functions, Role in Diseases, and Effects of Nutrition. Nutrients 2021, 13, 1180. [Google Scholar] [CrossRef]
- Siitonen, N.; Pulkkinen, L.; Lindström, J.; Kolehmainen, M.; Eriksson, J.G.; Venojärvi, M.; Ilanne-Parikka, P.; Keinänen-Kiukaanniemi, S.; Tuomilehto, J.; Uusitupa, M. Association of ADIPOQ gene variants with body weight, type 2 diabetes, and serum adiponectin concentrations: The Finnish Diabetes Prevention Study. BMC Med. Genet. 2011, 12, 5. [Google Scholar] [CrossRef]
- Gupta, V.; Mishra, S.; Mishra, S.; Kumar, S.; Gupta, V. Association of Leptin: Adiponectin ratio and metabolic risk markers in postmenopausal women. Immunol. Lett. 2018, 196, 63–67. [Google Scholar] [CrossRef]
- Hasseine, L.K.; Hinault, C.; Lebrun, P.; Gautier, N.; Paul-Bellon, R.; Van Obberghen, E. miR-139 impacts FoxO1 action by decreasing FoxO1 protein in mouse hepatocytes. Biochem. Biophys. Res. Commun. 2009, 390, 1278–1282. [Google Scholar] [CrossRef] [PubMed]
- Deiuliis, J.A.; Syed, R.; Duggineni, D.; Rutsky, J.; Rengasamy, P.; Zhang, J.; Huang, K.; Needleman, B.; Mikami, D.; Perry, K.; et al. Visceral Adipose MicroRNA 223 Is Upregulated in Human and Murine Obesity and Modulates the Inflammatory Phenotype of Macrophages. PLoS ONE 2016, 11, e0165962. [Google Scholar] [CrossRef]
- Chen, Q.; Wang, H.; Liu, Y.; Song, Y.; Lai, L.; Han, Q.; Cao, X.; Wang, Q. Inducible MicroRNA-223 Down-Regulation Promotes TLR-Triggered IL-6 and IL-1b Production in Macrophages by Targeting STAT3. PLoS ONE 2012, 7, e42971. [Google Scholar]
- Madhyastha, R.; Madhyastha, H.; Nurrahmah, Q.I.; Purbasari, B.; Maruyama, M.; Nakajima, Y. MicroRNA 21 Elicits a Pro-inflammatory Response in Macrophages, with Exosomes Functioning as Delivery Vehicles. Inflammation 2021, 44, 1274–1287. [Google Scholar] [CrossRef]
- Nara, K.; Kawashima, N.; Noda, S.; Fujii, M.; Hashimoto, K.; Tazawa, K.; Okiji, T. Anti-inflammatory roles of microRNA 21 in lipopolysaccharide-stimulated human dental pulp cells. J. Cell. Physiol. 2019, 234, 21331–21341. [Google Scholar] [CrossRef]
- Ling, H.-Y.; Hu, B.; Hu, X.-B.; Zhong, J.; Feng, S.-D.; Qin, L.; Liu, G.; Wen, G.B.; Liao, D.F. MiRNA-21 Reverses High Glucose and High Insulin-Induced Insulin Resistance in 3T3-L1 Adipocytes through Targeting Phosphatase and Tensin Homologue. Exp. Clin. Endocrinol. Diabetes 2012, 120, 553–559. [Google Scholar] [CrossRef]
- Song-Tao, T.; Wang, F.; Shao, M.; Wang, Y.; Hua-Qing, Z. MicroRNA-126 suppresses inflammation in endothelial cells under hyperglycemic condition by targeting HMGB1. Vasc. Pharm. 2017, 88, 48–55. [Google Scholar] [CrossRef]
- Zhang, W.; Wang, Y.; Kong, Y. Exosomes derived from mesenchymal stem cells modulate miR-126 to ameliorate hyperglycemia-induced retinal inflammation via targeting HMGB1. Invest. Ophthalmol. Vis. Sci. 2019, 60, 294–303. [Google Scholar] [CrossRef] [PubMed]
- Babu, S.S.; Thandavarayan, R.A.; Joladarashi, D.; Jeyabal, P.; Krishnamurthy, S.; Bhimaraj, A.; Youker, K.A.; Krishnamurthy, P. MicroRNA-126 overexpression rescues diabetes-induced impairment in efferocytosis of apoptotic cardiomyocytes. Sci. Rep. 2016, 6, 36207. [Google Scholar]
- Guo, B.; Gu, J.; Zhuang, T.; Zhang, J.; Fan, C.; Li, Y.; Zhao, M.; Chen, R.; Wang, R.; Kong, Y.; et al. MicroRNA-126: From biology to therapeutics. Biomed. Pharmacoth. 2025, 185, 117953. [Google Scholar] [CrossRef] [PubMed]
- Wu, C.-P.; Bi, Y.-J.; Liu, D.-M.; Wang, L.-Y. Hsa-miR-375 promotes the progression of inflammatory bowel disease by upregulating TLR4. Eur. Rev. Med. Pharmacol. Sci. 2019, 23, 7543–7549. [Google Scholar] [CrossRef] [PubMed]
- Li, X. miR-375, a microRNA related to diabetes. Gene 2014, 533, 1–4. [Google Scholar] [CrossRef] [PubMed]
- Villagrán-Silva, F.; Loren, P.; Sandoval, C.; Lanas, F.; Salazar, L.A. Circulating microRNAs as Potential Biomarkers of Overweight and Obesity in Adults: A Narrative Review. Genes 2025, 16, 349. [Google Scholar] [CrossRef]
- Bielska, A.; Niemira, M.; Kretowski, A. Recent Highlights of Research on miRNAs as Early Potential Biomarkers for Cardiovascular Complications of Type 2 Diabetes Mellitus. Int. J. Mol. Sci. 2021, 22, 3153. [Google Scholar] [CrossRef]
- Pointner, A.; Krammer, U.D.B.; Tomeva, E.; Magnet, U.; Hippe, B.; Jacob, U.; Haslberger, A.G. Lifestyle-Driven Variations in Nutrimiromic MicroRNA Expression Patterns across and beyond Genders. Life 2024, 14, 390. [Google Scholar] [CrossRef]
Disclaimer/Publisher’s Note: The statements, opinions and data contained in all publications are solely those of the individual author(s) and contributor(s) and not of MDPI and/or the editor(s). MDPI and/or the editor(s) disclaim responsibility for any injury to people or property resulting from any ideas, methods, instructions or products referred to in the content. |
© 2025 by the authors. Licensee MDPI, Basel, Switzerland. This article is an open access article distributed under the terms and conditions of the Creative Commons Attribution (CC BY) license (https://creativecommons.org/licenses/by/4.0/).