1. Introduction
In recent years, with the acceleration of industrialization and the improvement of the urbanization level, the production volume of hazardous waste is increasing year by year. Against the background of the increasing awareness of environmental protection, the safe and effective disposal of hazardous waste has become an important issue to be solved urgently [
1]. Safe landfill is a method for the disposal of hazardous waste, which has the advantages of a simple process, flexible operation and maximum isolation from the natural environment of the biosphere, and it is suitable for hazardous waste that cannot recover its components and energy [
2,
3]. With the promulgation of the new version of the “Hazardous Waste Landfill Pollution Control Standard” (GB 18598-2019) [
4], the admission requirements for landfill waste are more stringent. As a form of landfill that appears in the standard for the first time, rigid landfills have lower requirements in terms of the geological conditions of the construction site and can receive more types of landfill waste than flexible landfills. It is currently in a stage of rapid development [
5,
6].
Composite geomembrane has excellent anti-seepage ability and good ductility, as well as the characteristics of fast construction and low cost, and it has been widely used in anti-seepage projects such as earth–rock dams, embankments, cofferdams, storage basins, reservoirs, and channels [
7,
8,
9]. In rigid landfill projects, composite geomembrane is often chosen to be installed in the unit pool of the landfill reservoir to prevent the leakage of leachate from hazardous waste.
In the past few years, studies concerning the seepage prevention of composite geomembrane has mostly focused on dam, reservoir and other hydraulic engineering projects. Girod [
10] studied the seepage quantity of a dam when composite geomembrane was used as an impermeable body and derived the empirical formula for the seepage quantity of the impermeable body on this basis. Abbas [
11] used the finite element method to simulate the long-term penetration path of intact or leaky composite geomembrane. Kang [
12] established a two-dimensional finite element model of a homogeneous earth dam and analyzed the seepage and slope stability of the homogeneous earth dam under different conditions of laying and not laying composite geomembrane. Cheng [
13] used the finite element method to analyze the seepage prevention of composite geomembrane for an earth–rock dam by combining the seepage prevention characteristics and mechanism of composite geomembrane. Li [
14] used the Qingyuanhu Reservoir in Shandong Province as a case study to evaluate the effectiveness of seepage prevention in the dam body using composite geomembranes through numerical simulation. Cao [
15] took the Xixia Reservoir as an example and proposed a simulation method for the anti-seepage layer of composite geomembrane. By establishing a three-dimensional finite element calculation model of the composite geomembrane anti-seepage reservoir, they calculated and analyzed the seepage development law of the composite geomembrane. Han [
16] established an overall three-dimensional finite element model for the upper reservoir (dam) area of a pumped storage power station in Jiangxi Province and carried out a simulation analysis of the seepage characteristics of the composite geomembrane. Currently, there is a limited amount of research both domestically and internationally on the anti-seepage performance of composite geomembranes applied in rigid landfills. Given that most waste stored in rigid landfills consists of hazardous materials, the potential seepage of leachate could result in severe ecological damage. Consequently, investigating the anti-seepage characteristics of composite geomembranes in rigid landfills holds significant importance for ensuring project safety. Further exploration and analysis of the competitive and cooperative relationships among cities within this region are of significant theoretical and practical importance for advancing regional integration processes, optimizing resource allocation, enhancing the overall regional competitiveness, and achieving high-quality development.
At present, an increasing number of scholars are utilizing the finite element method to study the impermeability of composite geomembranes. Given that the thickness of composite geomembranes employed in impermeability engineering is typically thin, often reaching approximately 1~2 mm, accurately describing the impermeability of composite geomembranes in finite element seepage calculations has become a critical issue. At present, the conventional approach involves transforming the composite geomembrane into an equivalent porous medium with a specific thickness based on the principle of flow equivalence [
17,
18]. However, the appropriate degree of amplification and whether such equivalent treatment significantly alters the seepage flow and flow velocity require further investigation in conjunction with specific engineering conditions.
In this paper, taking a rigid landfill project in Tongling as an example, the seepage prevention characteristics of composite geomembranes in rigid landfills are calculated and analyzed using the finite element method, considering the actual engineering thickness of the composite geomembrane. Then, according to the principle of flow equivalence, the calculated thickness of the composite geomembrane is increased to varying degrees. The calculation results of the various schemes are compared with the actual thickness, and the relationship between the magnification of the composite geomembrane thickness and the changes in the percolation flow rate and seepage velocity is analyzed.
2. Project Overview
The reservoir area of a rigid landfill in Tongling covers an area of about 20,000 m2, with a total storage capacity of about 75,000 m3. The landfill is designed as an overhead reinforced concrete pool structure. According to its functional use, the landfill can be categorized into three main layers from bottom to top: the maintenance interlayer, the reservoir pool body, and the landfill operation layer. The reservoir body of the project consists of 300 cells, with each cell measuring 7.05m × 7.05m × 5 m (length × width × height). The side walls and bottom plate of the reservoir body have a uniform thickness of 0.4 m.
This project implements dual anti-seepage measures. The walls and bottom plates of the unit pool are constructed using impermeable waterproof concrete with an anti-seepage grade of P8. In addition to the self-impermeable rigid pool structure, composite geomembrane anti-seepage materials are installed to further ensure the safety and reliability of the anti-seepage system. The composite geomembrane adopts a membrane, two cloths and three-layer structure, that is, 600 g/m2 filament non-woven geotextile + 2 mm thick smooth HDPE geomembrane + 600 g/m2 filament non-woven geotextile, which is laid on the base plate and side wall of the cell pool.
4. Finite Element Model Establishment
4.1. Model Establishment and Unit Division
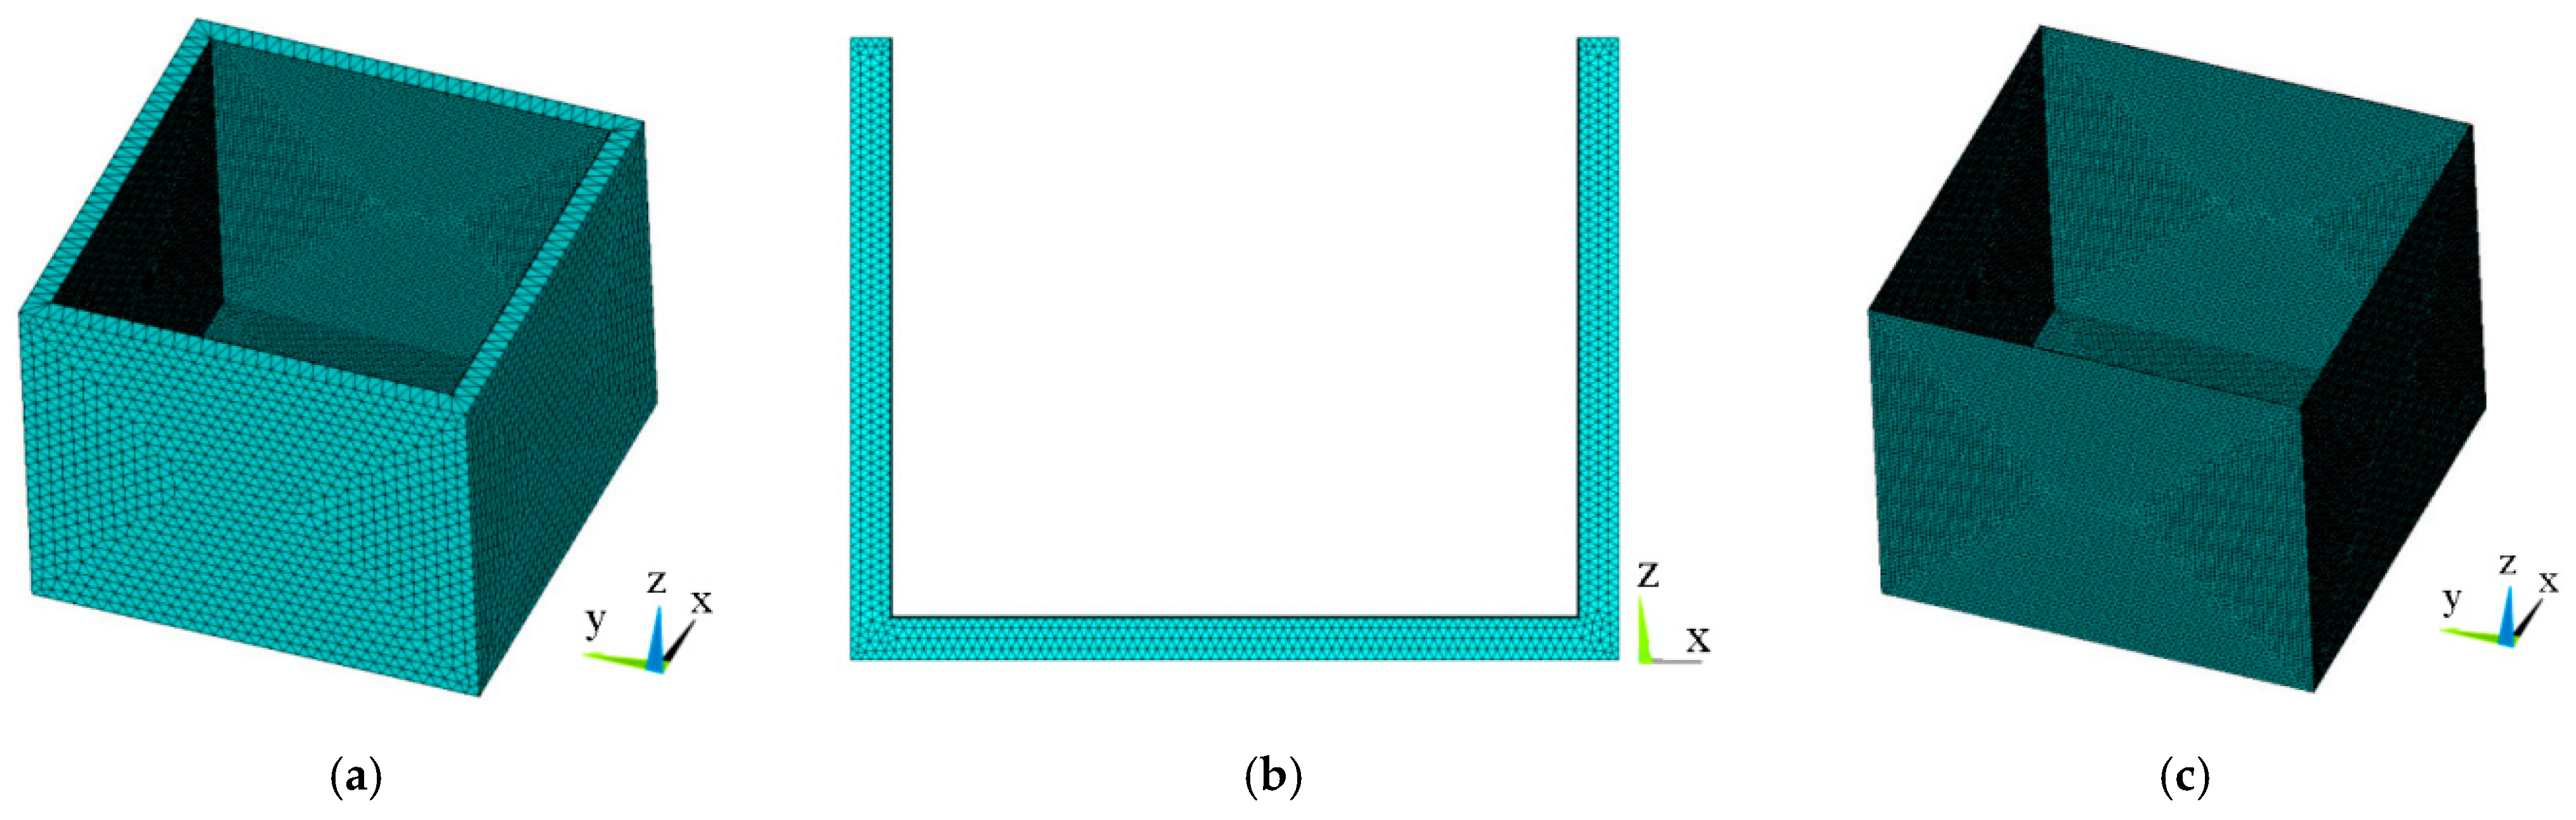
From the perspective of the percolation of hazardous waste leachate, each landfill cell pool can be treated as an independent unit, and the interconnections between the pools can be considered negligible. Consequently, this study selects a single cell pool as a representative example to construct a finite element calculation model using a Cartesian coordinate system, as depicted in
Figure 2. The cell pool has a height of 6 m, with both its length and width measuring 7.05 m. The walls and bottom slab of the pool have a uniform thickness of 0.4 m, while the composite geomembrane lining covering the pool is 2 mm thick.
The reinforced concrete structure of the landfill cell pool and the composite geomembrane within the pool are modeled using solid elements. During mesh generation, given the extremely small thickness of the composite geomembrane, local mesh refinement is applied to ensure accurate representation. Additionally, the coupling issue between the nodes of the composite geomembrane and the concrete cell pool must be addressed to maintain the structural integrity. In the model depicted in
Figure 2, the composite geomembrane consists of a total of 17,312 elements and 22,165 nodes, while the entire structure comprises 29,512 elements and 33,458 nodes.
4.2. Boundary Conditions and Computational Parameters
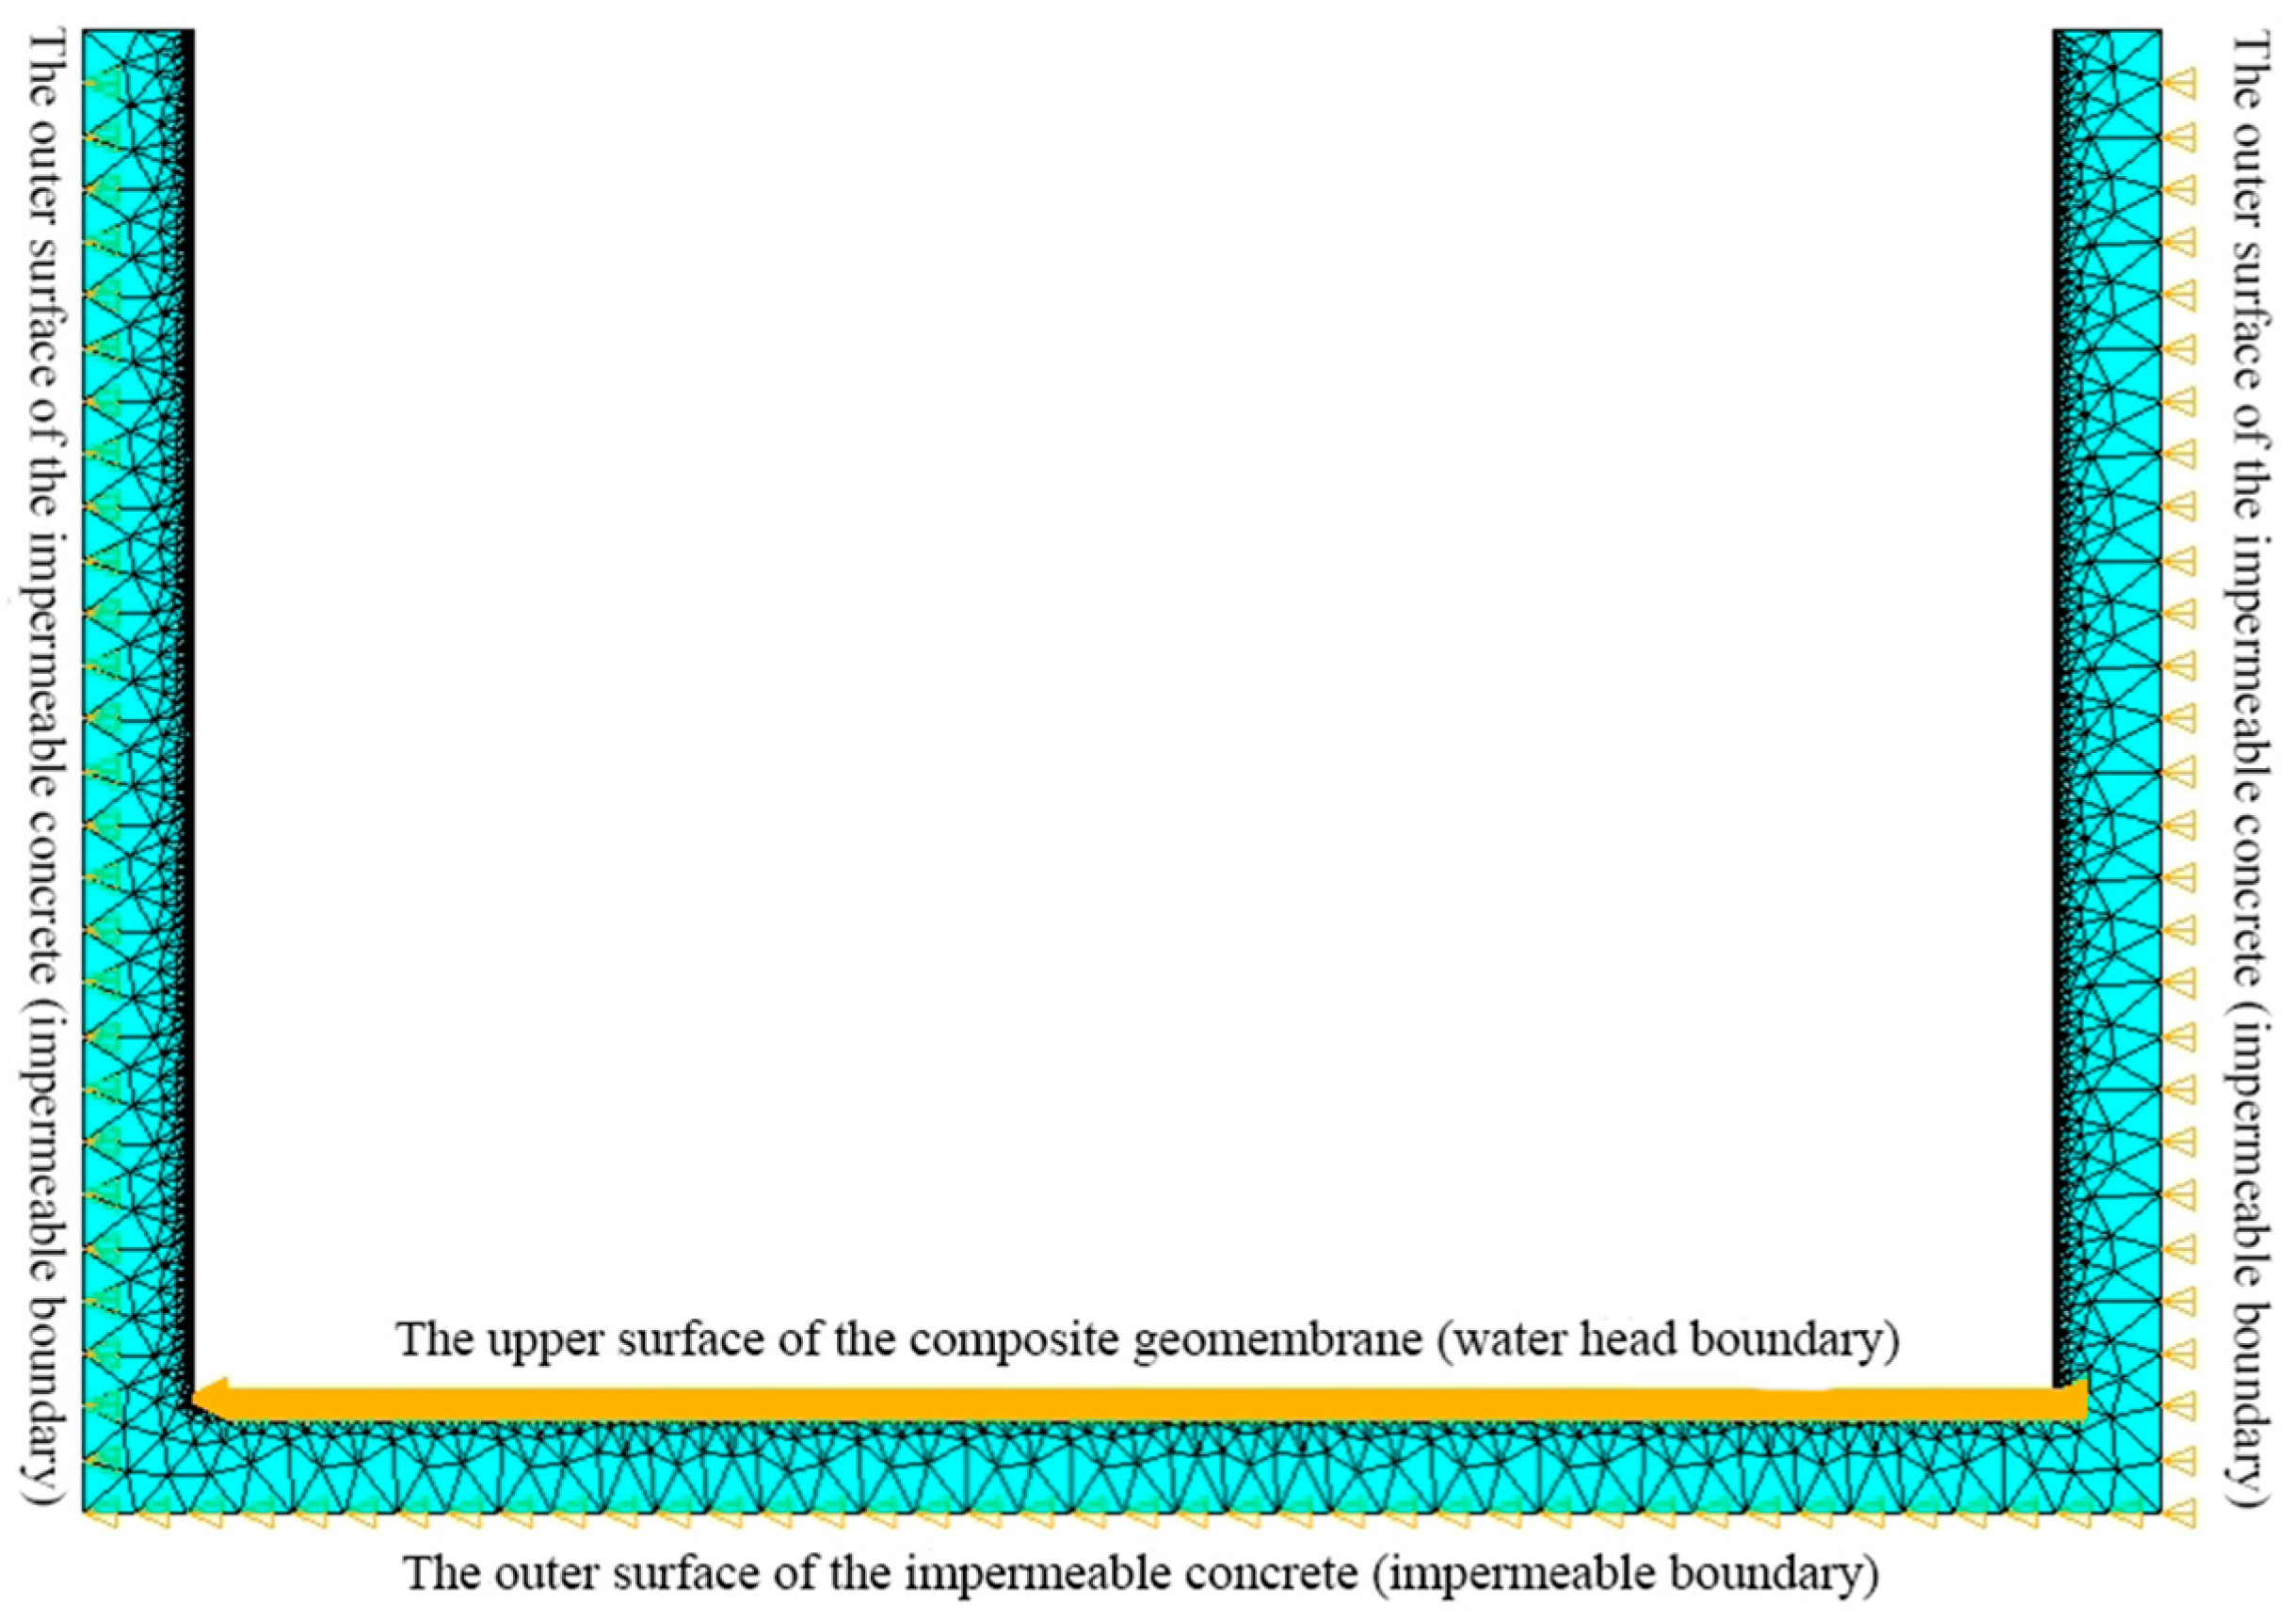
The landfill working layer is designed as an overhead concrete pool structure, and the seepage of hazardous waste leachate occurs within the unit pool. When utilizing the model to calculate the three-dimensional seepage field during the normal operation of a rigid landfill, the boundary conditions are established as follows (see
Figure 3 for details).
- (1)
The upper surface of the composite geomembrane below the water level of the infiltration liquid in the unit pool is set as the first type of boundary condition, that is, the constant head boundary. The leachate primarily originates from the self-degradation of hazardous wastes and external rainfall. In this project, the landfill primarily consists of salts and inorganic substances, resulting in minimal self-degradation leachate production. Additionally, a canopy and side rain barriers will be installed to prevent rainwater intrusion. Drawing upon the engineering experience of existing rigid landfills, the maximum leachate generation is typically estimated at 1% of the unit pond’s landfill scale [
22,
23]. Therefore, this paper adopts this value as a representative working condition for the calculation. Given that the cell pool in this project is cuboidal, the corresponding hydraulic head under this working condition is calculated to be 5 cm.
- (2)
This paper mainly studies the seepage resistance characteristics of the composite geomembrane. Considering the combined effect of the anti-seepage composite geomembrane and high-strength impermeable concrete, it can be assumed that the outer surface of the concrete unit pool is the second type of boundary condition, that is, the impervious boundary.
The permeability coefficient, a finite element calculation parameter that represents the material’s ability to transmit fluid, is determined during the engineering design phase. In this project, the permeability coefficient of the composite geomembrane is 1.0 × 10⁻¹¹ cm/s, while that of the reinforced concrete structure in the cell pool is 3.0 × 10⁻⁸ cm/s.
4.3. Calculation Method for the Equivalent Thickness of Composite Geomembrane
In this paper, the permeability of a composite geomembrane at its actual thickness (i.e., 2 mm) is first calculated. Subsequently, five scenarios are introduced to scale up the thickness by factors of 5, 10, 25, 50, and 100 times, leading to thicknesses of 10 mm, 20 mm, 50 mm, 100 mm, and 200 mm, respectively.
Since the permeability coefficient of composite geomembrane has reached 10
−10 cm/s or lower, it is a common practice in finite element analysis to neglect the reduction in the horizontal seepage coefficient of the composite geomembrane. After thickness equivalence, the composite geomembrane is still treated as an isotropic material for seepage flow [
24,
25,
26], thereby simplifying the simulation calculations and reducing the computational workload. In this study, the composite geomembrane was initially analyzed under the assumption of seepage isotropy. The equivalent permeability coefficient was calculated using Formula (8), and the results are presented in
Table 1. Subsequently, based on the principle of flow equivalence in all directions, the equivalent permeability coefficients
kz in the thickness direction and
kx and
ky in the horizontal direction were determined separately using Formulas (8) and (10). These coefficients were then analyzed when considering the geomembrane as a seepage anisotropic material. The corresponding equivalent permeability coefficients under this condition are summarized in
Table 2.
5. Analysis of Numerical Simulation Results
5.1. Composite Geomembrane Seepage Calculation Results
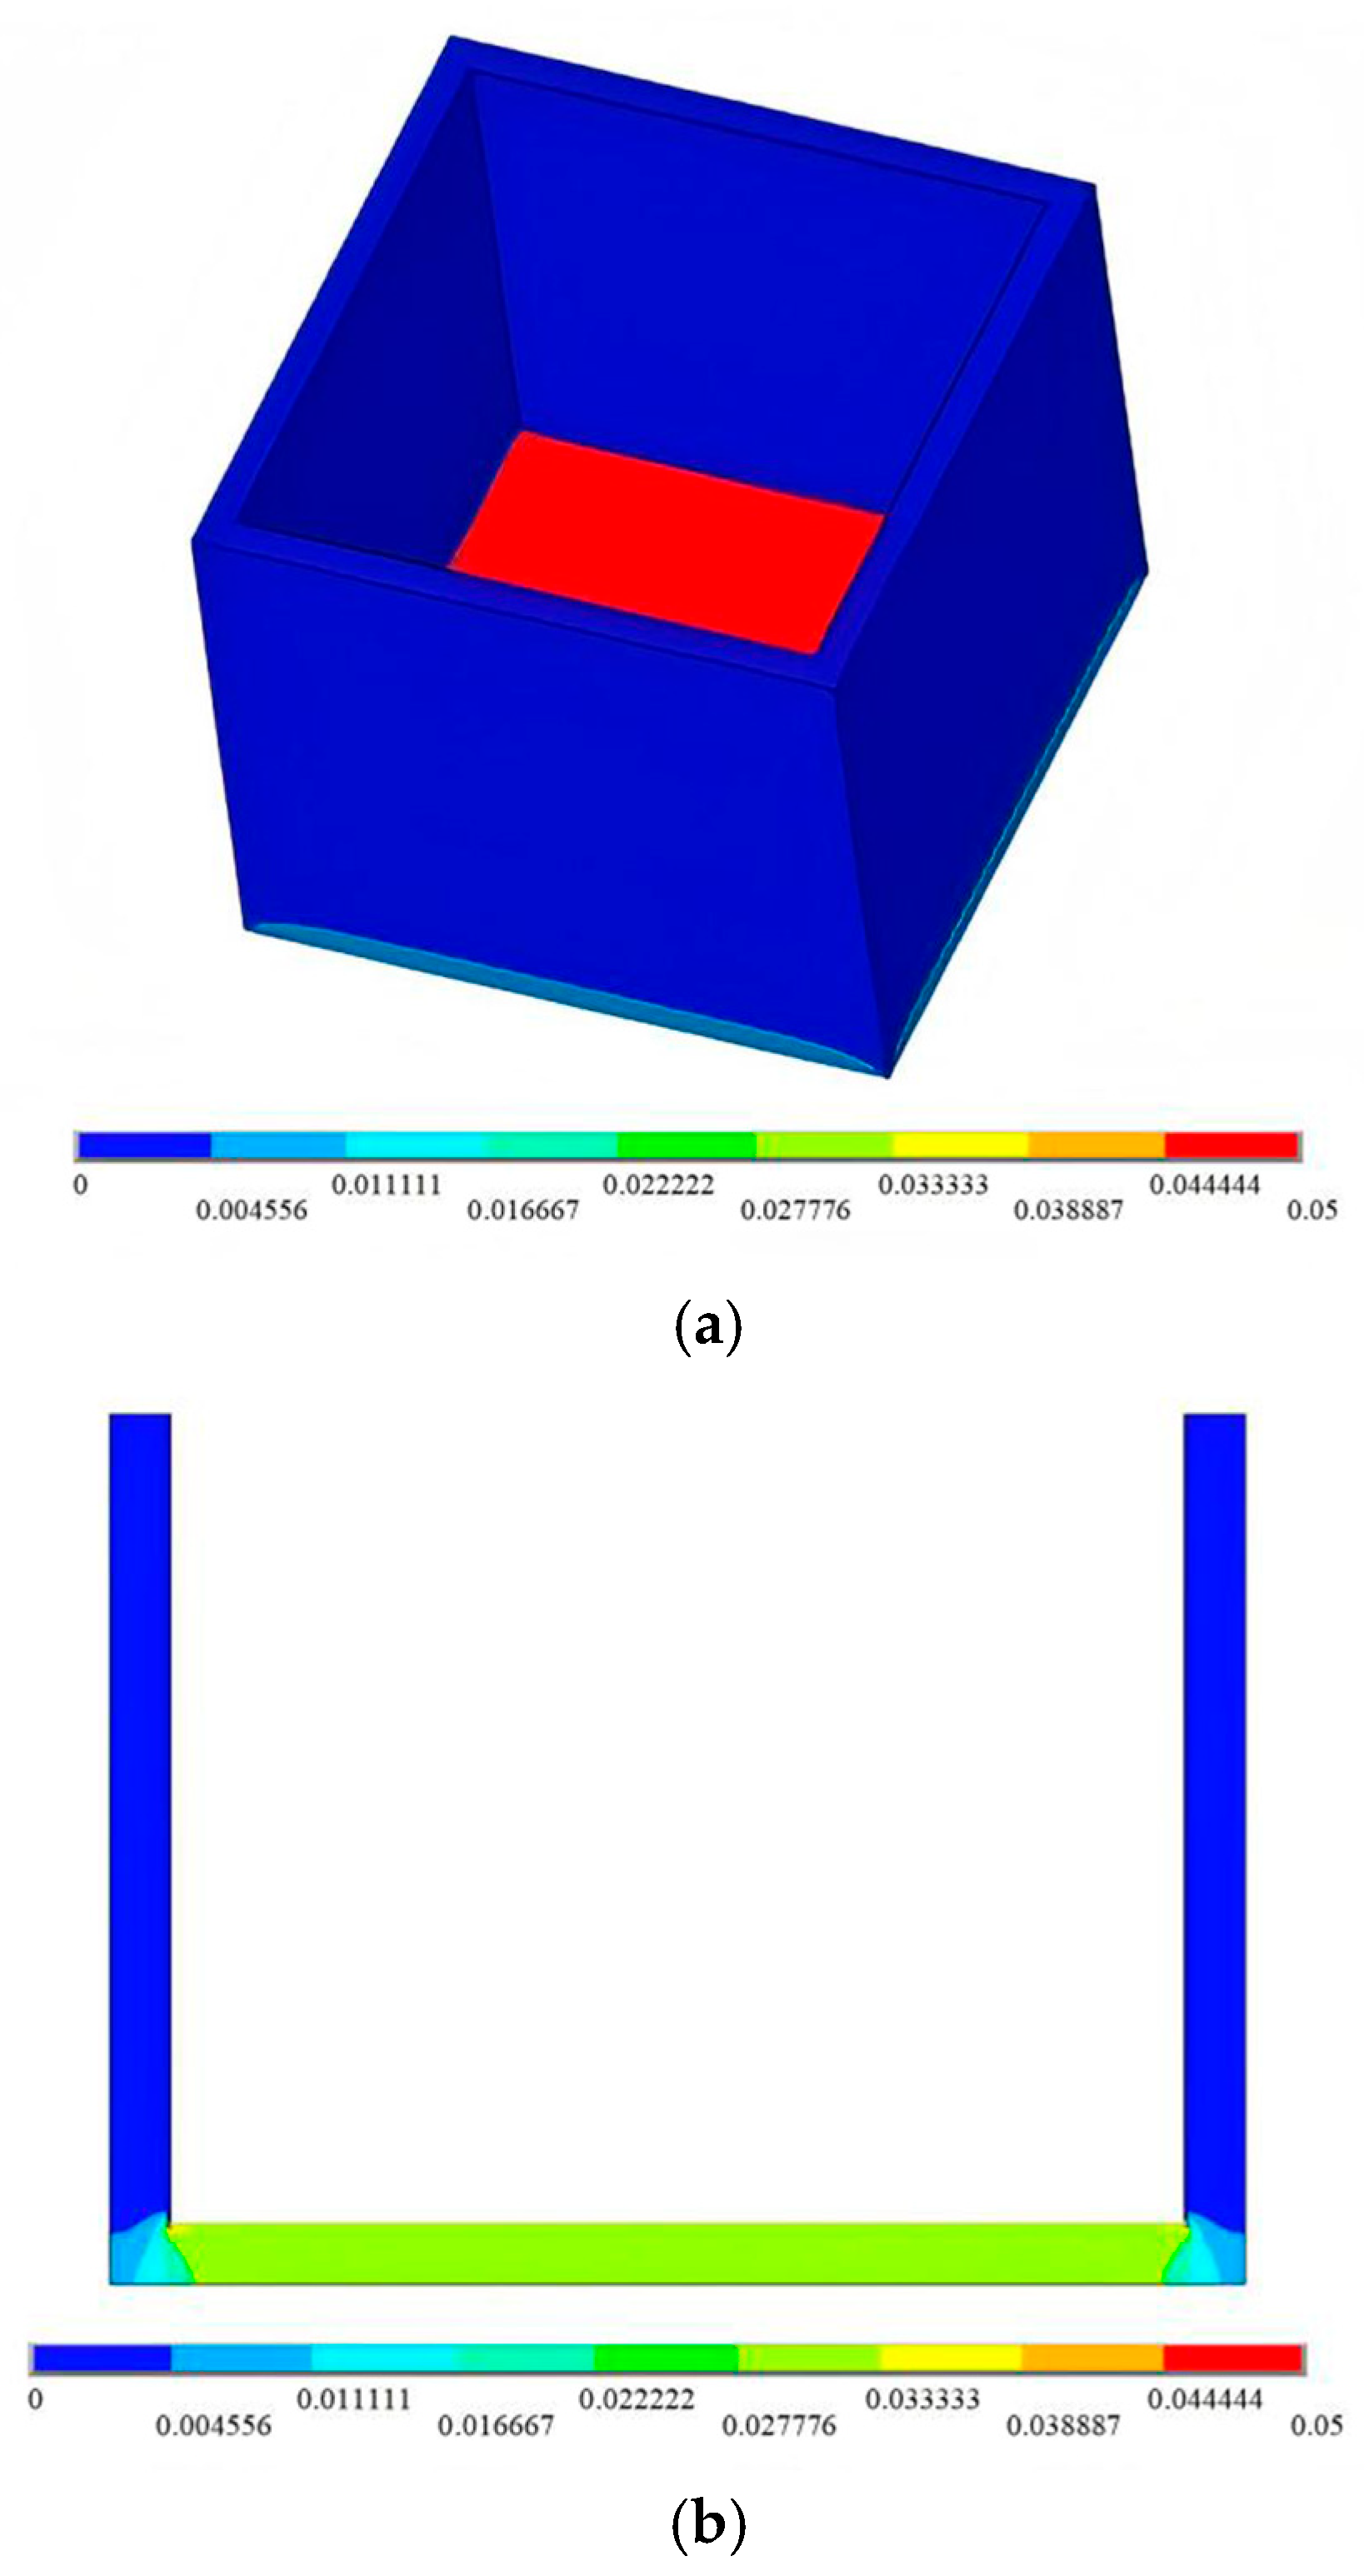
In this section, the actual thickness of the composite geomembrane is determined through calculation, and the distribution and variation of the seepage field under the typical head condition of a rigid landfill are systematically analyzed from three perspectives: seepage head, seepage hydraulic gradient, and seepage velocity. The results indicate that the maximum seepage flow rate of hazardous waste leachate under this condition is 3.92 × 10⁻⁹ m3/s.
Figure 4 presents a comprehensive visualization of the total head contour distribution in the context of composite geomembrane seepage. This cloud map provides valuable insights into the behavior of leachate within the system. From the figure, it is evident that the leachate head distribution across the unit pool maintains a relatively uniform pattern. The process of leachate passing through the composite geomembrane reveals significant hydraulic characteristics. As the leachate traverses the geomembrane, there is a marked and rapid decline in the leachate head. This phenomenon underscores the effectiveness of the composite geomembrane as a barrier material, capable of substantially reducing the hydraulic pressure. Furthermore, the water head value observed on the lower surface of the composite geomembrane is considerably lower than that on the upper surface. This difference highlights the geomembrane’s ability to control and manage the fluid flow, ensuring minimal permeation and maintaining structural integrity.
Figure 5 presents the hydraulic gradient cloud map illustrating the permeability characteristics of the composite geomembrane. As observed from the figure, it is evident that the hydraulic gradient distribution across the composite geomembrane is generally uniform when influenced by the current water head. However, near the edge of the unit pool floor, there is a downward trend in the hydraulic gradient. This phenomenon can likely be attributed to changes in the boundary conditions at the edges of the geomembrane. For instance, as the leachate seeps closer to the boundaries, its path becomes longer due to geometric constraints or variations in the material properties. These extended seepage paths result in altered hydraulic gradients compared to the central regions of the geomembrane. The calculated results further indicate that the maximum hydraulic gradient observed in this study is 2.57.
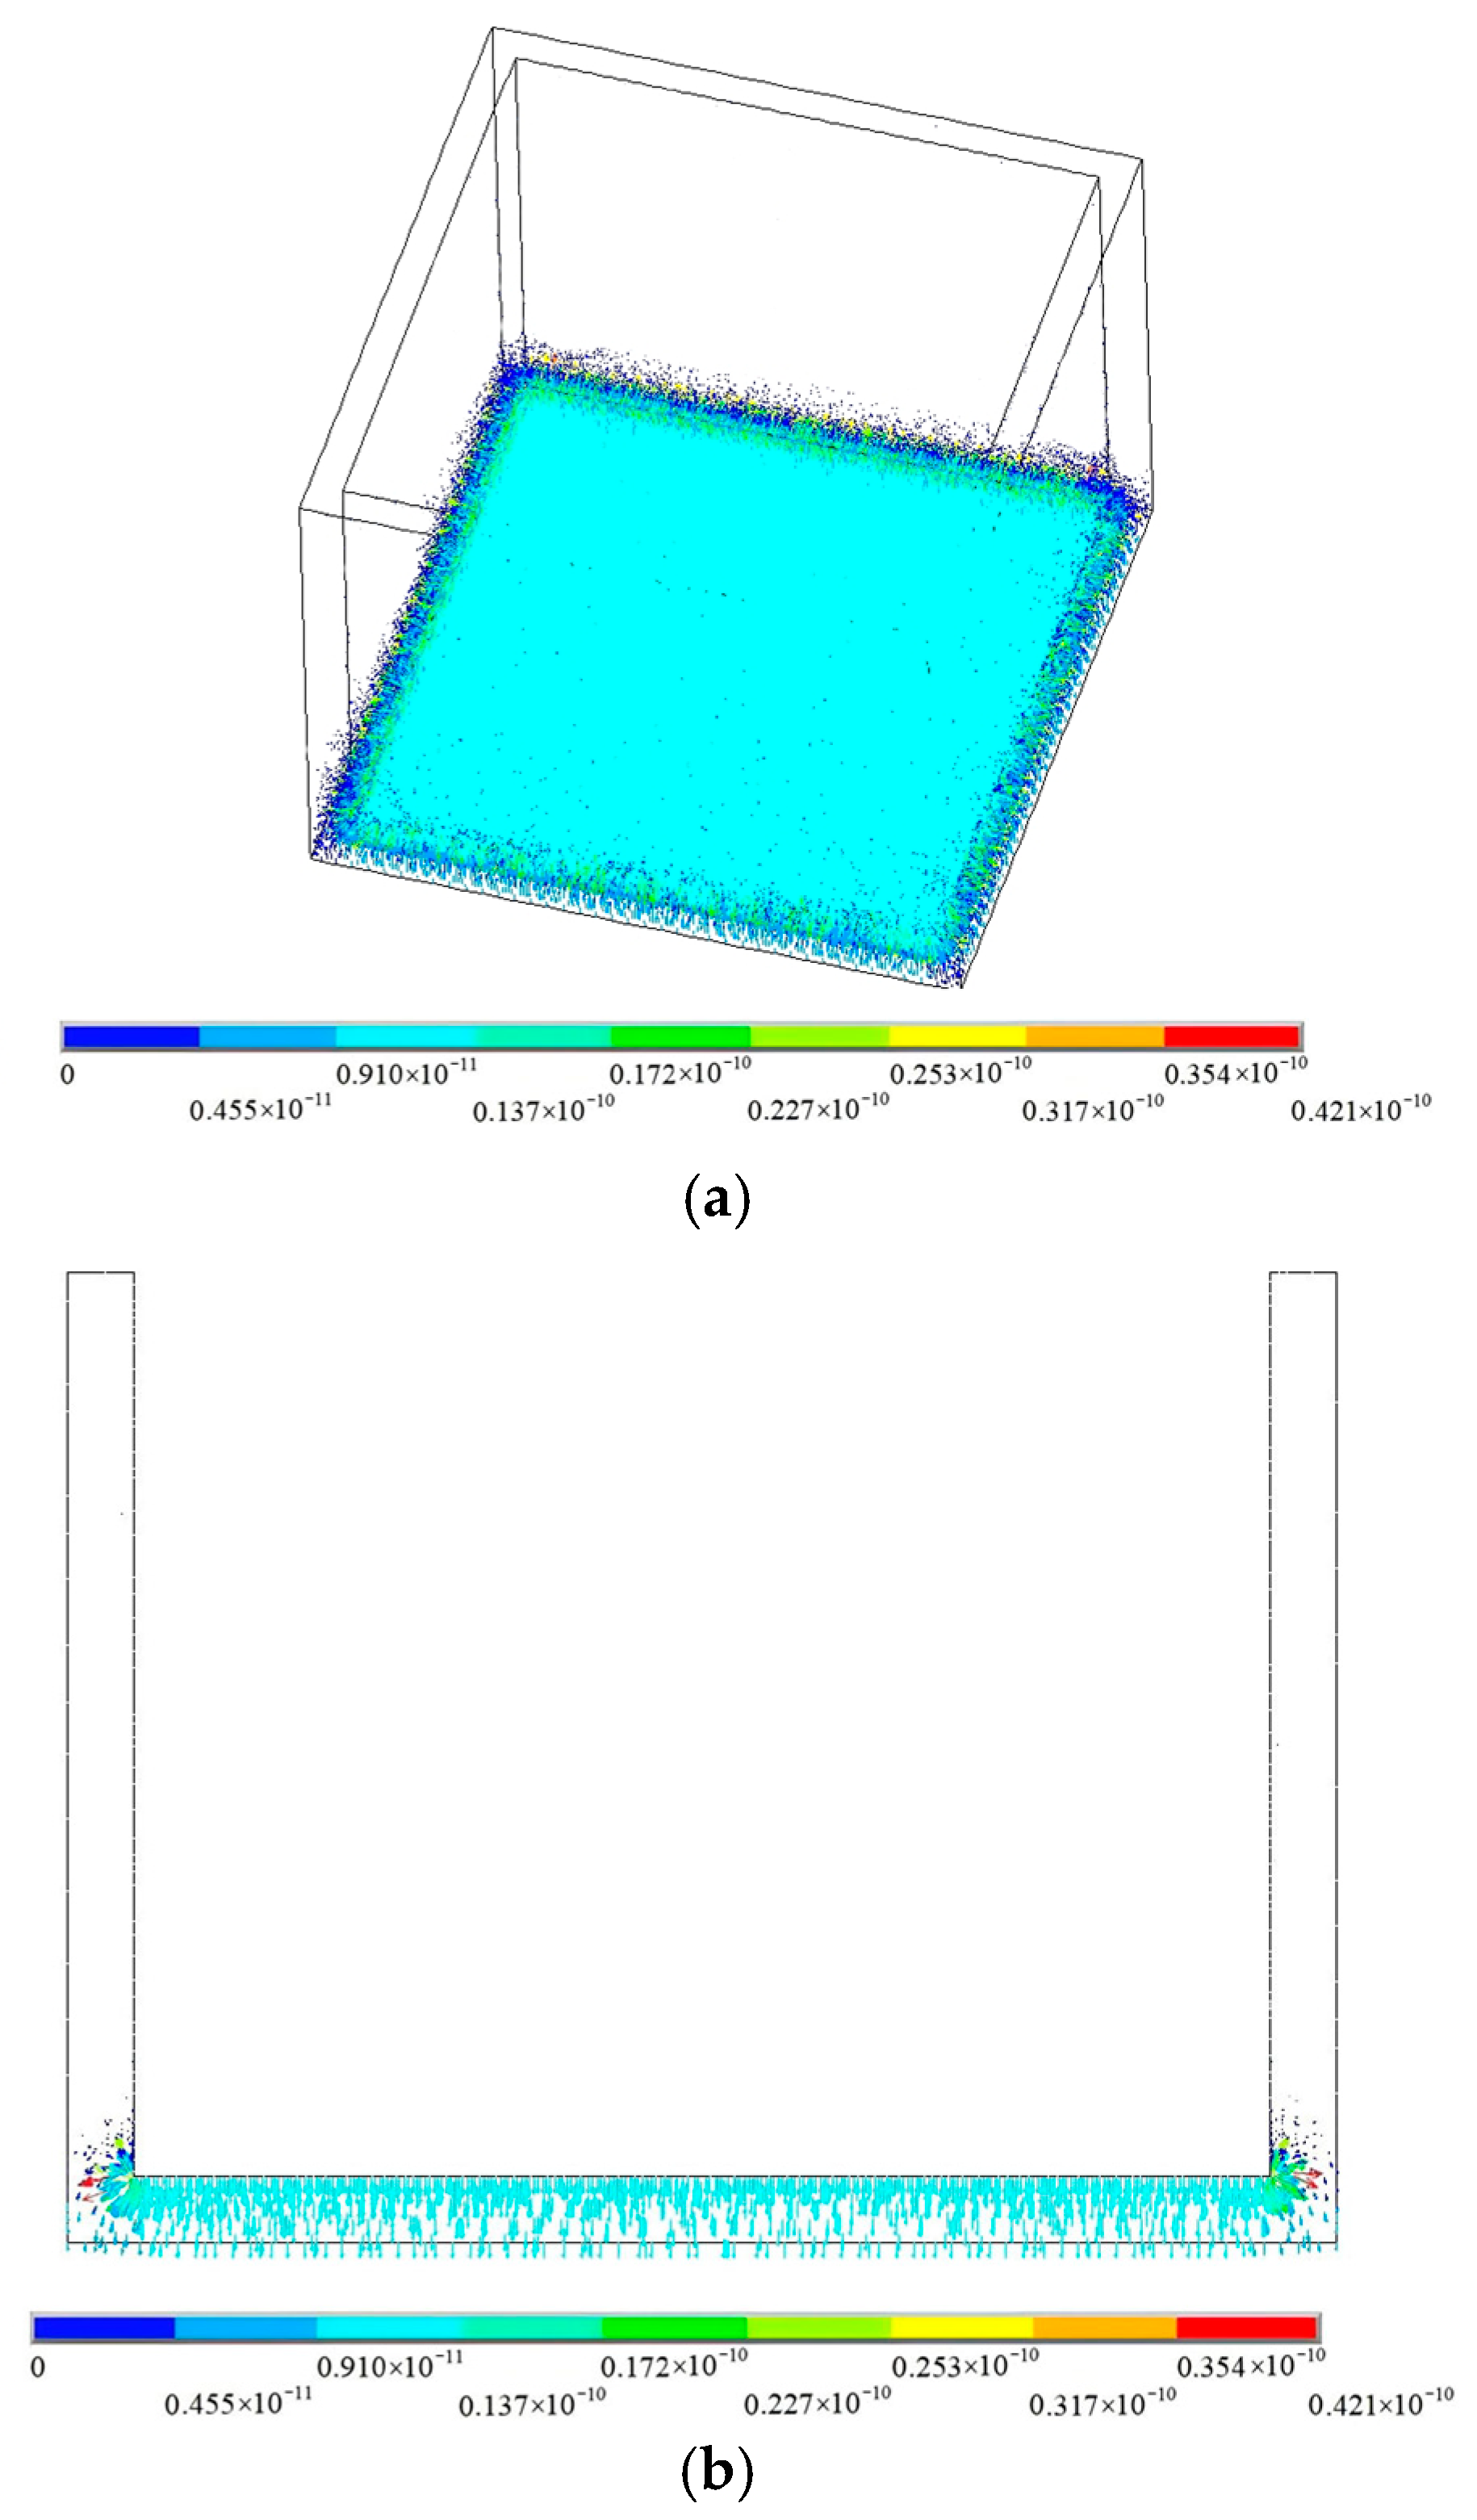
Figure 6 presents the vector diagram of the percolation velocity for hazardous waste leachate. As illustrated in the diagram, the percolation velocity of leachate within the unit pool of a rigid landfill site is notably low, with the distribution of the percolation velocity being relatively uniform across most areas of the composite geomembrane on the bottom plate. During the process of leachate percolation through the composite geomembrane, the fluid encounters substantial resistance. This resistance arises from the physical and chemical properties of the geomembrane materials, such as their density, porosity, and impermeability. As a consequence of this resistance, the percolation velocity is reduced.
According to the results of the finite element analysis, the percolation distribution of the leachate in the cell pool of a rigid landfill conforms to the characteristics of a typical stable percolation field. Under typical engineering hydraulic head conditions, the maximum seepage flow rate of hazardous waste leachate through the composite geomembrane is 3.92 × 10⁻⁹ m3/s, and the maximum seepage velocity is 0.42 × 10⁻¹⁰ m/s. These findings further confirm the excellent anti-seepage performance of the composite geomembrane.
5.2. The Equivalent Calculation of the Composite Geomembrane Is Carried Out Assuming Isotropy
In this section, the composite geomembrane is modeled using the thickness equivalence method, which is widely adopted in current practice. Specifically, after equivalence transformation, the composite geomembrane is treated as an isotropic material for the seepage analysis, with equal permeability coefficients in both the vertical and horizontal directions. Based on the schemes described in
Section 3.3, the thickness and permeability coefficient of the composite geomembrane are scaled simultaneously by the corresponding factors and calculated independently.
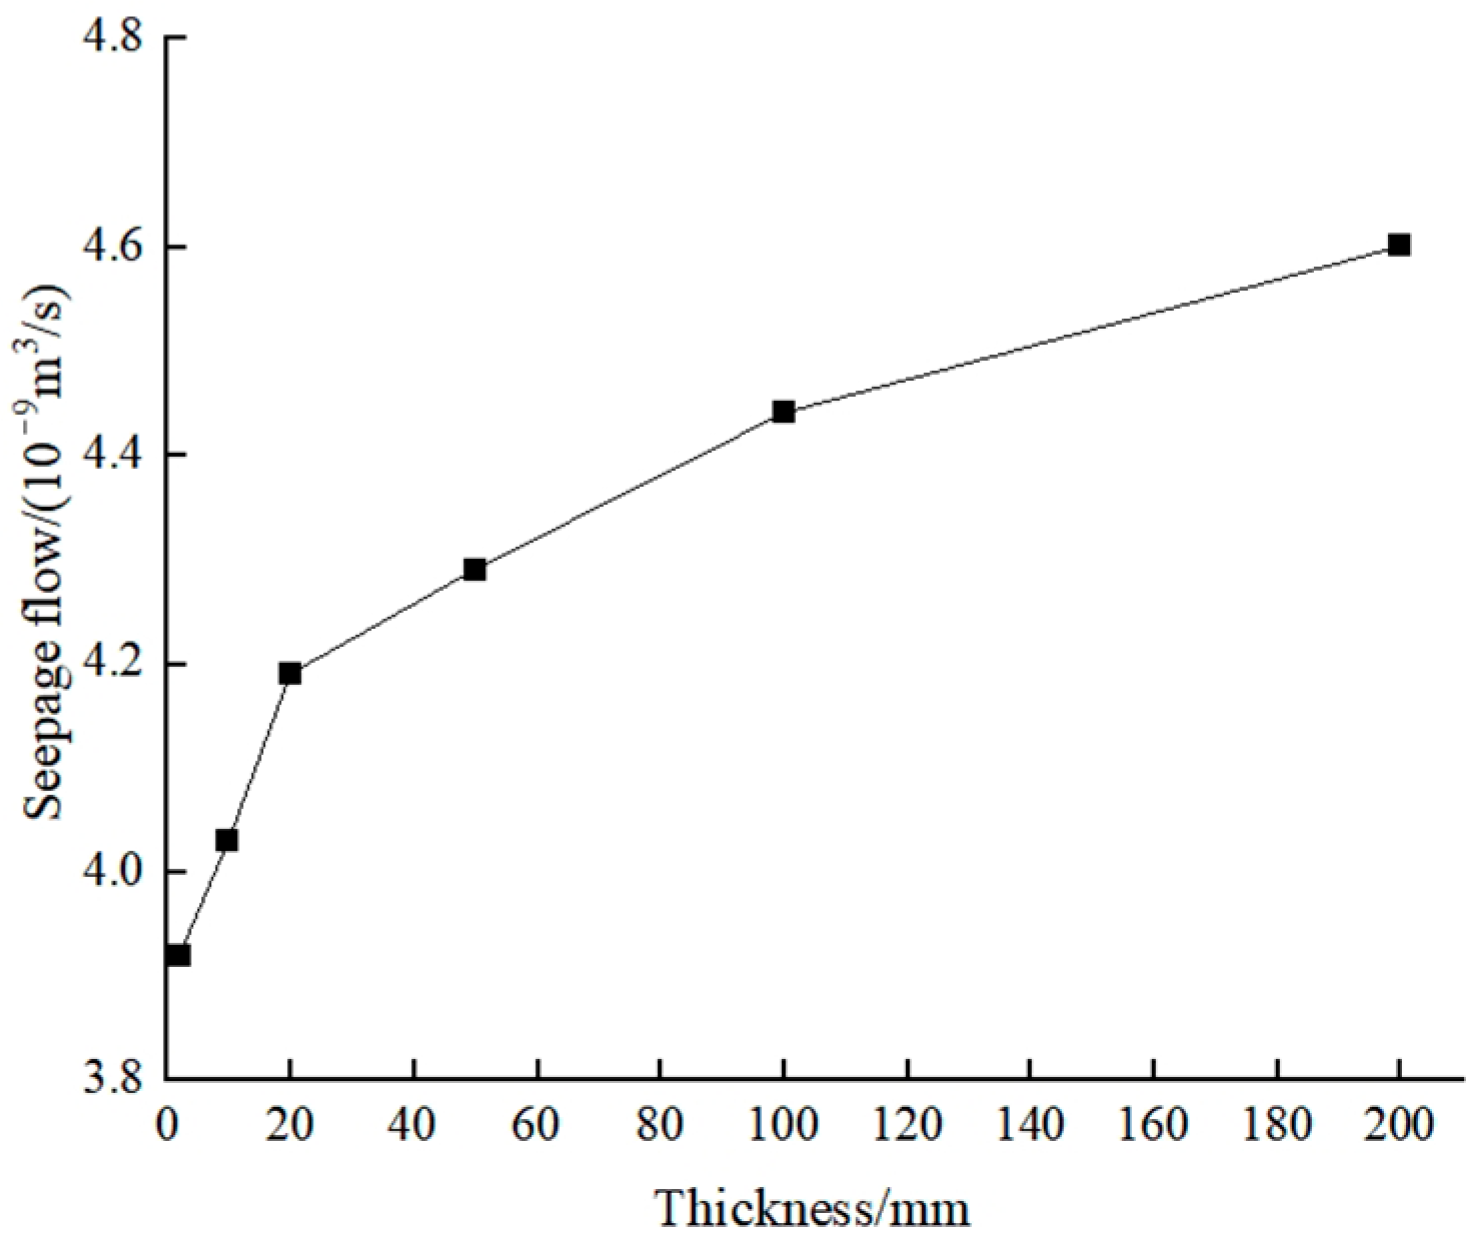
Figure 7 and
Figure 8 present the relationship curves depicting the maximum seepage flow rate and the maximum seepage velocity of hazardous waste leachate as functions of the different equivalent thicknesses of the composite geomembrane.
From the calculation results, it can be observed that when different equivalent methods are applied to determine the composite geomembrane thickness in a cell pool, the distribution of the leachate percolation tends to remain approximately uniform. However, both the seepage flow rate and the seepage velocity increase with the amplification of the composite geomembrane thickness.
To elaborate further, when the thickness of the composite geomembrane is increased fivefold compared to its original dimensions, the maximum seepage rate of the leachate rises by 2.8%, while the maximum seepage velocity increases by 2.6% relative to the values obtained with the actual thickness. It is important to note that this discrepancy between the calculated and actual seepage rates and velocities will progressively escalate as the equivalent thickness continues to expand.
Table 3 presents the relative errors calculated based on the actual thickness for the maximum seepage flow and the maximum seepage velocity under the assumption of isotropy when considering different equivalent thicknesses.
5.3. The Equivalent Calculation of the Composite Geomembrane Is Carried Out Assuming Anisotropy
Based on the principle of flow equivalence, this section calculates the equivalent permeability coefficients in the thickness and horizontal directions using Equations (8) and (10), respectively. The composite geomembrane after equivalence is treated as a seepage anisotropic material, and its properties are evaluated based on the equivalent permeability coefficients listed in
Table 2. The calculated results are then compared with those presented in
Section 5.2.
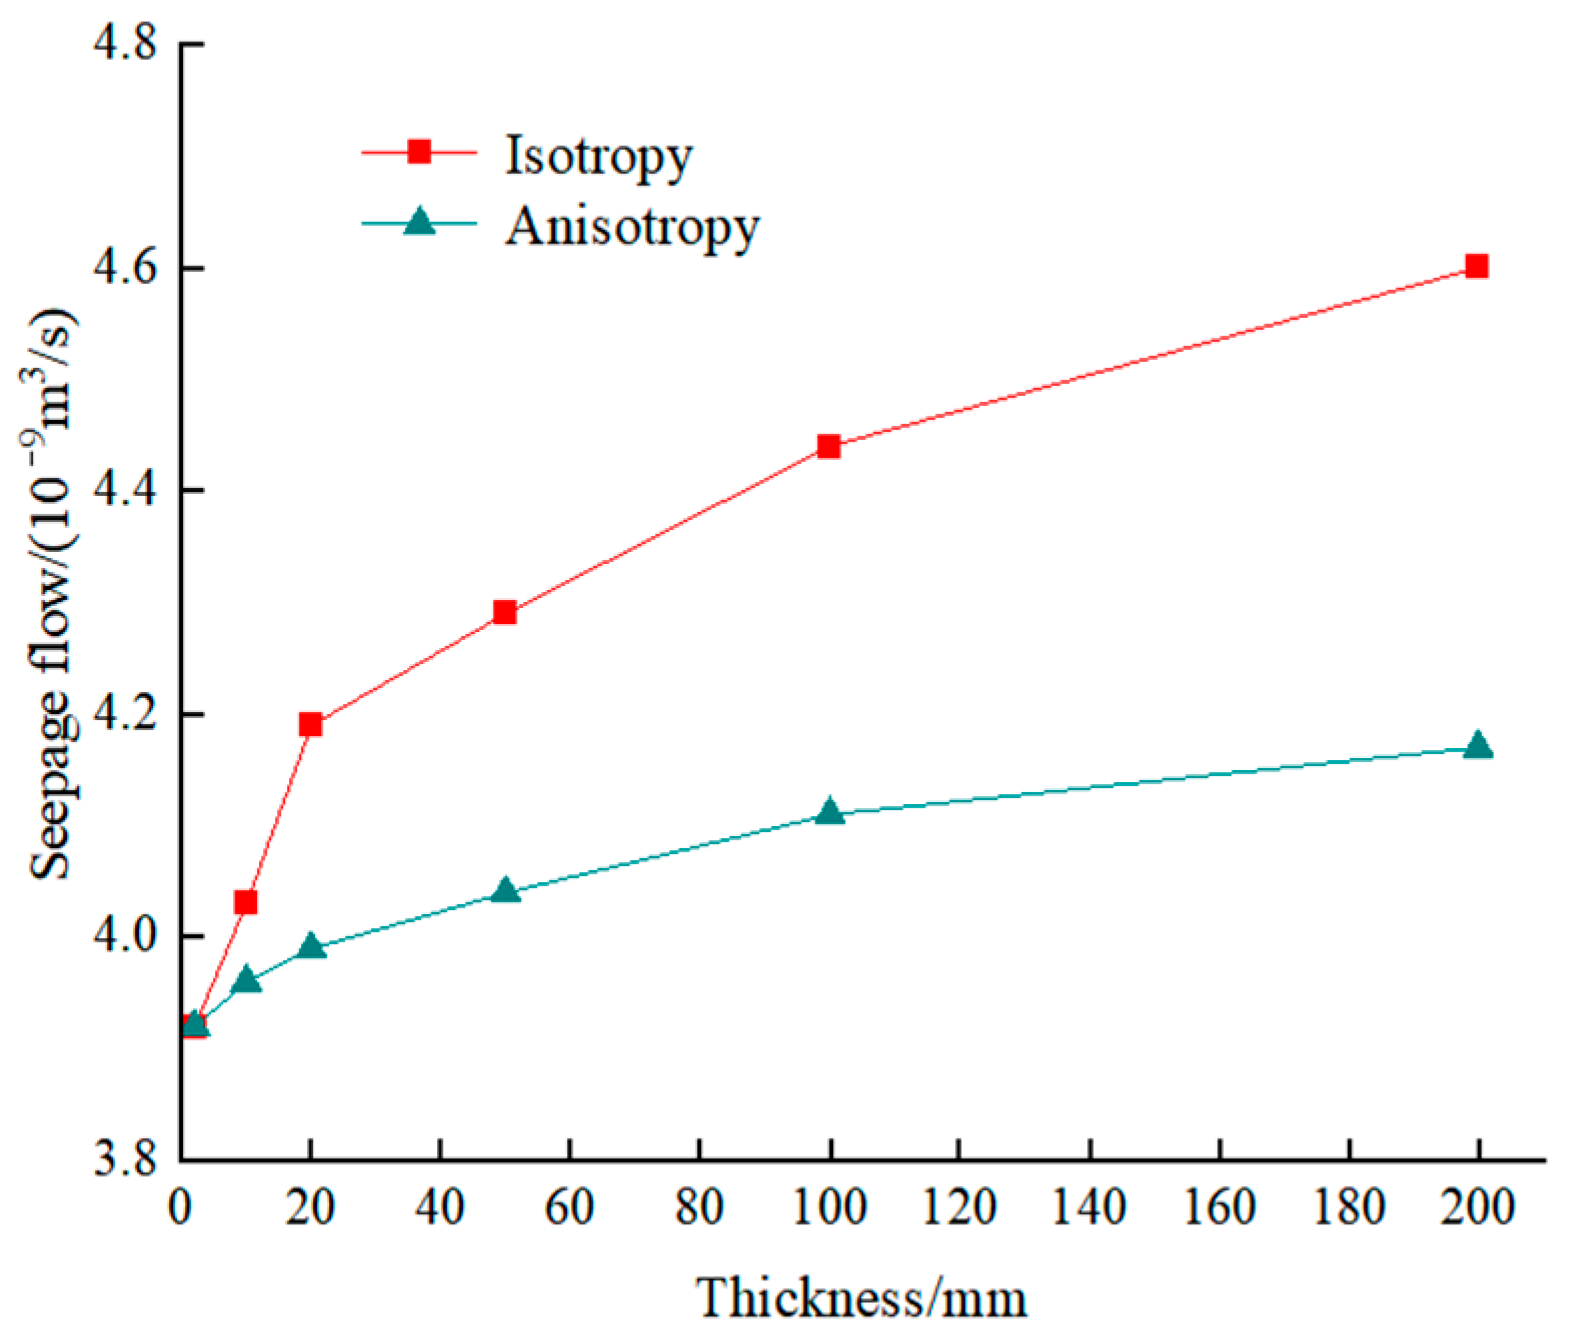
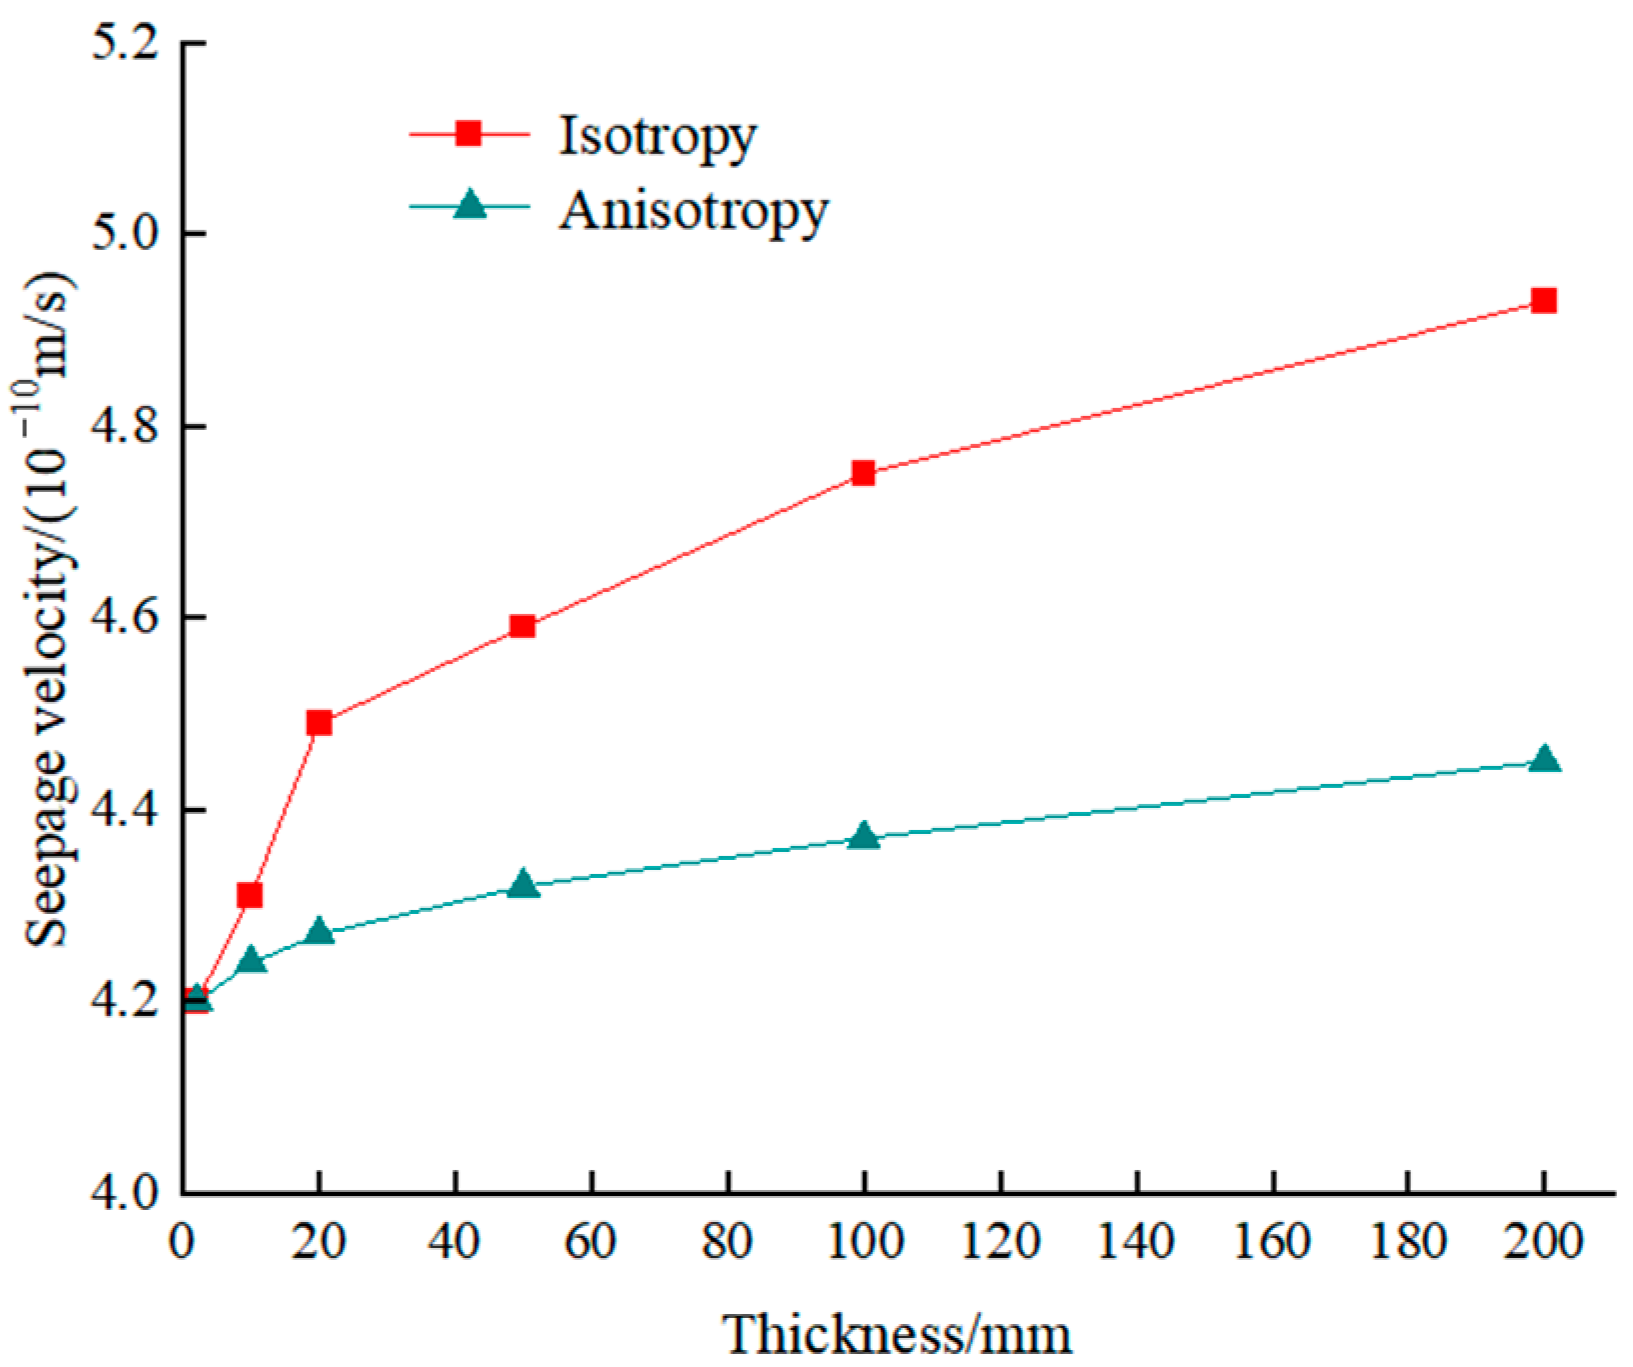
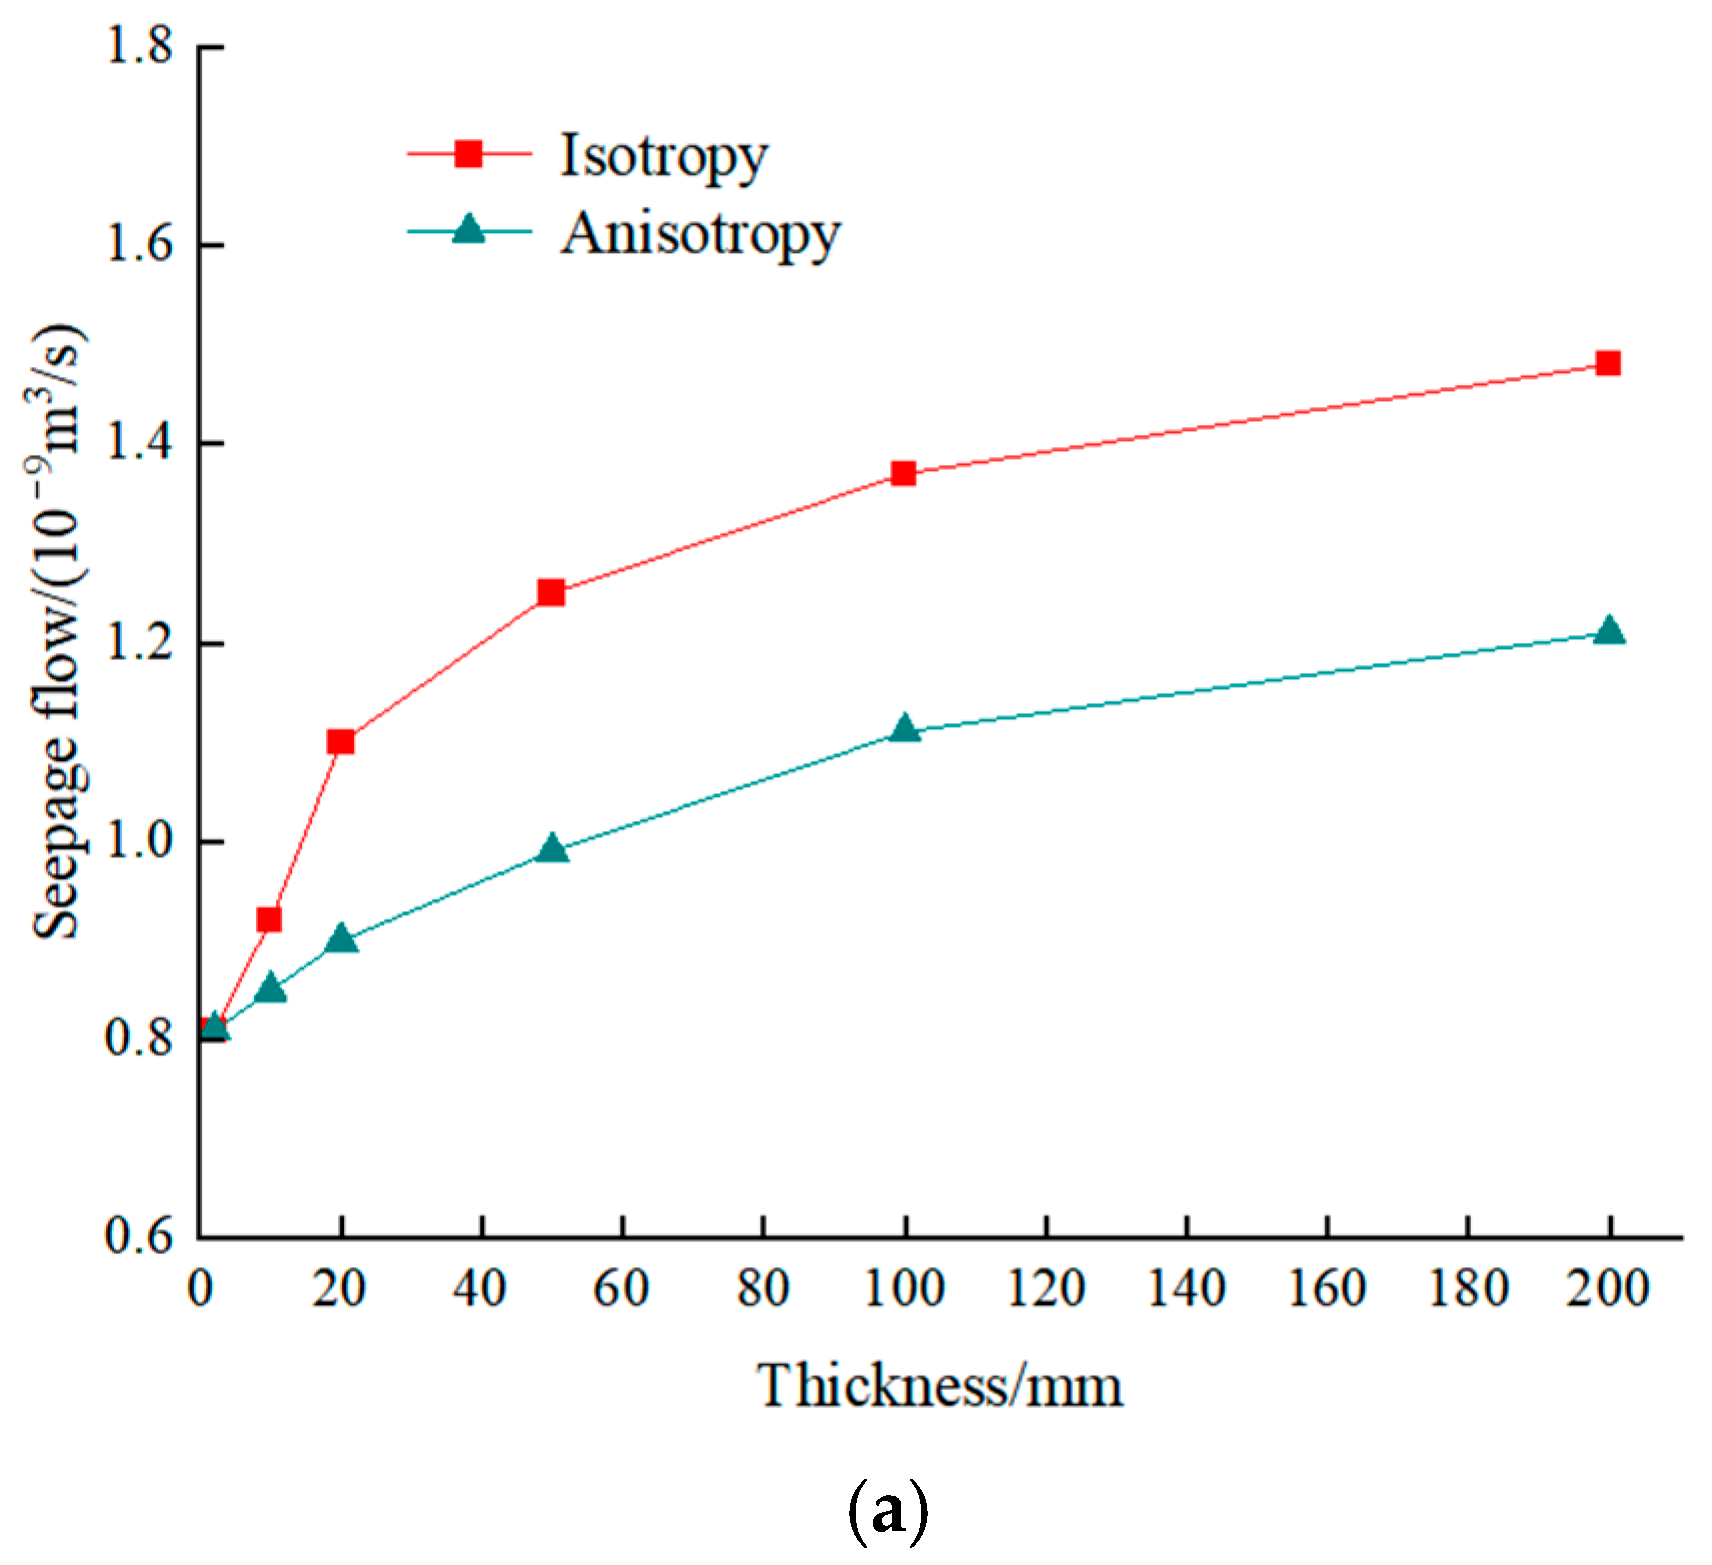
Figure 9 and
Figure 10 illustrate the comparison of the maximum seepage flow and maximum seepage velocity for the composite geomembranes, considering both anisotropic and isotropic conditions.
As shown in the figure, when the composite geomembrane is treated as a permeable anisotropic material, the error after the thickness-equivalent calculation is significantly reduced. When the upper section’s thickness is increased fivefold, the maximum leachate seepage flow rate increases from 2.9% to 1.1%, while the maximum seepage velocity increases from 2.7% to 1.05%. Although the seepage flow rate and velocity of the leachate increase numerically with the increasing thickness magnification of the composite geomembrane, the range of increase is evidently limited.
Table 4 presents the relative errors calculated based on the actual thickness for the maximum seepage flow and the maximum seepage velocity when considering anisotropy with different equivalent thicknesses.
5.4. The Comparative Calculation Under Different Water Head Conditions
To further validate these findings, this study conducts a comparison and analysis by altering the hydraulic head boundary conditions. The water head value considered above is 5 cm. The calculation results for the water head values of 3 cm and 1 cm are presented in
Figure 11 and
Figure 12, respectively. It can be observed from the figures that, under the condition of a modified water head boundary, the maximum seepage flow rate and maximum seepage velocity of the composite geomembrane remain largely consistent with the previously reported calculation results.
It can be observed that when the thickness of a composite geomembrane is calculated equivalently, treating it as an isotropic seepage material reduces the computational workload but may also introduce corresponding errors into the results. The equivalent permeability coefficient is determined in all directions based on the principle of flow equivalence. Calculating it as an anisotropic material can significantly minimize the calculation error since this approach aligns more closely with the principle of flow equivalence. Therefore, in the equivalent thickness calculation for composite geomembranes, this method represents the optimal choice.
6. Discussion and Conclusions
The industrial waste buried in rigid landfills poses significant harm, making it crucial to monitor the seepage prevention performance of composite geomembranes during project operation. Currently, limited research has been conducted on the seepage prevention of composite geomembranes within the context of rigid landfills. Additionally, the thin nature of composite geomembranes often complicates finite element calculations. To address this issue, scholars typically employ the principle of flow equivalence to expand the equivalent thickness of the composite geomembrane. However, systematic evaluations of how this approach affects seepage prevention analysis results remain insufficient. In response, this study establishes a three-dimensional finite element model of a landfill unit pool based on the permeation mechanism of composite geomembranes and the background of rigid landfill engineering. First, the seepage distribution under typical hydraulic head conditions with the actual thickness of the composite geomembrane is calculated. Subsequently, the thickness of the composite geomembrane is amplified to varying degrees according to the principle of flow equivalence. The calculation results of the various equivalent thickness schemes are then compared with those of the actual thickness, revealing the variation patterns of the composite geomembrane permeability and seepage velocity as a function of the thickness magnification. Finally, starting from the equivalent method for composite geomembranes, the reasons for these variation patterns are analyzed in light of both isotropic and anisotropic seepage characteristics. The conclusions drawn in this study are summarized as follows.
- (1)
The actual thickness of the composite geomembrane is utilized for precise modeling calculations. Based on the results of the three-dimensional seepage analysis, when the water head in the pool reached 5 cm, the seepage flow rate and seepage velocity of the leachate through the composite geomembrane are both negligible. In most regions of the base plate of the cell pool, the distribution of the leachate head, osmotic hydraulic gradient, and seepage velocity across the composite geomembrane exhibit relative uniformity. Additionally, the leachate head decreases significantly as it passes through the composite geomembrane. From these calculation results, it can be concluded that the rigid landfill engineering composite geomembrane demonstrates excellent anti-seepage performance.
- (2)
It is feasible to enlarge the thickness of the composite geomembrane according to the principle of equivalent flow when using a composite geomembrane as a seepage control structure in seepage finite element calculation and analysis. For this project, modeling calculations based on the actual thickness of the composite geomembrane require substantial work regarding the mesh division and node coupling. Additionally, for composite geomembrane seepage prevention projects with larger surface areas, modeling based on the actual thickness involves an even greater workload. Using the equivalent treatment for the composite geomembrane thickness cannot only effectively address the difficulty in mesh division caused by the thinness of the geomembrane but also clearly illustrate the seepage distribution law within the membrane.
- (3)
The seepage calculation of the composite geomembrane thickness after the equivalent treatment will have a certain calculation error. The seepage flow and seepage velocity will increase with the increase in the magnification ratio of the composite geomembrane thickness, that is, the discrepancy from the actual situation will increase. This error can be significantly reduced if the material is treated as a permeable anisotropic material during the equivalent process. Therefore, in actual equivalent calculations, when the permeability coefficient of the composite geomembrane is increased in the thickness direction, it should not be overlooked that the permeability coefficient decreases in the horizontal direction perpendicular to the thickness.
In the finite element seepage analysis of the composite geomembrane in the rigid landfill unit cell conducted in this paper, the condition of the geomembrane being intact and undamaged was considered. However, in actual engineering projects, the composite geomembrane may develop defects due to factors such as the effects of hazardous waste. Therefore, further research on the seepage behavior of defective composite geomembranes within unit cells could be conducted in the future.


