Abstract
Wind turbine performance in cold regions is affected by icing which can lead to power reduction due to the aerodynamic degradation of the turbine blade. The development of airfoil shapes applied as blade sections contributes to improving the aerodynamic performance under a wide range of weather conditions. The present study considers inverse design coupled with numerical modelling to simulate the effects of varying airfoil thickness and maximum camber. The inverse design process was implemented in MATLAB R2023a, whereas the numerical models were constructed using ANSYS Fluent and FENSAP ICE 2023 R1. The inverse design process applied the modified Garabedian–McFadden (MGM) iterative technique. Shear velocities were calculated from the flow over an airfoil with slip conditions, and then this velocity distribution was modified according to the prevailing icing conditions to obtain the target velocities. A parameter was proposed to consider the airfoil thickness as well when calculating the target velocities. The airfoil generated was then exposed to various atmospheric conditions to check the improvement in the aerodynamic performance. The ice mass and lift-to-drag ratio were determined considering cloud characteristics under varying liquid water content (LWC) from mild to severe (0.1 g/m3 to 1 g/m3), median volume diameter (MVD) of 50 µm, and two ambient temperatures (−4 °C and −20 °C) that characterize freezing drizzle and in-cloud icing conditions. The ice mass on the blade section was not significantly impacted by modifying the shape after applying the process developed (i.e., <5%). However, the lift-to-drag ratio that describes the aerodynamic performance may even be doubled in the icing scenarios considered.
1. Introduction
Wind energy adoption has increased in the recent past, driven by the need to reduce carbon emissions and dependence on fossil fuels. It is estimated that by 2050, wind energy contribution will be between 25% and 35% according to IRENA and IEA [1]. Many of the wind farms are found in cold regions with wind turbines being designed conventionally to focus on high wind speed sites. The icing of wind turbines is estimated to result in an annual estimated power (AEP) loss of approximately 20–50% [2,3], because flow disturbance from the altered airfoil shape increases the drag and reduces the lift [4,5,6].
Airfoil design plays an important role in wind turbines operating under adverse weather conditions. Several studies have been conducted on the effects of the maximum camber and its position on aerodynamic performance, but without focusing on the impact of ice accretion. Shao et al., 2021 [7] ranged the maximum camber position from 0.05 c to 0.3 c (where c denotes chord length) on the flapping wing rotor (FWR) of a micro aerial vehicle. On the basis of these findings, lift was strongly influenced by the maximum camber position, which increased greatly toward the midpoint. Zhang et al., 2020 [8] studied the effect of maximum camber on NACA0021 with a modified NACA0021S airfoil on an H-type vertical axis wind turbine (VAWT). The modification slightly increased the energy utilization owing to the relative airfoil maximum camber because the augmentation led to positive and negative pressure regions. Virk, 2017 [9] studied the effects of maximum camber on the aerodynamic performance of adaptive wing micro air vehicles and airfoils. An increased maximum camber improves performance but causes greater drag at higher angles of attack. More studies are needed to develop advanced models and real-time adaptive mechanisms for optimizing maximum camber without compromising their stability. Wang et al., 2022 [10] studied the effects of maximum camber on aerodynamic performance via NACA0012, NACA4412, NACA2412, and NACA5412 at 10 m/s and angle of attack from ° to 1°. These findings indicate that when the maximum camber position is increased, the pressure difference between the pressure and suction sides becomes greater, thus increasing the lift coefficient.
Maximum camber morphing on an airfoil optimizes the aerodynamic performance of the airfoil by altering the maximum camber position [11,12]. Majid & Jo, 2021 [13] validated the aerodynamic benefits of variable-maximum camber-rate morphing wings through numerical analysis. They reported that these wings significantly enhance the lift-to-drag ratio compared with traditional fixed-wing designs. This study calls for experimental validation through wind tunnel tests and flight experiments to confirm these findings and explore the practical applications of morphing wing technology. Abdelmoula & Rauleder, 2019 [14] investigated the effects of a morphed airfoil on NACA23012 with Mach number ranging from 0.2 to 0.7 and angles of attack ranging from −10° to 18°. The findings show that there was an improvement of up to 120% in the lift-to-drag ratio of the morphed airfoils from the baseline airfoils. Seifi Davari et al., 2024 [15] compared the performance of the optimized S1048, S3021, and S5010 airfoils, which affected the maximum camber position under different Reynolds numbers between 50,000 and 500,000. The results show that the modified airfoils had improved aerodynamic performance under different Reynolds numbers.
The airfoil perfection process has been a challenge for designers, which was surmounted by using conventional (direct) and inverse design methods. Direct methods involve changing geometric shapes depending on target conditions, such as drag reduction and increased lift. Inverse design procedures have been used in determining the airfoil shapes that would satisfy the target pressure distribution. The first inverse design studies were found to be time consuming due to mathematical formulations and the ‘trial and error’ approach. Thus, iterative inverse design procedures have been in constant development. Garabedian & McFadden (1982) [16] developed an iterative procedure applied to flexible membrane that deformed under aerodynamic loads, using ordinary differential equations (ODE) to perform computations faster. This method was then improved into the modified Garabedian–McFadden (MGM) iterative technique which considered the velocity and pressure distributions as the target [17]. The MGM was then incorporated into computational fluid dynamics (CFD) [18] that involved the 2D multi-grid Navier–Stokes method, which resulted in an algorithm for the residual. This enabled the inverse design of airfoils using surface pressure distributions, which would closely match original configurations. The method has been further developed using the analytical Fourier series solution, which is able to accommodate subsonic and transonic flows by enabling target pressure and actual pressure distributions [19]. In the recent past, inverse design processes have become popular in the modification of maximum camber for improving aerodynamic performance and reducing the aerodynamic effects of ice accretion [20]. Based on these findings, this study considered the MGM iterative technique due to its accuracy in airfoil design through the target pressure or velocity distributions with an iterative residual correction adjusted to meet the target accurately.
Volpe et al. [21] carried out an inverse design study using single-point and multi-point optimizations on a DLR-F6 WB airfoil by considering the pressure coefficient distribution and the target pressure over the airfoil surface. Based on their findings, the present study considers the convergence index of up to 1 × 10⁻⁶, aimed at improving the accuracy in matching the target velocity, which would help in obtaining an accurate airfoil shape with the condition to reduce the ice accretion during extreme weather conditions. Kollár et al. (2016) [22] used the pressure distribution in the inverse design process applied to find the blade shape of vertical axis wind turbines (VAWTs) and established a close correspondence to efficient turbine operations. Nili-Ahmadabadi et al., 2016 [23] used the ball–spine inverse design shape modification algorithm on a bare FX63 137 airfoil via ANSYS CFX to determine the pressure distribution, which was then validated via NACA0012. Compared with that of the initial airfoil, the lift-to-drag ratio (CL/CD) increased by 3.8%, with the lift coefficient (CL) increasing by 5%. Kollar and Mishra (2019) [24] applied an inverse design process using the MGM method. They varied the maximum camber of the airfoils and studied their aerodynamic performance under adverse weather conditions. The derivation of airfoil shape considered the operation under icing conditions and the power coefficient as described in [25]. A correction factor was then introduced into the inverse design process which adjusted the blade shape aimed at improving the aerodynamic performance under extreme weather conditions. Although the study considered the 2D blade section, the simulations could capture complex 3D effects on the wind turbine as seen in [21].
The present study introduces key innovations aimed at responding to the wind energy challenges produced from icing. Several studies have been focused on the optimization of camber and pressure distribution to improve aerodynamic performance, but there are few which have integrated icing conditions into the inverse design methodology. This study improves previous ones through the introduction of a modified correction factor (discussed in Section 3 and Section 4), which not only accounts for the power coefficient and number of icing days, as discussed in [24], but also incorporates the influence of blade thickness. The coupling of an inverse design methodology with CFD using ANSYS Fluent and FENSAP ICE in obtaining the flow distribution, and for performance analysis of bare and iced blades, offers a more accurate and practical approach which can improve the performance through designing resilient wind turbine blade sections for cold climates. This approach serves as a bridge between predictive aerodynamic design and icing mitigation studies, making a novel contribution for future studies and practical applications.
This study builds on the development of [24] in applying the inverse design process with a correction factor but improving that approach is as follows. The inverse design process considers not only the performance degradation under icing conditions and the number of icing days, but the airfoil thickness as well via a modified correction factor. It will be shown that this approach results in improved aerodynamic performance under icing conditions. A further development in the modelling of icing is that the blade model includes the 2D section, but it is extruded along its spanwise length with a constant cross section. The ice accretion is modelled numerically as a time-dependent phenomenon. Finally, the improved aerodynamic performance is demonstrated under various combinations of ambient parameters, which characterize different icing conditions.
2. Numerical Approach
Flow around airfoil sections was simulated using ANSYS Fluent, which provided the velocity distributions around the airfoils. The icing of the airfoil was modelled by FENSAP-ICE. This section describes the numerical models, the physical background, and the velocity distributions.
2.1. Setup of Numerical Model
2.1.1. Geometry
The cross section of the wind turbine blade was modelled by NACA 4-digit airfoils. Their geometry was determined by the camber, the position of maximum camber, and thickness [26]. The upper and lower profiles were defined by 200 coordinates with a chord length of 1 m. The coordinates were then imported into ANSYS Fluent where the reference point (x,y) = (0,0) was positioned to the leading edge so that the x-axis passed the trailing edge as well, and the spanwise direction determined the z-axis. The rectangular computational domain around the airfoil was used with 5 and 14 chord length distances upstream and downstream, respectively, as described in [27]. The dimension behind the trailing edge was chosen as explained in Section 2.2. The 3D model with a constant cross section was constructed after extrusion of the airfoil section to obtain a 1 m spanwise length from the face. The Boolean subtract function was used to define the fluid domain by removing the solid geometry from the surrounding computational domain.
2.1.2. Meshing
In order to achieve high resolution, triangular structured grid mesh was employed, which provided flexibility in refining critical areas such as the leading and trailing edges. The triangular mesh growth was set to 1.05% from the boundary layer and 1.08% from the airfoil surface to the 45th layer. The meshing in the boundary layer around the airfoil used 1000 divisions to capture the flow accurately. The inlet was set to replicate freestream conditions and was specified with steady velocity, pressure, and temperature profiles. The outlet was determined by pressure, which allowed flow to exit the domain without reflection or backflow. The solid walls represented the boundaries in which the flow occurred, and the wall (airfoil) with no slip conditions was used to accurately capture the interaction between the airflow and airfoil surface, which is crucial to predict boundary layer separation and ice accretion (Figure 1).
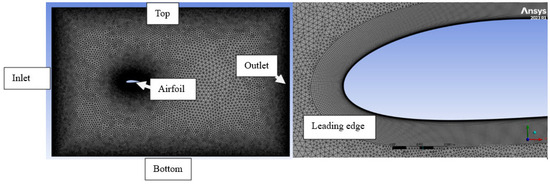
Figure 1.
Boundary conditions and mesh for NACA4418 airfoil.
2.1.3. Setup of Computation
A second-order explicit scheme and the viscous SST model were used to capture the effects of turbulence and ice formation accurately. The velocity specification method was set to magnitude and direction with the reference frame being absolute. The turbulence intensity and turbulence intensity ratio were set to 5% and 10, respectively. In the solutions method, a pressure-velocity coupling scheme was considered with the spatial discretization having a least squares cell-based gradient. The simulation convergence was set to 1 × 10⁻⁶, and the computation was terminated when the maximum error became acceptable, or the iterations reached the maximum value. The hybrid initialization solution method was considered; the run was then set to 1000 iterations with a reporting interval of 10.
The boundary layer near the airfoil was calculated from y+ < 1, which helped in the prediction of the transition from laminar to turbulent flow.
The first layer thickness was considered metres, and the thickness after 45 layers was m, according to . Razzak et al., 2022 [28]; Stroh et al., 2016 [29]; Takahashi et al., 2019 [30] reported that a thin boundary layer was more efficient than a thick boundary layer because skin friction drag enhances performance. According to a study performed by [31], laminar flow is more susceptible to separation under adverse pressure gradients, leading to aerodynamic penalties.
2.2. Mesh Independence Study
The mesh independence study was carried out on NACA4412 airfoil with a freestream velocity of 20 m/s and ambient temperature of 15 °C. The length of computational domain behind the trailing edge varied between 8 and 15 chord lengths and the lift-to-drag ratio was calculated in each case. The number of elements was assessed depending on the refinement levels with 35, 100, 400, and 1000 divisions along the edges of the computational domain. When the domain behind the trailing edge was varied between 8 and 12 chord lengths, the lift-to-drag ratio varied from 0.11% to 0.47% for different numbers of divisions. When this domain increased from 13 to 14 chord lengths, the variation was smaller, i.e., in the range of 0.009% (400 divisions) and 0.055% (100 divisions), and thus, the 14-chord length was found ideal to be used in the study. The mesh independence was also examined in the authors’ previous studies [32,33].
2.3. Grid Convergence Index (GCI)
The lift-to-drag ratio was used in this study to obtain GCI values via the Richardson extrapolation method described in [34,35]. The refinement ratio ( was then calculated, as given by Equation (2), using the number of divisions on the edges, i.e., 35, 100, 400, and 1000,
where and are the grid spacings from the number of divisions on the edges for the courser and finer meshes, respectively, as described in [35] (Table 1). The grid-refinement rates and changes in solution values were used to calculate the observed order of accuracy. The accuracy was computed via
where is the relative difference between medium and coarse grid solutions, and denotes the difference between solutions for fine and medium grids. These relative differences are calculated as follows:
where means the computed with different grids. The error estimates were calculated and reported, along with the apparent order , which was found to be 0.34205 from Equation (3).

Table 1.
Grid convergence index parameters with divisions 35 (i = 1), 100 (i = 2), 400 (i = 3), and 1000.
The GCI was then computed via
The GCI values together with the refinement ratios and relative differences are tabulated in Table 1.
Based on the values listed in Table 1, was found to be a reliable indicator of convergence due to its representation of the finest grids. The GCI values in Table 1 show that using the 400 number of divisions was ideal since a further increase in the number of divisions had the lowest GCI value (0.0347%), but a lower number of divisions reduced the computational cost compared to the increased number of divisions.
2.4. Physical Models
The numerical method used in the study was the finite volume method (FVM), discretizing governing equations on a computational grid and converting the partial differential equations into algebraic equations that can be solved numerically. The FVM approach is applied in the flow solver FENSAP, which ensures the conservation of mass, momentum, and energy across control volumes, which is crucial for accurately predicting complex interactions in icing scenarios, as described in [36]. The conditions considered included a turbulence intensity ratio of 0.01, a relaxation factor of 0.9, and an air static pressure of 101,325 Pa, with the adiabatic stagnation temperature being determined by the air static temperature. The boundary wall temperature was 0.1 °C higher than the static temperature. The time integration considers the number of Courant–Friedrichs–Lewy (CFLs) to be 50 and the maximum time steps to be 300. A crosswind dissipation of 1 × 10⁻⁹ was considered to address the convergence of residuals and improve the accuracy of shear stress and heat fluxes, and a robustness order of 100% was considered. The Navier–Stokes equations consist of the conservation of mass (or continuity), momentum, and energy [36] (Equations (6)–(10)).
Continuity equation:
Momentum equation:
The stress tensor σij and the shear stress tensor τij are determined as follows:
Energy conservation equation:
where t is time, is the air density, is the air velocity vector, is the momentum per unit volume, is the gravity vector, p is the pressure, is the dynamic viscosity, is the Kronecker delta, is the internal energy, is the enthalpy, is the thermal conductivity, is the air static temperature, and = 0.00216176 W/.
The Reynolds-Averaged Navier–Stokes (RANS) equations are applied to model fluid flow around airfoil surfaces. Ice accretion is influenced by heat and mass transfer processes when droplets impinge on the surface. The Eulerian approach is used in the solver DROP3D to model the airflow field with droplets that impinge on the airfoil surface leading to ice accretion [36]. The Eulerian two-fluid model includes particle continuity and momentum equations as follows (Equations (11) and (12)):
where is the droplet concentration, is the droplet velocity, is the drag coefficient, is the Reynolds number based on the gas-droplet relative velocity, K is the inertia parameter, is the droplet density, and is the Froude number.
The thermodynamic process of ice accretion, which determines the accretion efficiency affecting the rate of icing, is described in [37]. When supercooled water droplets hit the airfoil surface, heat transfer leads to a phase change from liquid to solid, which was integrated into the process of ice accumulation in real time. The heat balance considers energy transfer from the surrounding air, conductive heat transfer within the ice and substrate, and latent heat release during the phase transition. The heat balance is considered in the module ICE3D and determines the rate and extent of ice formation and the type of ice under the different icing conditions as described by Equations (13) and (14) [36].
Mass conservation:
Energy balance with heat fluxes:
where is the water film density, is the water film thickness, is the liquid film velocity vector, is the freestream velocity, is the liquid water content, is the collection efficiency, and are the mass flow rates of evaporation and ice accretion, respectively, is the specific heat of liquid film, is the temperature of liquid film, is the freestream temperature, is the droplet velocity, and are the latent heat of evaporation and fusion, respectively, is the specific heat of ice, is the Stefan–Boltzmann constant, is emissivity, is the convective heat transfer coefficient, is the recovered ice temperature, and is the heat flux due to anti-icing measures.
The numerical model of icing was validated in the authors’ previous study, where the ice shapes obtained numerically were compared with former experimental results [32,38].
2.5. Validation of the Numerical Model
The validation of the numerical model was performed to ensure the accuracy of the numerical simulations by comparing them with known experimental results. The experimental findings from Shin and Bond, 1992 [39], generated in a wind tunnel at NASA’s Lewis Research Center, were verified via FENSAP ICE. The conditions considered were a NACA0012 airfoil with a chord length of 0.5334 m, a 4° angle of attack, a −26.1 °C ambient temperature, an MVD of 20 µm, and a 1 g/m3 LWC for 6 min accretion time at a freestream velocity of 67.05 m/s.
The comparison in Figure 2 shows a close agreement between the numerical results and experimental observations of [39]. The numerical model was also validated in the authors’ former research by reproducing experimental results that were available in the literature and that were obtained under icing conditions different from those used here [38]. These observations confirm the suitability of using the numerical findings in this paper.
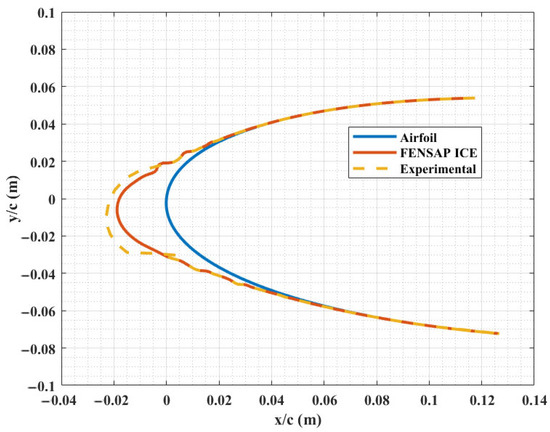
Figure 2.
Validation by comparing numerical and experimental results obtained by Shin and Bond, 1992 [39].
3. Inverse Design
This section first discusses the dependence of velocity distributions on the airfoil shape; more precisely on the maximum camber and thickness, since they are related to the aerodynamic forces the airfoil creates. Therefore, they are used in calculating the target velocities in the inverse design process that is then described together with the correction factor introduced and its application to determine the airfoil shape.
3.1. Velocity Distribution
The velocity distribution over the airfoil varies with its thickness and maximum camber, and the velocity distribution is a decisive factor influencing the aerodynamic forces. Therefore, two series of airfoil configurations, i.e., NACA1418 to NACA8418 and NACA4408 to NACA4430, were considered to investigate the flow characteristics. The maximum camber of the airfoil increases with the first digit, whereas the airfoil thickness increases with the last two digits. To obtain the flow distribution over the boundary layer, the slip/shear condition was considered in ANSYS Fluent as shown in Figure 3 for two airfoils with the same maximum camber and with different thicknesses. The condition considered in the flow distribution was a freestream velocity of 20 m/s at an ambient temperature of 15 °C, with the aim of analyzing the velocity variations due to curvature and thickness.
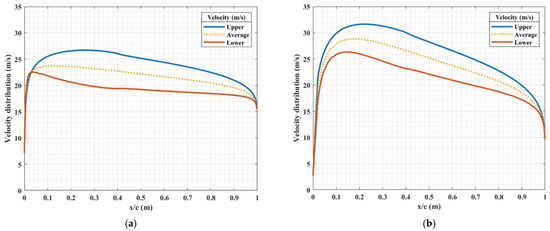
Figure 3.
Velocity distributions over an airfoil under slip conditions on (a) NACA4412 and (b) NACA4430 airfoils.
The results show significant variation in the velocity distribution depending on the airfoils’ geometry. The effect of thickness is shown in Figure 3 and Figure 4. A steep decreasing tangent describes the average velocity in the major part along the chord length and more precisely in the positions from about 20% to 100% of the chord length (i.e., when x/c varies from 0.2 to 1). The absolute value of the tangent increases with thickness, with approximately the same average velocity occurring at x/c 0.83 with a value of 20.2 m/s (Figure 4a). There was little change in the slope of the average velocities with the increasing maximum camber of the airfoils from NACA1418 to NACA8418 (Figure 4b). However, the difference between the upper and lower velocities increases with the maximum camber (i.e., increasing the first digit), which was presented in [24].
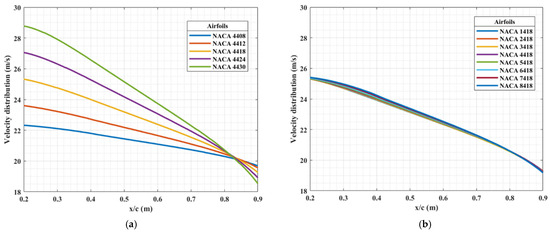
Figure 4.
Average velocity distributions with varying (a) airfoil thickness and (b) maximum camber at 15 °C and a freestream velocity of 20 m/s.
3.2. Inverse Design Procedure and Correction Factor
The inverse design methodology was applied to determine the airfoil shape according to prescribed performance criteria that were described by the target velocity distribution. The shape was assumed to be known if icing was not an issue. The velocity distribution around this shape was modified, as explained later in this section, to obtain the target velocities that would be required for operation under icing conditions. Then, an initial airfoil shape was chosen, the velocity distribution was determined, and the shape was modified so that it aimed at minimizing deviation between the actual velocities and the specified target velocities. The inverse design methodology applied is based on the modified Garabedian–McFadden (MGM) approach. The technique is based on the principle that the surface ordinate y, together with its first and second derivatives, determines the velocity distribution near the surface. The chord length was chosen to be 1 m, and the number of calculation points along the chord length was n = 501. The equation used in generating new airfoils is as follows:
where and are the target and actual velocities, respectively, and , , and are numerical constants. When approaches , the change in ordinate y tends to zero. The derivatives in Equation (15) are written in discrete form to obtain the following equation:
where the coefficients k1, k2, and k3 can be expressed by the numerical constants and the step size that is assumed to be constant along the chord length. The system given by Equation (16) can be organized in matrix form, where the vector of unknowns includes to , and the coefficient matrix is tridiagonal. The system involves n-2 equations, since the change in position at the leading edge and at the trailing edge is zero. The system can be solved by the tridiagonal matrix algorithm or Thomas algorithm [40]. The technique is explained further in [17,24].
The airfoil shape was modified in order to extend the operation of wind turbines under icing conditions. The idea is based on using a correction factor as proposed in [24]. The correction factor modified the difference between the upper and lower velocities in the velocity distribution that would be required for the bare blade. The difference in the velocity near the upper surface and the average velocity was multiplied by the correction factor, and the result was added to the average velocity. Likewise, the difference in the average velocity and the velocity near the lower surface was multiplied by the correction factor, and the result was subtracted from the average velocity. These operations generated the corrected velocities near the upper surface () and near the lower surface () as shown in Equations (17) and (18), respectively,
where and are the velocities near the upper and lower surfaces, respectively, obtained from the slip conditions; is the average of velocities near the upper and lower surfaces at the same position along the chord length;, and the index m refers to modified. The modified velocities near the upper and lower surfaces provide the target velocity distribution in the inverse design process.
The application of the correction factor considered the effects of icing on the power coefficient, and the number of icing days per year. The power coefficient was calculated from the aerodynamic coefficients as follows [25]:
Kollar & Mishra, 2019 [24] reported that asymmetric airfoils with a greater maximum camber had a higher power coefficient, which means that a low maximum camber would reduce the aerodynamic performance. The effects of icing on the power coefficient were considered based on the ratio of power coefficients for the bare and iced blades
The number of icing days varies in different regions, with some projections expected to increase in some scenarios before 2100. In northern Finland, the estimated number of icing days is 24 days [41]; in China, it ranges between 10 and 50 days [42]; and in some parts of Switzerland, it is approximately 11.5 days/year and 41.5 days/year for meteorological and instrumental icing, respectively [43]. Grünewald et al., 2012 [44] studied icing days in a region in Switzerland that had approximately 15 icing days in a year, which was considered in this study. The number of icing days were involved in the correction factor based on the average icing days per year divided by the total number of days when the wind turbine operates in a year
The correction factor was then calculated by combining the two parameters defined by Equations (20) and (21).
The correction factor provided by Equation (22) was proposed by [21] and is based on the effects of icing on the power output and on the number of icing days per year. The formula exploits the fact that an increasing maximum camber results in a greater difference between the velocities near the upper and lower surfaces of the airfoil, and consequently, a greater lift-to-drag ratio. However, the effects of airfoil thickness have not been considered so far. The thickness does not considerably change the difference between the velocities near the upper and lower surfaces (as it can be observed in Figure 3), but it affects the tangent of the average velocity along the chord length (as Figure 4a reveals). This tangent is proportional to the thickness, and an increasing thickness results in a decreasing lift-to-drag ratio that further decreases under icing conditions. Therefore, a further parameter is proposed for consideration in the correction factor, which depends on the airfoil thickness
The subscript th in Equation (23) refers to the thickness, and is the highest lift-to-drag ratio in a series of airfoils with varying thicknesses. The smallest thickness considered was 8% of the chord length, which means that, e.g., in the series NACA4408 to NACA4430, was taken to be the lift-to-drag ratio of the NACA4408 airfoil. The correction factor defined by Equation (22) was then modified by taking into consideration the thickness as follows:
The effect of the parameter is that a greater thickness results in a greater increase in the difference between the velocities near the upper and lower surfaces in the target velocity distribution. This factor compensates the lower lift-to-drag ratio of the thicker airfoils in the inverse design process.
3.3. Application of Correction Factor to Obtain Airfoil Shape
The aerodynamic performance of the bare and iced airfoils is compared in Figure 5 for various airfoil thicknesses and maximum cambers. The lift-to-drag ratios were calculated for the iced airfoil assuming freezing drizzle conditions (temperature of 4 °C, MVD of 50 µm, and LWC of 1 g/m3 for 180 min ice accretion), and for the bare airfoil assuming an ambient temperature of 15 °C and density of 1.225 kg/m3, while maintaining a freestream velocity of 20 m/s. The 180 min accretion time was chosen to obtain a considerable amount of ice (i.e., in the range of cm) even under the lightest icing intensity, according to FAA standards on icing severity [45]. The comparison of the aerodynamic performance for bare and iced conditions is then shown in Figure 5 by the blue and red solid lines, respectively. The tendency of the results shows that, in bare blades, an increase in thickness leads to a reduction in aerodynamic performance (Figure 5a), whereas an increasing maximum camber leads to improved aerodynamic performance (Figure 5b).
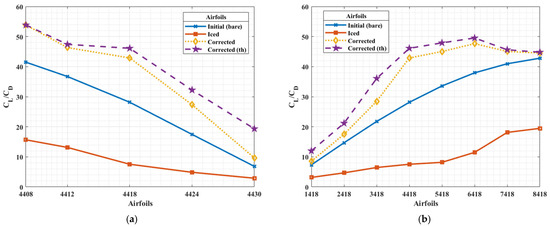
Figure 5.
Aerodynamic performance with varying (a) thickness and (b) maximum camber for the original and corrected bare airfoils, and for iced original airfoil under freezing drizzle conditions.
The comparison of aerodynamic performance as shown in Figure 5 provides as calculated by Equation (20), which was then used as an input to determine the correction factor. Further input is the number of icing days that is considered by Equation (21), and then the correction factor is provided by Equation (22). This study proposes to take into account the effect of thickness by Equation (23) in the modified correction factor that is calculated by Equation (24). Table 2 and Table 3 show the correction factors ranging from 1.22 to 1.75 for airfoils with different thicknesses (NACA4408 to NACA4430) and from 1.19 to 1.89 for airfoils with varying maximum cambers (NACA1418 to NACA8418). The modified correction factor () is the same for the thinnest airfoil, and its value increases to a greater and greater extent compared to the correction factor (r) as the airfoil becomes thicker and thicker. Between NACA4408 and NACA4424, there was an increase in both correction factors, which suggests more significant modification in the shape and enhanced aerodynamic performance for thicker airfoils. However, the correction factor is relatively low for NACA4430. This result is attributed to the low lift of the original shape, which cannot be improved substantially even by the application of the process described by Equations (15)–(22) in Section 3.1. Nevertheless, the relatively greater modified correction factor contributes to enhancing the aerodynamic performance of even the thickest airfoils.

Table 2.
Correction factors (r) obtained by considering the ratio of icing days to the number of operation days in a year (, and the ratio of power coefficients for bare and iced airfoils (), and modified correction factors (rmod) that consider , , and the thickness () as well for different thicknesses of airfoils from NACA4408 to NACA4430.

Table 3.
Correction factors (r) obtained by considering the ratio of icing days to the number of operation days in a year (), and the ratio of power coefficients for bare and iced airfoils (), and modified correction factors (rmod) that consider , , and the thickness () as well for different maximum cambers of airfoils from NACA1418 to NACA8418.
Both correction factors were determined for several airfoil shapes with varying maximum camber (NACA1418 to NACA8418) and thickness (NACA4408 to NACA4430). The modified velocity distributions were calculated by Equations (17) and (18) to obtain the target velocity distributions that were then applied to determine the modified shapes by the inverse design process. The corrected velocities together with the velocity distribution around the original NACA airfoil are shown in Figure 6 and Figure 7 for airfoils with different thicknesses and maximum cambers, respectively.
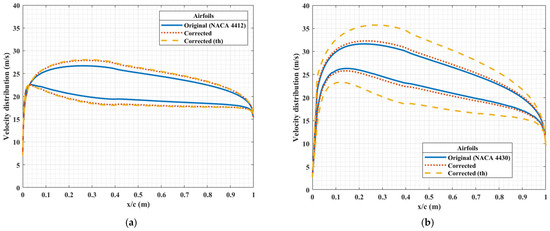
Figure 6.
Velocity distributions generated from the slip conditions for the original NACA airfoil (original), and the corrected airfoils obtained using the correction factors r (corrected) and rmod (corrected (th)), for (a) NACA4412 and (b) NACA4430.
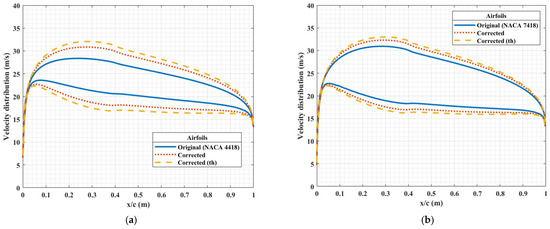
Figure 7.
Velocity distributions generated from the slip conditions for the original NACA airfoil (original airfoil), and the corrected airfoils obtained using the correction factors r (corrected airfoil) and rmod (corrected airfoil (th)), for (a) NACA4418 and (b) NACA7418.
Figure 8 and Figure 9 represent the inverse design process for the cases considered in Table 2 and Table 3. The iteration in Equation (16) began with the initial airfoil. The original airfoil corresponds to the NACA airfoil that would be obtained without the application of the correction factor, and the corrected airfoil and corrected airfoil (thickness) are the results of the inverse design process with the application of the correction factor and the modified correction factor, respectively. Figure 8 and Figure 9 clearly show that the difference between the two corrected airfoils is almost negligible for a thin airfoil (see Figure 8a and Figure 9a); however, the camber in the shape obtained after the application of the modified correction factor is significantly greater for thick airfoils (see Figure 8b and Figure 9b). The lift-to-drag ratios of the corrected bare airfoils with varying maximum camber and thickness are plotted in Figure 5 by the dotted and dashed lines. The lift-to-drag ratio is greater for the corrected airfoils than for the original one for all the geometries considered, but the goal is to compare the aerodynamic performance under icing conditions, which will be discussed in detail in Section 4.2.
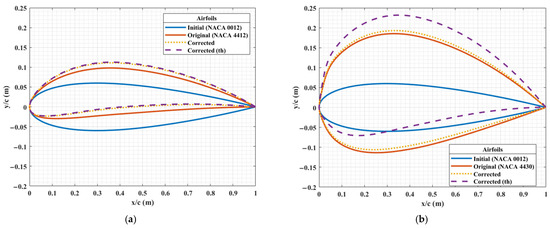
Figure 8.
Airfoil shapes obtained from the original and corrected target velocities for two different thicknesses (note that the horizontal and vertical scales are not the same).
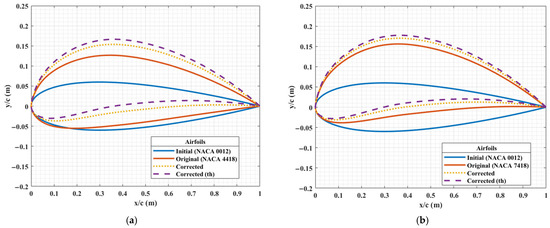
Figure 9.
Airfoil shapes obtained from the original and corrected target velocities for two different maximum camber positions (note that the horizontal and vertical scales are not the same).
4. Performance of Airfoil Obtained by Inverse Design Involving Correction Factor
The ice mass and the aerodynamic performance of the original airfoil and the airfoil with the corrected shape will be compared in this section. The effects of air temperature and LWC will be studied for the two sets of airfoils with varying thicknesses and maximum cambers. The freestream velocity and the MVD were kept constant at 20 m/s and 50 µm, respectively.
4.1. Impact of Corrected Shape on the Ice Mass
The ice mass on the original and corrected airfoils with varying maximum cambers was found to be nearly constant, as shown in Figure 10. This can be attributed to the similar collection efficiency and the nearly identical stagnation region resulting in nearly the same ice accretion rates due to local airflow field and droplet trajectories. The leading edge radius in the study was not altered, and thus, the stagnation point remained constant in all three of the airfoils, and the accretion patterns were governed more by stagnation flow than the airfoil camber.
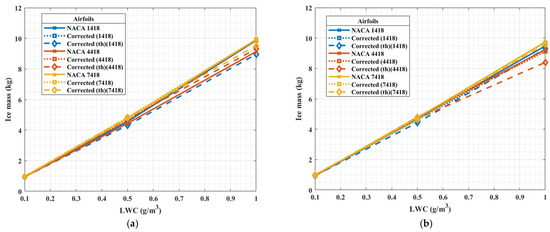
Figure 10.
Ice mass comparison for airfoils with varying maximum camber and LWC, for temperature (a) −4 °C and (b) −20 °C for NACA and corrected airfoils.
Figure 11 shows the impact of airfoil thickness on ice mass on the original and corrected airfoils. An increase in airfoil thickness on airfoils from NACA4412 to NACA4430 led to an increase in the leading edge radius impacting the stagnation point [46]. Based on the findings on ice mass, more ice accreted on NACA4430 due to the larger nucleation site from the curvature, increasing the collection efficiency compared to NACA4412. A similar tendency was observed in [47]. It is acknowledged that small changes in the leading edge geometry can significantly impact droplet impingement and ice accretion rates. The stagnation points and icing sites (leading edge curvature) can influence local collection efficiency and thermal balance, and thus, future study is recommended to investigate their effects on ice mass and accretion patterns. This can be achieved by incorporating inverse design and adding adjustments in leading edge radii with varying thickness. This would allow for a more comprehensive understanding of the coupled geometric and thermodynamic factors affecting blade performance in icing environments.
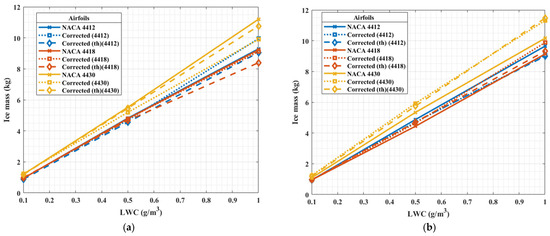
Figure 11.
Ice mass comparison for airfoils with varying thickness and LWC for temperature (a) −4 °C and (b) −20 °C for NACA and corrected airfoils.
The impact of LWC was also considered in this study, and a linear correlation with ice mass was seen since the amount of water present in the airflow impacts the sticking efficiency and accretion efficiency that is based on the thermodynamics. According to Figure 11a, more ice mass was found on the NACA4430 compared to the airfoil corrected from NACA4430, and similar ice mass was seen on the other original and corrected airfoils at 4 °C. The ice mass was also the highest on the thickest airfoil at 20 °C, but the ice mass was not reduced by the correction of the shape. However, the aerodynamic performance was improved significantly, as will be shown in the subsequent section.
4.2. Comparison of Aerodynamic Performance of the Initial and Corrected Airfoils
Ice accumulation on wind turbine blade surfaces reduces aerodynamic performance, which leads to overall power loss. The losses associated with wind turbines include limited operation and performance degradation, or when ice accretion is extreme, even shutdown. The aerodynamic degradation is attributed to the changes in the airfoil shape and the flow distribution reducing the lift and increasing the drag. The corrected shape obtained by the process proposed does not contribute to reducing ice mass significantly according to Section 4.1. However, it will be shown that the modified ice shape on the corrected airfoil leads to aerodynamic degradation to a substantially smaller extent than the ice on the original airfoil, and that the extent of aerodynamic degradation on the ice shape obtained by the modified correction factor is even smaller than on that obtained by the correction factor proposed formerly.
The changes in the maximum camber on NACA1418, 4418, and 7418 and the resulting performance improvement due to the application of the inverse design are shown for iced airfoils in Figure 12. Since the goal was to improve the aerodynamic performance of the iced airfoils, they are discussed in the following. The airfoils with smaller camber were found to be more affected by the correction compared to NACA7418 which had a greater impact on the boundary layer and the flow. The lift-to-drag ratio increased up to 60% on the corrected shape compared to the original airfoil with a relatively small camber, whereas this improvement was below 10% for NACA7418. This tendency that expresses the improved aerodynamics was even more pronounced when thickness was introduced in the modified correction factor in the inverse design process. The lift-to-drag ratio can be improved up to a further 53% if the modified correction factor is applied. The advantage of the modified correction factor ceases to be significant only for high LWC. Based on this observation, the maximum camber affects flow separation, pressure distribution, and ice accretion characteristics. In NACA1418, the smaller camber causes a more complex ice shape on the leading edge causing premature flow separation and increased pressure drag. The NACA7418 is more advantageous aerodynamically due to stability in the pressure gradient over a greater portion of chord length, where the flow separation was delayed leading to considerable increase in the lift and favourable pressure recovery. When the shape was obtained after the application of the correction factor, it led to an increase in the cusp on the pressure side, and consequently, higher velocity flow on the lower surface increasing lift due to Kutta condition. Based on the above phenomenon, the aerodynamic performance improved on the corrected airfoil under icing conditions. Increasing LWC led to a degradation in aerodynamic performance, but it did not significantly change the enhancing effect of the corrected shape. Concerning the ambient temperature, relatively greater improvement was observed in the aerodynamic performance at 4 °C that corresponds to glaze ice accretion than at 20 °C when rime ice accretes.
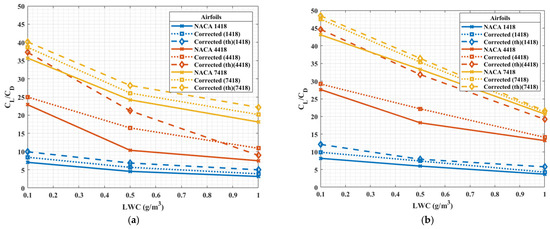
Figure 12.
Comparison of aerodynamic performance with varying maximum camber and LWC for temperature (a) 4 °C and (b) 20 °C for NACA and corrected airfoils.
The aerodynamic performance of the original and corrected airfoils was compared for the iced airfoils in Figure 13 with varying airfoil thickness, i.e., with original airfoils NACA4412, 4418, and 4430. When airfoil thickness was increased, the exposure region on the leading edge area grew, leading to greater collision and sticking efficiencies and a higher amount of ice accumulation, eventually causing more significant aerodynamic degradation, which corresponds to what [48] highlighted. Greater thickness also caused an enhanced impact of ice growth on the surface roughness of the airfoil and greater pressure drag resulting in airflow separation around the surface and a reduction in aerodynamic performance. These observations can be validated by the findings from [49,50]. In NACA4430, the velocity near the upper surface was found to be lower leading to smaller suction, which affected the pressure gradient and resulted in thicker wakes, higher turbulence intensity, and greater drag compared to both NACA4418 and NACA4412. Figure 13 shows that the application of correction improved the aerodynamics of all the iced airfoils considered, but it substantially increased the lift-to-drag ratio after the icing of the thickest airfoil. The effects of LWC and air temperature were similar to those observed with varying maximum camber. Greater LWC led to decreasing aerodynamic performance, but it did not significantly change the enhancing effect of the corrected shape. The aerodynamic performance of the corrected airfoil improved to a greater extent at an air temperature of 4 °C than at 20 °C.
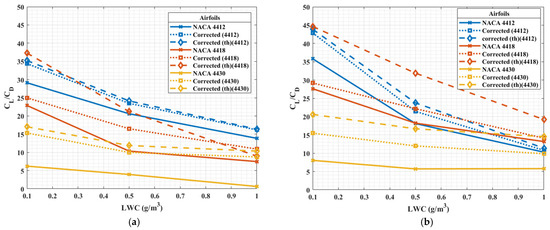
Figure 13.
Comparison of aerodynamic performance with varying thickness and LWC for temperature (a) −4 °C and (b) −20 °C for NACA and corrected airfoils.
The objective was to modify blade sections that contribute to reducing ice mass and enhancing aerodynamic performance. Based on Figure 9, Figure 10, Figure 11, Figure 12 and Figure 13, the reduction in ice mass is limited on the corrected shapes, but the aerodynamic performance is improved considerably under icing conditions. This was obtained by applying different conditions experienced in icing regions, which are found in most parts of the mid-latitudes and in the cold regions. Although this was achieved by numerical simulations, further experimental studies in an icing wind tunnel will be carried out to validate this performance.
For wind turbine designers, the introduction of inverse design with the correction factor proposed () is a valuable tool in improving aerodynamic performance in extreme weather conditions. While the ice mass was not significantly reduced, as seen in Section 4.1, the aerodynamic performance under icing conditions was seen to improve up to 60% involving icing conditions and their effects in the inverse design process, and by a further 53% when the blade geometry was also considered in the design process. The practical benefit of introducing the effects of ice accretion in the process of blade design and coupling it with other features of blade geometry is that designers can develop turbines resilient to icing events and possess improved operationality in cold climates.
5. Conclusions
Ice accretion over an airfoil surface greatly affects the aerodynamic performance of the airfoil. In order to suppress the degrading effects of ice, an inverse design methodology using the modified Garabedian–McFadden iterative technique and involving a modified correction factor was applied to modify the airfoil shape with varying airfoil thicknesses and maximum cambers. The maximum camber and the thickness were varied considering NACA 4-digit airfoils from NACA1418 to NACA8418 and from NACA4408 to NACA4430, respectively. These original shapes were modified by the inverse design process with the correction factor proposed formerly and with the modified correction factor, and the enhancement of aerodynamic performance of the iced airfoil was evaluated under different ambient conditions. The LWC and ambient temperature varied from 0.1 g/m3 to 1 g/m3 and 4 °C to 20 °C, respectively. The freestream velocity and the MVD were held constant at 20 m/s and 50 µm, respectively. The correction factor was determined from the power coefficient and the ratio of freezing days per year, whereas the modified correction factor also involved the airfoil thickness. The main results are summarized in the following:
- The highest correction factor and modified correction factor under the conditions considered were obtained at 1.89 and 2.78, respectively, which affected the ice mass and aerodynamic performance.
- Based on the findings, there was a minimal reduction (or even no reduction in some cases) in the mass of ice accretion on the airfoil surface, because the leading edge radius was not greatly affected by the inverse design process.
- The findings show significant improvement in the aerodynamic performance of the corrected airfoil under icing conditions, because the reduction in pressure leads to an increase in velocity and thus a higher lift. This tendency was particularly advantageous for thick airfoils when the effects of thickness were considered in the inverse design process.
- An increase in the LWC led to an increase in the ice mass, which worsened the aerodynamic performance. However, the variation in LWC did not significantly change the enhancing effect of the corrected shape.
- The aerodynamic performance was enhanced to a relatively greater extent at an air temperature of 4 °C that corresponds to glaze ice accretion than at 20 °C that is more common during rime ice accretion.
Further research is recommended involving the consideration of other ambient parameters and experimental study to validate some of the tendencies obtained, although the numerical model of icing was already validated in former research. The outcome of the research contributes to improving the design of wind turbine blades so that they become more performant under adverse weather conditions.
Author Contributions
Conceptualization, I.K.R. and L.E.K.; methodology, I.K.R.; validation, I.K.R.; formal analysis, I.K.R. and L.E.K.; investigation, I.K.R.; data curation, I.K.R. and L.E.K.; writing—original draft preparation, I.K.R.; writing—review and editing, I.K.R. and L.E.K.; visualization, I.K.R.; supervision, L.E.K. All authors have read and agreed to the published version of the manuscript.
Funding
Project no. TKP2021-NVA-29 has been implemented with the support provided by the Ministry of Culture and Innovation of Hungary from the National Research, Development and Innovation Fund, financed under the TKP2021-NVA funding scheme.
Data Availability Statement
Data will be made available upon request.
Conflicts of Interest
The authors declare no conflicts of interest.
References
- Kara, T.; Şahin, A.D. Implications of Climate Change on Wind Energy Potential. Sustainability 2023, 15, 14822. [Google Scholar] [CrossRef]
- Jin, J.Y.; Virk, M.S. Study of ice accretion and icing effects on aerodynamic characteristics of DU96 wind turbine blade profile. Cold Reg. Sci. Technol. 2019, 160, 119–127. [Google Scholar] [CrossRef]
- Rotich, I.; Kollár, L.E. Inverse Design of Wind Turbine Blade Section with CFD Simulations Under Extreme Weather Conditions. 2024. Available online: https://www.researchgate.net/publication/381965108 (accessed on 24 March 2025).
- Chuang, Z.; Yi, H.; Chang, X.; Liu, H.; Zhang, H.; Xia, L. Comprehensive Analysis of the Impact of the Icing of Wind Turbine Blades on Power Loss in Cold Regions. J. Mar. Sci. Eng. 2023, 11, 1125. [Google Scholar] [CrossRef]
- Roberge, P.; Lemay, J.; Ruel, J.; Bégin-Drolet, A. Definition of an ice index for wind turbines in cold climate. Cold Reg. Sci. Technol. 2023, 213, 103930. [Google Scholar] [CrossRef]
- Swenson, L.; Gao, L.; Hong, J.; Shen, L. An efficacious model for predicting icing-induced energy loss for wind turbines. Appl. Energy 2022, 305, 117809. [Google Scholar] [CrossRef]
- Shao, H.; Li, D.; Kan, Z.; Li, H.; Yuan, D.; Xiang, J. Influence of wing camber on aerodynamic performance of flapping wing rotor. Aerosp. Sci. Technol. 2021, 113, 106732. [Google Scholar] [CrossRef]
- Zhang, X.; Li, Z.; Yu, X.; Li, W. Aerodynamic Performance of Trailing-Edge Modification of H-Type VAWT Blade Considering Camber Effect. Int. J. Aeronaut. Space Sci. 2020, 21, 587–598. [Google Scholar] [CrossRef]
- Virk, M.S. Effect of Wind Turbine Blade Profile Symmetry on Ice Accretion. Appl. Mech. Mater. 2017, 863, 229–234. [Google Scholar] [CrossRef]
- Wang, S.; Qiao, Y.; Zhang, Z. Influence of camber on aerodynamic performance of airfoil based on CFD technology. J. Phys. Conf. Ser. 2022, 2276, 012027. [Google Scholar] [CrossRef]
- Dayyani, I.; Shaw, A.D.; Saavedra Flores, E.I.; Friswell, M.I. The mechanics of composite corrugated structures: A review with applications in morphing aircraft. Compos. Struct. 2015, 133, 358–380. [Google Scholar] [CrossRef]
- Jo, B.W.; Majid, T. Aerodynamic Analysis of Camber Morphing Airfoils in Transition via Computational Fluid Dynamics. Biomimetics 2022, 7, 52. [Google Scholar] [CrossRef] [PubMed]
- Majid, T.; Jo, B.W. Comparative Aerodynamic Performance Analysis of Camber Morphing and Conventional Airfoils. Appl. Sci. 2021, 11, 10663. [Google Scholar] [CrossRef]
- Abdelmoula, A.; Rauleder, J. Aerodynamic Performance of Morphed Camber Rotor Airfoils. In Proceedings of the AIAA Scitech 2019 Forum, San Diego, CA, USA, 7–11 January 2019. [Google Scholar] [CrossRef]
- Seifi Davari, H.; Seify Davari, M.; Kouravand, S.; Kafili Kurdkandi, M. Optimizing the Aerodynamic Efficiency of Different Airfoils by Altering Their Geometry at Low Reynolds Numbers. Arab. J. Sci. Eng. 2024, 49, 15253–15288. [Google Scholar] [CrossRef]
- Garabedian, P.; McFadden, G. Computational Fluid Dynamics of Airfoils and Wings. In Transonic 1982, Shock, and Multidimensional Flows; Elsevier: Amsterdam, The Netherlands, 1982; pp. 1–16. [Google Scholar] [CrossRef]
- Malone, J.B.; Vadyak, J.; Sankar, L.N. Inverse aerodynamic design method for aircraft components. J. Aircr. 1987, 24, 8–9. [Google Scholar] [CrossRef]
- Malone, J.; Swanson, R. Inverse airfoil design procedure using a multigrid Navier-Stokes method. In Proceedings of the Third International Conference on Inverse Design Concepts and Optimization in Engineering Sciences (ICIDES-3), Washington, DC, USA, 23–25 October 1991. [Google Scholar]
- Dulikravich, G.S.; Baker, D.P. Using Existing Flow-Field Analysis Codes for Inverse Design of Three-Dimentional Aerodynamic Shapes; Vieweg+Teubner Verlag: Wiesbaden, Germany, 1999; pp. 89–112. [Google Scholar] [CrossRef]
- Kollar, L.E.; Mishra, R. Icing of Wind Turbine Blades Obtained by an Inverse Design Process. In Proceedings of the 12th Conference on Sustainable Development of Energy, Water and Environment Systems (SDEWES2017), Dubrovnik, Croatia, 4–8 October 2017. [Google Scholar]
- Volpe, E.V.; Oliveira, G.L.; Santos, L.C.C.; Hayashi, M.T.; Ceze, M.A.B. Inverse aerodynamic design applications using the MGM hybrid formulation. Inverse Probl. Sci. Eng. 2009, 17, 245–261. [Google Scholar] [CrossRef]
- Kollár, L.E.; Mishra, R.; Jain, A. Inverse Design of Blade Shapes for Vertical Axis Wind Turbines; MNNITA: Prayagraj, India, 2016. [Google Scholar]
- Nili-Ahmadabadi, M.; Mokhtarinia, F.; Shirani, M. Performance improvement of a wind turbine blade using a developed inverse design method. Environ. Eng. Sci. 2016, 4, 1–10. [Google Scholar]
- Kollar, L.E.; Mishra, R. Inverse design of wind turbine blade sections for operation under icing conditions. Energy Convers. Manag. 2019, 180, 844–858. [Google Scholar] [CrossRef]
- Spera, D.A. (Ed.) Wind Turbine Technology: Fundamental Concepts in Wind Turbine Engineering, 2nd ed.; ASME Press: New York, NY, USA, 2009. [Google Scholar] [CrossRef]
- Airfoiltools. NACA 4 Digit Airfoil Generator. 2025. Available online: http://airfoiltools.com/ (accessed on 28 March 2025).
- Ma, D.; Zhao, Y.; Qiao, Y.; Li, G. Effects of relative thickness on aerodynamic characteristics of airfoil at a low Reynolds number. Chin. J. Aeronaut. 2015, 28, 1003–1015. [Google Scholar] [CrossRef]
- Razzak, M.A.; Cui, Y.D.; Tay, J.; Teo, Z.W.; Nadesan, T.; Khoo, B.C.; Nguyen, V.-T.; Wise, D.J.; EChua, K.T.; VBL, B. Experimental study of skin friction drag reduction of turbulent boundary layer over shallow dimples. In Proceedings of the AIAA SCITECH 2022 Forum, San Diego, CA, USA, 3 January 2022. [Google Scholar] [CrossRef]
- Stroh, A.; Hasegawa, Y.; Schlatter, P.; Frohnapfel, B. Global effect of local skin friction drag reduction in spatially developing turbulent boundary layer. J. Fluid Mech. 2016, 805, 303–321. [Google Scholar] [CrossRef]
- Takahashi, H.; Iijima, H.; Kurita, M.; Koga, S. Evaluation of Skin Friction Drag Reduction in the Turbulent Boundary Layer Using Riblets. Appl. Sci. 2019, 9, 5199. [Google Scholar] [CrossRef]
- Halila, G.L.O.; Antunes, A.P.; da Silva, R.G.; Azevedo, J.L.F. Effects of boundary layer transition on the aerodynamic analysis of high-lift systems. Aerosp. Sci. Technol. 2019, 90, 233–245. [Google Scholar] [CrossRef]
- Rotich, I.K.; Kollár, L.E. Numerical study of ice accretion on blade surface with varying cloud characteristics. J. Comput. Appl. Mech. 2024, 19, 17–35. [Google Scholar] [CrossRef]
- Rotich, I.; Kollár, L.E. Numerical simulation of the performance of an asymmetrical airfoil under extreme weather conditions. Mérnöki És Inform. Megoldások 2022, 3, 19–29. [Google Scholar] [CrossRef]
- Broadhead, B.L.; Rearden, B.T.; Hopper, C.M.; Wagschal, J.J.; Parks, C.V. Sensitivity- and Uncertainty-Based Criticality Safety Validation Techniques. Nucl. Sci. Eng. 2004, 146, 340–366. [Google Scholar] [CrossRef]
- Roache, P.J. Perspective: A Method for Uniform Reporting of Grid Refinement Studies. J. Fluids Eng. 1994, 116, 405–413. [Google Scholar] [CrossRef]
- ANSYS. FENSAP-ICE User Manual Third-Party Software; Release 18.1; ANSYS, Inc.: Canonsburg, PA, USA, April 2017; Available online: http://www.ansys.com (accessed on 28 March 2025).
- Makkonen, L.; Laakso, T.; Marjaniemi, M.; Finstad, K.J. Modelling and Prevention of Ice Accretion on Wind Turbines. Wind Eng. 2001, 25, 3–21. [Google Scholar] [CrossRef]
- Rotich, I.K.; Kollár, L.E. Effects of sand grain roughness height on the performance of wind turbine blade section under extreme weather conditions. Int. J. Multiph. Flow 2024, 181, 105022. [Google Scholar] [CrossRef]
- Shin, J.; Bond, T.H. Experimental and Computational Ice Shapes and Resulting Drag Increase for a NACA 0012 Airfoil. In Proceedings of the California State Univ., the Fifth Symposium on Numerical and Physical Aspects of Aerodynamic Flows, Long Beach, CA, USA, 13–15 January 1992. [Google Scholar]
- Conte, S.D.; Boor, C. Elementary Numerical Analysis: An Algorithmic Approach; McGraw-Hill: New York, NY, USA, 1981; pp. 153–157. [Google Scholar]
- Helgesen, I.S.; Johannesen, A.B.; Bostedt, G.; Sandorf, E.D. Climate change and reindeer herding—A bioeconomic model on the impact of climate change on harvesting profits for Saami reindeer herders in Norway and Sweden. Ecol. Econ. 2024, 223, 108227. [Google Scholar] [CrossRef]
- Wen, J.; Jia, R.; Peng, Y. Observation and Analysis of Meteorological Conditions for Icing of Wires in Guizhou, China. J. Geosci. Environ. Prot. 2019, 07, 214–230. [Google Scholar] [CrossRef][Green Version]
- Dierer, S.; Oechslin, R.; Cattin, R. Wind turbines in icing conditions: Performance and prediction. Adv. Sci. Res. 2011, 6, 245–250. [Google Scholar] [CrossRef]
- Grünewald, T.; Dierer, S.; Cattin, R.; Steiner, P.; Steinkogler, W.; Fundel, F.; Lehning, M. Mapping frequencies of icing on structures in Switzerland. J. Wind. Eng. Ind. Aerodyn 2012, 107–108, 76–82. [Google Scholar] [CrossRef]
- Jeck, R.K. Icing Design Envelopes (14 CFR Parts 25 and 29, Appendix C) Converted to a Distance-Based Format; Federal Aviation Administration, Office of Aviation Research: Washington, DC, USA, 2002. [Google Scholar]
- Son, C.; Oh, S.; Yee, K. Quantitative analysis of a two-dimensional ice accretion on airfoils. J. Mech. Sci. Technol. 2012, 26, 1059–1071. [Google Scholar] [CrossRef]
- Kozelkov, A.; Galanov, N.; Semenov, I.; Zhuchkov, R.; Strelets, D. Computational Investigation of the Water Droplet Effects on Shapes of Ice on Airfoils. Aerospace 2023, 10, 906. [Google Scholar] [CrossRef]
- Muhammed, M.; Virk, M.S. Ice Accretion on Rotary-Wing Unmanned Aerial Vehicles—A Review Study. Aerospace 2023, 10, 261. [Google Scholar] [CrossRef]
- Bai, T.; Liu, J.; Zhang, W.; Zou, Z. Effect of surface roughness on the aerodynamic performance of turbine blade cascade. Propuls. Power Res. 2014, 3, 82–89. [Google Scholar] [CrossRef]
- Contreras Montoya, L.T.; Ilinca, A.; Lain, S. Influence of Surface Roughness Modeling on the Aerodynamics of an Iced Wind Turbine S809 Airfoil. Processes 2023, 11, 3371. [Google Scholar] [CrossRef]
Disclaimer/Publisher’s Note: The statements, opinions and data contained in all publications are solely those of the individual author(s) and contributor(s) and not of MDPI and/or the editor(s). MDPI and/or the editor(s) disclaim responsibility for any injury to people or property resulting from any ideas, methods, instructions or products referred to in the content. |
© 2025 by the authors. Licensee MDPI, Basel, Switzerland. This article is an open access article distributed under the terms and conditions of the Creative Commons Attribution (CC BY) license (https://creativecommons.org/licenses/by/4.0/).