Abstract
The present work proposes the optimization of the co-digestion of vinasse, filter cake, and deacetylation liquor in a continuous reactor by adding iron(III) oxide (Fe3O4) nanoparticles (NPs), comparing the results with a previous reactor operation without NPs. Initially, tests were carried out in batches with different NP concentrations, resulting in 5 mg L−1 as the best concentration to be added in the continuous reactor along the increments of the applied organic load rate (OLR). Methane (CH4) production reached a maximum value of 2.8 ± 0.1 NLCH4 gVS−1 (normal liter methane per gram of volatile solids), and the organic matter removal reached 71 ± 0.9% in phase VI (OLR of 5.5 gVS L−1 day−1). This production was 90% higher than the reactor co-digestion operation without NPs. The anaerobic digestion (AD) development was stable with stable organic acid (OA) concentrations, indicating the predominance of the propionic acid route to produce CH4. The main methanogenic Archaea identified was Methanoculleus, indicating that the predominant metabolic route was that of acetate (SAO) coupled with hydrogenotrophic methanogenesis. The use of Fe3O4 NPs managed to improve the AD from the first-generation and second-generation (1G2G) ethanol production residues and stimulated microbial community growth, without modifying the preferable metabolic pathways.
1. Introduction
Anaerobic digestion (AD) offers a vital waste management strategy, harnessing methane (CH4) as energy from diverse residues [1]. Notably, sugarcane byproducts, particularly vinasse, showcase significant potential for CH4 generation [2,3,4]. In this context, the concept of anaerobic co-digestion emerges as a pivotal avenue for bolstering biogas output. Co-digestion entails blending two or more substrates within AD, addressing the limitations of mono-digestion (primarily nutrient imbalances) and enhancing the economic viability of AD plants [5]. Beyond elevating CH4 production, co-digestion also enhances process stability by facilitating synergistic interactions among different substrates [5]. In the work by Alomani et al., the efficiency of co-digestion processes was demonstrated. The results revealed that the highest cumulative methane production (CMP) of 297.99 NL/kgVS can be generated by co-digestion of agricultural solid waste and cow dung.
A remarkable prospect lies in promoting the co-digestion of sugarcane industry residues, offering a solution for managing diverse biorefinery byproducts and simultaneously augmenting CH4 generation. Notably, in addition to vinasse, filter cake—a lignocellulosic residue obtained from ethanol production—holds the potential to synergistically amplify CH4 production by co-digesting with vinasse [6,7,8]. However, despite the progress in exploiting second-generation (2G) vinasse for AD [9], limited attention has been given to the utilization of liquors generated within the 2G ethanol production process. In a study carried out by Brenelli et al. [10], an alkaline pretreatment of sugarcane straw was performed for 2G ethanol production. Within this process, straw deacetylation was carried out before the hydrothermal pretreatment, as the straw hemicellulose was highly acetylated. The residue generated from this process, called deacetylation liquor, is rich in volatile fatty acids, such as acetic acid and formic acid, and it is promising for CH4 production through AD or co-digestion [7].
Our research group’s previous investigations advocate for the co-digestion of sugarcane industry residues to enhance the first- and second-generation (1G2G) ethanol biorefinery integration. Notably, the co-digestion of vinasse, filter cake, and deacetylation liquor within a semi-continuous stirred-tank reactor (s-CSTR) yielded impressive results—an encouraging 230 NmLCH4 gSV−1 and a remarkable organic matter removal efficiency of 83 ± 13%. These outcomes underscore the potential of co-digestion to significantly elevate CH4 production compared to exclusive vinasse digestion [8].
In this context of biogas production, it is widely acknowledged that micronutrients play an important role in redox reactions, often acting as enzymatic co-factors that enhance the synergy of anaerobic digestion reactions [11]. This aspect was exemplified by Scherer et al. [12], who emphasized the pivotal roles of micronutrients like iron (Fe), zinc (Zn), nickel (Ni), copper (Cu), cobalt (Co), molybdenum (Mo), and manganese (Mn) in methanogenic cell construction. Proper regulation of the concentrations of these components is crucial to prevent potential inhibitory effects, thereby ensuring a harmonious and efficient functioning of anaerobic digestion processes. Zhang et al. [13] further demonstrated that inadequate concentrations of Co, Ni, Fe, Zn, and Cu constrain methanogenic microorganisms’ growth. Of these micronutrients, the significance of Fe is especially pronounced, stimulating citrocome and ferredoxin formation, thereby influencing cellular energy metabolism, especially in methanogenic archaea [14]. The role of Fe extends to catalyzing chemical reactions that are essential for acetogenesis and facilitating hydrolysis and acidification during AD [15].
In pursuit of enhanced regulation and controlled release of these micronutrients, the recent literature has highlighted the utilization of nanotechnology as a promising avenue [16,17]. This approach offers an alternative to achieve optimal concentrations that mitigate inhibition while ensuring effective utilization. Capitalizing on nanotechnology’s ability to manipulate matter within the nanoscale range (1 to 100 nm), nanoparticles (NPs) exhibit unique characteristics that enhance their interaction with biological systems. This interaction, facilitated by small, mesoscopic objects, quantum size, and surface effects, underscores NPs’ potential to improve AD by enhancing compound mobility, interaction, and distribution within cellular processes [18,19,20].
Prior research has delved into the application of NPs to enhance biogas production across diverse waste types. For instance, Henssein et al. [21] found that CH4 production increased through the incorporation of NPs, with specific NP concentrations yielding notable improvements. A study by Amo-Duodu et al. [22] explored the use of aluminum ferrite (AlFe2O4) and magnesium ferrite (MgFe2O4) NPs, demonstrating their impact on CH4 production through biochemical methane potential (BMP) assays in wastewater. Abdeslam et al. [18] observed substantial CH4 yield increases in cattle manure AD upon adding metallic NPs.
Despite these strides, there remains an unaddressed research gap concerning the application of NPs as micronutrient sources to optimize biogas production from sugarcane industry residues through co-digestion. Our previous work [8] explored the co-digestion of these residues and characterized microbial communities. Continuing this research direction, the present study conducted reactor operations under identical experimental conditions as the previous work, with the incorporation of Iron (III) Oxide (Fe3O4) NP to evaluate their influence on biogas production.
The objective of this study was to investigate the feasibility and effects of nanoparticle-assisted co-digestion for enhancing biogas production from sugarcane industry residues. Specifically, the aim was to optimize the biological process of biogas production. First, the optimal concentration of Fe3O4 nanoparticles through Batch assays was identified. Additionally, the study intended to assess the performance of a semi-continuous reactor operated with the co-digestion of vinasse, filter cake, and deacetylation liquor, supplemented with the optimal concentration of Fe3O4 NP, while characterizing the involved microbial communities. By addressing this knowledge gap and contributing to biorefinery integration, the research aimed to provide valuable insights into the application of this approach for optimizing sustainable biogas production from sugarcane industry residues.
2. Materials and Methods
2.1. Residues and Inoculum
The substrates included vinasse and filter cake from the Iracema sugarcane mill (São Martinho group, Iracemápolis, São Paulo (SP) state, Brazil) and the liquor from the straw pretreatment process, and were performed at the National Biorenovables Laboratory (LNBR) from the Brazilian Center for Research in Energy and Materials-Campinas-SP, Brazil (CNPEM). Deacetylation pre-treatment was applied to sugarcane straw on a bench scale as described in Brenelli et al. [10]. The anaerobic consortium of the mesophilic reactor (BIOPAC®ICX—Paques) from the aforementioned Iracema mill was used as inoculum. The substrates were characterized in terms of solids series, volatile solids (VS), and total solids (TS) through method 2540 and pH (pHmeter PG 1800) according to Standard Methods—APHA [23], Organic acids (OA), alcohol, carbohydrates, in High-Performance Liquid Chromatography (HPLC, Shimadzu®, Campinas, Brazil). The HPLC consisted of a pump-equipped apparatus (LC-10ADVP), automatic sampler (SIL-20A HT), CTO-20A column at 43 °C, (SDP-M10 AVP), and Aminex HPX-87H column (300 mm, 7.8 mm, BioRad). The mobile phase was H2SO4 (0.01 N, Merck, 99.99%) at 0.5 mL min−1. The inoculum was characterized in terms of VS and TS. The inoculum presented 0.0076 ± 0.00 g mL−1 in terms of VS and 0.0146 ± 0.00 in terms of TS. The vinasse presented 0.014 ± 0.00 g mL−1 of VS and 0.0176 ± 0.00 g mL−1 of TS, the deacetylation liquor 0.0123 ± 0.00 g mL−1 of VS and 0.0219 ± 0.00 g mL−1 of TS, and filter cake 0.5454 ± 0.53 g mL−1 of VS and 0.6197 ± 0.54 g mL−1 of TS. The pH of the inoculum was 8.57 ± 0.14, the pH of vinasse was 4.25 ± 0.17, and the deacetylation liquor the pH was 9.86 ± 0.15. The elemental composition was performed for the characterization of filter cake in the Elementary Carbon, Nitrogen, Hydrogen, and Sulfur Analyzer equipment (Brand: Elementar; Model: Vario MACRO Cube—Hanau, Germany) was obtained 1.88% of N, 31.07% of C, 6.56% of H, and 0.3% of S, all in terms of TS.
The characterization in terms of OA, alcohol, and carbohydrates for liquid residues is presented in Table 1.

Table 1.
Characterization of OA, carbohydrates, and alcohols of liquid residues.
2.2. Batch Tests
Batch tests were performed for the co-digestion of residues (vinasse + filter cake + deacetylation liquor) in the proportion of 70:20:10 (in terms of VS), respectively, following our previous work [8], with different concentrations of Fe3O4 NP to identify the best concentration to be used in the s-CSTR reactor. The tests were conducted in 250 mL Duran flasks, under 55 °C, in which the inoculum was acclimated initially. On the first day, the temperature was increased to 40 °C and then to 45 °C, and within 4 days it reached 55 °C. The inoculum was then kept for 1 week at 55 °C before the experiment start-up. The experiments were conducted in triplicate, with a 2:1 inoculum-to-substrate ratio (in terms of VS) added to each flask, following the protocol of Triolo et al. [24] and the VDI 4630 methodology [25]. The pH of solution flasks was corrected to neutrality by adding solutions of NaOH (0.5 M-Merck, 99%, granular) or H2SO4 (1M, Merck, 99.99%) when necessary. N2 flowed into the headspace of each vial. The biogas produced was collected from the headspace with the Gastight Hamilton Super Syringe (1 L) syringe through the flasks’ rubber septum. Gas chromatography analyzes were also carried out to detect the concentration of CH4 produced in the gas chromatograph (Construmaq MOD. U-13 São Carlos). The carrier gas was hydrogen (H2) gas (30 cm s−1) and the injection volume was 3 mL. The GC Column was made of 3-m-long stainless steel, 1/8 inch diameter, and packaged with Molecular Tamper 5A for separation of O2 and N2, and CH4 in the thermal conductivity detector (TCD). Digestion was terminated when the daily biogas production per batch was less than 1% of the accumulated gas production. After the assay, the values were corrected for standard temperature and pressure (STP) conditions (273 K, 1.013 hPa).
The different concentrations of Fe3O4 NP used in each bottle are described in Table 2 and are depicted in the diagram shown in Figure 1. The choice of concentrations was made based on studies with NP and AD that the literature shows [18,26]. It is worth mentioning that a control flask was made (Flaks 1-Table 2), adding only the inoculum and co-digestion, without NP, to compare with the other bottles that contained NP and to evaluate the optimization of the process. Analysis of variance (ANOVA) was used to identify the existence of significant differences between the treatments (p < 0.05).

Table 2.
Design of experiments of Batch Assays.
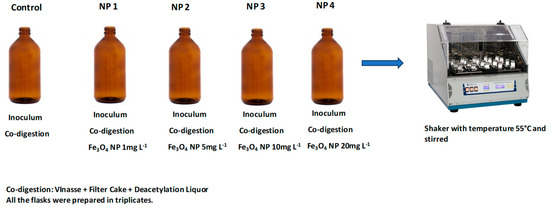
Figure 1.
Graphical representation of the Batch Assays experiment conducted with different concentrations of NP as shown in Table 2.
2.3. Operation of Semi-Continuous Stirred Tank Reactor (s-CSTR)
The s-CSTR operation was followed according to previous work by our research group [8]. The 5 L Duran flask with 4 L working volume was kept under agitation at 150 rpm by using an orbital shaking table Marconi MA 140. The operating temperature was 55 °C, maintained by recirculating hot water through a serpentine. The reactor was fed once a day with a blend of co-substrates (in terms of volatile solids, VS): 70% of vinasse, 20% of filter cake, and 10% deacetylation liquor totaling 33.45 gVS L−1. The Organic Load Rate (OLR) was increased throughout the operation to reach the maximum OLR without the reactor collapsing. Fe3O4 NP was added before each OLR increase, which occurred only after reactor stabilization in the respective OLR in terms of CH4 production. Table 3 presents the operational parameter values applied to the s-CSTR according to the respective operation phases and the days on which Fe3O4 NP were added.

Table 3.
Reactor operation phases and the respective applied OLRs, feeding rate flows, and HRT.
s-CSTR Monitoring Analyses
The volume of biogas produced was measured using the Ritter gas meter in Germany. The CH4 content was determined by gas chromatography (Construmaq-MOD U-13, São Carlos, with H2 as the carrier gas) five times a week. OA, carbohydrates, alcohols, and organic matter content (in terms of VS) in the digestate were monitored following the same methodology described in the characterization of residues (Section 2.1). The alkalinity from digestate was also determined using the titration method APHA [23]. The pH and the oxidation-reduction potential (ORP) of digestate were measured immediately after sampling (before feeding) using a specific electrode for Digimed ORP. The pH was monitored also in the feed. All reactor monitoring analyses were followed by Volpi et al. [8].
2.4. Molecular Analysis in Biological Studies
The microbial community of the inoculum was identified before being inserted in reactor- Sample A1 and after CH4 production was stabilized in the OLR of 4 gVS L−1 day−1 (Sample A2) in order to evaluate the change in the microbial community with the changes of the metabolic routes for the CH4 production and with the addition of Fe3O4 NP. The extraction and quantification and sequencing protocol were followed as described in Volpi et al. [8]. For genomic DNA extraction, PowerSoil DNA Isolation Kit (Mobio) was used, and for visual confirmation of the integrity of the DNA extracted, a run on a 1% agarose gel stained with SYBR® Safe (Invitrogen) was performed. The large-scale sequencing of the V3-V4 region of the 16S ribosomal RNA gene from Bacteria and Archaea was done using the Illumina MiSeq platfor. Raw sequences deposited in BioSample NCBI under accession number BioProject ID PRJNA781620.
2.5. NP Preparations and Characterization
Fe3O4 NP was used due to the better performance of these NP in AD according to the literature [18,27,28]. The Fe3O4 NP used were IRON (II, III) OXIDE, NANOPOWDER, and 50-100 N-SIGMA-ALDRICH (97% trace metals). They were then diluted in distilled water at pH 7 in a glass bottle. Sodium dodecylbenzene sulfonate (SDS) at 0.1 mM was used as a dispersing reagent to ensure NP dispersion before use, as SDS has been shown to not significantly affect CH4 production [21,26]. To characterize the size of these NP, an analysis was performed on the Laser Diffraction Particle Size Analyzer—MASTERSIZER-3000 (MALVERN INSTRUMENTS––MAZ3000––Malvern, Worcestershire, UK). Measurements were taken in Wet Mode—HIDRO EV. The mathematical model used was Mie. It considers that the particles are spherical and that they are not opaque, thus taking into account the diffraction and diffusion of light in the particle and the medium. They were made for samples of pure NP.
3. Results
Figure 2 shows the size and distribution of Fe3O4 NP diluted in water pH 7. Figure 2a shows two populations, one up to nano size (0.1 µm) and the other that starts from 0.3 µm and that is not considered an NP.
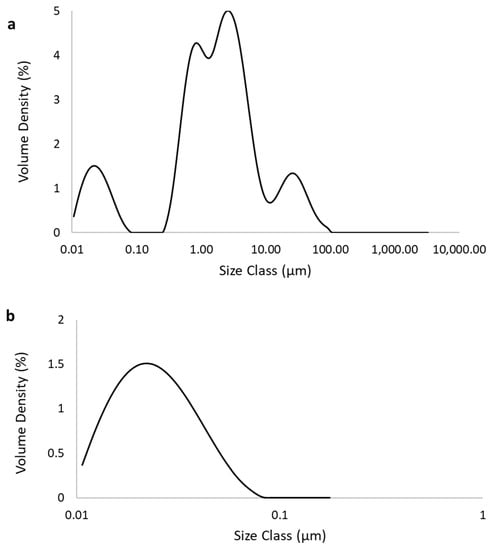
Figure 2.
Size of Fe3O4 Nanoparticles (NP): (a) Involving all particles in the sample; (b) Nanosize cut of the particles.
Another important factor is that the Fe3O4 NP used in this work have a spherical shape (Figure 3), and this improved CH4 production in the work of Abdsalam et al. [19], which is explained by the greater membrane wrapping time required for the elongated particles.
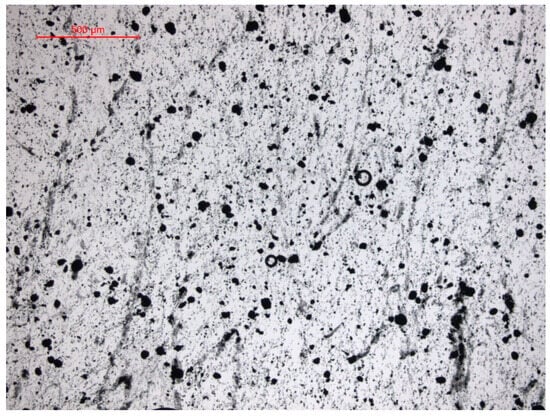
Figure 3.
Mastersize images (50×) showing Fe3O4 NP.
Table 4 shows the results of the specific accumulated CH4 in triplicate of each of the tests with different concentrations of Fe3O4 NP, and Figure 4 presents the cumulative CH4 production over time.

Table 4.
Final specific cumulative CH4 production from the co-digestion in different concentrations of Fe3O4 NP.
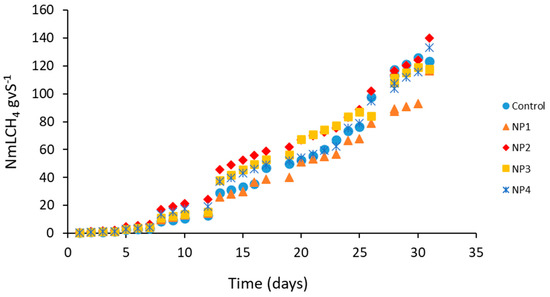
Figure 4.
Specific cumulative CH4 production according to the concentrations of Fe3O4 nanoparticle (NP) additions to co-digestion. NP1: 1 mg L−1; NP2: 5 mg L−1; NP3: 10 mg L−1; NP4: 20 mg L−1.
Figure 5 shows the results obtained from CH4 production and organic matter removal according to the different applied OLRs. Along phases I and II, an intense variation in the organic matter removal was observed, from 30% to 70%, while the CH4 production remained stable, ranging from 0.1 to 0.5 NLCH4 gVS−1. These variations are characteristic of the acidogenic phase, marking the reactor start-up. After approximately 60 days (phase III), both the CH4 production and the organic matter removal maintained higher stability, indicating that the reactor entered the methanogenic phase. Between phase IV and phase V, the CH4 production remained around 0.5 and 1 NLCH4 gVS−1 within an increasing trend. In phase VI, after the addition of Fe3O4NP, there was a 40% increase in CH4 production (122 days), corresponding to the highest CH4 production throughout the entire operation: 2.8 ± 0.1 NLCH4 gVS−1 and the removal of 71 ± 0.9% of organic matter. In phase VII, CH4 production started to decrease, although the organic matter removal remained stable. In phase VIII, CH4 production remained low (0.09 ± 0.03 NLCH4 gVS−1) and organic matter removal continued to decrease (51 ± 2.8%), reaching the collapse of the reactor in phase IX.
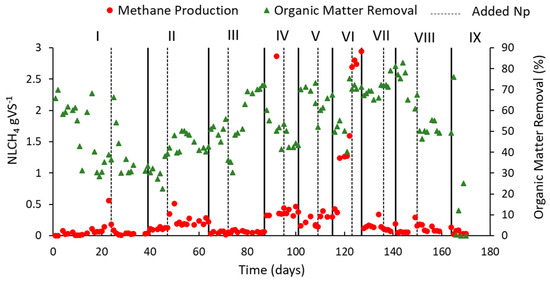
Figure 5.
Methane production and organic matter removal with the reactor operation according to the applied OLRs (gVS L−1 day−1): 2.0 (Phase I); 2.35 (Phase II); 3.0 (Phase III); 4.0 (Phase IV); 4.7 (Phase V); 5.5 (Phase VI); 6.6 (Phase VII); 8.0 (Phase VIII); 9.0 (Phase IX).
Figure 6a shows the results obtained from the reactor inlet and outlet pH, as well as the results of oxide-reduction potential (ORP).
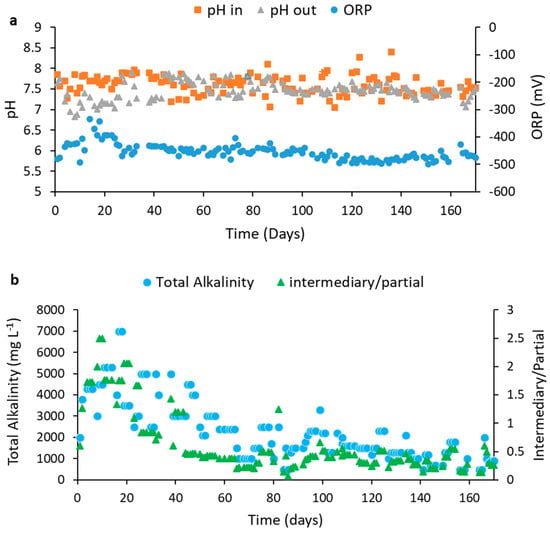
Figure 6.
pH, Oxidation Reduction Potential (a) and Alkalinity (b) along with the reactor operation according to the applied OLRs (g VS L−1 day−1): 2.0 (Phase I); 2.35 (Phase II); 3.0 (Phase III); 4.0 (Phase IV); 4.7 (Phase V); 5.5 (Phase VI); 6.6 (Phase VII); 8.0 (Phase VIII); 9.0 (Phase IX).
The outlet pH in the first days of the reactor operation was around 6, and it was necessary to adjust the inlet pH to neutrality daily, while a high variation in the ORP values was detected. These characteristics mark acidogenesis, and the intense oxidation reduction reactions typical of the AD process [29]. After 60 days, the pH remained between 7.5 and 8 until the end of the operation, indicating that from this date on, the reactor entered the methanogenesis phase: the pH remained stable and no more pH adjustment at the reactor inlet was needed. The same occurred for the ORP values, which remained around −460 and −490 mV after 60 days.
Figure 7 shows the results obtained from OA and carbohydrates and alcohol.
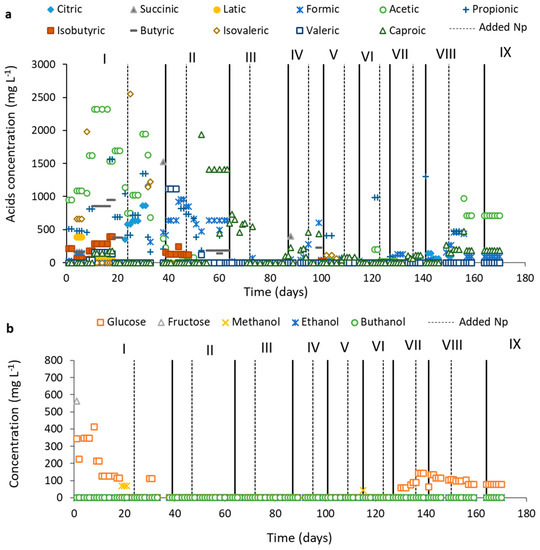
Figure 7.
Values of Organic acids (a), Carbohydrates and Alcohols (b), along with the reactor operation based on the applied OLRs (gVS L−1 day−1): 2.0 (Phase I); 2.35 (Phase II); 3.0 (Phase III); 4.0 (Phase IV); 4.7 (Phase V); 5.5 (Phase VI); 6.6 (Phase VII); 8.0 (Phase VIII); 9.0 (Phase IX).
In phases I and II (Figure 7a), the presence of high concentrations of OA was following the reactor start-up (the acidogenic phase). After 60 days, the concentrations of these OA considerably decreased, indicating the entrance of the reactor in the methanogenic phase and agreeing with Figure 5.
Figure 8 and Table 5 show the observed values of richness (number of species-a) and the calculated values from diversity (Shannon index-b) and wealth estimates (Chao1 estimator-c) of the samples. The results show that the number of species (Figure 8a) and the richness (Figure 8b) of the A1 samples was higher than that of the A2 sample. This behavior is expected for these results as the A1 samples are samples from the initial inoculum, that is, from the inoculum without having been inserted into the reactor. The A2 samples are from the inoculum when the CH4 production was stabilized, that is to say, the microbial community present is already “selected” for the specific metabolic route of CH4 production according to the substrates used. In addition, the inoculum of Sample A1 comes from a mesophilic reactor, while Sample A2 comes from a thermophilic reactor. Process temperature differences may have also led to this difference between species of microorganisms. These results are consistent with our previous work [8], indicating that the presence of NP did not influence the diversity of microorganisms and the change in the microbial community from one sample to another.
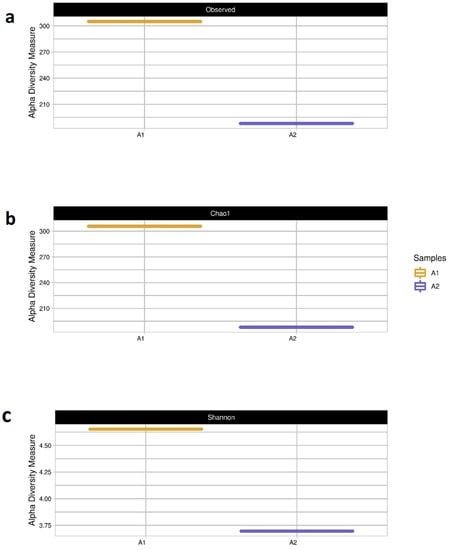
Figure 8.
The recorded values of (a) species abundance (number of species), (b) estimated species richness (Chao1 estimator), and (c) computed diversity values (Shannon index) for sample 1 (seed sludge) and sample 2 (sludge from Phase IV of stable s-CSTR operation).

Table 5.
Number of Alpha diversity Measurements from (A) species abundance (number of species), (B) estimated species richness (Chao1 estimator), and (C) computed diversity values (Shannon index).
Figure 9 shows the results obtained from phylum for Bacteria order (a) and Archaea order (b) from samples A1 and A2.
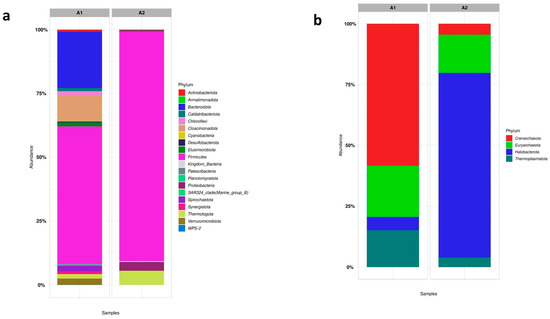
Figure 9.
The proportional representation of microorganisms at the phylum level in the Bacteria order (a) and Archaea order (b) in the seed sludge (Sample A1) and the s-CSTR sludge with stable CH4 production (Sample A2).
Following what was discussed above, the phyla variety found in sample A1 (Figure 9a) was much larger than those found in A2. In sample A1, the principal phyla found from the Bacteria order were: (~25%) Bacteroidota, (~15%) Cloacimonadota, (~50%) Firmicutes, and (~2%) Spirochaetota. Microorganisms of the phylum Bacteroidota, Cloacimonadota, and Spirochaetota are generally found in mesophilic processes and are the bacteria responsible for the fermentative and hydrolytic steps of AD [30,31]. The presence of these three phyla in the A1 sample and the absence of them in the A2 sample indicates how the temperature influenced the change in the bacterial community, as the A1 inoculum comes from a mesophilic process.
Figure 10 shows the main genera found for samples A1 and A2 to the Bacteria order (a) and the Archaea order (b). As previously discussed, the A1 sample presented a very large microbial diversity, with no genus that was predominant in the process concerning the Bacteria order. Its genera of microorganisms come from the main phyla (Bacteroidota, Cloacimonadota, Firmicutes) and are characteristic of acidogenic and hydrolytic processes.
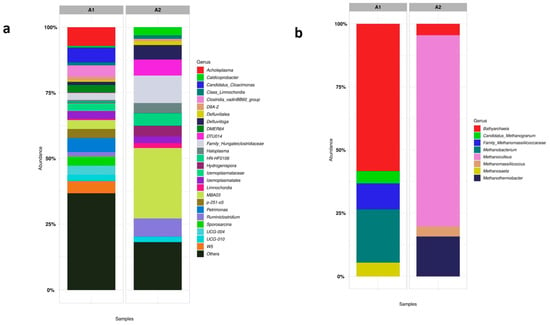
Figure 10.
The proportional representation of microorganisms at the genus level in the Bacteria order (a) and Archaea order (b) in the seed sludge (Sample A1) and the s-CSTR sludge with stable CH4 production (Sample A2).
Sample A2 contains some genera of the Bacteria order that stand out, such as (~5%) Defluvitoga, (~3%) Hydrogenispora, and (~9%) Ruminiclostridium. These genera were also present in the reactor operation without the presence of Fe3O4 NP [8].
4. Discussion
4.1. Characterization of Fe3O4 NP
The results from Figure 2 show that the sample used also contained particles larger than NP. The average size, including the two populations, was 180 ± 0.05 nm. This behavior of the larger sizes found for Fe3O4 NP was also reported by Hansein et al. [21] who found sizes between 96–400 nm. In the work by Abdsalam et al. [20], Fe3O4 NP sizes did not exceed 7 ± 0.2 nm. It is worth mentioning that the NP used by Abdsalam et al. [20] were synthesized, and that the NPs used by the present study and by Hansein et al. [21] were obtained commercially. The size of NP is extremely important for the process as it can affect the binding and activation of membrane receptors and the expression of proteins [32], thus acting to stimulate the growth of methanogenic archaea [33].
For better visualization, a cut in the graph was made of particles found only in nano size, which are shown in Figure 2b. The average size of these Fe3O4 NP was 23.56 ± 0.05 nm, which can be considered a greater size, as some authors have reported a decrease in CH4 production by using Fe NP greater than 55 nm [21,34].
Apart from the particle size, other factors that play a role in stimulating CH4 production are the NP concentration added, the type of substrate, and the interaction between them [18]. The preliminary tests of batch assays with different concentrations of NP Fe3O4 enabled us to assess such factors. The zeta potential (ZP) analysis of the NP was also performed to evaluate their dispersibility in the medium; however, as the NPs used are magnetic particles and have sizes larger than nano, the dispersion remained unstable, which invalidates these results. The same condition has already been reported by Gonzalez et al. [34].
4.2. Batch Preliminary Assays
There was no significant difference between treatments with different concentrations of Fe3O4 NP (p-value = 0.1357 with p < 0.05). Although there was no significant difference, NP 2, NP 3, and NP 4 assays presented higher CH4 production than the control (Figure 4), while NP 1 was below the control. The NP 2 test showed a 13% increase in CH4 production compared to the control, while the NP 4 test showed a 7% increase in CH4 production (Table 4).
In the work of Hansein et al. [21], a 25% increase in CH4 production was obtained using 15 mg L−1 of NP Fe3O4 in BMP assays with poultry litter residues under mesophilic conditions. However, a higher CH4 concentration (34%) was obtained using NP Ni with a concentration of 12 mg L−1. The specific substrate characteristics, the experimental conditions, and the origin of the inoculum may influence these differences in production. The addition of Fe3O4 NP may also cause the short lag phase, according to Krongthamchat et al. [35].
Although no significant difference in CH4 production was observed in the preliminary tests, the concentration of 5 mg L−1 of NP Fe3O4 (NP 2 experiment) was chosen to be applied in the s-CSTR reactor, which showed a higher increase in the CH4 production compared to the control. It is also known that NP is not easy to separate from biodegradable waste, which may subsequently cause an accumulation of inorganic pollutants (usually heavy metals) inside anaerobic digesters [36]. For this reason, the selection of the lowest NP concentration was reinforced to cause less environmental impact on AD. The differences in the operation of the continuous reactor with the addition of NP were compared to the same reactor operation, but without the addition of NP [8].
4.3. Analysis of s-CSTR Operational Efficiency
4.3.1. Biogas Generations and Reactor Performance
In our previous study, Volpi et al. [8], the co-digestion of the same residues in a semi-CSTR without NP addition reached 0.233 ± 1.83 NLCH4 gSV−1 and 83.08 ± 13.30% organic matter removal. Compared to the present work, the CH4 production from the semi-CSTR containing NP was 91% higher, and the possible reason for this occurrence might have been that the presence of Fe3O4 NP contributed to the better development and performance of the microbial community concerning the organic matter conversion to CH4, as Fe is a growth stimulant of methanogenic Archaea and they are dependent on this element for enzyme synthesis [14,37]. In addition, the maximum CH4 production and the reactor collapse from the previous work [8] occurred in the OLRs of 4.16 gVS L−1 day−1 and 5.23 gVS L−1 day−1, respectively, while in the present work, this occurred in the respective OLR of 5.5 gVS L−1 day−1 and 9 gVS L−1 day−1. In the work by Ameen et al. [38], which utilized animal manures as a substrate, specifically chicken manure (CM), pig manure (PM), and cow dung (CD), a maximum CH4 production of 0.442 L/gVS was obtained along with a 68% reduction in VS. Although it was slightly higher compared to the previous study without added neutralizing agents (NP) [8], it was much lower than the current study, which achieved an addition of approximately 2 NLCH4/gVS due to the inclusion of NP. This fact indicates that the presence of Fe3O4NP allows the application of larger OLRs, resulting in larger fed volumes to the reactor and, consequently, the treatment of larger waste volumes.
Hassanein et al. [21] obtained a maximum cumulative production of 339 mLCH4 gVS−1 from poultry litter in BMP assays, with the addition of 15 mg L−1 Fe3O4 NP, while Abdsalam et al. [20] reported 351 mLCH4 gVS−1 from manure in BMP tests, with 20 mg L−1 of Fe3O4 NP addition. The literature reported using NP in BMP assays and smaller vials to assess NP activity. It is worth mentioning that the use of the substrate with the type of NP interferes with CH4 production, and that NP concentration has also been used to interfere. In the work by Abdsalam et al. [18] and Liang et al. [39], it was confirmed that Ni NP best impacted the increase in CH4 production in the use of municipal solid waste. In the study by Ali et al. [27], four concentrations of Fe3O4 NP (50, 75, 100, and 125 mg L−1) were tested in assays with municipal solid waste. The results showed that the addition of 75 mg L−1 Fe3O4 NP increased the CH4 production by 53.3%. In contrast, less CH4 production was observed by adding a high concentration of Fe3O4 NP.
Absalam et al. [18] showed that the addition of Fe3O4 magnetic NP increased microbial activity during start-up to 40 days of HRT (VS decomposition 4.15%). However, in the present study, an increase in microbial activity was observed in the middle of the operation (phases IV, V, and VI after 90 days), which was in agreement with Quing Ni et al. [37], who indicated that during the exposure of 50 mg L−1 of magnetic NP, the adverse effects were insignificant in the microbial consortium and concluded that magnetic NP appeared to be non-toxic during long-term contact. The best performance was due to the presence of Fe2+/Fe3+ ions, introduced into the reactor in the form of NP that could be adsorbed as the growth element of anaerobic microorganisms [18]. In addition, Fe3O4 magnetic NP ensures a distribution of the iron ions in the slurry through the corrosion of the NP, thus maintaining the iron requirement of the reactor supplied [18]. The presence of NP also shows a possible effect on the hydrolysis-acidification process, increasing the reduction of the substrate, as there were increasing amounts of organic matter removed in phases V, VI, and VII, and a subsequent increase in CH4 production.
4.3.2. Evaluation of pH, ORP, and Alkalinity Readings
In our previous work, methanogenesis was established only after 90 days, with stabilization of the pH and ORP values [8]. In this present work, methanogenesis was established about 30 days before, indicating that the presence of NP played a role in this fact, as the addition of Fe3O4 NP has already been reported to reduce the AD lag phase [20]. In addition, Feng et al. [40] showed that the addition of Fe in the AD system can directly serve as an electron donor to reduce into through autotrophic methanogenesis, causing improvement of CH4 production, according to reactions (1)–(3):
From this process, the substrates are deprived of hydrogen ions (H+), which increases the pH of the substrate, and the capture of CO2 also prevents the formation of carbonic acid, increasing the pH of the substrate [20]. This may explain the increase in pH after 24 days (Table 3) as it was the first addition of Fe3O4 NP. The methanogenesis process was also stimulated, as this nano additive served as an electron donor that could reduce CO2 into CH4.
At the beginning of the operation, the ORP varied between −350 and −550 mV, and this variation is a characteristic of acidogenesis and reactor start-up [8]. However, this variation in a start-up was much smaller than that reported by Volpi et al. [8] (−800 and −300 mV), indicating the greater stability of the operation. After approximately 40 days (Figure 6a), it was observed that the ORP remained practically constant until the end of the operation, varying between −480 and −400 mV, although the literature shows that ORP less than −300 mV, CO2, and acetate are converted into CH4 in AD [41]. These low ORP values in the system are characteristic of the presence of Fe NP as they reduce the system’s ORP to increase the conversion of complex compounds to volatile fatty acids and to be able to provide ferrous ions for the growth of fermentative and methanogenic Archeae [42].
It is important to demonstrate that the practically constant ORP values are in agreement with the OA values (Section 4.3.2), which are in extremely low concentrations when the reactor stabilizes in methanogenesis. Here, it is worth emphasizing that the differences in the ORP values found in the literature vary due to the different raw materials applied, experimental conditions, and the type of NP used.
Figure 6b shows the results of alkalinity obtained during the operation. It can be observed that the alkalinity was high for up to 60 days and followed the presence of OA (Figure 7a, Section 4.3.2), characterizing the acidogenic step of the process. After 60 days, the intermediate/partial alkalinity (IA/PA) was below 0.3, which is considered ideal for AD, as it demonstrates stability [40]. Similar to the behavior of the ORP, the IA/PA also remained stable throughout the process, showing self-regulation of methanogenesis. In our previous study [8], such alkalinity stability only happened after 90 days, confirming the hypothesis that the presence of Fe3O4NP has reduced the lag phase. In addition, Fe3O4NP can absorb inhibitory compounds and act as a pH buffer, further improving the alkalinity of the process.
4.3.3. Assessment of Degradation Pathways: OA, Carbohydrate, and Alcohol Indications
At the beginning of the reactor operation (phase I), the concentration of acetic acid was relatively high, which is favorable for the CH4 production process as it is the main precursor of the CH4 metabolic route [43]. In addition to acetic acid, there was also the presence of propionic acid, which can be inhibitory to the metabolic pathway of CH4 production in concentrations above 1500 mg L−1 [44]. However, this concentration decreased in phase I and phase II, and the acetic acid concentration increased at the end of phase II, indicating that the route of conversion of propionic acid to acetic acid may have prevailed at the beginning of the operation, as also occurred in our previous study [8]. It is worth mentioning that in the presence of low H2 pressure, propionic acid consumption is favored [43], and Fe is a trace element whose main substrate for oxidation-reduction reactions is H2 [14]. The presence of Fe3O4 NP may have favored the consumption of H2, according to reaction (4) and reaction (1), and consequently contributed to the consumption of propionic acid, favoring the formation of acetic acid, having been converted to CH4:
In phases I and II, the presence of formic acid can be observed, and its conversion to acetic acid is typical of acidogenesis [14]. Therefore, in addition to the conversion of propionic acid to acetic acid, the conversion of formic acid to acetic acid may also have occurred at the end of acidogenesis, marking the beginning of methanogenesis (phase III-Figure 7a). In addition, the presence of Fe NP can increase the production of acetate and donate electrons for direct conversion of CO2 into CH4 by autotrophic via methanogenesis [45].
The Fe (III) reduction reaction is a favorable process to directly oxidize organics into simple compounds [46], increasing the consumption of OA, and eliminating compounds that may be toxic to the process, by stimulating microbial growth, synthesis of necessary enzymes within the oxidation-reduction reactions, and, consequently, greater efficiency in the digestion of organic matter [14,44]. The positive effect of Fe (III) supplementation was attributed to the favorable redox conditions, which all avoided the thermodynamic limitations on organic acid degradation. Furthermore, Fe (III) can precipitate H2S minimizing related inhibition phenomena [47]. The control of OA can allow a greater capacity of feed of the digester without affecting the performance of digestion significantly [33], and this is what happened in the present study as the OLRs used were higher than in the previous experiment [8], with higher fed volumes and a stable operation achieving higher CH4 production.
The presence of caproic acid draws attention at the end of phase II and the beginning of phase III (Figure 7a). Caproic acid is produced by lengthening the chain of short-chain volatile fatty acids, such as acetic acid and butyric acid through an oxidation reaction, in which some species gain energy by increasing the length of the volatile organic acids chain with reducing substrates, such as ethanol and lactic acid [48]. However, in the operation, neither the presence of lactic acid nor ethanol was detected (Figure 7a,b), but it seems that Fe3O4 NP may have acted as this reducing substrate, gaining electrons and allowing an increase in the chain of butyric and acetic acids. This fact may also have been caused by the continuous feeding process of the reactor, in which Fe3O4 NP was added with a certain frequency, having a constant availability of the electron donor for the formation of caproic acid, in agreement with what Owusu-Agyeman et al. [48], who demonstrated that caproic acid increased from 1.3 to 7%, 1.6 to 9%, 2 to 11%, and 2 to 13% with the increasing organic waste fraction. Even with the possible change of the route for caproic acid production, CH4 production prevailed, indicating the self-regulation of the microbial consortium for the metabolic route of CH4. Although not the focus of this work, the addition of Fe3O4 NP with the residues of the sugarcane industry can stimulate caproic acid production, an organic acid that has high added value because it is used as antimicrobials for animal feed and precursor aviation fuel [49].
Figure 7b shows that at the beginning of the operation, there was greater availability of glucose, and when the reactor entered the methanogenesis phase, the glucose concentration was very low, indicating the self-regulation of the process for CH4 production. When the reactor began to decrease its CH4 production, phases VII and VIII, the concentration of glucose increased again, indicating the start of the reactor collapse.
4.3.4. Assessing the Diversity of Microbial Communities
The Shannon index (Figure 8a) obtained from sample A1 was close to 5.0, while that from sample A2 was less than 3.75. As discussed by Volpi et al. [8], when the value of the Shannon index is greater than 5.0, it indicates greater microbial diversity in anaerobic digesters [50]. Thus, it can be seen that the A2 sample has a much lower microbial diversity than the A1 as these microorganisms are in stabilized metabolic routes for CH4 production, indicating that this microbial community is even more specific.
The large presence of the Firmicutes phylum in Figure 9 is to be expected as they are one of the main phyla of anaerobic processes, and most cellulolytic bacteria belong to them [51]. In sample A2, the main phyla found are (~80%) Firmicutes, (~2%) Proteobacteria, and (~5%) Thermotogota. The Thermotogota phylum is characteristic of thermophilic processes [52], and bacteria of the Protobacteria phylum are characteristic of degrading lignocellulosic material [53]. It is important to mention that these two last phyla are present in smaller proportions in sample A1, indicating the possibility of a change in the microbial community due to experimental conditions and used substrates. Furthermore, in our previous work [8], these same phyla were found in the sample when the reactor was stabilized for CH4 production, indicating that the presence of Fe3O4 NP did not influence the change in the microbial community concerning Bacteria order. Zhang et al. [47] showed that the presence of Proteobacteria followed by Firmicutes were the central syntrophic acetogenins for propionate oxidation via the methyl malonyl-CoA pathway, perhaps indicating the presence of this metabolic route when CH4 production stabilized, as discussed in Section 4.3.1.
Concerning Archaea order phyla, in sample A1, Euryarchaeota was observed (~25%), and this was also the case in sample A2 (~20%) of the same phylum. This phylum is characteristic of methanogenic Archaea, responsible for CH4 production. In addition to this main phylum, other phyla of the Archaea order were also found, such as Crenarchaeota, and Halobacterota, but they are not highly relevant to the results of CH4 production, which was the focus of this work.
About the genus presented in Figure 10, the Defluvitoga genus, belonging to the phylum Thermotogota, is reported to be dominant in the degradation of organic materials in CSTRs or thermophilic bioelectrochemical reactors [54]. Ruminiclostridium, belonging to the phylum Firmicutes, are hydrolytic bacteria characterized by metabolizing cellulosic materials, with a high concentration of lignocellulose [55], which is the case of residues used in reactor operation. In the work by Kang et al. [55], wheat straw was used for AD, and bacteria belonging to the genus Ruminiclostrium and Hydrogenispora were found as the main microorganisms. This fact leads to the association that such bacteria are present in the degradation of lignocellulose substrates as wheat straw and residues from the present work have a similar composition.
Hydrogenispora is acetogenic bacteria, which can ferment carbohydrates such as glucose, maltose, and fructose into acetate, ethanol, and H2 [55]. These bacteria can act in conjunction with hydrogenotrophic methanogens. In Figure 10b, the predominant methanogenic Archaea in sample A2 was (~70%) Methanoculleus. This methanogenic Archaea is characterized by acting syntrophic oxidation of acetate (SAO) coupled with hydrogenotrophic methanogenesis [56]. Furthermore, it was also the main methanogenic found in the work by Volpi et al. [8]. Therefore, despite the addition of NP in the reactor, the presence of the microbial community was not altered and, therefore, the metabolic routes were also the same. The presence of NP only encouraged the activity of the methanogenic Archaea, and since the substrates used and experimental conditions were the same, there was no change in the metabolic route. The genus (~15%) Methanotermobacter was also found in sample A2. This genus is characterized by being present in thermophilic AD and belongs to the obligate-hydrogenotrophic methanogens [57]. This fact corroborates the possibility that the predominant metabolic route in the co-digestion of vinasse, filter cake, and deacetylation liquor is acetate (SAO) coupled with hydrogenotrophic methanogenesis. Furthermore, it was discussed in Section 4.3.2 that in the presence of low H2 pressure, propionic acid consumption is favored, and Fe is a trace element whose main substrate for oxidation-reduction reactions is H2. This confirms the fact that the presence of Fe3O4 NP may have reinforced that the main metabolic pathway for the co-digestion of these residues through hydrogenotrophic methanogens.
In sample A1 (Figure 10a), (~20%) Methanobacterium and (~7%) Methanosaeta were found. Methanobacterium is known as hydrogenotrophic methanogen while Methanosaeta is known as an obligate-acetoclastic methanogen and has a strong affinity to acetate [57]. These two genera were not found in sample A2, indicating that there was a change in the microbial community from sample A1 to A2 due to different substrates and experimental conditions.
5. Conclusions
The use of Fe3O4 NP allowed optimization of the biological process of co-digestion of 1G2G ethanol industry residues, providing an increase of approximately 90% in CH4 production. The concentration of 5 mg L−1 of Fe3O4 NP was ideal for a stable continuous operation with production stimulation and without process inhibitions.
These NP proved to favor the reduction of the lag phase of the process through a stabilized reactor operation. The reactor collapsed in OLRs of 9 gVS L−1 day−1, which was an OLR almost two times larger than that used in the operation without the presence of NP (9 vs. 5 gVS L−1 day−1). Furthermore, the methanogenesis was stabilized after 60 days of operation, which was 30 days earlier than the operation without the addition of NP.
Fe3O4 NP did not influence the possible metabolic pathways of the process; on the contrary, they stimulated the growth of methanogenic Archaea, reinforcing that the main metabolic pathway of these residues in co-digestion is through hydrogenotrophic methanogenesis. Methanoculleus were the main methanogenic Archea found in the process, and Defluvitoga, Ruminiclostridium, and Hydrogenispora were the main genus of the Bacteria order in process, both with or without the addition of NP.
Overall, the Fe3O4 NP have proven to be promising sources for optimizing biogas production with a focus on CH4 generation within first and second-generation sugarcane ethanol biorefineries. This study successfully demonstrated that Fe NPs interact positively with lignocellulosic residues from sugarcane during anaerobic digestion. Additionally, novel approaches for obtaining this nanomaterial could be explored, such as producing Fe NP from discarded metal scraps, thereby adding value to the process and yielding economic benefits. Nevertheless, further research is necessary to gain a better understanding of the interaction between NPs and the biological system during reactor operation.
Regarding the challenges of our study and future works, a more comprehensive exploration of the interaction between nanoparticles and the microbial community is suggested, using transmission electron microscopy (TEM) and Fourier Transform Infrared Spectroscopy (FITR) analysis throughout the reactor operation in order to gain an in-depth understanding of how these nanoparticles interact with the boundaries of the microbial system. Additionally, research approaches such as metabolomics could provide enhanced insights into the metabolic pathways pursued by microorganisms and how nanoparticles have influenced these pathways.
Author Contributions
M.P.C.V.: conceptualization, investigation, resources, methodology, data curation, funding acquisition, and writing—original draft preparation. G.M.: methodology, resources, data curation, and writing—original draft preparation. B.d.S.M.: conceptualization, formal analysis, writing—review and editing, supervision, and funding Acquisition. All authors have read and agreed to the published version of the manuscript.
Funding
This research was funded São Paulo Research Foundation (FAPESP), grant numbers 2018/09893-1 to M.P.C.V., 2016/16438-3 to B.S.M.
Institutional Review Board Statement
Not applicable.
Informed Consent Statement
Not applicable.
Data Availability Statement
The data presented in this study are available on request from the corresponding author. Raw sequences deposited in BioSample NCBI under accession number BioProject ID PRJNA781620.
Acknowledgments
The authors gratefully acknowledge the support of the Environment and Sanitation Laboratory (LMAS) at the School of Agricultural Engineering (FEAGRI/UNICAMP), the National Laboratory of Biorenewables (LNBR/CNPEM), and the Interdisciplinary Center of Energy Planning (NIPE/UNICAMP).
Conflicts of Interest
The authors declare no conflict of interest.
References
- Karrabi, M.; Ranjbar, F.M.; Shahnavaz, B.; Seyedi, S. A Comprehensive Review on Biogas Production from Lignocellulosic Wastes through Anaerobic Digestion: An Insight into Performance Improvement Strategies. Fuel 2023, 340, 127239. [Google Scholar] [CrossRef]
- Nunes Ferraz, D.A., Jr.; Koyama, M.H.; de Araújo, M.M., Jr.; Zaiat, M. Thermophilic Anaerobic Digestion of Raw Sugarcane Vinasse. Renew. Energy 2016, 89, 245–252. [Google Scholar] [CrossRef]
- Fuess, L.T.; Kiyuna, L.S.M.; Ferraz, A.D.N.; Persinoti, G.F.; Squina, F.M.; Garcia, M.L.; Zaiat, M. Thermophilic Two-Phase Anaerobic Digestion Using an Innovative Fixed-Bed Reactor for Enhanced Organic Matter Removal and Bioenergy Recovery from Sugarcane Vinasse. Appl. Energy 2017, 189, 480–491. [Google Scholar] [CrossRef]
- Moraes, B.S.; Zaiat, M.; Bonomi, A. Anaerobic Digestion of Vinasse from Sugarcane Ethanol Production in Brazil: Challenges and Perspectives. Renew. Sustain. Energy Rev. 2015, 44, 888–903. [Google Scholar] [CrossRef]
- Almomani, F.; Bhosale, R.R. Enhancing the Production of Biogas through Anaerobic Co-Digestion of Agricultural Waste and Chemical Pre-Treatments. Chemosphere 2020, 255, 126805. [Google Scholar] [CrossRef]
- Abbas, Y.; Yun, S.; Mehmood, A.; Shah, F.A.; Wang, K.; Eldin, E.T.; Al-Qahtani, W.H.; Ali, S.; Bocchetta, P. Co-Digestion of Cow Manure and Food Waste for Biogas Enhancement and Nutrients Revival in Bio-Circular Economy. Chemosphere 2023, 311, 137018. [Google Scholar] [CrossRef]
- Volpi, M.P.C.; Brenelli, L.B.; Mockaitis, G.; Rabelo, S.C.; Franco, T.T.; Moraes, B.S. Use of Lignocellulosic Residue from Second-Generation Ethanol Production to Enhance Methane Production through Co-Digestion. Bioenergy Res. 2021, 15, 602–616. [Google Scholar] [CrossRef]
- Volpi, M.P.C.; Junior, A.D.N.F.; Franco, T.T.; Moraes, B.S. Operational and Biochemical Aspects of Co-Digestion (Co-AD) from Sugarcane Vinasse, Filter Cake, and Deacetylation Liquor. Appl. Microbiol. Biotechnol. 2021, 105, 8969–8987. [Google Scholar] [CrossRef]
- Longati, A.A.; Lino, A.R.A.; Giordano, R.C.; Furlan, F.F.; Cruz, A.J.G. Biogas Production from Anaerobic Digestion of Vinasse in Sugarcane Biorefinery: A Techno-Economic and Environmental Analysis. Waste Biomass Valori. 2020, 11, 4573–4591. [Google Scholar] [CrossRef]
- Brenelli, L.B.; Figueiredo, F.L.; Damasio, A.; Franco, T.T.; Rabelo, S.C. An Integrated Approach to Obtain Xylo-Oligosaccharides from Sugarcane Straw: From Lab to Pilot Scale. Bioresour. Technol. 2020, 313, 123637. [Google Scholar] [CrossRef]
- Juntupally, S.; Begum, S.; Anupoju, G.R. Impact of Additives (Macronutrient and Nanoparticles of Micronutrients) on the Anaerobic Digestion of Food Waste: Focus on Feeding Strategy for Improved Performance. Biomass Bioenergy 2023, 172, 106751. [Google Scholar] [CrossRef]
- Scherer, P.; Lippert, H.; Wolff, G. Composition of the Major Elements and Trace Elements of 10 Methanogenic Bacteria Determined by Inductively Coupled Plasma Emission Spectrometry. Biol. Trace Elem. Res. 1983, 5, 149–163. [Google Scholar] [CrossRef] [PubMed]
- Zhang, Y.; Zhang, Z.; Suzuki, K.; Maekawa, T. Uptake and Mass Balance of Trace Metals for Methane Producing Bacteria. Biomass Bioenergy 2003, 25, 427–433. [Google Scholar] [CrossRef]
- Cui, Z.; Liu, Z.; Fan, Y.; He, Z.W.; Liu, W.; Yue, X.; Zhou, A. Improving Methane Production from Waste Activated Sludge Assisted by Fe(II)-Activated Peroxydisulfate Pretreatment via Anaerobic Digestion: Role of Interspecific Syntrophism Mediated by Sulfate-Reducing Bacteria. ACS Sustain. Chem. Eng. 2023, 11, 3012–3022. [Google Scholar] [CrossRef]
- Yu, B.; Lou, Z.; Zhang, D.; Shan, A.; Yuan, H.; Zhu, N.; Zhang, K. Variations of Organic Matters and Microbial Community in Thermophilic Anaerobic Digestion of Waste Activated Sludge with the Addition of Ferric Salts. Bioresour. Technol. 2015, 179, 291–298. [Google Scholar] [CrossRef]
- Demirel, B.; Scherer, P. Trace Element Requirements of Agricultural Biogas Digesters during Biological Conversion of Renewable Biomass to Methane. Biomass Bioenergy 2011, 35, 992–998. [Google Scholar] [CrossRef]
- Zhang, Y.; Jing, Y.; Zhang, J.; Sun, L.; Quan, X. Performance of a ZVI-UASB Reactor for Azo Dye Wastewater Treatment. J. Chem. Technol. Biotechnol. 2011, 86, 199–204. [Google Scholar] [CrossRef]
- Abdelsalam, E.; Samer, M.; Attia, Y.A.; Abdel-Hadi, M.A.; Hassan, H.E.; Badr, Y. Comparison of Nanoparticles Effects on Biogas and Methane Production from Anaerobic Digestion of Cattle Dung Slurry. Renew. Energy 2016, 87, 592–598. [Google Scholar] [CrossRef]
- Abdelsalam, E.; Samer, M.; Attia, Y.A.; Abdel-Hadi, M.A.; Hassan, H.E.; Badr, Y. Effects of Co and Ni Nanoparticles on Biogas and Methane Production from Anaerobic Digestion of Slurry. Energy Convers. Manag. 2017, 141, 108–119. [Google Scholar] [CrossRef]
- Abdelsalam, E.; Samer, M.; Attia, Y.A.; Abdel-Hadi, M.A.; Hassan, H.E.; Badr, Y. Influence of Zero Valent Iron Nanoparticles and Magnetic Iron Oxide Nanoparticles on Biogas and Methane Production from Anaerobic Digestion of Manure. Energy 2017, 120, 842–853. [Google Scholar] [CrossRef]
- Hassanein, A.; Lansing, S.; Tikekar, R. Bioresource Technology Impact of Metal Nanoparticles on Biogas Production from Poultry Litter. Bioresour. Technol. 2019, 275, 200–206. [Google Scholar] [CrossRef] [PubMed]
- Amo-Duodu, G.; Rathilal, S.; Chollom, M.N.; Tetteh, E.K. Effects of Synthesized AlFe2O4 and MgFe2O4 Nanoparticles on Biogas Production from Anaerobically Digested Sugar Refinery Wastewater. Environ. Sci. Pollut. Res. 2023, 30, 25613–25619. [Google Scholar] [CrossRef] [PubMed]
- Rice, E.W.; Baird, R.B.; Eaton, A.D. Standard Methods for the Examination of Water and Wastewater; American Public Health Association, American Water Works Association, Water Environment Federation: Washington, DC, USA, 2012. [Google Scholar]
- Triolo, J.M.; Pedersen, L.; Qu, H.; Sommer, S.G. Biochemical Methane Potential and Anaerobic Biodegradability of Non-Herbaceous and Herbaceous Phytomass in Biogas Production. Bioresour. Technol. 2012, 125, 226–232. [Google Scholar] [CrossRef] [PubMed]
- VDI 4630; Fermentation of Organic Materials. Characterization of the Substrate, Sampling, Collection of Material Data, Fermentation Tests. Verein Deutscher Ingenieure: Düsseldorf, Germany, 2006.
- Wang, T.; Zhang, D.; Dai, L.; Chen, Y.; Dai, X. Effects of Metal Nanoparticles on Methane Production from Waste-Activated Sludge and Microorganism Community Shift in Anaerobic Granular Sludge. Sci. Rep. 2016, 6, 25857. [Google Scholar] [CrossRef] [PubMed]
- Ali, A.; Mahar, R.B.; Soomro, R.A.; Sherazi, S.T.H. Fe3O4 Nanoparticles Facilitated Anaerobic Digestion of Organic Fraction of Municipal Solid Waste for Enhancement of Methane Production. Energy Sources Part A Recovery Util. Environ. Eff. 2017, 39, 1815–1822. [Google Scholar] [CrossRef]
- Zhang, Z.; Guo, L.; Wang, Y.; Zhao, Y.; She, Z.; Gao, M.; Guo, Y. Application of Iron Oxide (Fe3O4) Nanoparticles during the Two-Stage Anaerobic Digestion with Waste Sludge: Impact on the Biogas Production and the Substrate Metabolism. Renew. Energy 2020, 146, 2724–2735. [Google Scholar] [CrossRef]
- Vongvichiankul, C.; Deebao, J.; Khongnakorn, W. Relationship between PH, Oxidation Reduction Potential (ORP) and Biogas Production in Mesophilic Screw Anaerobic Digester. Energy Procedia 2017, 138, 877–882. [Google Scholar] [CrossRef]
- Xie, S.; Li, X.; Wang, C.; Kulandaivelu, J.; Jiang, G. Enhanced Anaerobic Digestion of Primary Sludge with Additives: Performance and Mechanisms. Bioresour. Technol. 2020, 316, 123a970. [Google Scholar] [CrossRef]
- Zhang, L.; Gong, X.; Wang, L.; Guo, K.; Cao, S.; Zhou, Y. Metagenomic Insights into the Effect of Thermal Hydrolysis Pre-Treatment on Microbial Community of an Anaerobic Digestion System. Sci. Total Environ. 2021, 791, 148096. [Google Scholar] [CrossRef]
- Jiang, W.E.N.; Kim, B.Y.S.; Rutka, J.T.; Chan, W.C.W. Nanoparticle-Mediated Cellular Response Is Size-Dependent. Nat. Nanotechnol. 2008, 3, 145–150. [Google Scholar] [CrossRef]
- Dompara, I.; Maragkaki, A.; Papastefanakis, N.; Floraki, C.; Vernardou, D.; Manios, T. Effects of Different Materials on Biogas Production during Anaerobic Digestion of Food Waste. Sustainability 2023, 15, 5698. [Google Scholar] [CrossRef]
- Gonzalez-estrella, J.; Sierra-alvarez, R.; Field, J.A. Toxicity Assessment of Inorganic Nanoparticles to Acetoclastic and Hydrogenotrophic Methanogenic Activity in Anaerobic Granular Sludge. J. Hazard. Mater. 2013, 260, 278–285. [Google Scholar] [CrossRef]
- Krongthamchat, K.; Riffat, R.; Dararat, S. Effect of Trace Metals on Halophilic and Mixed Cultures in Anaerobic Treatment. Int. J. Environ. Sci. Technol. 2006, 3, 103–112. [Google Scholar] [CrossRef][Green Version]
- Zhu, X.; Blanco, E.; Bhatti, M.; Borrion, A. Impact of Metallic Nanoparticles on Anaerobic Digestion: A Systematic Review. Sci. Total Environ. 2021, 757, 143747. [Google Scholar] [CrossRef] [PubMed]
- Ni, S.Q.; Ni, J.; Yang, N.; Wang, J. Effect of Magnetic Nanoparticles on the Performance of Activated Sludge Treatment System. Bioresour. Technol. 2013, 143, 555–561. [Google Scholar] [CrossRef] [PubMed]
- Ameen, F.; Ranjitha, J.; Ahsan, N.; Shankar, V. Co-Digestion of Microbial Biomass with Animal Manure in Three-Stage Anaerobic Digestion. Fuel 2021, 306, 121746. [Google Scholar] [CrossRef]
- Liang, D.; Wang, Y.; Chen, M.; Xie, X.; Li, C.; Wang, J.; Yuan, L. Dry Reforming of Methane for Syngas Production over Attapulgite-Derived MFI Zeolite Encapsulated Bimetallic Ni-Co Catalysts. Appl. Catal. B 2023, 322, 122088. [Google Scholar] [CrossRef]
- Feng, Y.; Zhang, Y.; Quan, X.; Chen, S. Enhanced Anaerobic Digestion of Waste Activated Sludge Digestion by the Addition of Zero Valent Iron. Water Res. 2014, 52, 242–250. [Google Scholar] [CrossRef]
- Ajayi-Banji, A.; Rahman, S. A Review of Process Parameters Influence in Solid-State Anaerobic Digestion: Focus on Performance Stability Thresholds. Renew. Sustain. Energy Rev. 2022, 167, 112756. [Google Scholar] [CrossRef]
- Lee, Y.J.; Lee, D.J. Impact of Adding Metal Nanoparticles on Anaerobic Digestion Performance—A Review. Bioresour. Technol. 2019, 292, 121926. [Google Scholar] [CrossRef]
- Ripley, L.E.; Boyle, W.C.; Converse, J.C. Improved Alkalimetric Monitoring for Anaerobic Digestion of High-Strength Waste. J. Water Pollut. Control. Fed. 1986, 58, 406–411. [Google Scholar]
- Wiegant, W.M.; Hennink, M.; Lettinga, G. Separation of the Propionate Degradation to Improve the Efficiency of Thermophilic Anaerobic Treatment of Acidified Wastewaters. Water Res. 1986, 20, 517–524. [Google Scholar] [CrossRef]
- Wang, Y.; Zhang, Y.; Wang, J.; Meng, L. Effects of Volatile Fatty Acid Concentrations on Methane Yield and Methanogenic Bacteria. Biomass Bioenergy 2009, 33, 848–853. [Google Scholar] [CrossRef]
- Romero-Güiza, M.S.; Vila, J.; Mata-Alvarez, J.; Chimenos, J.M.; Astals, S. The Role of Additives on Anaerobic Digestion: A Review. Renew. Sustain. Energy Rev. 2016, 58, 1486–1499. [Google Scholar] [CrossRef]
- Zhang, W.; Wu, S.; Guo, J.; Zhou, J.; Dong, R. Performance and Kinetic Evaluation of Semi-Continuously Fed Anaerobic Digesters Treating Food Waste: Role of Trace Elements. Bioresour. Technol. 2015, 178, 297–305. [Google Scholar] [CrossRef] [PubMed]
- Owusu-Agyeman, I.; Plaza, E.; Cetecioglu, Z. Production of Volatile Fatty Acids through Co-Digestion of Sewage Sludge and External Organic Waste: Effect of Substrate Proportions and Long-Term Operation. Waste Manag. 2020, 112, 30–39. [Google Scholar] [CrossRef] [PubMed]
- Angenent, L.T.; Richter, H.; Buckel, W.; Spirito, C.M.; Steinbusch, K.J.J.; Plugge, C.M.; Strik, D.P.B.T.B.; Grootscholten, T.I.M.; Buisman, C.J.N.; Hamelers, H.V.M. Chain Elongation with Reactor Microbiomes: Open-Culture Biotechnology to Produce Biochemicals. Env. Sci. Technol. 2016, 50, 2796–2810. [Google Scholar] [CrossRef] [PubMed]
- de Souza Moraes, B.; Mary dos Santos, G.; Palladino Delforno, T.; Tadeu Fuess, L.; José da Silva, A. Enriched Microbial Consortia for Dark Fermentation of Sugarcane Vinasse towards Value-Added Short-Chain Organic Acids and Alcohol Production. J. Biosci. Bioeng. 2019, 127, 594–601. [Google Scholar] [CrossRef] [PubMed]
- Wu, X.; Tian, Z.; Lv, Z.; Chen, Z.; Liu, Y.; Yong, X.; Zhou, J.; Xie, X.; Jia, H.; Wei, P. Effects of Copper Salts on Performance, Antibiotic Resistance Genes, and Microbial Community during Thermophilic Anaerobic Digestion of Swine Manure. Bioresour. Technol. 2020, 300, 122728. [Google Scholar] [CrossRef]
- Wang, P.; Wang, H.; Qiu, Y.; Ren, L.; Jiang, B. Microbial Characteristics in Anaerobic Digestion Process of Food Waste for Methane Production–A Review. Bioresour. Technol. 2018, 248, 29–36. [Google Scholar] [CrossRef]
- Guo, X.; Wang, C.; Sun, F.; Zhu, W.; Wu, W. A Comparison of Microbial Characteristics between the Thermophilic and Mesophilic Anaerobic Digesters Exposed to Elevated Food Waste Loadings. Bioresour. Technol. 2014, 152, 420–428. [Google Scholar] [CrossRef]
- Peng, X.; Börner, R.A.; Nges, I.A.; Liu, J. Impact of Bioaugmentation on Biochemical Methane Potential for Wheat Straw with Addition of Clostridium Cellulolyticum. Bioresour. Technol. 2014, 152, 567–571. [Google Scholar] [CrossRef] [PubMed]
- Kang, Y.R.; Su, Y.; Wang, J.; Chu, Y.X.; Tian, G.; He, R. Effects of Different Pretreatment Methods on Biogas Production and Microbial Community in Anaerobic Digestion of Wheat Straw. Environ. Sci. Pollut. Res. 2021, 28, 51772–51785. [Google Scholar] [CrossRef]
- Schnürer, A.; Zellner, G.; Svensson, B.H. Mesophilic Syntrophic Acetate Oxidation during Methane Formation in Biogas Reactors. FEMS Microbiol. Ecol. 1999, 29, 249–261. [Google Scholar] [CrossRef]
- Li, Z.; Wachemo, A.C.; Yuan, H.; Korai, R.M.; Li, X. Improving Methane Content and Yield from Rice Straw by Adding Extra Hydrogen into a Two-Stage Anaerobic Digestion System. Int. J. Hydrogen Energy 2020, 45, 3739–3749. [Google Scholar] [CrossRef]
Disclaimer/Publisher’s Note: The statements, opinions and data contained in all publications are solely those of the individual author(s) and contributor(s) and not of MDPI and/or the editor(s). MDPI and/or the editor(s) disclaim responsibility for any injury to people or property resulting from any ideas, methods, instructions or products referred to in the content. |
© 2023 by the authors. Licensee MDPI, Basel, Switzerland. This article is an open access article distributed under the terms and conditions of the Creative Commons Attribution (CC BY) license (https://creativecommons.org/licenses/by/4.0/).