Abstract
Yttrium–magnesium alloys are commonly employed as processing additives in magnesium alloy materials. Incorporating yttrium into magnesium alloys via Y-Mg intermediate alloys not only minimizes oxidation and burn-off loss but also simplifies operational procedures. Utilizing yttrium–magnesium alloys ensures a stable composition and reliable quality of magnesium alloy products, while contributing to reduced production costs and minimized environmental pollution. In this study, a molten salt co-reduction method was developed for the preparation Y-Mg intermediate alloys. The electrochemical co-reduction behaviors of Y(III) and Mg(II), as well as the transient states of Y-Mg intermediate alloys, were systematically investigated by transient electrochemical techniques. Results indicated that the reduction of Y(III) at the molybdenum (Mo) cathode is a reversible electrochemical process, whereas the reduction of Mg(II) is irreversible and diffusion-controlled. The diffusion coefficient of Y(III) and Mg(II) in the fluoride salt at 1000 °C were determined to be 3.98 × 10⁻⁵ cm2/s and 1.16 × 10⁻³ cm2/s, respectively. Electrochemical calculations revealed that the reduction of Y(III) involves a single-step transfer of three electrons, while Mg(II) involves a single-step transfer of two electrons. The corresponding electrode reactions are Y(III) + 3e−→Y and Mg(II) + 2e−→Mg, respectively. A Y-Mg alloy sample prepared by constant-current molten salt electrolysis primarily consists of the MgY phase with a composition of 88.38 wt% yttrium and 11.62 wt% magnesium.
1. Introduction
Magnesium alloys offer several advantages, including low density, excellent specific performance, effective vibration damping, and favorable electrical and thermal conductivity. Additionally, they exhibit good processability. As a result, these alloys are extensively utilized in various fields, such as aerospace, the automotive industry, electronic communications, and military equipment, among others, to achieve lightweight designs [1,2,3,4]. However, magnesium alloys suffer from poor high-temperature strength and creep resistance. Furthermore, their corrosion resistance requires enhancement; these limitations constrain their application in scenarios with stringent performance requirements [5,6]. The addition of rare earth metal yttrium to magnesium alloys can refine grain structure by preventing segregation and facilitating gas removal as well as impurity purification. This incorporation significantly improves both the mechanical properties and physical characteristics of magnesium alloys while also enhancing processing performance [7,8]. Nonetheless, yttrium exhibits high reactivity and susceptibility to oxidation. Given its elevated melting point and specific gravity as well as challenges associated with integrating it into magnesium alloys directly, the use of Y-Mg intermediate alloy with a high yttrium content has been proposed for incorporation. Yttrium-containing magnesium alloys thus retain the inherent benefits of traditional magnesium components while simultaneously presenting novel features such as enhanced heat-resistant strength and superior creep resistance [9].
Currently, the industrial production of Y-Mg alloys primarily relies on vacuum melting and powder metallurgy methods. However, these approaches present several drawbacks, including complex alloy preparation processes, low production efficiency, high energy consumption, and significant segregation within the alloy organization [10]. In contrast to the aforementioned techniques, Y-Mg alloys produced via molten salt electrolysis exhibit a uniform composition along with a relatively regular and dense microstructure. This method effectively mitigates component segregation, reduces impurity levels, and enhances product quality [11]. Additionally, molten salt electrolysis is typically conducted at lower temperatures. The production of Y-Mg alloys through this technique is continuous in nature, leading to comparatively higher energy utilization and production efficiencies [12,13]. Molten salt electrolysis has emerged as one of the most economical methods for preparing rare earth intermediate alloys [14,15,16,17]. Successful preparations of Y-Ni [18], Y-Zn [19], and Y-Mg [20] alloys have been achieved using molten salt electrolysis. Furthermore, studies have elucidated the electrochemical behavior of Y(III) ions on both inert and active electrodes in chloride or fluoride melts. For instance, Shaohua Yang et al. [21]. investigated the electrochemical behavior of Y(III) and Mg(II) at an inert cathode within the LiF-YF3 system at 1000 °C. Their findings confirmed that both Y(III) and Mg(II) underwent one-step reduction reactions [22].
In the past, rare earth alloys produced through molten salt electrolysis were primarily based on chloride systems, such as liquid magnesium cathodes, sinking magnesium cathodes, and co-dialysis methods [23]. However, this process generates chlorine gas at the anode, leading to environmental pollution. Additionally, the subsequent preparation of anhydrous chlorides involves a lengthy procedural flow and results in lower grades and yields of rare earth elements. Consequently, researchers have increasingly shifted away from the chloride electrolysis system [24]. Furthermore, rare earth metals exhibit lower solubility in fluoride molten salts compared to chloride molten salts; notably, the anode gases can be directly released into the atmosphere [25]. Therefore, the fluoride molten salt system has become widely adopted for electrolysis of rare earth metals.
The electrolyte used in this work is LiF-YF3-MgF2, LiF is characterized by low melting point, good ionic conductivity and good stability, and at the same time, it can well balance the conductivity of the molten salt and the relationship with the actual melting temperature, and YF3-MgF2 provides the raw material for the preparation of alloys by electrolysis [26]. The experiment utilized a fluoride molten salt system. Fluoride demonstrates excellent chemical stability, high electrolysis efficiency, and the capability to produce high-purity alloys through electrolysis. Furthermore, the anode generates more environmentally friendly gases. The preparation of Y-Mg intermediate alloy via molten salt electrolysis allows for efficient alloying and continuous production. By simultaneously reducing Y and Mg ions, a uniform composition of the Y-Mg alloy can be directly formed through electrolysis, thereby addressing the challenges associated with the high melting point of Y and the high volatility of Mg inherent in traditional metallurgical methods. Moreover, molten salt electrolysis facilitates cost-effective alloy preparation while minimizing energy consumption. The Y-Mg intermediate alloy can be incorporated into magnesium alloys for aerospace applications, enhancing their high-temperature strength and creep resistance. Additionally, Y-Mg alloys have the potential to partially replace aluminum alloys, thus achieving lightweight objectives.
The core novelty of this research manifests in three aspects: First, the innovative adoption of the LiF-YF3-MgF2 fluoride system replaces the highly polluting chloride system, eliminating chlorine gas emissions and simplifying the process. Second, it reveals the diffusion-controlled mechanism of co-electrodeposition between Y(III) and Mg(II), providing a theoretical basis for precise alloy composition control. Third, it optimizes process parameters by integrating electrochemical testing with microstructural characterization to establish a comprehensive research loop. This approach enhances both the environmental sustainability and yield of alloy preparation while providing new pathways and data support for the efficient, green synthesis of rare-earth magnesium alloys.
In this study, cyclic voltammetry (CV), square wave voltammetry (SWV), and open circuit chronopotentiometry (OCP) were employed to investigate the reduction reaction behaviors and electrochemical co-reduction phenomena of Y(III) and Mg(II) on a Mo electrode. A Y-Mg intermediate alloy was synthesized through molten salt electrolysis within the LiF-YF3-MgF2 system. The obtained samples were characterized using X-ray diffraction (XRD) and electron probe X-ray microanalysis (EPMA), enabling the identification of Y and Mg elements in the Y-Mg intermediate alloy by referencing the binary phase diagram of the Y-Mg alloy.
2. Materials and Methods
The electrolytes employed for the melt electrochemical tests comprised LiF (>99.9%), YF3 (>99.9%), and MgF2 (>99.9%), all sourced from Shanghai McLean Biochemical Co. Prior (Shanghai, China) to use, the electrolytes underwent vacuum drying at 300 °C for 48 h within a glove box (with H2O and O2 content ≤ 1 ppm). Subsequently, Y(III) and Mg(II) ions were introduced into the electrolytes as dehydrated forms of YF3 and MgF2, respectively. The specific electrolytic feedstock utilized was LiF-YF3-MgF2, with a temperature increase to and maintenance at 1000 °C. Electrochemical tests were conducted using a three-electrode system following an initial melting period of one hour for the molten salt. The electrolytic feedstock implemented remained LiF-YF3-MgF2 throughout the experiments.
The electrochemical testing system is illustrated in Figure 1. The high-purity graphite crucible depicted in Figure 1 has specifications of φ70 mm × 100 mm. Both the electrode and the high-purity graphite crucible were subjected to ultrasonic cleaning and drying to eliminate any oxide layers and impurities on their surfaces. The electrolysis process was conducted within a silicon molybdenum tube furnace, with temperature control managed by an FP93 programmer, while the furnace temperature was monitored using an S-type thermocouple. During the electrochemical testing, the electrodes were encapsulated with corundum tube insulation to prevent alterations in the electrode area and maintain stable potential conditions. The surface area of the working electrode was controlled by regulating the depth of its immersion in molten salt, and it is reproducible across different tests. The area control by masking technique is not employed, primarily constrained by the high-temperature and corrosive properties of molten salts. Common insulating materials decompose and soften at elevated temperatures, failing to maintain structural integrity. Molten salt systems such as fluorides exhibit strong corrosivity, readily permeating gaps between the masking layer and electrodes to corrode the masking material.
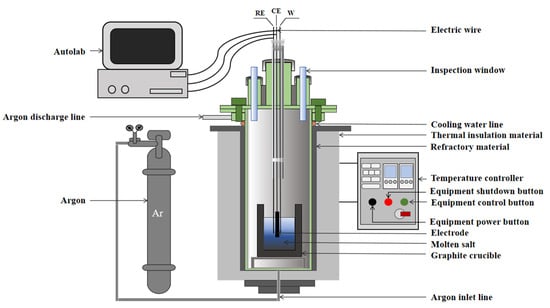
Figure 1.
Schematic diagram of electrochemical test system.
Pre-electrolysis was performed at −1.8 V for a duration of 2 h to remove metal ion impurities. The rationale is to ensure efficient impurity removal and protect system stability. Based on molten salt thermodynamics, −1.8 V is above the oxidation potential of F− and the decomposition potential of molten salt, while below the reduction potentials of Y(III) and Mg(II). This allows a targeted reduction in trace impurities such as O2− and C in the system, preventing premature deposition of target ions. The cyclic voltammetry curve prior to pre-electrolysis is shown in Figure 2. The appearance of impurity peaks, peak absence, or overlapping peaks in the cyclic voltammetry curve may all be attributed to impurities in the molten salt. The cyclic voltammetry curve after pre-electrolysis is presented and discussed in the subsequent results of this paper. The post–pre-electrolysis cyclic voltammetry curve exhibits smoothness, clearly distinguishable oxidation and reduction peaks, and no extraneous peaks, indicating that the impurities have been removed. Repeat pre-electrolysis to remove impurities before each experiment, ensuring that every electrochemical test begins in an equally pure molten salt environment. This guarantees consistency and comparability among all data.
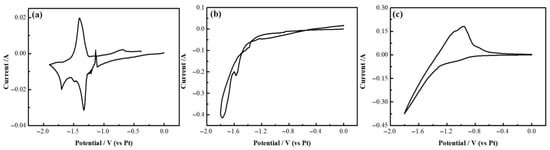
Figure 2.
Cyclic voltammetry curve prior to pre-electrolysis. (a) Cyclic voltammetry curves of LiF-YF3-MgF2 molten salt before pre-electrolysis; (b) Cyclic voltammetry curves of LiF-YF3 molten salt before pre-electrolysis; (c) Cyclic voltammetry curves of LiF-MgF2 molten salt before pre-electrolysis.
The electrochemical parameters of the LiF-YF3 (5.68 wt%)-MgF2 (2.43 wt%) system specifically, redox potential, diffusion coefficient, number of transferred electrons, and electrode reactions—were characterized using cyclic voltammetry (CV), square wave voltammetry (SWV), and open circuit potential (OCP) measurements. These were performed with an AUTOLAB PGSTAT 302N electrochemical workstation configured in a three-electrode setup, utilizing Nova 2.1 software for control. Cyclic voltammetry was conducted at scanning rates ranging from 50 to 500 mV/s (The data sampling frequencies corresponding to scan rates of 50 mV/s, 100 mV/s, 200 mV/s, 300 mV/s, 400 mV/s, and 500 mV/s are 5 Hz, 10 Hz, 20 Hz, 30 Hz, 40 Hz, and 50 Hz, respectively. The CV test consists of 5 cycles, with analysis based on the 3rd cycle. The 3rd cycle ensures the electrode surface reaches a stable state while avoiding the activation effect of the first cycle and performance degradation in subsequent cycles.), with an initial potential set between −1.8 V and −2.0 V, decreasing in the negative direction. The scanning direction was reversed upon reaching the predetermined potential limit. In the resultant graph depicting scanning time t versus potential E, it can be observed that the potential E is symmetric about the axis at specific time points; simultaneously, corresponding current-voltage curves i-E were recorded. Square wave voltammetry measurements employed a scanning rate of 100 mV/s while maintaining an initial potential within −1.8 V to −2.0 V and consistently altering in the negative direction. The respective current-voltage curves i-E associated with these measurements were also documented. The open circuit chronopotential (OCP) measurement involves the application of a constant voltage to the working electrode, facilitating the reduction reactions of Y(III) and Mg(II) ions. This process requires maintaining the voltage for a defined duration, after which the circuit is disconnected, allowing for the recording of the potential (E) versus time (t) relationship at the working electrode.
A three-electrode system was employed in these experiments. The counter electrode (CE) consisted of a spectroscopically pure graphite rod with a diameter of 6 mm. The quasi-reference electrode (RE) was constructed from a platinum wire with a diameter of 1 mm, the reason lies in platinum’s exceptional chemical stability in high-temperature molten salt environments, where it is unlikely to react with molten salt components. Additionally, its excellent conductivity enables it to provide a relatively stable potential reference standard for testing. All potential data recorded in the electrochemical tests conducted in this study are measured relative to this platinum standard reference electrode. However, the use of platinum-coated reference electrodes presents significant limitations. In high-temperature, highly corrosive environments, they are prone to chemical wear and dissolution, which can interfere with the reduction reactions of Y(III) and Mg(II). Furthermore, during long-term testing, drift may occur due to changes in the ionic concentration of the system. Therefore, the Mo electrode must be replaced promptly in each experiment to ensure the accuracy of the test results. The working electrodes (WE) comprised both molybdenum and tungsten wires, with purities exceeding 99.999 wt% and diameters measuring 1 mm. Prior to testing, all metal electrodes underwent sanding and polishing through progressively finer grit sandpapers: 400, 800, 1200, 1500, and finally 2000 grit. Subsequently, they were cleaned with alcohol in an ultrasonic cleaner. During electrochemical experiments, the exposed areas of the anode and cathode are 376.99 mm2 and 62.83 mm2, respectively. The electrodes are secured in position using fixtures, ensuring a 20 mm immersion depth into the electrolyte. The geometric dimensions of the immersed sections are precisely measured with a ruler to control the exposed areas. To ensure the reproducibility of the experiment and the reliability of the results, three parallel samples were prepared for each set of key conditions. All parallel samples were tested sequentially, and the average value of the experimental results within the error range was taken. All experimental procedures were conducted in an inert atmosphere of high-purity argon gas, which was further purified by passing through a gas purification system to remove trace water and oxygen, flowing at a rate of 500 mL/min.
The electrolysis setup for the preparation of Y-Mg alloy is illustrated in Figure 3, featuring a molybdenum rod as the cathode and a high-purity graphite crucible as the anode, the cathode Mo rod has a diameter of 18 mm and is secured in position using a copper fixture to ensure full-surface contact. The electrode is immersed 6.9 cm into the electrolyte, with an exposed surface area of approximately 38.9988 cm2. The reproducibility of the process was verified through three repeated experiments, confirming its repeatability. The electrolysis system consists of LiF-YF3-MgF2, Y2O3-MgO as raw material, with a cathodic current density set at 9 A/cm2, the total current is 350 A and an electrolysis duration of 1 h. To prevent oxidation, a corundum crucible is utilized to collect the resultant alloy [27]. Upon completion of the electrolysis process, the corundum crucible was promptly extracted using crucible tongs. Subsequently, both the electrolyte and alloy were transferred into an alumina crucible, where they were allowed to cool to room temperature before collecting the alloy. Following this, any residual molten salts and impurities present on the surface of the alloy samples were treated and dried under an argon atmosphere within a glove box.
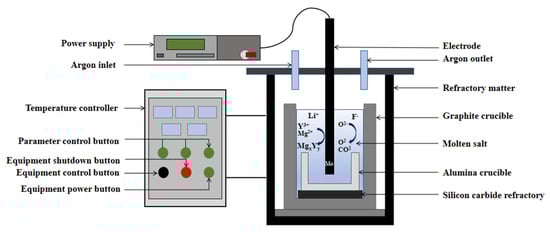
Figure 3.
Schematic diagram of Y-Mg alloy electrolysis device.
Afterwards, the chemical composition of the alloys was analyzed using Inductively Coupled Plasma (ICP) with a NEXION 350X system (Platinum Elmer, New York, NY, USA). The physical phase composition of the alloy was examined employing an X-ray diffractometer (SmartLab, Rigaku, Tokyo, Japan), operating within a detection θ-angle range of 20 to 80° and a scanning rate of 5°/s. This analysis aimed to elucidate the state of Y and Mg elemental assignments in the alloy. Additionally, an electron probe X-ray microanalyzer (JXA-iHP200F, Nihon Electronics JEOL, Tokyo, Japan) was utilized to investigate the microscopic morphology and microzonation elemental distribution within the alloy samples. This analysis was conducted at an accelerating voltage of 15 kV and a beam current of 10−10 A.
3. Results
3.1. Electrochemical Behavior of Y-Mg Alloy Co-Deposition Process
3.1.1. Electrochemical Behavior of Y(III) in the LiF-YF3 System
Figure 4a presents the cyclic voltammetry curves of a molybdenum cathode in a LiF melt at 1000 °C, recorded at a scanning rate of 100 mV/s. The cyclic curve exhibits a distinct current peak (A) at −1.8 V during the negative linear scanning process starting from 0 V. In contrast, the current peak (A′) occurs at approximately −1.4 V during the positive scanning phase. Peak A corresponds to the reduction of lithium ions Li(I), while peak A′ is associated with the oxidation of yttrium metal, given that the molten salt comprises solely LiF as its electrolyte.
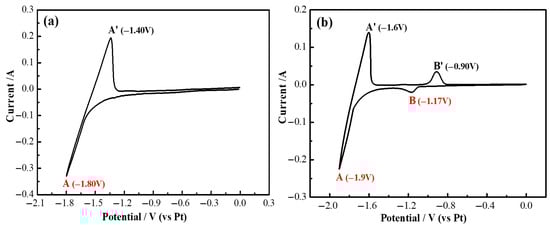
Figure 4.
(a) Cyclic voltammogram of LiF melt at 1000 °C; (b) Cyclic voltammogram of LiF-YF3 (5.68 wt%) melt at 1000 °C.
The cyclic voltammetry curves of the Mo electrode in LiF molten salt containing 5.68 wt% YF3 at a temperature of 1000 °C and a scan rate of 100 mV/s are presented in Figure 4b. As illustrated in Figure 4b, the cathodic peak (B) occurs at approximately −1.17 V, while the anodic peak (B′) is observed at around −0.90 V. Given that the molten salt electrolyte comprises LiF-YF3 and considering that the redox potential of Li(I) is more negative than that of Y(III), it can be inferred that peaks B and B′ represent the redox couples of Y(III)/Y, corresponding to the deposition and dissolution processes of yttrium metal on the Mo electrode, respectively.
The asymmetry in the anode and cathode current peaks for A and B in the Figure 4 may both stem from differences in the thermodynamic trends and kinetics of their respective redox reactions. Both cathode processes involve the reduction and deposition of metal ions, requiring the overcoming of high activation energy, and the deposited metal impedes mass transfer and electron transfer. The anodic processes involve the oxidation and dissolution of deposited metals. Li and Y exhibit low metal oxidation activation energies, resulting in no accumulation of dense product layers during dissolution. This minimizes mass transfer resistance and facilitates more favorable kinetics, ultimately leading to the asymmetry in anodic and cathodic current peaks observed in A and B.
To investigate the reversibility of yttrium deposition and dissolution on the Mo electrode, a more in-depth study was conducted on the redox reaction of Y(III)/Y. Figure 5 presents the cyclic voltammetry (CV) curves for the Y(III)/Y redox reaction in a molten salt composed of LiF and YF3 (5.68 wt%) at scan rates of 100, 200, 300, 400, and 500 mV/s, to fully display the redox curve of Y for convenient observation of its redox process, with potentials ranging from −1.7 V to −0.7 V. As illustrated in Figure 5, current peaks are observed in both negative and positive scans across all scanning rates, corresponding to the reduction and oxidation reactions of Y(III). Based on the peak patterns, it can be concluded that these reactions pertain to soluble-insoluble electrode processes. Furthermore, it was noted that the shift between reduction peaks at the cathode and oxidation peaks at the anode exhibited minimal variation with increasing scan rates. Therefore, it is presumed that the electrochemical process involving Y(III)/Y within the LiF-YF3 system is reversible.
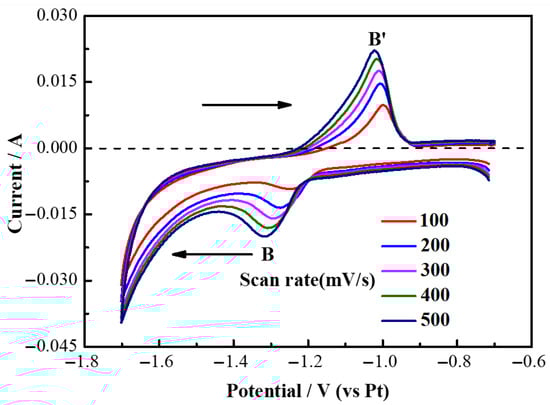
Figure 5.
Cyclic voltammetry curves of LiF-YF3 (5.68 wt%) molten salt at 1000 °C with different scanning rates.
Figure 6 presents the analytical results of the cyclic voltammetry (CV) curves for the LiF (94.32 wt%)-YF3 (5.68 wt%) molten salt at a temperature of 1000 °C. In Figure 6a, by performing linear fitting on the data using Origin 8.5, a high degree of fit was observed. It is evident that the fitted curve relating cathodic current (IP) to the square root of scan rate (v1/2) exhibits a nearly linear relationship, indicating that the electrochemical reduction behavior of Y(III) in the melt under an applied electric field is influenced by diffusion processes [28]. Furthermore, Figure 6b illustrates that the peak potential (EP) demonstrates a linear correlation with the logarithmic representation of scan rate (lgv). Notably, both cathodic and anodic peak potentials exhibit minimal variation with increasing scan rates; their fitted curves are almost parallel to the x-axis. This observation suggests that the cathodic peak potential remains independent of scanning potential (v), implying that the electrochemical process involving Y(III)/Y within this molten salt system is fully reversible [29].
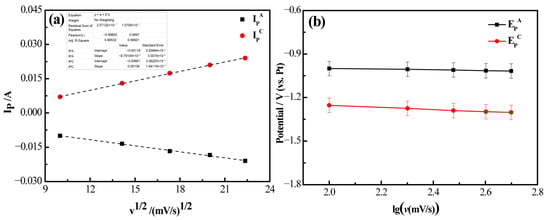
Figure 6.
Results of cyclic voltammetry curve analysis of LiF-YF3 (5.68 wt%) molten salt system at 1000 °C. (a) Cathode current (IP) with square root of scan rate (v1/2); (b) Variation in peak potential (EP) with logarithm of scan rate (lg(v)).
Based on the characterization of the electrochemical process of Y(III)/Y as a reversible reaction, the diffusion coefficient of the molten system can be calculated using the Berzins-Delahay equation (Equation (1)) [30]. The diffusion coefficient (D) for Y(III) during electrodeposition at 1000 °C was determined to be 3.98 × 10⁻⁵ cm2/s.
where n is the number of electrons gained or lost; F is the Faraday constant, 96,485 C·mol−1; c is the ion concentration, mol·cm−3; A is the electrode area, cm2; D is the diffusion coefficient, cm2·s−1; v is the sweep rate, V·s−1; R is the gas constant, 8.314 J·K·mol−1; and T is the absolute temperature of melt at the time of determination, K.
Figure 7 presents the square wave voltammetry curve of Y(III) in a LiF (94.32 wt%)-YF3 (5.68 wt%) molten salt, measured on a Mo electrode at 1000 °C. As depicted in Figure 7, a pronounced reduction peak is observed at −1.16 V on the square wave voltammetry curve. The redox peak potentials obtained from both square wave voltammetry and cyclic voltammetry exhibited similar results. Consequently, the number of electrochemically transferred electrons was calculated using Equation (2) [31,32]:
where W1/2 is the half-width of the reduction peak, V; R is the universal gas constant, 8.314 J·K·mol−1; T is the absolute temperature of the melt at the time of measurement, K; F is the Faraday constant, 96,485 C·mol−1; and n is the number of exchanged electrons.
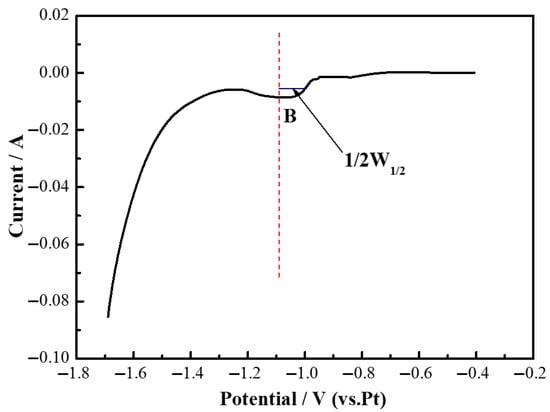
Figure 7.
Square wave voltammetry curves of LiF-YF3 (5.68 wt%) molten salt system at 1000 °C.
The number of transferred electrons at peak B was calculated to be 3.214, which can be approximated to 3 upon rounding. Thus, the electrochemical reduction of Y(III) on an inert electrode is characterized as a single-step reaction involving a three-electron transfer, with no intermediate products formed [33]. The corresponding reaction formula for peak B has been confirmed as Y(III) + 3e− → Y.
3.1.2. Electrochemical Behavior of Mg(II) in LiF-MgF2 System
The cyclic voltammetry curves for the LiF molten salt system containing 2.43 wt% MgF2 on a Mo electrode at 1000 °C and a scan rate of 100 mV/s are presented in Figure 8. As illustrated in this figure, a cathodic peak (C) is observed at approximately −1.51 V, while an anodic peak (C′) appears at −1.27 V on the curves. Given that the molten salt electrolyte comprises LiF-MgF2, it is noted that the redox potential of Li(I) is more negative than that of Mg(II). Consequently, the two peaks C and C′ represent the redox couple of Mg(II)/Mg, which corresponds to the deposition and dissolution processes of magnesium metal on the molybdenum electrode.
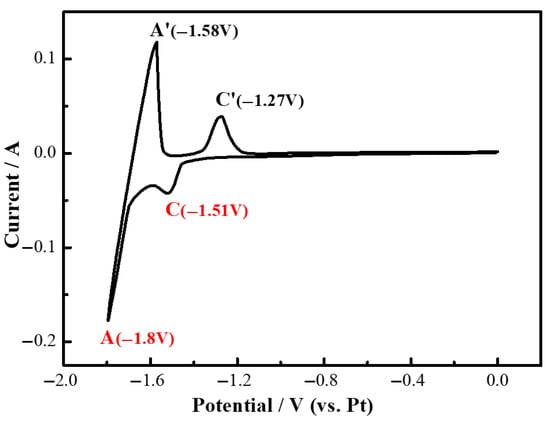
Figure 8.
Cyclic voltammetry curves of LiF-MgF2 (2.43 wt%) melt at 1000 °C.
The asymmetry in the anodic and cathodic current peaks for C in the figure may stem from thermodynamic and kinetic differences in the Mg metal redox processes. The cathodic process involves the reduction and deposition of Mg(II) at the electrode surface. Although the activation energy for Mg(II) is slightly lower than that for Y(III), the resulting Mg metal layer tends to form a loose and porous structure. This structure still impedes subsequent mass transfer of Mg(II) and electron transfer. The anodic process involves the oxidation and dissolution of deposited Mg. Mg metal exhibits higher reactivity, with the activation energy for oxidation being significantly lower than that for reduction. Furthermore, dissolution does not result in the accumulation of a dense product layer, leading to reduced mass transfer resistance and more favorable reaction kinetics. This ultimately contributes to the asymmetry in the anodic and cathodic current peaks for C.
To determine the reversibility of the deposition and dissolution of Y on the Mo electrode, a more comprehensive investigation into the Mg(II)/Mg redox reaction was conducted. Figure 9 illustrates the cyclic voltammetry (CV) curves for the Mg(II)/Mg redox reaction within a LiF-MgF2 (2.43 wt%) molten salt system at scanning rates of 50, 100, 200, 300, 400, and 500 mV/s over a potential range from −1.8 V to −1.2 V. As depicted in Figure 9, distinct current peaks were observed during both negative and positive scans across various scanning rates; these peaks correspond to the reduction and oxidation reactions of Mg(II). The nature of this reaction can be classified as a soluble-insoluble electrode process based on the peak patterns observed. Furthermore, it is noteworthy that with an increase in scanning rate, the anodic peak potential progressively shifted towards more positive values while concurrently, the cathodic peak potential moved towards more negative values. Consequently, it is hypothesized that the electrochemical behavior of Mg(II)/Mg within the LiF-MgF2 system exhibits irreversibility.
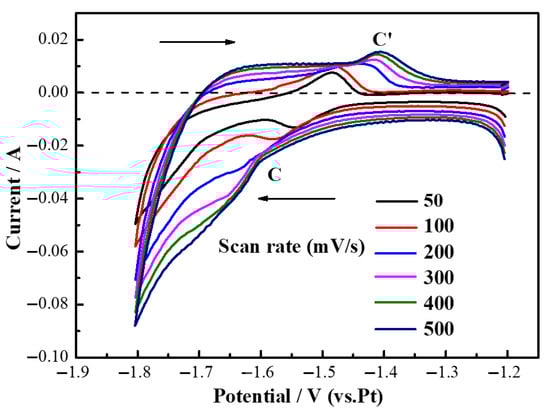
Figure 9.
Cyclic voltammetry curves of LiF-MgF2 (2.43 wt%) molten salt system at 1000 °C.
Figure 10 presents the analytical results of cyclic voltammetry (CV) curves for the LiF-MgF2 (2.43 wt%) molten salt system at a temperature of 1000 °C. As illustrated in Figure 10a, by performing linear fitting on the data using Origin, a high degree of fit was observed, the fitted curve relating cathodic current (IP) to the square root of scan rate (v1/2) demonstrates a nearly linear relationship, indicating that the electrochemical reduction behavior of Mg(II) in the melt is influenced by diffusion processes under an applied electric field. Figure 10b depicts the peak potential (EP) plotted against the logarithm of scan rate (lgv), suggesting that the reaction remains reversible at scan rates below 100 mV·s−1. Notably, as the scan rate increases, there is a shift in anodic peak potential towards more positive values, while cathodic peak potential gradually shifts in a negative direction. Consequently, it can be inferred that during electrochemical processes within the LiF-MgF2 (2.43 wt%) system, the reduction behavior of Mg(II)/Mg is predominantly irreversible. This may be attributed to the influence of the molybdenum substrate. At 1000 °C, Mg exhibits high volatility, causing partial Mg detachment from the electrode and resulting in a deficiency of oxidation reactants. Concurrently, Mg readily reacts with fluoride ions in the molten salt to form a surface fluoride film, hindering reverse oxidation. Furthermore, the loose structure of the Mg deposition layer, coupled with uneven oxidation dissolution and high charge transfer resistance, collectively counteracts the thermodynamic advantage of Mg(II) reduction, resulting in its irreversible behavior.
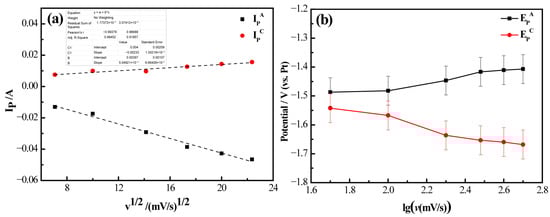
Figure 10.
Results of cyclic voltammetry curve analysis of LiF-MgF2 (2.43 wt%) molten salt system at 1000 °C. (a) Cathode current (IP) with square root of scan rate (v1/2); (b) Variation in peak potential (EP) with logarithm of scan rate (lg(v)).
Based on the results of the electrochemical process involving Mg(II)/Mg, which is characterized as an irreversible process according to linear scanning voltammetry theory, the diffusion behavior of Mg(II) in LiF-MgF2 molten salt was calculated using Equation (3). This calculation pertains to the irreversible reduction reaction system [34].
where n is the number of electrons gained or lost; F is the Faraday constant, 96,485 C·mol−1; c is the ion concentration, mol·cm−3; A is the electrode area, cm2; D is the diffusion coefficient, cm2·s−1; v is the sweep rate, V·s−1; R is the gas constant, 8.314 J·K·mol−1; and T is the absolute temperature of melt at the time of determination, K.
Then, the diffusion coefficient (D) of Mg(II) in the fluorinated molten salt system during the electrodeposition process at 1000 °C was determined to be 1.16 × 10⁻³ cm−2/s.
Figure 11 illustrates the square wave voltammetric curve of Mg(II) in LiF-MgF2 (2.43 wt%) molten salt on a Mo electrode at 1000 °C. By combining this data with Equation (2), it was determined that the number of transferred electrons at the C peak was approximately 2.15, which can be rounded to about 2. Therefore, the electrochemical reduction of Mg(II) on an inert electrode is characterized as a single-step, two-electron transfer reaction, with no intermediate products being formed. Consequently, the reaction formula for the B peak has been confirmed as follows: Mg(II) + 2e− → Mg.
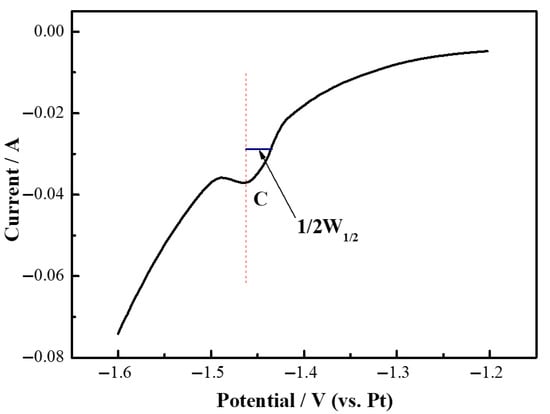
Figure 11.
Square wave voltammetry curves of LiF-MgF2 (2.43 wt%) molten salt system at 1000 °C.
3.1.3. Electrochemical Co-Deposition Behavior of Y(III) and Mg(II) in the LiF-YF3-MgF2 System
Figure 12 illustrates the cyclic voltammetry curves of the LiF-YF3 (5.68 wt%)—MgF2 (2.43 wt%) molten salt system at 1000 °C. As depicted in Figure 12, an oxidation peak (D′) emerged at −0.99 V during forward scanning, alongside peaks A/A′, B/B′, and C/C′. However, the corresponding reduction peak (D) was not detected. In comparison with the measurement results presented in Figure 4b, it is noteworthy that the width of reduction peak B was more pronounced than that observed in Figure 12. The deposition potentials for reduction peaks D and B were found to be similar, leading to their overlap in representation. It can be inferred that peak D signifies the co-deposition of Y(III) and Mg(II), resulting in the formation of a stable intermetallic compound [22,26].
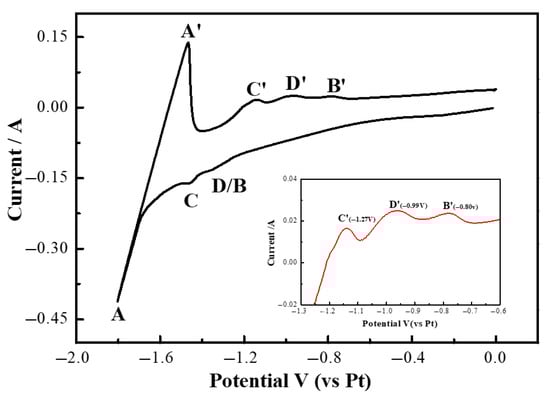
Figure 12.
Cyclic voltammetry curves of LiF-YF3 (5.68 wt%)-MgF2 (2.43 wt%) molten salt system at 1000 °C.
The square wave voltammetric (SWV) curve of the LiF-YF3 (5.68 wt%)-MgF2 (2.43 wt%) molten salt system is presented in Figure 13. As illustrated in Figure 13, three cathodic signals, designated as A, B, and C, were observed at potentials of −1.7 V, −1.40 V, and −1.15 V, respectively. In comparison with Figure 7 and Figure 11, it was established that signal A corresponds to the formation of lithium metal, signal B to yttrium metal, and signal C to magnesium metal. Furthermore, signal D is associated with the formation of a yttrium–magnesium alloy.
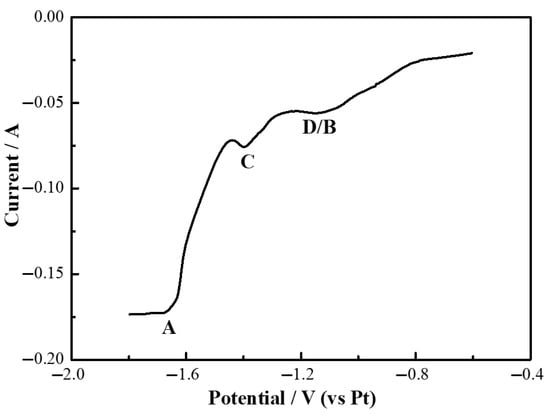
Figure 13.
Square wave voltammetry curves of LiF-YF3 (5.68 wt%)-MgF2 (2.43 wt%) molten salt system at 1000 °C.
Figure 14 illustrates the open-circuit chronopotential curve (OCP) of the LiF-YF3 (5.68 wt%)-MgF2 (2.43 wt%) molten salt system at a temperature of 1000 °C. Initially, Y-Mg metal flakes were electrodeposited onto the molybdenum electrode through continuous potential electrolysis during the measurement process. Subsequently, the constant potential control was disengaged, and the open circuit potential curve was recorded. The potential of the LiF-YF3 (5.68 wt%)-MgF2 (2.43 wt%) system began to develop a yttrium–magnesium alloy layer at −1.6 V after approximately 107 s from the initiation of testing. Three distinct plateaus emerged on the OCP curves at −0.88 V, −1.00 V, and −1.28 V, respectively. In comparison with the CV curves presented in Figure 12, these plateaus were identified as corresponding to peaks B′, D′, and C′. Specifically, platform A in Figure 14 aligns with the reduction peak of Y observed in Figure 12’s CV curve; platform C corresponds to Mg; while platform B relates to an unobserved peak associated with Y-Mg alloying formation. Consequently, it can be further concluded that D/D′ represents the redox peak indicative of Y-Mg alloy formation.
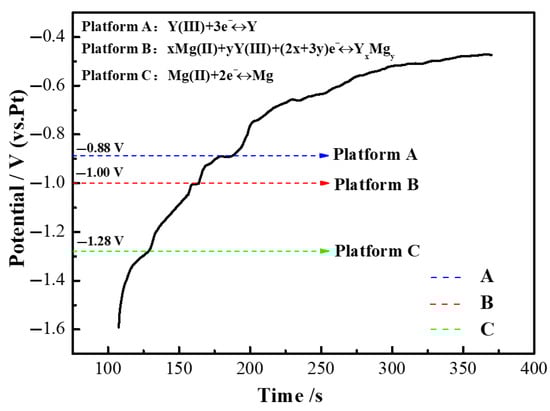
Figure 14.
Open-circuit chronopotential curves of LiF-YF3 (5.68 wt%)-MgF2 (2.43 wt%) molten salt system at 1000 °C.
Since the precipitation potential of Y(III) at the Mo electrode was comparable to that of Li(I) in the LiF-YF3 (5.68 wt%)-MgF2 (2.43 wt%) molten salt, the separate precipitation of metallic Y at the Mo electrode proved to be quite challenging. According to the Nernst equation, intense polarization resulting from concentration differences led to simultaneous precipitation of both ions. Given identical ionic activities, Mg(II) exhibited a greater tendency for precipitation than Y(III), which resulted in a lower activity of Mg(II) in the cathode region and a relatively higher activity of Y(III). Furthermore, the precipitation of Mg(II) induced a depolarizing effect on the precipitation process of Y(III) due to alloying interactions between Y and Mg. Consequently, this caused the precipitation potential of Y(III) to shift towards more positive values, thereby reducing the potential difference for precipitation between Y(III) and Mg(II), allowing for continued progression of the electrochemical reduction process. Based on this analysis, we determined that the electrode reactions corresponding to each platform depicted in Figure 14 can be expressed by three reaction equations as follows:
Plateau A: Y(III) + 3e− ⇌ Y
Plateau B: xMg + Y(Ⅲ) + 3e− ⇌ Y-Mgx
Plateau C: Mg(II) + 2e− ⇌ Mg
3.2. Preparation and Characterization of Yttrium–Magnesium Alloys
Using LiF-YF3-MgF2 molten salt as the electrolyte, Y2O3 and MgO served as the electrolytic sources for Y(III) and Mg(II). Due to the limited solubility of Y2O3 and MgO in the fluoride medium, Y-Mg intermediate alloys were synthesized through electrolysis and subsequently added in small quantities and batches. The alloys were produced by conducting electrolysis at a temperature of 1000 °C, with a cathodic current density of 9 A/cm2, under constant-current conditions for one hour.
To investigate the cathode current efficiency in the preparation of Y-Mg intermediate alloys via molten salt electrolysis and to evaluate the reproducibility and reliability of the experimental process, three parallel experiments were conducted under conditions of a total current of 350 A and an electrolysis time of 1 h. The cathode current efficiency is calculated based on Faraday’s law of electrolysis formula 4 and the results are shown in Table 1. The cathode current efficiencies for the three experiments were 80.76%, 81.91%, and 78.29%, respectively, with an average of 80.32%. This result confirms the stability of the electrolytic process and provides a reliable baseline for subsequent optimization.

Table 1.
Calculation results for cathode current efficiency.
In the equation, η represents the cathode current efficiency; mactual denotes the actual alloy mass of deposited metal, g; mtheoretical represents the theoretical alloy mass of deposited metal, g; I is the total current, A; t is the electrolysis time, s; M is the molar mass of deposited metal, g·mol−1; n is the number of electrons transferred per metal ion in the deposition reaction; F is the Faraday constant, 96,485 C·mol−1.
Figure 15 illustrates the appearance of the Y-Mg alloy synthesized in the LiF-YF3-MgF2-Y2O3-MgO molten salt, characterized as a silver-white metal exhibiting metallic luster. The alloy was found to contain 88.38 wt% Y and 11.62 wt% Mg, as determined by ICP-MS analysis. Figure 16 presents the XRD pattern of the alloy, it was concluded that the predominant phase present in the Y-Mg alloy is MgY. By correlating this data with the Y-Mg phase diagram shown in Figure 17, Significant deviations exist between the actual ICP-MS measured compositions and the predicted phases from the Y-Mg phase diagram. This discrepancy likely stems from the thermodynamic limitations of the Y-Mg phase diagram. The Y-Mg binary phase diagram is a phase equilibrium model constructed based on equilibrium thermodynamics theory, capable of accurately describing phase composition patterns only under ideal equilibrium conditions such as isothermal solidification and complete diffusion. However, the actual molten salt electrolysis preparation process struggles to satisfy these prerequisites. On the one hand, the rapid solidification effect during alloy cooling prevents thermodynamic processes like peritectic reactions and eutectic transformations from fully occurring, leading to deviations from the equilibrium phase compositions predicted by phase diagrams. On the other hand, the thermodynamic databases of existing Y-Mg phase diagrams remain incomplete and lack sufficient experimental validation, limiting the accuracy of phase composition predictions in this region. Furthermore, inevitable trace impurities (such as O, C, etc.) in actual alloy systems alter the phase equilibrium relationships of the original binary system, further exacerbating the deviation between phase diagram predictions and actual phase compositions.
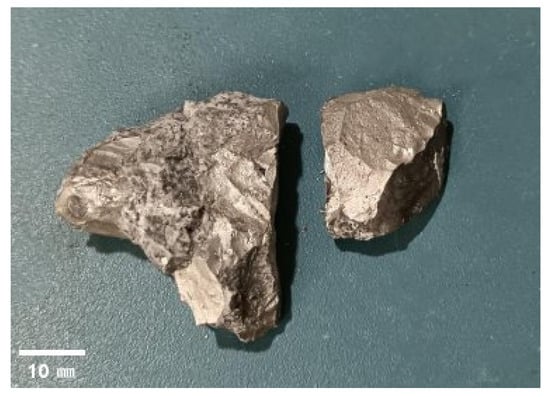
Figure 15.
Appearance of yttrium–magnesium alloys obtained by molten salt electrolysis.
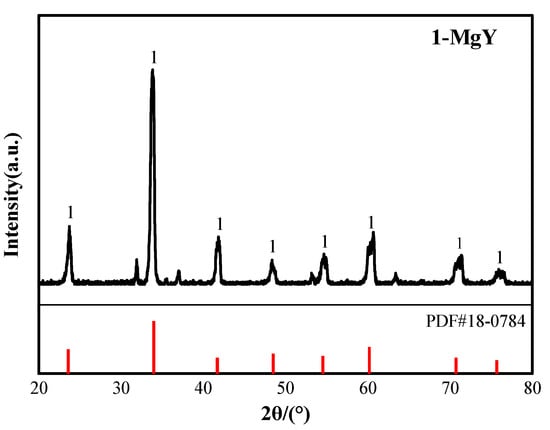
Figure 16.
X-ray diffraction pattern of Y-Mg alloy.
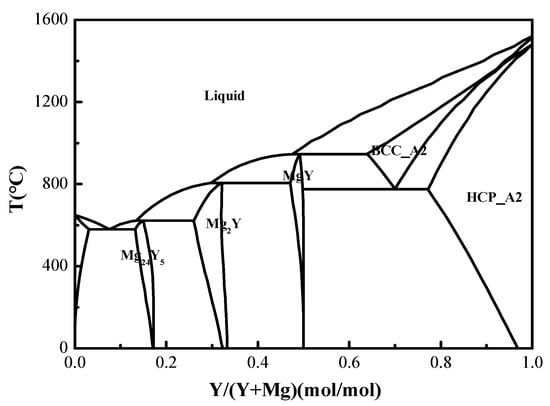
Figure 17.
Binary phase diagram of Y-Mg alloy.
Figure 18 presents the results of EMPA analysis for the Y-Mg alloy core. As illustrated in Figure 18, the microscopic morphology of the Y-Mg alloy comprises a dark gray matrix (points A, B, and C) alongside light gray circular or elliptical regions (points a, b, and c). Table 2 provides the quantitative analysis results for the dark gray matrix region at points A, B, and C (Data are presented as mean values, with an estimated analytical uncertainty of ±2% relative for major elements). The atomic percent ratio of Y to Mg was approximately 1:1, as confirmed by averaging the atomic percentages from these three points; this indicates that the dark gray matrix corresponds to the MgY phase. Table 3 details the EMPA quantitative analysis results for both dark and light gray oval regions at points a, b, and c (data are presented as mean values, with an estimated analytical uncertainty of ±2% relative for major elements). These regions were found to contain negligible amounts of Mg element, suggesting that only metallic Y phase is present in the light gray ellipsoidal region. The distribution of Y element within the alloy appears diffuse while Mg is predominantly concentrated within the matrix. The SEM image in Figure 19a reveals that the alloy primarily consists of two distinct regions appearing as light gray and dark gray in the SEM image. EDS point scanning analysis (Figure 19b) indicates that point 1 in the light gray region exhibits a Y content of 100 at% and a Mg content of 0 at%, confirming that only the Y phase is present in this area. Point 2 in the dark gray region shows Y content of 54.07 at% and Mg content of 45.93 at% (Figure 19c). The Y:Mg atomic ratio at point 2 is approximately 1:1, indicating that Mg is predominantly distributed in the dark gray region as YMg phase. EDS surface scanning analysis indicates that Y is diffusely distributed throughout the alloy with relatively uniform distribution. Mg is predominantly distributed in the dark gray regions of the alloy. This is consistent with the EPMA characterization results. Concurrently, SEM observation revealed that the yttrium–magnesium alloy matrix exhibited a uniform and dense microstructure. Oxides, being non-metallic inclusions, typically exist within the matrix as irregularly shaped particles or lumps. No such abnormal morphology was detected under SEM. Subsequent EDS compositional analysis confirmed the presence of only yttrium and magnesium, with proportions consistent with the alloy design. No additional oxygen enrichment was observed, proving that no oxides were formed.
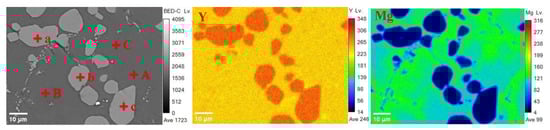
Figure 18.
Y-Mg alloy EPMA analysis results.
Table 2.
Quantitative analysis results of points in the dark gray matrix region.
Table 3.
Quantitative analysis results of light gray elliptical area points.
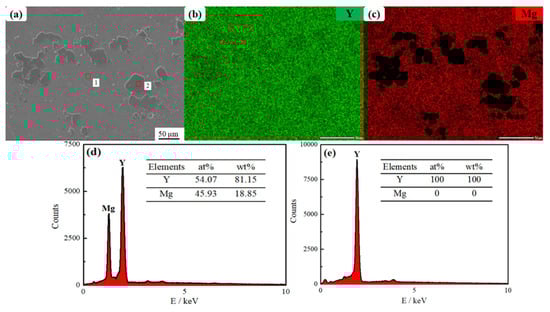
Figure 19.
(a) Scanning electron microscopy (SEM) images of Y-Mg intermediate alloy; (b,c) Elemental analyses of Y and Mg by EDS surface scans; (d,e) Elemental analysis of EDS point scans of points 1 and 2 in the SEM image shown in (a).
4. Conclusions
The electrochemical reduction of Y(III) in the LiF-YF3-MgF2-Y2O3-MgO molten salt is a reversible process governed by the mass transfer rate. In contrast, the electrochemical reduction of Mg(II) is an irreversible process also influenced by the mass transfer rate. The diffusion coefficients for Y(III) and Mg(II) are 3.98 × 10⁻⁵ cm2/s and 1.16 × 10⁻³ cm−2/s, respectively. The electrochemical reduction of Y(III) involves a single-step three-electron transfer reaction, which can be represented by the following equation: Y(III) + 3e− → Y. In a similar manner, the electrochemical reduction of Mg(II) is characterized by a single-step two-electron transfer reaction, represented by the equation: Mg(II) + 2e− → Mg. Y(III) and Mg(II) are underpotentially deposited onto an inert electrode to produce a yttrium–magnesium alloy comprising 88.38 wt% yttrium and 11.62 wt% magnesium. This alloy predominantly exists in the form of MgY, with the yttrium element uniformly dispersed throughout the alloy matrix.
Author Contributions
Conceptualization, W.S., Q.Z. and B.S.; Methodology, W.S. and F.Z.; Software, W.S. and B.S.; Validation, W.S., Q.Z. and Y.L.; Formal analysis, Q.Z.; Investigation, W.S., Q.Z. and B.S.; Resources, F.Z., J.P. and Y.L.; Data curation, W.S. and Q.Z.; Writing—original draft, W.S.; Writing—review & editing, F.Z.; Visualization, J.P. and Y.L.; Supervision, F.Z. and J.P.; Project administration, F.Z., J.P. and Y.L.; Funding acquisition, F.Z., J.P. and Y.L. All authors have read and agreed to the published version of the manuscript.
Funding
Project supported by the Novel High-Efficiency Energy-Saving Electrolytic Cell and Intelligent Smelting Integration Technology (2024KJTW0002); the Central Government Guided Local Science and Technology Development Funds Project (2024ZY0141); the Key Technology Research on Green Beneficiation & Metallurgy and High-Value Application of Rare Earths (YLXKZX-NKD-002); the Natural Science Foundation of China (52564047).
Institutional Review Board Statement
Not applicable.
Informed Consent Statement
Not applicable.
Data Availability Statement
The original contributions presented in this study are included in the article. Further inquiries can be directed to the corresponding authors.
Conflicts of Interest
The authors declare no conflicts of interest.
References
- Alan, A.L. Magnesium casting technology for structural applications. J. Magnes. Alloys 2013, 1, 2–22. [Google Scholar]
- Liu, B.; Tang, A.-T.; Pan, F.-S.; Zhang, J.; Peng, J.; Wang, J.-F. Improvement and application of neural network models in development of wrought magnesium alloys. Trans. Nonferrous Met. Soc. China 2011, 21, 885–891. [Google Scholar] [CrossRef]
- Yang, Z.; Li, J.P.; Zhang, J.X.; Lorimer, G.W.; Robson, J. Review on research and development of magnesium alloys. Acta Metall. Sin. (Engl. Lett.) 2008, 21, 313–328. [Google Scholar] [CrossRef]
- Kulekci, M.K. Magnesium and its alloys applications in automotive industry. Int. J. Adv. Manuf. 2008, 39, 851–865. [Google Scholar] [CrossRef]
- Wang, J.; Li, M.; Han, W.; Liu, Z.-Y.; Yang, X.-G.; Sun, Y. Electrochemical co-reduction of holmium and magnesium ions in eutectic LiCl-KCl salts. Rare Met. 2022, 41, 1394–1402. [Google Scholar] [CrossRef]
- Zagórski, I.; Józwik, J. Aviation Magnesium Alloys Milling—The Case Study. In Proceedings of the 2021 IEEE 8th International Workshop on Metrology for AeroSpace (MetroAeroSpace), Naples, Italy, 23–25 June 2021; pp. 371–375. [Google Scholar]
- Han, N.; Sheng, X.; He, G.; Li, M.; Han, Y.; Huang, H.; Zou, J.; Liu, K. Research Progress and Prospect of Rare-Earth Magnesium Alloy Prepared by Molten Salt Electrolysis Method. Heat Treat. Technol. Equip. 2021, 42, 56–59. [Google Scholar]
- Belgacem, Y.B.; Khaldi, C.; Boussami, S.; Lamloumi, J.; Mathlouthi, H. Electrochemical properties of LaY2Ni9 hydrogen storage alloy, used as an anode in nickel-metal hydride batteries. Solid State Electron. 2014, 18, 2019. [Google Scholar] [CrossRef]
- Tao, W.; Milin, Z.; Zhongyi, N.; Bin, L. Influence of rare earth elements on microstructure and properties of Mg-Li alloys. J. Rare Earths 2006, 24, 797–800. [Google Scholar] [CrossRef]
- Liu, Y.; Chen, G.; Yu, B.; Huang, H.; Zhang, Q.; Zhang, W. Progress in the technological study of the preparation of rare earth metals by molten salt electrolysis. Rare Earths 2021, 42, 133–143. [Google Scholar]
- Han, W.; Li, M.; Zhang, M.L.; Yan, Y.D. Progress in preparation of rare earth metals andalloys by electrodeposition in molten salts. Rare Met. 2016, 35, 811–825. [Google Scholar] [CrossRef]
- Bermejo, M.R.; Gomez, J.; Martínez, A.M.; Barrado, E.; Castrillejo, Y. Electrochemistry of terbium in the eutectic LiCl-KCl. Electrochim. Acta 2008, 53, 5106. [Google Scholar] [CrossRef]
- Pang, S.M.; Yan, S.H.; Li, Z.A.; Chen, D.H.; Xu, L.H.; Zhao, B. Development on molten salt electrolytic methods and technology for preparing rare earth metals and alloys in China. Chin. J. Rare Met. 2011, 35, 440. (In Chinese) [Google Scholar]
- Yan, Q.; Guo, X. Preparation and characterization of Sm2Fe17 alloy in LiF-CaF2-SmF3 molten salt. J. Alloys Compd. 2018, 747, 994–1001. [Google Scholar] [CrossRef]
- Yan, Q.; Guo, X. Electrochemical behavior for preparation of Sm2Fe17 in CaCl2-CaF2-SmCl3 system. J. Alloys Compd. 2019, 789, 976–982. [Google Scholar] [CrossRef]
- Liu, K.; Liu, Y.L.; Chai, Z.F.; Shi, W.Q. Evaluation of the electroextractions Ce and Nd from LiCl-KCl molten salt using liquid Ga electrode. Electrochem. Soc. 2017, 164, D169. [Google Scholar] [CrossRef]
- Sahoo, D.K.; Satpati, A.K.; Krishnamurthy, N. Electrochemical properties of Ce(III) in an equimolar mixture of LiCl-KCl and NaCl-KCl molten salts. RSC Adv. 2015, 5, 33163. [Google Scholar] [CrossRef]
- Han, W.; Zhao, Q.; Wang, J.; Li, M.; Liu, W.; Zhang, M.; Yang, X.; Sun, Y. Electrochemical behavior of Y(III) and preparation of Y-Ni intermetallic compounds in molten LiCl-KCl salts. Rare Earths 2017, 35, 90. [Google Scholar] [CrossRef]
- Han, W.; Li, W.; Li, M.; Li, Z.; Sun, Y.; Yang, X. Electrochemical co-reduction of Y(III) and Zn(II) and extraction of yttrium on Zn electrode in LiCl-KCl eutectic melts. J. Solid State Electrochem. 2018, 22, 2435–2444. [Google Scholar] [CrossRef]
- Yang, Y.; Yan, H.; Yang, P.; Liu, Z.; Yang, G. Electrochemical reduction of Al(III) and Si(IV) in the NaF-AlF3-Al2O3-SiO2 molten salt system and preparation of homogeneous Al-Si alloys by molten salt electrolysis. Mater. Chem. Phys. 2024, 326, 129801. [Google Scholar] [CrossRef]
- Yang, S.H.; Yang, F.L.; Liao, C.F.; Li, M.Z.; Wang, X. Electrodeposition of magnesium-yttrium alloys by molten salt electrolysis. J. Rare Earths 2010, 28, 385–388. [Google Scholar] [CrossRef]
- Yu, B.; Yan, Q. Continuous preparation of composition-controllable Y-Ni alloy in LiF-YF3-Y2O3 molten salt. J. Rare Earths 2023, 41, 632–638. [Google Scholar] [CrossRef]
- He, S.; Li, Z.; Yan, S.; Wang, Z.; Pang, S.; Chen, B. Study on the cathodic process of yttrium-magnesium alloy co-deposited by oxide electrolysis in YF3-LiF molten salt system. J. Rare Earths 2007, 25, 120–123. [Google Scholar]
- Deng, W.P.; Zeng, X.D.; Chi, X.D. Electrolytic production of magnesium-yttrium alloys and yttrium metal by molten salt electrolysis. Rare Earths 1997, 18, 59–62. [Google Scholar]
- Kang, J.; Yan, Q.; Liu, Y.; Yu, B.; Zhao, E.; Zhang, Q.; Huang, H. Progress in the preparation of Sm alloys by molten salt electrolysis. Mater. China 2022, 41, 148–155. [Google Scholar]
- Yu, G.; Zhou, L.; Liu, F. Electrochemical co-reduction of Y(III) and Al(III) in a fluoride molten salt system and electrolytic preparation of Y-Al intermediate alloys. J. Rare Earths 2022, 40, 1945–1952. [Google Scholar] [CrossRef]
- Wu, Y.; Cai, M.; Wang, H.; Hu, Z.; Pang, F.; Chen, X.; Zhao, M.; Wang, B.; Zhang, X.; Liu, X.; et al. Preparation of Pb-Ca Master Alloy by Molten Salt Electrolysis. J. Electrochem. Soc. 2023, 170, 122505. [Google Scholar] [CrossRef]
- Li, M.; Liu, Y.; Sun, Z.; Han, W.; Zhang, M.; Yang, X. Electrochemical Co-reduction of Bi(III) and Y(III) and Extracting Yttrium from Molten LiCl-KCl Using Liquid Bi as Cathode. Chem. Res. Chin. Univ. 2019, 35, 60–64. [Google Scholar] [CrossRef]
- Li, M.; Guo, X.; Liu, Y.; Liu, R.; Zhang, M.; Sun, Y.; Han, W. Electrochemical co-reduction of Mg(II), Al(III) and Nd(III) in the LiCl-NaCl-MgCl2-AlF3 melts. J. Solid State Electrochem. 2024, 28, 3123–3132. [Google Scholar] [CrossRef]
- Yang, Q.; Ge, J.; Zhang, J. Electrochemical study on the kinetic properties of Fe2+/ Fe, Ni2+/Ni, Cr2+/Cr and Cr3+/Cr2+ in molten MgCl2-KCl-NaCl salts. Electrochem. Soc. 2021, 168, 12504. [Google Scholar] [CrossRef]
- Yin, T.-Q.; Liang, Y.; Qu, J.-M.; Li, P.; An, R.-F.; Xue, Y.; Zhang, M.-L.; Han, W.; Wang, G.-L.; Yan, Y.-D. Thermodynamic and electrochemical properties of praseodymium and the formation of Ni-Pr intermetallics in LiCl-KCl melts. Electrochem. Soc. 2017, 164, D835. [Google Scholar] [CrossRef]
- Zhou, L.; Li, Z.A.; Chen, D.H.; Wang, Z.Q.; Pang, S.M.; Zhao, B. Electrochemical mechanism of preparing Sm-Fe alloy by molten salts electrolysis in LiF-CaF2-SmF3 system. Chin. J. Rare Met. 2017, 41, 190–195. [Google Scholar]
- Han, W.; Ji, N.; Li, M.; Wang, S.S.; Yang, X.G.; Zhang, M.L.; Yan, Y.D. Electrochemical Formation of Al-Tb Alloys from Tb4O7 Fluorinated by AlF3 in NaCl-KCl Melts. Acta Phys.-Chim. Sin. 2016, 32, 2538–2544. [Google Scholar] [CrossRef]
- Guan, J.; Xie, K.; Liu, A.; Shi, Z.; Chen, G.; Boca, M. Study on the mechanism of Al-Si alloy preparation via aluminothermic reduction–molten salt electrolysis in KF-AlF3 molten salt. Mater. Today Commun. 2021, 29, 102959. [Google Scholar] [CrossRef]
Disclaimer/Publisher’s Note: The statements, opinions and data contained in all publications are solely those of the individual author(s) and contributor(s) and not of MDPI and/or the editor(s). MDPI and/or the editor(s) disclaim responsibility for any injury to people or property resulting from any ideas, methods, instructions or products referred to in the content. |
© 2025 by the authors. Licensee MDPI, Basel, Switzerland. This article is an open access article distributed under the terms and conditions of the Creative Commons Attribution (CC BY) license (https://creativecommons.org/licenses/by/4.0/).