Abstract
The growing use of AI-supported recruitment systems raises concerns related to model opacity, auditability, and ethically sensitive decision-making, despite their predictive potential. In human resource management, there is a clear need for recruitment solutions that combine analytical effectiveness with transparent and explainable decision support. Existing approaches often lack coherent, multi-layered architectures integrating expert knowledge, machine learning, and interpretability within a single framework. This article proposes an interpretable, multi-layered recruitment model designed to balance predictive performance with decision transparency. The framework integrates an expert rule-based screening layer, an unsupervised clustering layer for structuring candidate profiles and generating pseudo-labels, and a supervised classification layer trained using repeated k-fold cross-validation. Model behavior is explained using SHAP, while Necessary Condition Analysis (NCA) is applied to diagnose minimum competency thresholds required to achieve a target quality level. The approach is demonstrated in a Data Scientist recruitment case study. Results show the predominance of centroid-based clustering and the high stability of linear classifiers, particularly logistic regression. The proposed framework is replicable and supports transparent, auditable recruitment decisions.
1. Introduction
1.1. State of the Art and Motivation
The rapid development of artificial intelligence has made machine learning-based tools an integral part of human resource management processes, particularly recruitment. Organizations are increasingly using algorithms for automatic application filtering, candidate profiling, and predicting job fit, which helps reduce costs and shorten time-to-hire [1,2]. At the same time, risks associated with model opacity, the potential reinforcement of biases encoded in historical data, and the need to align AI systems with regulatory requirements—such as the EU’s AI Act—are becoming more pronounced [3]. In this context, solutions that combine high predictive performance with the ability to explain and audit algorithmic decisions gain crucial importance [4,5].
Artificial intelligence (AI) plays an increasingly significant role in human resource management (HRM), transforming the processes of recruitment, selection, and employee development [6]. As early as the 1980s, the first computer-based tools supporting recruitment emerged—rule-based applicant tracking systems (ATS) designed to manage the influx of candidate resumes [7]. In the following decades, technological progress accelerated: in the 1990s, the digitization of HR data and the advent of the internet enabled the creation of candidate databases, while the early 2000s saw the emergence of professional networking platforms (e.g., LinkedIn) and more advanced ATS capable of filtering applications based on keywords. Simultaneously, the first recruitment chatbots were introduced, automating communication with candidates. However, concerns were already being raised at that time—algorithms trained on historical data could reinforce existing biases and unfairness in the recruitment process [8].
Since around 2015, there has been a sharp increase in the use of machine learning and deep learning in HR [9,10]. AI has evolved from a tool for administrative support into a strategic component of personnel decision-making. Recruitment today employs intelligent talent search systems that scan the internet and CV databases for suitable candidates, initial screening using AI (e.g., job interviews conducted by chatbots), and even controversial analyses of speech, facial expressions, and behavior in video interview recordings [11]. In the areas of employee development and retention, predictive algorithms are used, such as models forecasting employee attrition risk (supporting retention efforts) and systems recommending career paths and training tailored to an employee’s profile [12]. AI also supports the monitoring of compliance and procedural adherence in HR. These tools provide HR departments with vast amounts of data and insights, enabling more informed, data-driven personnel decisions. Consequently, the HR function has evolved from a purely administrative role to a strategic partner supporting business goals [13].
Surveys indicate a growing adoption of AI—globally, nearly half of organizations report already using AI tools in HR functions [14], and most of the remainder plan to implement them in the near future. AI enables companies to automate tedious administrative tasks, accelerate candidate screening (algorithms can filter hundreds of resumes in a fraction of the time it takes a human), and reduce recruitment costs [9]. For example, it is estimated that the use of AI in recruitment can lower hiring costs by up to ~30% and shorten time-to-hire by 50% [14]. As a result, AI has become a key driver of HR transformation, ushering in the era of data-driven recruitment [15].
Despite its undeniable benefits, the use of AI in HRM raises significant ethical challenges. The most serious of these is the risk of bias and discrimination. Algorithms trained on historical HR data can unknowingly adopt and reinforce the biases present in those data—if, for instance, a certain group of candidates was favored in the past, the system may begin to replicate these preferences automatically [16,17]. A well-known example is Amazon’s 2018 case, where an internal AI system for resume evaluation learned to reject female candidates. The model, trained on resumes historically submitted to the company (which were predominantly from men), identified female gender as a factor lowering candidate quality, penalizing occurrences of the word “women’s” (e.g., “women’s chess club”) in resumes and downgrading graduates of women’s colleges [18]. Despite efforts to correct the algorithm, it found alternative ways to replicate the bias, ultimately leading to the project’s abandonment. This case highlights how an opaque AI model can discriminate against a specific group and how difficult it is to detect and eliminate such behavior without appropriate explainability mechanisms. Unfortunately, gender is only one of many potential sources of bias—others include age, ethnicity, and disability—which an uncontrolled AI may begin to treat as selection criteria if they correlate with success in historical recruitment data.
Accountability and human oversight of decisions is a crucial ethical aspect of using AI in HR. Critics argue that key decisions affecting people’s lives—such as hiring or rejecting a candidate—should not be left solely to machines, particularly since algorithms lack human empathy and situational context [19]. Philosophers in the field of technology ethics contend that AI is incapable of reflecting the social values and intuition necessary when evaluating employees [20]. There have been instances where systems recommended unsuitable candidates due to errors or limitations in training data [21]. For this reason, the principle of “human-in-the-loop” is being introduced, ensuring human supervision over critical decisions and the ability to verify and correct AI recommendations [22].
The European Union has developed the Artificial Intelligence Act (AI Act), which classifies AI systems used in employment as high-risk. This will entail, among other things, requirements for transparency, documentation, impact assessments regarding individuals’ rights, and human oversight of final decisions [23]. Non-compliance with these regulations may result in severe penalties—in the EU, fines of up to 6–7% of a company’s global turnover are planned [19]. This regulatory trend clearly indicates that the social acceptance of AI in HR will depend on meeting ethical requirements—algorithms must operate transparently, fairly, and with respect for candidates’ rights, or their use may be legally restricted.
In light of the above challenges, the interpretability of AI models used in HRM becomes crucial. Interpretability refers to a model’s ability to present its functioning in a form understandable to humans, allowing one to trace why a particular decision was made [24]. This concept is closely tied to the field of Explainable Artificial Intelligence (XAI), a set of methods that make it possible to explain the behavior of even complex, black-box algorithms. The goal of XAI is to provide users with clear and detailed justifications for AI-driven decisions [25]. For example, in a recruitment context, candidates rejected by an AI system may want to know which specific aspects of their resume led to the negative outcome, while HR managers relying on AI recommendations should be able to understand on what basis the algorithm deemed a candidate suitable for a position [26].
The application of XAI in HR practice brings tangible benefits. First, it increases trust in AI systems [26]. Second, transparency enhances candidates’ perception of fairness in recruitment processes. Third, XAI enables the identification and correction of biases by revealing systematic patterns in feature contributions across decisions. In this way, interpretability becomes a tool for ensuring ethical AI behavior, producing models that are more resistant to bias and aligned with the principle of equal treatment of candidates.
A review of the literature reveals that research on the application of AI in HRM tends to focus primarily on two relatively separate areas: first, on developing increasingly effective predictive models to support recruitment decisions, and second, on identifying ethical risks, biases, and general calls for algorithmic transparency. While studies on XAI in HR are emerging, along with isolated case-based examples illustrating the functioning of specific explainability techniques, these typically address a single layer of the model (e.g., classifier explanation) and are not embedded in a coherent, multi-module recruitment architecture. At the same time, the approach based on Necessary Condition Analysis (NCA) remains relatively rare in the HRM literature and is mostly used in strictly theoretical research rather than as an integral part of validating algorithmic selection systems.
1.2. Contribution of the Article
There is therefore a lack of comprehensive, formally described recruitment architectures that integrate expert knowledge, unsupervised data structuring methods, supervised classification models, and Explainable AI techniques, while also subjecting the results to additional validation through Necessary Condition Analysis. This article addresses that gap by proposing a multi-layered, fully formalized and replicable recruitment model that integrates expert rules, unsupervised clustering, supervised classification, feature-level explainability (SHAP), and validation using NCA.
The proposed framework balances predictive stability with transparency and auditability, aligning algorithmic decision-making with ethical and regulatory requirements. Its operation is illustrated through a case study on recruitment for a Data Scientist position, demonstrating how successive analytical layers interact and how explanations and diagnostic insights can be generated at different stages of the recruitment process. The article concludes with a discussion of theoretical contributions, practical implications for HR decision support, methodological limitations, and directions for future research.
2. Materials and Methods
To clarify the overall structure of the proposed approach, a high-level overview of the multi-layered recruitment model is presented in Figure 1.
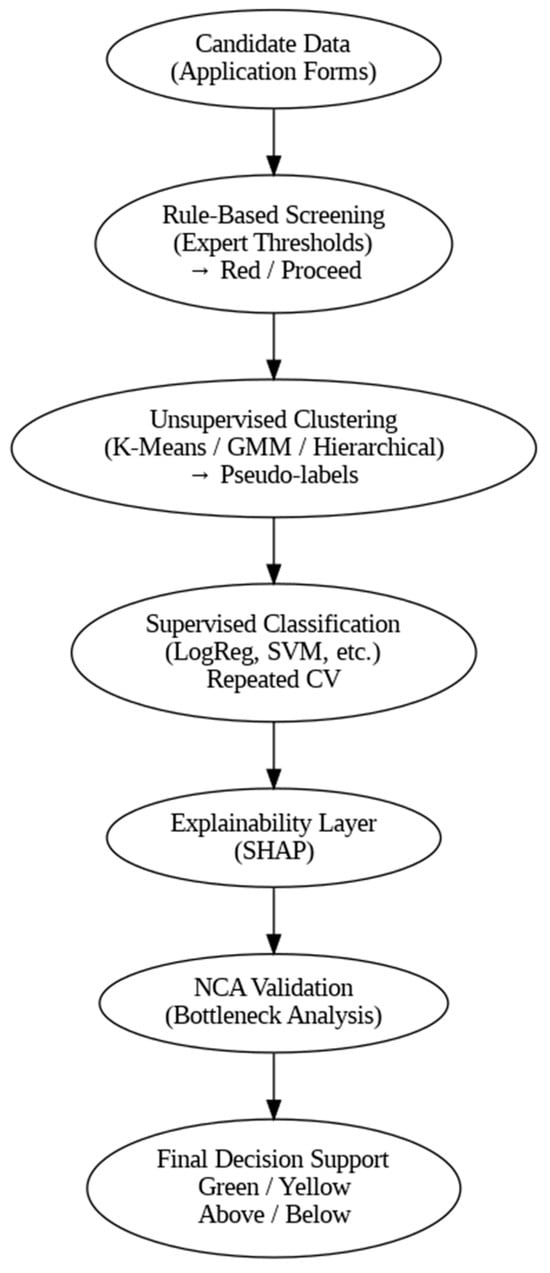
Figure 1.
Overview of the proposed multi-layered recruitment model.
As illustrated in Figure 1, the recruitment process is organized as a sequential, multi-layered pipeline integrating expert knowledge, unsupervised learning, supervised classification, explainability mechanisms, and additional validation. Each layer serves a distinct analytical role, jointly supporting transparent and auditable decision-making while reducing uncertainty at successive stages of candidate evaluation. This layered structure reflects the need to model recruitment as a complex decision process rather than a single predictive task.
The complexity of recruitment processes—which involve multidimensional relationships between competencies, experience, and cultural fit—requires modeling approaches similar to those used in socio-economic systems characterized by high levels of uncertainty [27]. In this context, the proposed recruitment model is based on a multi-layered analytical architecture integrating expert rules, unsupervised learning methods, supervised classification models, and Explainable AI (XAI) techniques. The recruitment model is designed to simultaneously ensure high predictive performance and full interpretability of decisions. The developed model can be represented as a procedure consisting of five steps.
Step 1.
Developing a Set of Evaluation Criteria for Candidate Application Forms:
In this step, the recruiter must define the criteria for evaluating candidates for a specific job position. The nature of these criteria is flexible in the sense that candidate responses may take the form of both quantitative and qualitative variables, and may be expressed on either continuous or discrete scales.
Step 2.
Defining Minimum Thresholds for Evaluation Criteria Enabling Interview Invitation (Rule-Based Layer—Preliminary Filtering):
Step 2 reflects the expert requirements of the recruiter in the form of a set of deterministic rules. Each candidate is evaluated against the minimum criteria necessary to perform the given professional role. Candidates who do not meet even one mandatory condition are automatically assigned to the rejected class (red cluster). The rule layer can be described by the following mathematical structure:
Let (1):
denote the feature vector of candidate i, and let
be the set of necessary rules defined by the domain expert (2).
Each rule takes the form (3):
A candidate is admitted to further analysis if (4):
Otherwise, the candidate is classified into class (“rejected candidate”).
The set of data proceeding to the next layer can be denoted as (5):
Candidates who meet the requirements proceed to the next layer. This stage is responsible for reducing the problem space and ensuring the model’s compliance with expert domain knowledge.
Step 3.
Implementation of the Machine Learning Process (Second and Third Layer):
In this step, machine learning algorithms are applied to the subset of candidates who meet the minimum rule-based requirements.
Categorical and ordinal variables were encoded in a manner consistent with their semantic meaning. Education level (f1) was treated as an ordinal feature and mapped to consecutive numeric codes according to a predefined ordering reflecting increasing educational attainment. Binary variables (f2, f18) were normalized to a consistent representation by mapping yes/no responses to 1/0 values. Continuous variables, including years of experience (f3, f4) and self-assessed competency ratings measured on a 1–5 Likert-type scale (f5–f17), were treated as numeric features. To ensure comparability of feature magnitudes and to prevent scale-dominated effects in distance-based and linear models, feature scaling was applied within each cross-validation fold, with scaling parameters estimated exclusively on the training data and subsequently applied to the corresponding validation sets. After applying the rule-based pre-filtering layer, the remaining candidate pool used in subsequent clustering and classification stages did not exhibit substantial class imbalance, mitigating the risk of biased model fitting due to skewed class distributions.
The purpose of this application is to assign candidates to one of two clusters: the green cluster (invited to interview) and the yellow cluster (reserve candidates). To ensure a reliable assessment of model performance and to limit the impact of random data partitioning on results, it is proposed to use the Repeated K-Fold Cross-Validation procedure. This method involves repeatedly and randomly applying the standard k-fold cross-validation [28]. For instance, a configuration of = 10 (ten folds) and = 10 repetitions may be used, which results in a total of 100 independent validation iterations. The cross-validation procedure consists of the following stages:
Stage 1. Random Data Partitioning (First Level—“Folds”)
For each validation repetition:
- The full dataset is randomly permuted.
- The data are then divided into, for example, ten mutually disjoint and equally sized subsets.
- In each of the ten iterations, one subset serves as the validation set, while the remaining nine form the training set.
In this way, ten folds are obtained within a single repetition.
Stage 2. Repetition of the Procedure (Second Level—“Repeats”)
The process described in Stage 1 is repeated, e.g., ten times, each time initializing a new random permutation of the dataset. These repetitions are intended to ensure that:
- each element of the dataset appears in the validation set multiple times,
- variability resulting from random data partitioning is significantly reduced,
- model performance estimates are more stable and reliable.
As a result of carrying out Stages 2 and 3, a total of 100 distinct training-validation configurations are obtained.
Stage 3. Data Scaling Within Folds
To avoid information leakage, feature normalization must be performed exclusively on the training set of each fold:
- The training set can be scaled using methods such as Standard Scaling or Min-Max Scaling.
- The scaler parameters are then applied to transform the validation set.
This ensures that the validation process adheres fully to the principles of a fair experiment.
Stage 4. Clustering Within the Fold and Selection of the Best Algorithm
Within each fold, on the normalized training set, the following is performed:
- Independent fitting of unsupervised clustering algorithms, such as:
- K-Means,
- Gaussian Mixture Model,
- Agglomerative Clustering.
The K-Means algorithm is one of the most commonly used unsupervised clustering methods, aimed at partitioning a set of observations into disjoint clusters by minimizing within-cluster variance [29]. Each cluster is represented by a centroid, which is the arithmetic mean of the points assigned to it. The algorithm operates iteratively, alternately assigning observations to the nearest centroid and updating the centroids’ positions until convergence is achieved. The objective function of K-Means takes the form (6):
where denotes the set of observations in cluster , and is the centroid vector of that cluster.
The Gaussian Mixture Model, on the other hand, is a probabilistic approach to clustering, in which it is assumed that the data originate from a mixture of multivariate normal distributions. Unlike K-Means, GMM allows for soft assignment of observations to clusters by estimating membership probabilities [30]. The model parameters (means, covariance matrices, and component weights) are typically estimated using the EM (Expectation–Maximization) algorithm. The mixture density function takes the form (7):
where denotes the weight of the -th component (), and is the normal distribution with mean and covariance matrix .
Agglomerative Clustering, in turn, is a bottom-up hierarchical clustering method in which each observation is initially treated as a separate cluster. Then, in subsequent iterations, the most similar clusters are merged until a predefined number of clusters is reached or a complete hierarchy in the form of a dendrogram is obtained. A key component of the algorithm is the definition of the distance measure between clusters (the so-called linkage), such as single, complete, or average linkage [31]. For example, in the case of average linkage, the distance between two clusters A and B is defined as (8):
- For each algorithm, cluster labels are generated only for the training data.
- Based on these labels, the silhouette coefficient is calculated (also only on the training data).
- The algorithm with the highest silhouette value is selected as the optimal clustering method for the given fold.
As a result, different folds could employ different unsupervised algorithms, depending on their local fit quality.
Stage 5. Generating pseudo-labels for the validation set
The selected clustering algorithm is then used to assign pseudo-labels to the validation set (classification into two clusters):
- if the algorithm had a prediction mechanism (e.g., K-Means, GMM), its predict() method was used;
- pseudo-labels using the Agglomerative algorithm were determined based on the nearest centroid of the clusters formed in the training set.
In this way, consistent mapping of clusters to validation data was ensured without using any information from outside the fold.
Because unsupervised clustering produces arbitrary label identifiers, an explicit and reproducible mapping procedure was introduced to assign decision semantics to the clusters. First, a scalar candidate quality score was defined as a weighted aggregation of selected key competencies: let denote the subset of competencies identified a priori as critical for the analyzed role. In the considered case, this subset includes . For each candidate , the quality score is computed as
where denotes the standardized value of competency for candidate , estimated within the training split only, and the weights satisfy and . In the default configuration used in this study, all competencies in are equally weighted, i.e., , to ensure full reproducibility and to avoid introducing implicit expert subjectivity into the mapping procedure. To verify the robustness of this mapping, alternative reasonable weighting schemes were evaluated, and in all tested cases the resulting green/yellow cluster assignment remained unchanged. Alternative weighting strategies, including expert-defined or data-driven weights, are possible; however, in this study the weighting scheme is treated as a controllable policy parameter rather than a learned model component.
Next, the mean value of this score was computed for each cluster, and the cluster with the higher mean quality score was consistently labeled as the “green” (recommended) cluster, while the other was labeled as the “yellow” (reserve) cluster. This procedure ensures reproducibility and avoids subjective interpretation of unsupervised cluster labels.
Stage 6. Training and Evaluation of Supervised Classifiers
For each iteration:
- Supervised classification models are trained on:
- normalized training data,
- pseudo-labels obtained from clustering.
- The models are then evaluated on the validation set, using the pseudo-labels assigned to the test data of the fold.
In the proposed model, it is suggested to employ supervised learning models such as the Naive Bayes classifier, Support Vector Machines (both linear and nonlinear), Decision Trees, the k-NN algorithm, Logistic Regression, Random Forest, and Gradient Boosting.
The Naive Bayes classifier is a probabilistic classification model based on Bayes’ theorem and the assumption of conditional independence of features with respect to the decision class. Despite this strong simplifying assumption, the algorithm often achieves high performance, especially in tasks involving a large number of features and a limited number of observations [32]. In the recruitment context, it enables fast and interpretable estimation of the probability that a candidate belongs to a given decision class. The decision rule takes the form (10):
Support Vector Machines, on the other hand, are classification methods based on the concept of maximizing the margin between classes [33]. In the linear case, SVM determines a decision hyperplane in the feature space, whereas the nonlinear variant employs a kernel function (the kernel trick), allowing for data separation in a higher-dimensional space. SVM is characterized by high robustness to overfitting and strong performance in high-dimensional spaces. The optimization problem for SVM takes the form (11):
subject to the constraints (12):
Decision Trees are classification models based on recursively partitioning the feature space according to if–then rules. Each node of the tree represents a decision based on the value of a single feature, and the leaves correspond to decision classes [34]. These models are highly interpretable, which makes them particularly useful in regulated contexts such as recruitment. A typical splitting criterion is the minimization of impurity (e.g., the Gini index) (13):
where denotes the proportion of class in node .
The kNN algorithm, in turn, is a non-parametric classification method based on the assumption that observations similar to each other in the feature space belong to the same class [35]. The classification decision for a new observation is made based on the classes of the k nearest neighbors in the training set, using a selected distance metric. The decision rule is given by (14):
where denotes the set of k nearest neighbors of observation .
Logistic regression is a linear probabilistic model used for binary classification, which models the probability of belonging to the positive class using the logistic function [36]. Despite its simple structure, this model offers high interpretability of coefficients and stability of estimation, which makes it a commonly used benchmark in comparative analyses. The prediction function is given by (15):
Random Forest is an ensemble machine learning algorithm that combines the predictions of multiple decision trees trained on random subsamples of the data and random subsets of features. This mechanism reduces model variance and improves its generalization ability [37]. Additionally, Random Forest allows for the estimation of feature importance, which is crucial from the interpretability perspective. The prediction of the tree ensemble is given by (16):
where denotes the prediction of the -th tree.
Gradient Boosting is an ensemble method based on the sequential training of weak models (most often decision trees), where each subsequent model corrects the errors made by the previous ones [38]. The training process is carried out by minimizing the loss function using the gradient method in the function space. This algorithm is characterized by high predictive performance, especially in complex classification problems. The general form of the model is given by (17):
where denotes a weak classifier, and is its weight determined during the optimization process.
Stage 7. Result Aggregation
After completing 100 folds:
- for each classification model, the mean and standard deviation of accuracy are calculated,
- the frequency of each clustering algorithm being selected as the “best” in a given fold is analyzed,
- final clustering is performed on the full dataset using the globally selected best algorithm.
The model selected should demonstrate the highest predictive stability and internal generalization capability. This layer constitutes the operational component of the system—it performs real-time classification for new candidates. It should be emphasized that the reported classification accuracy does not reflect predictive validity with respect to external hiring outcomes, but rather the fidelity with which supervised models reproduce the cluster assignments generated by unsupervised learning. Consequently, the metric should be interpreted as a measure of stability and consistency of the induced candidate segmentation.
All machine learning models were implemented using standard Python (3.12 version) libraries with default hyperparameter settings, unless stated otherwise. The number of clusters in the unsupervised stage was fixed a priori to two, reflecting the intended operational distinction between recommended and reserve candidates, and validated locally within folds using the silhouette coefficient. SHAP explanations were generated using the default configuration appropriate for the underlying model class, ensuring consistency of feature attribution across folds. Randomness was controlled by fixing random seeds where applicable (e.g., in clustering initialization and data splitting), allowing for reproducible results across repeated cross-validation runs.
Step 4.
Analysis of the Influence of Individual Features on Cluster Assignment (XAI Layer):
This step investigates which variables have a significant impact on assigning candidates to clusters. The goal of the XAI layer is to ensure transparency and interpretability of the decision-making process during recruitment. This is particularly important as candidate selection also carries ethical and legal implications. To assess the impact of individual features on cluster assignment, the SHAP method is proposed. It is based on Shapley values from cooperative game theory. The SHAP value describes the contribution of a given feature to the prediction by averaging its marginal contribution across all possible combinations of the remaining features. The Shapley value for feature i in this method is computed using Formula (18).
where
- —SHAP value for feature i
- —the set of all features
- —a subset of features not containing feature i
- ||—the number of elements in set S
- ||—the total number of features
- —the model prediction using only the features in set S
- —the model prediction using the features in set S plus feature i
- —values of the features in set S
SHAP is considered one of the most reliable and theoretically grounded methods for explaining machine learning models [39]. It should be noted that, beyond post hoc explanation techniques such as SHAP, an alternative approach to interpretability is offered by intrinsically interpretable models, in which transparency is embedded directly in the model structure. Examples include Fuzzy Cognitive Maps (FCMs), which represent causal relationships between variables in the form of weighted, directed graphs, allowing intuitive interpretation of system dynamics, and Explainable Boosting Machines (EBMs), which combine the predictive performance of ensemble methods with additive, human-interpretable representations of feature effects [40,41]. Such models provide faithful explanations by design and avoid some limitations of post hoc methods, including approximation errors and dependence on surrogate explanations. Unified frameworks such as Interpretml further support the development and comparison of both intrinsically interpretable models and post hoc explainability techniques within a consistent methodological ecosystem, facilitating informed choices between transparency, flexibility, and predictive performance depending on the application context [42]. Through the integration of interpretable XAI methods, the model remains transparent, compliant with AI ethics principles, and enables decision auditability.
Step 5.
Validation of the Obtained Clusters Using the Necessity Condition Analysis (NCA) Method:
As a result of the subsequent steps of the model, candidates have been classified, particularly into the green and yellow groups. Such clustering allows us to conclude that candidates in the green cluster are better than those in the yellow cluster. However, it cannot be ruled out that both clusters are weak (below the recruiter’s expectations) or that both are strong (above expectations). To provide the recruiter with comprehensive information on cluster quality, an additional validation step is required. The developed model proposes using the NCA method for this validation. Necessary Condition Analysis (NCA) is a method for identifying so-called necessary conditions for achieving a certain level of outcome [43]. Unlike traditional correlational and regression methods, which assess average effects (“the more X, the more Y on average”), NCA focuses on the logical necessity relationship, that is, it checks whether the absence of a certain level of X prevents achieving a high level of Y. Formally, X is a necessary condition for Y if high values of Y occur only when X exceeds a certain minimum threshold . One of the practical algorithms used in NCA is CE–FDH (Ceiling Envelopment—Free Disposal Hull) [43]. This method constructs a so-called ceiling line over the cloud of points (), representing observations. For the increasing ordered values of , it computes the maximum value of yachieved so far (19):
In this way, a monotonic curve is formed, representing the upper boundary of the observed outcomes. Then, for a given target level , the so-called bottleneck point is calculated—this is the smallest value of variable X for which the “ceiling” exceeds the level (20).
Interpretatively, represents the minimum level of the necessary condition that must be met in order to achieve the desired outcome . When applied to candidate evaluation, this method enables the identification of the minimum competence threshold (X) required to attain a satisfactory level of overall quality (Y). As a result, beyond merely classifying candidates into clusters (“Green”/”Yellow”), it becomes possible to further differentiate them into four categories, e.g., Green Above, Green Below, Yellow Above, Yellow Below, depending on whether they meet the necessary condition determined by the NCA.
3. Results
To evaluate the proposed model, a case study was conducted in which potential candidates for the position of Data Scientist completed a prepared application form. This form was developed by a Human Resource Management expert and reflects the key areas of knowledge and skills required for the specified position. The questionnaire was published on 17 November 2025, and data collection was concluded on 24 November 2025. It should be emphasized that the dataset used serves an illustrative purpose: its goal is to demonstrate the practical operation of the model and the interaction between subsequent layers of the algorithm, rather than to assess the model’s effectiveness in terms of general, multi-contextual validation. Thus, the collected data enable the demonstration of the model’s architecture and the rationale behind decision-making, in accordance with the concept presented in the Methods section.
Step 1.
Development of Evaluation Criteria for Candidate Application Forms:
Table 1 presents the evaluation criteria proposed by the recruiter for the Data Scientist position, along with the corresponding rating scales (the questionnaire constitutes Appendix A to this article).

Table 1.
Structure of the Application Form for the Data Scientist Position.
As a result of the recruitment process, 163 candidates applied and completed the described form.
Step 2.
Determining the minimum values for each evaluation criterion by the recruiter to allow an invitation to a job interview (rule layer—preliminary filtering):
In the second step, the recruiter formulated a list of minimum required values for each field in the completed form. This list is presented in Table 2.
Table 2.
List of minimum required values for individual evaluation criteria in the recruitment for the position of Data Scientist.
It turned out that 77 candidates did not meet the minimum requirements specified by the recruiter for the Data Scientist position. This means that these candidates are classified into the red cluster, which will not be invited to a job interview. The remaining candidates proceed to the next stages of the developed model procedure.
It should be noted that the rule-based filtering layer intentionally removes strongly mismatched candidates at an early stage, which naturally improves the performance and stability of subsequent analytical layers. This effect is considered a deliberate design choice rather than a methodological bias, as it directly reflects real-world recruitment practices, where candidates failing mandatory requirements are rejected upfront. Including such candidates in later modeling stages would be either operationally inefficient or introduce additional uncertainty without adding meaningful decision-support value.
Step 3.
Implementation of the machine learning process (second and third layer):
As part of this step, an unsupervised machine learning process was carried out using cross-validation (10 folds and 10 repetitions) for the following algorithms: K-Means, Gaussian Mixture Model, and Agglomerative Clustering. The purpose of this step was to assign pseudo-labels to the candidates in the training sets into two clusters (green and yellow). For each fold, labels were generated using the three mentioned algorithms, and based on the silhouette coefficient (calculated only for the training data); the cluster indicated by the most effective algorithm was selected. Naturally, in different iterations, different unsupervised learning algorithms turned out to be the most effective. The distribution of algorithm selection results is presented in Table 3.
Table 3.
Distribution of unsupervised learning algorithm selection results.
The unsupervised clustering layer plays a decision-support role by structuring the candidate space into internally coherent groups rather than producing definitive hiring decisions. The resulting clusters should therefore be interpreted as relative segments within the pool of candidates who passed the rule-based screening, reflecting comparative profiles of competencies rather than absolute measures of candidate quality. In this sense, clustering supports prioritization and differentiation in recruitment decisions by reducing complexity and highlighting meaningful patterns in candidate profiles.
The presented results clearly indicate that the K-Means algorithm was the most effective in the vast majority of validation iterations, achieving the highest silhouette score in 96 out of 100 configurations. The Gaussian Mixture Model proved to be the best in only 4 iterations, while Agglomerative Clustering was not selected even once as the optimal method. Such a clear dominance of K-Means suggests that the structure of the candidate data is best represented by a centroid-based approach, and the feature space forms relatively distinct, spherical clusters. In each iteration, after determining the pseudo-labels, supervised machine learning algorithms were implemented. The employed machine learning algorithms included: Naive Bayes classifier, Support Vector Machines (both linear and nonlinear), decision trees, the k-NN algorithm, logistic regression, random forest, and Gradient Boosting. These models were then evaluated on the validation set using the pseudo-labels assigned to the test data of the fold. Table 4 presents the results of supervised learning for the analyzed algorithms.
Table 4.
Results of the supervised machine learning process in the cross-validation model.
It should be emphasized that the supervised models are trained and evaluated using pseudo-labels derived from unsupervised clustering rather than external ground-truth hiring outcomes. Consequently, the reported classification accuracy reflects the fidelity with which a given model reproduces the clustering structure, rather than predictive validity with respect to job performance. This design choice improves stability and internal consistency of the decision pipeline, while allowing the supervised layer to serve as an efficient operational approximation of the clustering-based segmentation.
The comparison of results obtained by the analyzed classifiers indicates that logistic regression demonstrated the highest predictive accuracy, achieving an average accuracy of 0.9883 with the lowest standard deviation (0.06). Such high stability suggests that this model generalizes particularly well to the pseudo-label structure derived from clustering. Very good results were also achieved by the linear SVM (0.9750) and nonlinear SVM (0.9717), confirming the high separability of classes in the feature space and the relative linearity of the decision boundary. Models with more complex structures, such as Random Forests (0.9517) and k-NN (0.9525), achieved moderately high results, but their stability was lower compared to logistic regression and SVM. The weakest performance was recorded by Decision Trees (0.8475) and Naive Bayes (0.7933), indicating that these models may not be fully suitable for the characteristics of the candidate data. Figure 2 presents the accuracy distribution of all the models.
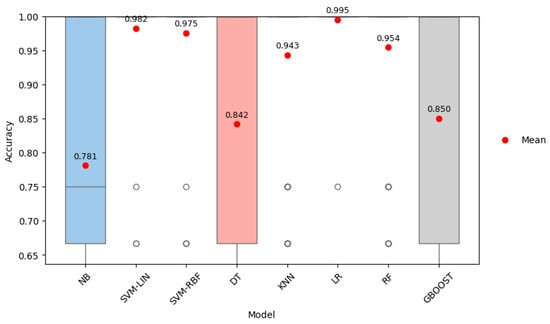
Figure 2.
Accuracy distribution of supervised machine learning models.
The chart clearly shows the dominance of logistic regression and linear SVM, which achieve the highest median accuracy with relatively low variability in results. The k-NN, Random Forest, and SVM-RBF models also exhibit high accuracy, though with slightly greater dispersion. In contrast, Naive Bayes records significantly lower accuracy values, while decision trees and Gradient Boosting display higher variability, indicating less stable performance compared to the linear models. Figure 3 presents the histogram of the best-performing algorithm (logistic regression).
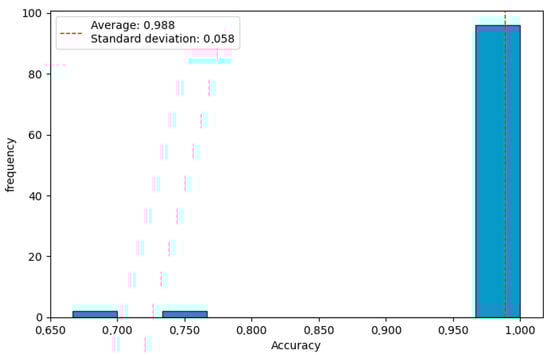
Figure 3.
Histogram of the most effective supervised learning algorithm.
The histogram shows that logistic regression achieves very high and exceptionally stable accuracy. The vast majority of accuracy values are concentrated within the narrow range of 0.95–1.00, confirming both the high effectiveness and low variability of the model. Only a few observations fall outside this range, but their number is marginal. Such a concentrated distribution indicates that logistic regression is the most reliable and consistent model in the analyzed validation procedure.
Step 4.
Analysis of the impact of individual features on cluster assignment (XAI layer):
In this step, the influence of individual candidate features on the assignment to one of the two clusters—green and yellow—is examined. To carry out this task, the SHAP method was used. Its results are presented in Figure 4.
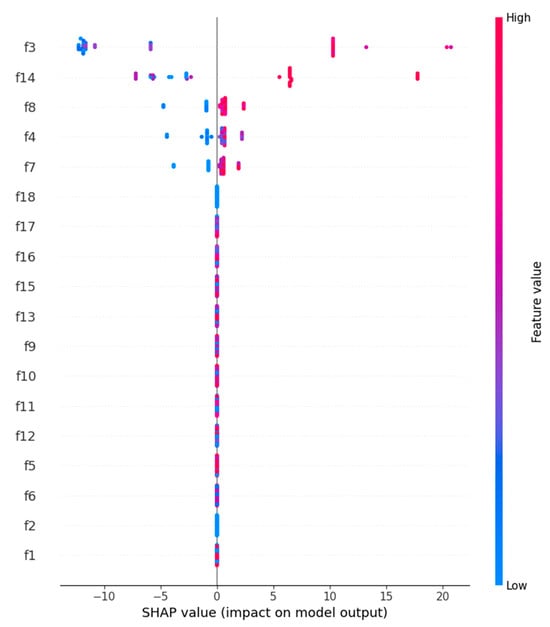
Figure 4.
Results of the SHAP analysis.
The SHAP analysis results indicate that among candidates who passed the minimum requirements layer, the most influential features for assignment to the green cluster are competencies most directly related to performing Data Scientist tasks, such as knowledge of machine learning algorithms (f14), experience in Data Science (f3), overall professional experience (f4), and skills related to NoSQL database technologies (f8). High values of these features clearly increase the likelihood of being classified into the group of recommended candidates, as shown by red points on the positive side of the SHAP axis. At the same time, variables such as knowledge of Python (f5), SQL (f7), or statistics (f10) have a smaller impact on distinguishing between clusters—not because they are unimportant, but because the initial filtering eliminated all individuals with low levels of these competencies, leaving a relatively homogeneous group in which differences in these skills are already much smaller. As a result, SHAP emphasizes more strongly those features that differentiate the top candidates from each other, rather than those that were necessary conditions for passing the first stage of selection.
Importantly, the proposed architecture allows recruitment priorities to be explicitly aligned with role-specific requirements and organizational diversity objectives. By separating hard eligibility constraints (rule-based layer) from data-driven differentiation within the qualified candidate pool, the model reduces the risk that diversity-related attributes are implicitly penalized beyond mandatory job requirements. As a result, inclusivity goals can be addressed transparently at the policy-definition stage, while subsequent clustering and explanation layers operate only on candidates who already meet the essential role criteria.
Step 5.
Validation of the obtained clusters using the Necessity Condition Analysis (NCA) method:
In the final stage of the model, the quality of the obtained clusters was validated using NCA, which aims to assess whether the competency level of candidates in a given cluster meets the minimum threshold required to achieve a satisfactory level of overall quality. As outlined in the Methods section, NCA allows for determining whether a specific outcome level (Y) can be attained only if the candidate meets a minimum level of the most critical competencies (X). In the empirical analysis, the measure of overall quality was defined as the Y_score, calculated as the average value of all candidate features (f1–f18), while the level of the necessary condition, X_cond, was defined as the minimum of these features, representing the weakest element of the competency profile. For the assumed target level Y_target = 0.60, the CE–FDH algorithm determined the bottleneck value X = −0.483*. It should be emphasized that the negative value of the bottleneck does not imply a negative level of competencies in their original measurement scale. The bottleneck value is expressed in the standardized feature space, as both the outcome variable and individual competencies were normalized prior to the NCA procedure. In this context, a negative bottleneck indicates that achieving the target quality level does not require all competencies to exceed the sample mean, but only to remain above a certain relative threshold below the mean. When translated back into the original units of measurement, the bottleneck corresponds to a minimum required level of the weakest competency that is still within the feasible range of observed candidate profiles. This means that for a candidate to achieve the desired level of overall quality, their weakest competency must exceed a defined minimum threshold. Next, each candidate was evaluated against two conditions: (1) achieving a quality level not lower than Y_target, and (2) having X_cond not less than X*. Candidates meeting both criteria were labeled as Above, and the remaining ones as Below. The NCA results were then combined with the earlier cluster classification (Green/Yellow), resulting in the aggregation of candidates into four quality categories: Green (Above), Green (Below), Yellow (Above), and Yellow (Below). The following distribution of groups was obtained in the analyzed dataset:
- –
- Green (Above): 10 candidates
- –
- Green (Below): 29 candidates
- –
- Yellow (Above): 0 candidates
- –
- Yellow (Below): 47 candidates
The results clearly confirm that although the clustering model effectively separates a group of clearly stronger (Green) and weaker (Yellow) candidates, not all individuals assigned to the Green cluster meet the necessary condition defined by NCA. Only a small portion of those in the Green cluster (10 individuals) exceed both the quality threshold (Y_target) and the minimum competency threshold (X*). This indicates that the Green segment is internally diverse—besides very strong candidates (Green Above), it also includes individuals with good overall performance who nevertheless have at least one distinctly weak competency (Green Below). In contrast, all candidates in the Yellow cluster were classified as Yellow (Below), which confirms the model’s consistency—individuals previously identified as weaker do not meet the necessary condition and thus fail to reach even the minimal expected level of quality.
The application of NCA thus not only confirmed the distinction between the Green and Yellow clusters but also added an additional diagnostic layer, enabling precise evaluation of the “strong” candidates and identification of those who—despite a positive classification—do not meet the minimum threshold for the most essential competencies. In recruitment practice, this represents valuable information for the recruiter, allowing for more informed differentiation of candidates by considering both their overall level and potential competency gaps. The role of Necessary Condition Analysis in the proposed framework is primarily diagnostic rather than predictive. While clustering and supervised models differentiate candidates based on overall similarity patterns, NCA identifies minimum competency thresholds that must be satisfied to achieve an acceptable level of aggregate candidate quality. This perspective enables a complementary interpretation of results, highlighting candidates whose overall performance is high but constrained by specific bottleneck skills, which is particularly valuable for risk-aware recruitment and targeted interview assessment.
While SHAP-based explanations provide useful post hoc insight into the trained models, they remain an approximation layer and inherit known limitations of correlation-based explainability, including sensitivity to feature dependence and potential instability under distributional shifts, as demonstrated in recent analyses of post hoc explanation reliability [44]. An important direction for further development of the proposed framework is therefore the integration of intrinsically interpretable and causally grounded modeling approaches. In particular, Information Flow-based Fuzzy Cognitive Maps enable a transparent, graph-based representation of competency interactions and allow the modeling of directed influence structures beyond purely correlational relationships [45]. Complementarily, causal modeling frameworks based on structural causal models provide a principled foundation for distinguishing spurious associations from actionable causal factors [46,47], while counterfactual explanation approaches further support auditability and regulatory compliance in algorithmic decision-making contexts such as human resource management [48].
4. Conclusions
The article presents a multi-layered, interpretable recruitment model integrating expert rules, unsupervised clustering, supervised classification models, and Explainable AI techniques, supplemented with validation using Necessary Condition Analysis. From a theoretical contribution perspective, the model offers an integrated approach to designing AI systems in HR, combining deterministic selection rules with probabilistic machine learning methods and formal tools for analyzing necessary conditions. The novelty of the solution lies in treating clustering as an intermediate layer that generates pseudo-labels for supervised models, enabling the combination of the flexibility of unsupervised methods with the high effectiveness of logistic regression and SVM, while maintaining interpretability at both the local feature level (SHAP) and in terms of the necessary conditions for a specified quality level (NCA). In the AI-in-HR literature, such a consistently formalized architecture is rare, where each layer serves a distinct function: minimum requirements filtering, structuring the candidate space, operational classification, and quality validation.
From a practical standpoint, the model can serve as real support for HR departments seeking solutions that are both efficient and compliant with growing ethical and regulatory demands, including the EU AI Act. The proposed algorithm functions as a decision-support tool in real recruitment workflows, assisting recruiters in shortlisting, ranking, and diagnostically profiling candidates rather than replacing human judgment. Its modular structure allows individual layers (e.g., rule-based screening, clustering, or NCA diagnostics) to be deployed independently, depending on organizational needs and data availability. The minimum rules layer reflects recruiter expertise and ensures alignment with employment policies. The use of cross-validation and a multi-model approach to clustering and classification reduces the risk of basing decisions on a single, randomly fitted model, enhancing recommendation stability. Empirical results show that logistic regression, in particular, exhibits very high accuracy with low variability, making it an attractive candidate for deployment. The XAI layer enables the generation of explanations understandable to practitioners at both the individual and global levels, while the application of NCA additionally differentiates candidates within clusters (e.g., Green Above vs. Green Below), enhancing the ability to manage recruitment risk in contexts of high application volume and limited time resources.
It is important to note that the presented example is illustrative in nature and is intended solely to demonstrate the operation of the developed recruitment model, rather than to provide full-scale empirical validation. The dataset used, concerning recruitment for a Data Scientist position, serves as a case study that enables the demonstration of successive algorithmic layers and their interactions. Consequently, the aim was not to assess the model’s universality across diverse organizational or industry contexts, but to show how the proposed architecture can be practically implemented in a realistic recruitment setting.
At the same time, it should be emphasized that the pseudo-labels generated by the unsupervised clustering layer constitute a structural element of the model rather than an externally validated benchmark of candidate quality. As a result, the reported classification performance reflects the stability and internal consistency of the candidate segmentation rather than predictive validity with respect to post-hire outcomes. Accordingly, model generalization should be interpreted in terms of reproducing a robust decision structure, not direct prediction of future job performance.
The interpretations produced by SHAP and NCA therefore illustrate the transparency and diagnostic capabilities of the proposed architecture, rather than providing a definitive assessment of recruitment fairness or long-term hiring effectiveness. It should also be noted that the presented results are subject to typical limitations of self-reported recruitment data, including measurement noise, rating inflation, and heterogeneous interpretations of Likert-type scales. Such effects may reduce construct validity and introduce additional uncertainty into model inputs, particularly when competency levels are assessed on coarse 1–5 scales. These limitations do not invalidate the proposed framework but highlight the importance of careful questionnaire design and complementary qualitative assessment in practical applications.
Future studies should focus on validating the model across diverse organizational contexts and job profiles, including less technical roles where data are more qualitative in nature. Particularly important is linking model outputs with longitudinal HR data, such as employee performance, retention, and career development paths, to enable assessment of predictive validity over longer time horizons. In this context, external validation of the proposed clustering-based segmentation using independent outcome variables would further clarify its decision-making relevance in real recruitment settings. Another promising direction involves the development of XAI-based user interfaces that would allow recruiters to explore SHAP and NCA outputs, simulate “what-if” scenarios, and document decisions in line with regulatory requirements. Finally, integrating explicitly defined fairness and non-discrimination metrics into the proposed architecture would allow ethical validation to become an integral component of the evaluation process alongside traditional performance measures.
Author Contributions
Conceptualization, M.N. and M.P.-N.; methodology, M.N.; software, M.N.; validation, M.N. and M.P.-N.; formal analysis, M.N. and M.P.-N.; investigation, M.N. and M.P.-N.; resources, M.N. and M.P.-N.; data curation, M.N.; writing—original draft preparation, M.N. and M.P.-N.; writing—review and editing, M.N. and M.P.-N.; visualization, M.N.; supervision, M.N. and M.P.-N.; project administration, M.N.; funding acquisition, M.N. and M.P.-N. All authors have read and agreed to the published version of the manuscript.
Funding
This research was funded by the National Science Centre, Poland, under grant no. 2024/08/X/HS4/00155 (project leader: Marcin Nowak), and by project no. 0813/SBAD/2991 entitled “The Use of Artificial Intelligence in Management 4.0: Modeling Trust in Modern Technologies” (project leader: Marta Pawłowska-Nowak).
Institutional Review Board Statement
Ethical review and approval were waived for this study due to the fact that the research was conducted on a fully anonymous and voluntary basis. The data collection process did not involve sensitive personal information, medical data, or personally identifiable information (PII). The participants filled out the forms anonymously for the sole purpose of validating the proposed recruitment model, and the study did not pose any risk to their physical or psychological well-being.
Informed Consent Statement
Not applicable.
Data Availability Statement
Marcin Nowak has unlimited and free-of-charge access to the dataset.
Conflicts of Interest
The authors declare no conflicts of interest.
Appendix A. Candidate Application Questionnaire (Data Scientist Position)
Appendix A.1. Educational Background
Q1. Highest level of education completed (select one option):
- –
- Primary education
- –
- Secondary education
- –
- Post-secondary education
- –
- Higher education—Bachelor’s or Engineer’s degree
- –
- Higher education—Master’s degree
- –
- PhD or higher
Q2. Completion of a degree program related to Data Science (e.g., Data Science, Computer Science, Artificial Intelligence, Mathematics):
- –
- Yes
- –
- No
Appendix A.2. Professional Experience
Q3. Experience in Data Science or related fields (number of years):
_____ years
Q4. Total professional experience (number of years):
_____ years
Appendix A.3. Technical Competencies
For questions Q5–Q17, please rate your level of knowledge or proficiency using a 5-point scale, where:
- –
- 1—very low/no practical knowledge
- –
- 2—basic familiarity
- –
- 3—intermediate working knowledge
- –
- 4—advanced practical knowledge
- –
- 5—expert-level knowledge
Q5. Knowledge of Python
1 2 3 4 5
Q6. Knowledge of R
1 2 3 4 5
Q7. Knowledge of SQL
1 2 3 4 5
Q8. Knowledge of NoSQL databases (e.g., MongoDB, Cassandra)
1 2 3 4 5
Q9. Knowledge of machine learning tools (e.g., scikit-learn, TensorFlow, PyTorch)
1 2 3 4 5
Q10. Knowledge of statistics
1 2 3 4 5
Q11. Dashboard creation skills (e.g., Power BI, Tableau)
1 2 3 4 5
Q12. Knowledge of Big Data technologies (e.g., Spark, Hadoop)
1 2 3 4 5
Q13. Knowledge of cloud platforms (e.g., AWS, Azure)
1 2 3 4 5
Q14. Knowledge of machine learning algorithms
1 2 3 4 5
Q15. English language proficiency
1 2 3 4 5
Q16. Knowledge of version control systems (e.g., Git)
1 2 3 4 5
Q17. Knowledge of MLOps/CI-CD practices (e.g., MLflow, Docker, Airflow)
1 2 3 4 5
Appendix A.4. Scientific Output
Q18. Have you published scientific articles?
Yes
No
References
- Upadhyay, A.K.; Khandelwal, K. Applying Artificial Intelligence: Implications for Recruitment. Strateg. HR Rev. 2018, 17, 255–258. [Google Scholar] [CrossRef]
- Tambe, P.; Cappelli, P.; Yakubovich, V. Artificial Intelligence in Human Resources Management: Challenges and a Path Forward. Calif. Manag. Rev. 2019, 61, 15–42. [Google Scholar] [CrossRef]
- Mittelstadt, B.D.; Allo, P.; Taddeo, M.; Wachter, S.; Floridi, L. The Ethics of Algorithms: Mapping the Debate. Big Data Soc. 2016, 3, 2053951716679679. [Google Scholar] [CrossRef]
- Barredo Arrieta, A.; Tabik, S.; García López, S.; Molina Cabrera, D.; Herrera Triguero, F.; Díaz Rodríguez, N.A. Explainable Artificial Intelligence (XAI): Concepts, Taxonomies, Opportunities and Challenges toward Responsible AI. Inf. Fusion 2019, 58, 82–115. [Google Scholar] [CrossRef]
- Nowak, M.; Zajkowski, R.; Pawłowska-Nowak, M. Prediction of the Sustainability Index in Family Firms Using Explainable Artificial Intelligence. Sustainability 2025, 17, 7226. [Google Scholar] [CrossRef]
- Faroozan, A. The Evolving Role of Artificial Intelligence in Recruitment: Efficiency, Bias Mitigation, and Ethical Challenges. Int. J. Multidiscip. Res. 2025, 7. [Google Scholar] [CrossRef]
- HRCI. History of AI in HR 2025. Available online: https://www.hrci.org/community/blogs-and-announcements/hr-leads-business-blog/hr-leads-business/2025/08/14/history-of-ai-in-hr (accessed on 10 November 2025).
- Fabris, A.; Baranowska, N.; Dennis, M.J.; Graus, D.; Hacker, P.; Saldivar, J.; Zuiderveen Borgesius, F.; Biega, A.J. Fairness and Bias in Algorithmic Hiring: A Multidisciplinary Survey. ACM Trans. Intell. Syst. Technol. 2025, 16, 1–54. [Google Scholar] [CrossRef]
- Lavanchy, M.; Reichert, P.; Narayanan, J.; Savani, K. Applicants’ Fairness Perceptions of Algorithm-Driven Hiring Procedures. J. Bus. Ethics 2023, 188, 125–150. [Google Scholar] [CrossRef]
- Liu, Q.; Wan, H.; Yu, H. The Application of Deep Learning in Human Resource Management: A New Perspective on Employee Recruitment and Performance Evaluation. Acad. J. Manag. Soc. Sci. 2023, 3, 101–104. [Google Scholar] [CrossRef]
- Hemalatha, A.; Kumari, P.B.; Nawaz, N.; Gajenderan, V. Impact of Artificial Intelligence on Recruitment and Selection of Information Technology Companies. In Proceedings of the 2021 International Conference on Artificial Intelligence and Smart Systems (ICAIS), Coimbatore, India, 25–27 March 2021; pp. 60–66. [Google Scholar]
- Madanchian, M. From Recruitment to Retention: AI Tools for Human Resource Decision-Making. Appl. Sci. 2024, 14, 11750. [Google Scholar] [CrossRef]
- Ali, A.; Rafi, N. Enhancing Human Resource Management Through Advanced Decision-Making Strategies: Harnessing The Power Of Artificial Intelligence For Strategic, Data-Driven, And Judicious Choices. J. Hum. Resour. Manag. 2024, 21, 881–889. [Google Scholar] [CrossRef]
- HireBee. AI in HR Statistics. 2024. Available online: https://hirebee.ai/blog/ai-in-hr-statistics/ (accessed on 10 November 2025).
- Zhang, G.; Pan, L.; Tang, F.; Yao, F. Explainable Artificial Intelligence in the Talent Recruitment Process-a Literature Review. Cogent Bus. Manag. 2025, 12, 2570881. [Google Scholar] [CrossRef]
- Chen, Z. Ethics and Discrimination in Artificial Intelligence-Enabled Recruitment Practices. Humanit. Soc. Sci. Commun. 2023, 10, 1–12. [Google Scholar] [CrossRef]
- Agbasiere, C.L.; Nze-Igwe, G.R. Algorithmic Fairness in Recruitment: Designing AI-Powered Hiring Tools to Identify and Reduce Biases in Candidate Selection. Path Sci. 2025, 11, 5001–5021. [Google Scholar] [CrossRef]
- Dastin, J. Amazon Scraps Secret AI Recruiting Tool That Showed Bias Against Women. Reuters. 11 October 2018. Available online: https://www.reuters.com/article/world/insight-amazon-scraps-secret-ai-recruiting-tool-that-showed-bias-against-women-idUSKCN1MK0AG/ (accessed on 10 November 2025).
- Fisher Phillips. European Industry Pushes Back on the EU AI Act Practical Impact; Fisher Phillips: Atlanta, GA, USA, 2024. [Google Scholar]
- Hunkenschroer, A.L.; Kriebitz, A. Is AI Recruiting (Un) Ethical? A Human Rights Perspective on the Use of AI for Hiring. AI Ethics 2023, 3, 199–213. [Google Scholar] [CrossRef]
- Society for Human Resource Management. Fresh SHRM Research Explores Use of Automation and AI in HR; Society for Human Resource Management: Alexandria, VA, USA, 2024. [Google Scholar]
- Sýkorová, Z.; Hague, D.; Dvouletý, O.; Procházka, D.A. Incorporating Artificial Intelligence (AI) into Recruitment Processes: Ethical Considerations. Vilakshan-XIMB J. Manag. 2024, 21, 293–307. [Google Scholar] [CrossRef]
- Ren, Q.; Du, J. Harmonizing Innovation and Regulation: The EU Artificial Intelligence Act in the International Trade Context. Comput. Law Secur. Rev. 2024, 54, 106028. [Google Scholar] [CrossRef]
- Marín Díaz, G.; Galán Hernández, J.J.; Galdón Salvador, J.L. Analyzing Employee Attrition Using Explainable AI for Strategic HR Decision-Making. Mathematics 2023, 11, 4677. [Google Scholar] [CrossRef]
- Thalpage, N. Unlocking the Black Box: Explainable Artificial Intelligence (XAI) for Trust and Transparency in AI Systems. J. Digit. Art Humanit. 2023, 4, 31–36. [Google Scholar] [CrossRef]
- Pinto, G.B.S.; Mello, C.E.; Garcia, A.C.B. Explainable AI in Labor Market Applications. In Proceedings of the 17th International Conference on Agents and Artificial Intelligence (ICAART 2025), Porto, Portugal, 23–25 February 2025. [Google Scholar]
- Nowak, M.; Rabczun, A.; Łopatka, P. Impact of Electrification on African Development-Analysis with Using Grey Systems Theory. Energies 2021, 14, 5181. [Google Scholar] [CrossRef]
- Kaliappan, J.; Bagepalli, A.R.; Almal, S.; Mishra, R.; Hu, Y.-C.; Srinivasan, K. Impact of Cross-Validation on Machine Learning Models for Early Detection of Intrauterine Fetal Demise. Diagnostics 2023, 13, 1692. [Google Scholar] [CrossRef] [PubMed]
- Ufeli, C.P.; Sattar, M.U.; Hasan, R.; Mahmood, S. Enhancing Customer Segmentation Through Factor Analysis of Mixed Data (FAMD)-Based Approach Using K-Means and Hierarchical Clustering Algorithms. Information 2025, 16, 441. [Google Scholar] [CrossRef]
- Lodygowski, T.; Szrama, S. Unsupervised Classification and Remaining Useful Life Prediction for Turbofan Engines Using Autoencoders and Gaussian Mixture Models: A Comprehensive Framework for Predictive Maintenance. Appl. Sci. 2025, 15, 7884. [Google Scholar] [CrossRef]
- Contreras, J.M.; Molina Portillo, E.; Fernández Luna, J.M. Evaluation of Hierarchical Clustering Methodologies for Identifying Patterns in Timeout Requests in EuroLeague Basketball. Mathematics 2025, 13, 2414. [Google Scholar] [CrossRef]
- Phatcharathada, B.; Srisuradetchai, P. Randomized Feature and Bootstrapped Naive Bayes Classification. Appl. Syst. Innov. 2025, 8, 94. [Google Scholar] [CrossRef]
- Nowak, M.; Pawłowska-Nowak, M. Dynamic Pricing Method in the E-Commerce Industry Using Machine Learning. Appl. Sci. 2024, 14, 11668. [Google Scholar] [CrossRef]
- Gajowniczek, K.; Zabkowski, T. Interactive Decision Tree Learning and Decision Rule Extraction Based on the ImbTreeEntropy and ImbTreeAUC Packages. Processes 2021, 9, 1107. [Google Scholar] [CrossRef]
- Nowak, M.; Zajkowski, R. An Integrated Structural Equation Modelling and Machine Learning Framework for Measurement Scale Evaluation—Application to Voluntary Turnover Intentions. AppliedMath 2025, 5, 105. [Google Scholar] [CrossRef]
- Nikolić, M.; Nikolić, D.; Stefanović, M.; Koprivica, S.; Stefanović, D. Mitigating Algorithmic Bias Through Probability Calibration: A Case Study on Lead Generation Data. Mathematics 2025, 13, 2183. [Google Scholar] [CrossRef]
- Amamra, S.-A. Random Forest-Based Machine Learning Model Design for 21,700/5 Ah Lithium Cell Health Prediction Using Experimental Data. Physchem 2025, 5, 12. [Google Scholar] [CrossRef]
- Airlangga, G.; Liu, A. A Hybrid Gradient Boosting and Neural Network Model for Predicting Urban Happiness: Integrating Ensemble Learning with Deep Representation for Enhanced Accuracy. Mach. Learn. Knowl. Extr. 2025, 7, 4. [Google Scholar] [CrossRef]
- Mosca, E.; Szigeti, F.; Tragianni, S.; Gallagher, D.; Groh, G. SHAP-Based Explanation Methods: A Review for NLP Interpretability. In Proceedings of the 29th International Conference on Computational Linguistics, Gyeongju, Republic of Korea, 12–17 October 2022; pp. 4593–4603. [Google Scholar]
- Kosko, B. Fuzzy Cognitive Maps. Int. J. Man. Mach. Stud. 1986, 24, 65–75. [Google Scholar] [CrossRef]
- Lou, Y.; Caruana, R.; Gehrke, J. Intelligible Models for Classification and Regression. In Proceedings of the 18th ACM SIGKDD International Conference on Knowledge Discovery and Data Mining, Beijing, China, 12–16 August 2012; pp. 150–158. [Google Scholar]
- Nori, H.; Jenkins, S.; Koch, P.; Caruana, R. Interpretml: A Unified Framework for Machine Learning Interpretability. arXiv 2019, arXiv:1909.09223. [Google Scholar] [CrossRef]
- Dul, J.; Hauff, S.; Bouncken, R.B. Necessary Condition Analysis (NCA): Review of Research Topics and Guidelines for Good Practice. Rev. Manag. Sci. 2023, 17, 683–714. [Google Scholar] [CrossRef]
- Slack, D.; Hilgard, S.; Jia, E.; Singh, S.; Lakkaraju, H. Fooling Lime and Shap: Adversarial Attacks on Post Hoc Explanation Methods. In Proceedings of the AAAI/ACM Conference on AI, Ethics, and Society, New York, NY, USA, 7–9 February 2020; pp. 180–186. [Google Scholar]
- Tyrovolas, M.; Liang, X.S.; Stylios, C. Information Flow-Based Fuzzy Cognitive Maps with Enhanced Interpretability. Granul. Comput. 2023, 8, 2021–2038. [Google Scholar] [CrossRef]
- Pearl, J. Causality; Cambridge University Press: Cambridge, UK, 2009. [Google Scholar]
- Peters, J.; Janzing, D.; Schölkopf, B. Elements of Causal Inference: Foundations and Learning Algorithms; The MIT Press: Cambridge, MA, USA, 2017. [Google Scholar]
- Wachter, S.; Mittelstadt, B.; Russell, C. Counterfactual Explanations without Opening the Black Box: Automated Decisions and the GDPR. Harv. J. Law Technol. 2017, 31, 841. [Google Scholar] [CrossRef]


Disclaimer/Publisher’s Note: The statements, opinions and data contained in all publications are solely those of the individual author(s) and contributor(s) and not of MDPI and/or the editor(s). MDPI and/or the editor(s) disclaim responsibility for any injury to people or property resulting from any ideas, methods, instructions or products referred to in the content. |
© 2026 by the authors. Licensee MDPI, Basel, Switzerland. This article is an open access article distributed under the terms and conditions of the Creative Commons Attribution (CC BY) license.