A Deep Reinforcement Learning Framework for Strategic Indian NIFTY 50 Index Trading
Abstract
1. Introduction
2. Related Work
3. Problem Statement and Objectives
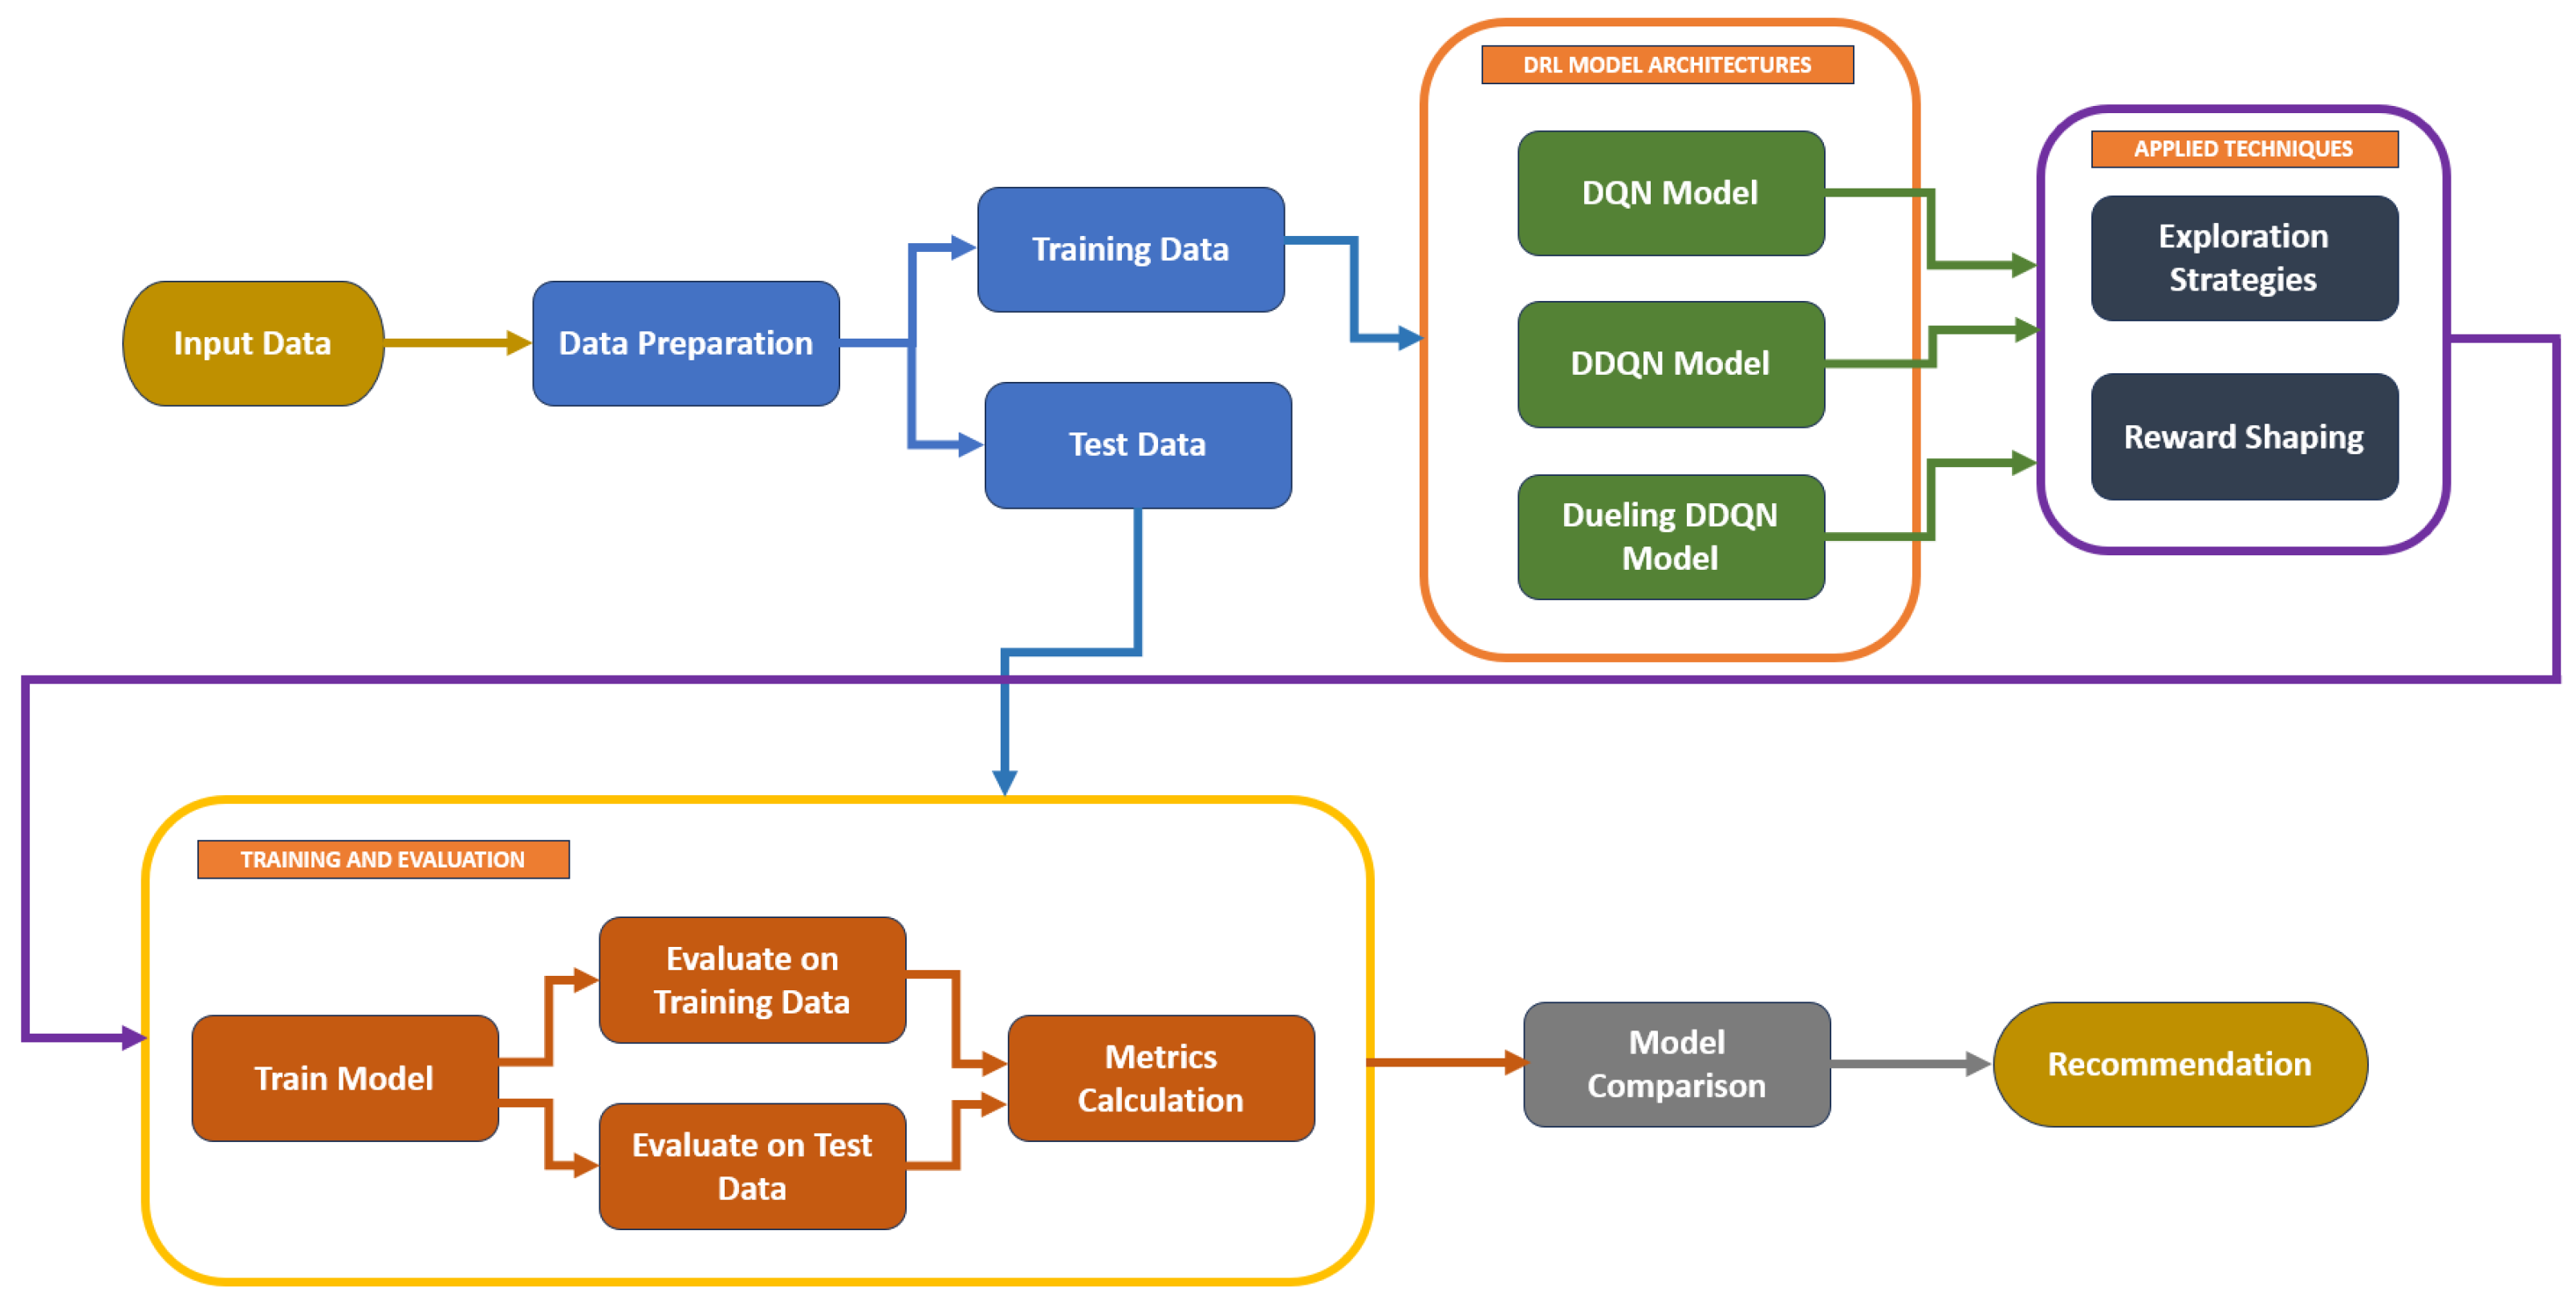
- To implement and evaluate DQN, DDQN, and Dueling DDQN architectures for algorithmic trading on the Indian NIFTY 50 index;
- To compare model performance using key metrics such as Sharpe ratio, profit factor, and trade frequency;
- To investigate the impact of exploration strategies (e.g., epsilon resets, softmax sampling) and reward shaping on learning stability and profitability; and
- To recommend the most effective DRL framework for real-world deployment in emerging markets.
4. Background
4.1. Deep Q-Network (DQN)
4.2. Double Deep Q-Network (DDQN)
4.3. Dueling Double Deep Q-Network (Dueling DDQN)
- The Value stream estimates ;
- The Advantage stream estimates
5. Methodology
5.1. Dataset and Feature Engineering
- Open, high, low, and close prices;
- A 200-period exponential moving average (EMA);
- The Pivot point (a reference level calculated as the average of the high, low, and close prices of the same candle); and
- A Supertrend indicator computed with three parameter combinations—(12,3), (11,2), and (10,1)
5.2. Architecture and Training Setup
5.2.1. Common Pipeline
- Input (State): Sliding window of N previous timesteps (window size varies by model version) including OHLC and technical indicators (EMA, pivot points, and supertrend).
- Action Space: Discrete actions [Buy, Hold, Sell].
- Network Architecture:
- –
- Flatten input layer
- –
- Dense layer with 128 ReLU units + dropout (20%)
- –
- Dense layer with 64 ReLU units + dropout (20%)
- –
- Output layer with 3 linear activations (Q-values for each action)
- Loss Function: Mean squared error (MSE)
- Optimizer: Adam (learning rate varies by version)
- Experience Replay: Prioritized experience replay (PER) with a capacity of 10,000 experiences.
- Reward Function: Profit per trade, scaled, with penalties for long holding time and excessive trading frequency.
- Training Environment: Kaggle T4x2 GPU environment. Each model variant was trained for 50–80 episodes, with training runs taking approximately 4–6 h depending on the model.
5.2.2. Model-Specific Changes
5.2.3. Evaluation Metrics, Baseline Policy and Initial Settings
- Total Trades: The total number of trades executed by each agent during the testing phase, indicating the level of market activity.
- Win Rate (%): The percentage of profitable trades, measuring the agent’s ability to identify and capitalize on favorable market conditions.
- Profit Factor: The ratio of gross profit to gross loss, assessing the consistency and robustness of the trading strategy.
- Sharpe Ratio: A volatility-adjusted return metric that considers both profitability and volatility. It is calculated as the average excess return per unit of standard deviation.
- Final Balance: The cumulative balance at the end of the testing period, reflecting the total profit achieved by the agent.
- Total Profit: The net gain achieved, accounting for all trades executed during the testing period.
6. Results
6.1. Deep Q-Network (DQN)
6.1.1. Hyperparameters
6.1.2. Model Variants
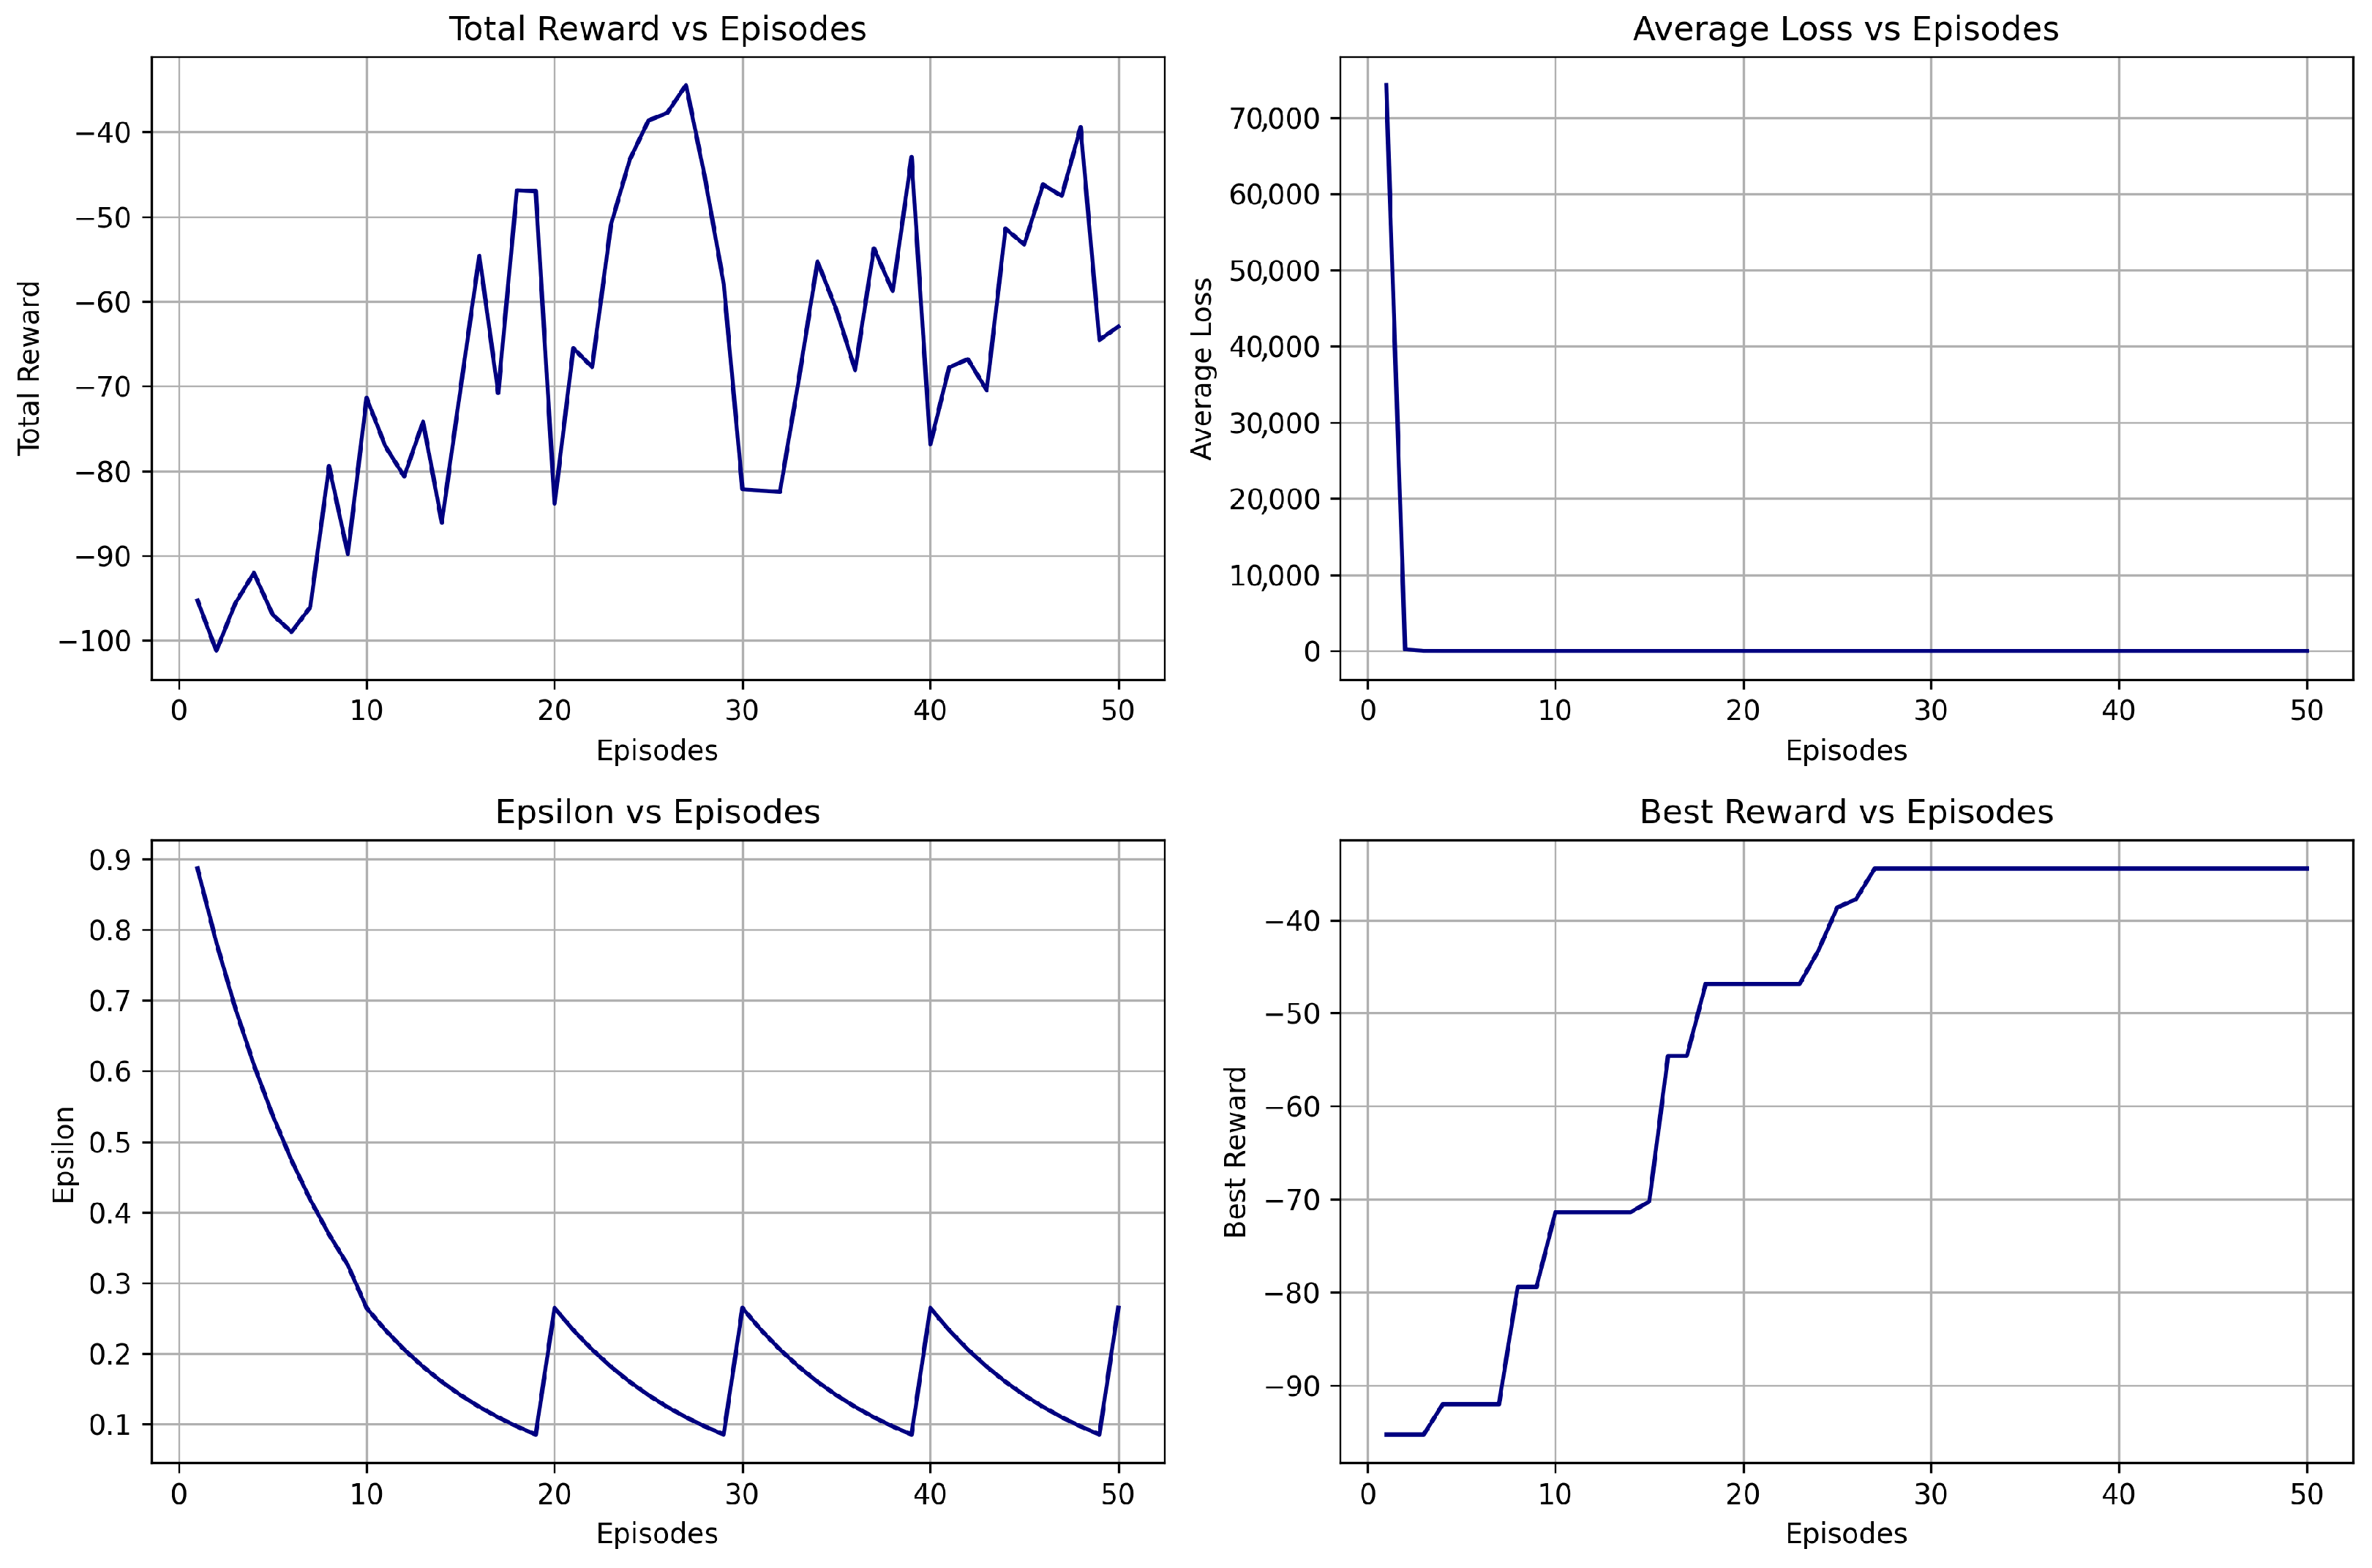
- DQN V1 is the baseline model that uses prioritized experience replay (PER).
- DQN V2 introduces epsilon resets along with a time-decay reward penalty.
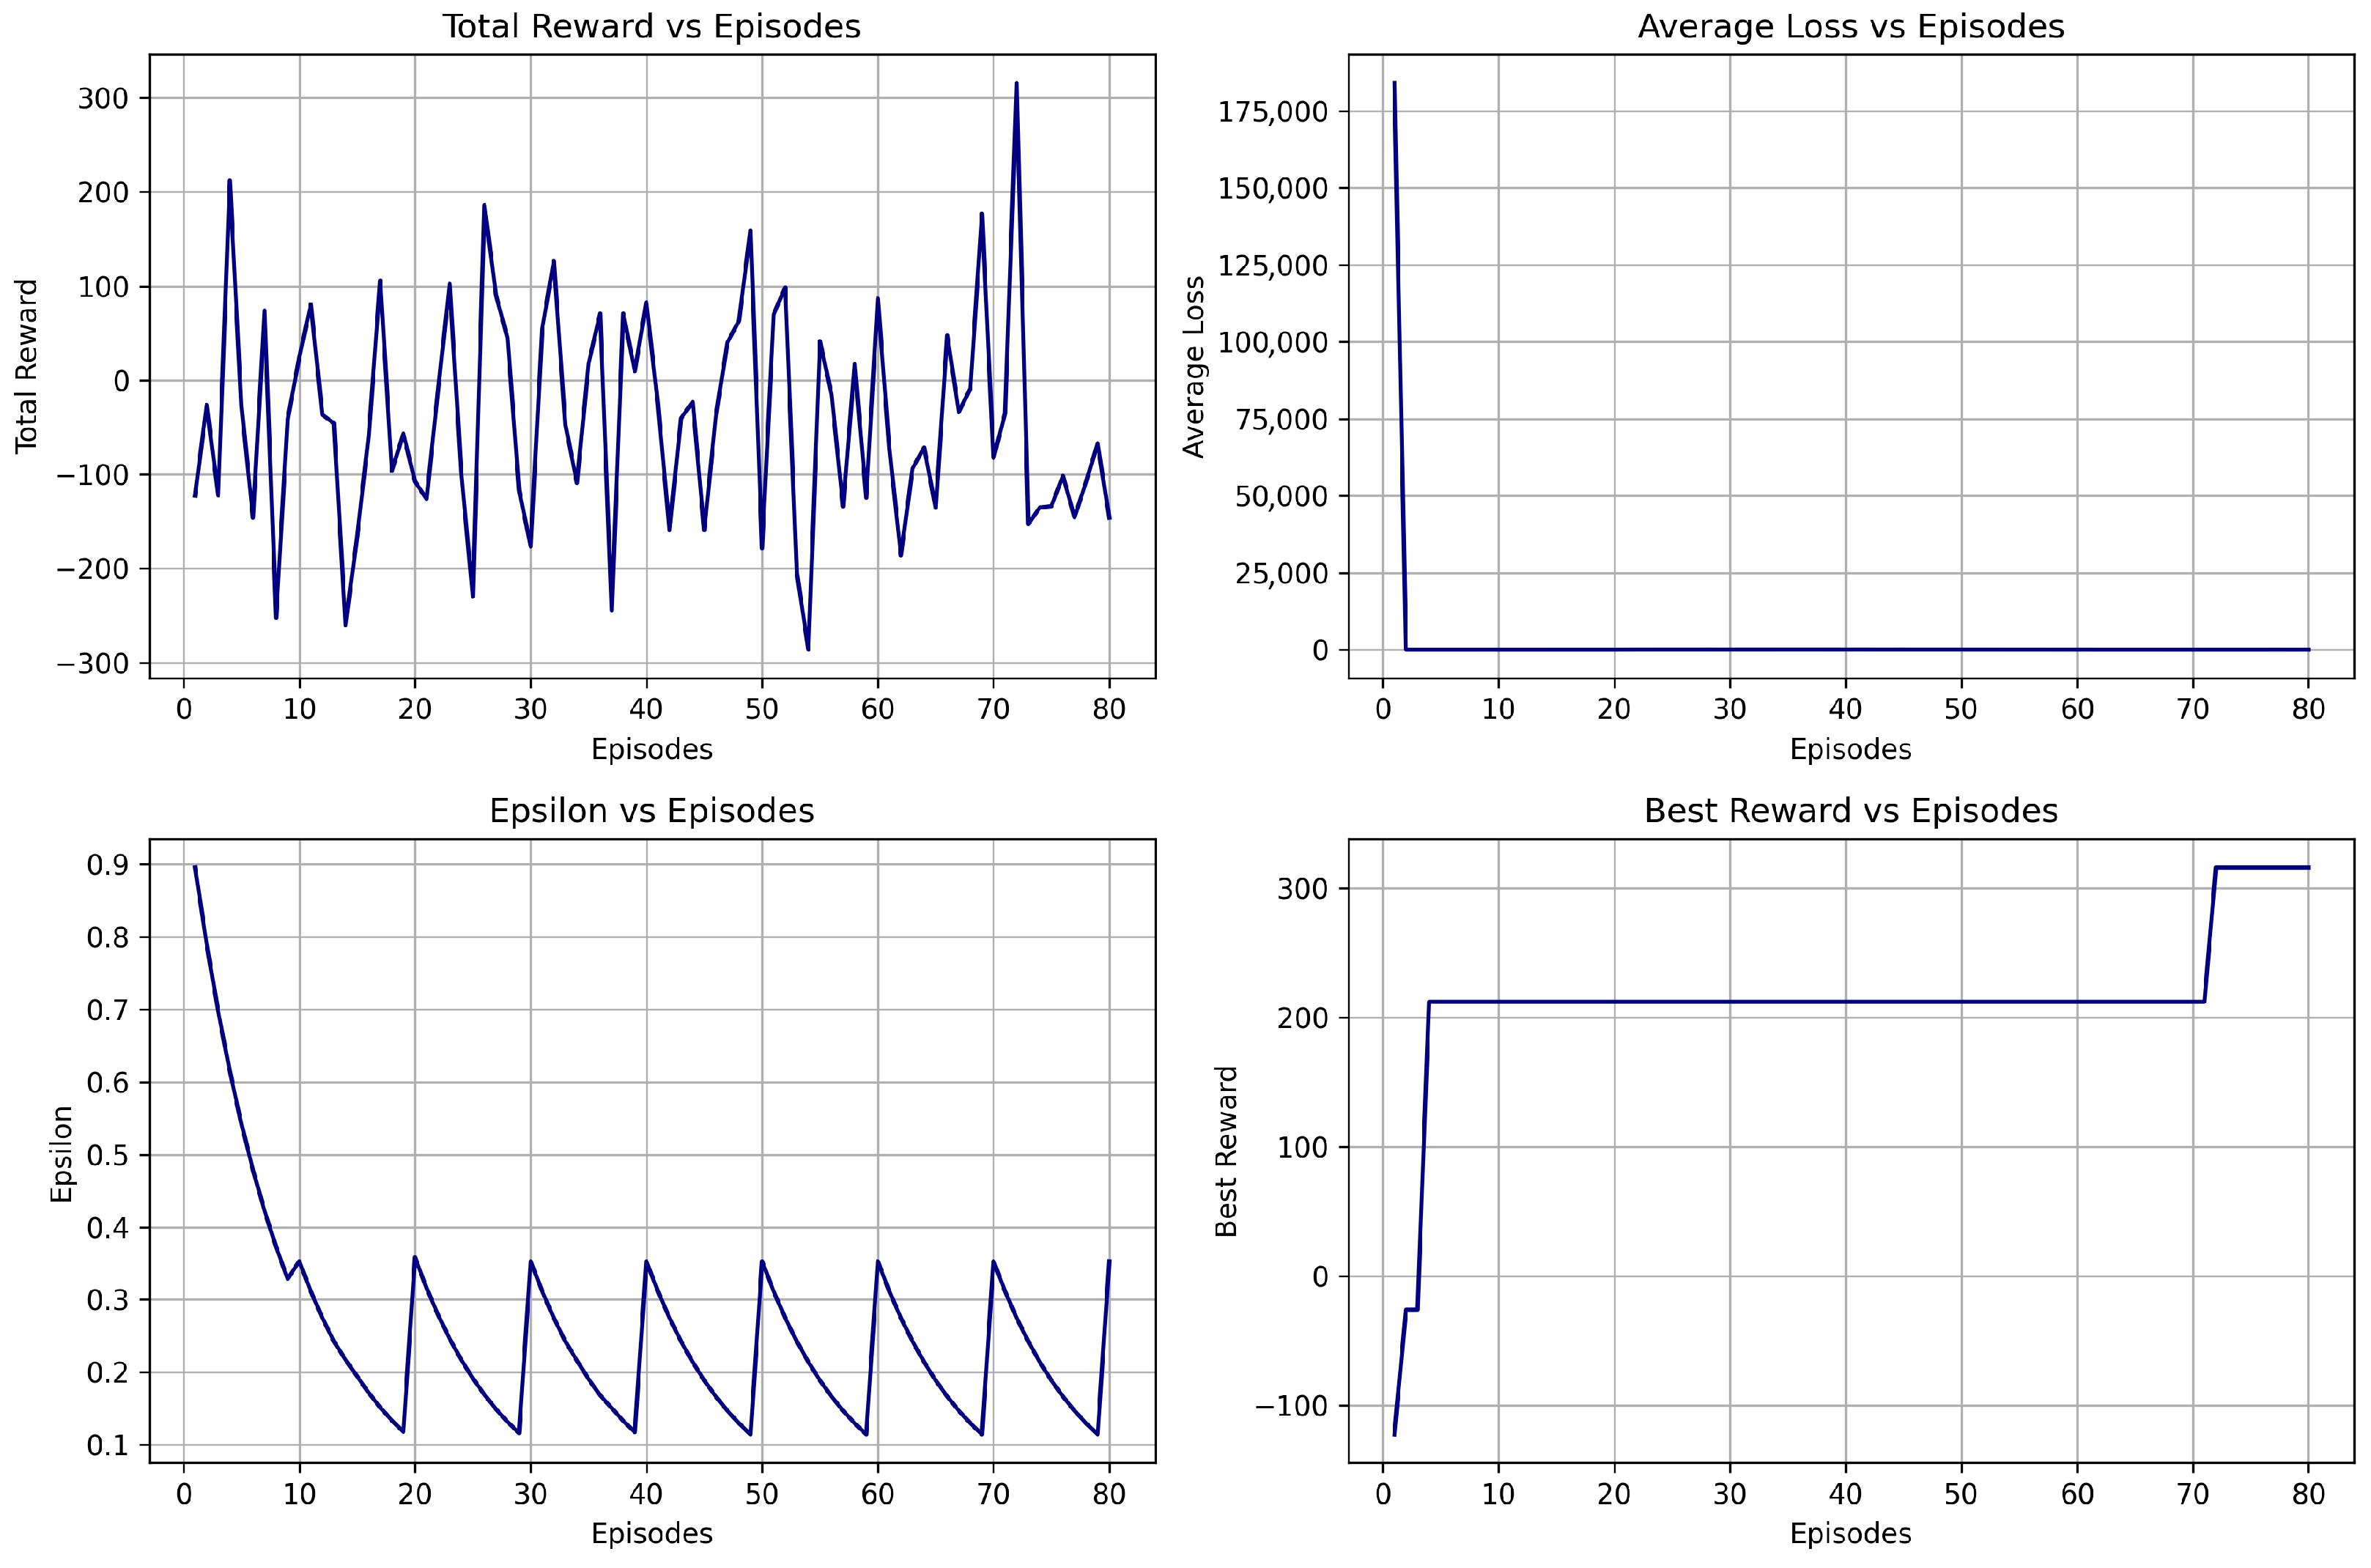
- DQN V3 incorporates softmax action sampling and cooldown logic for more stable performance.
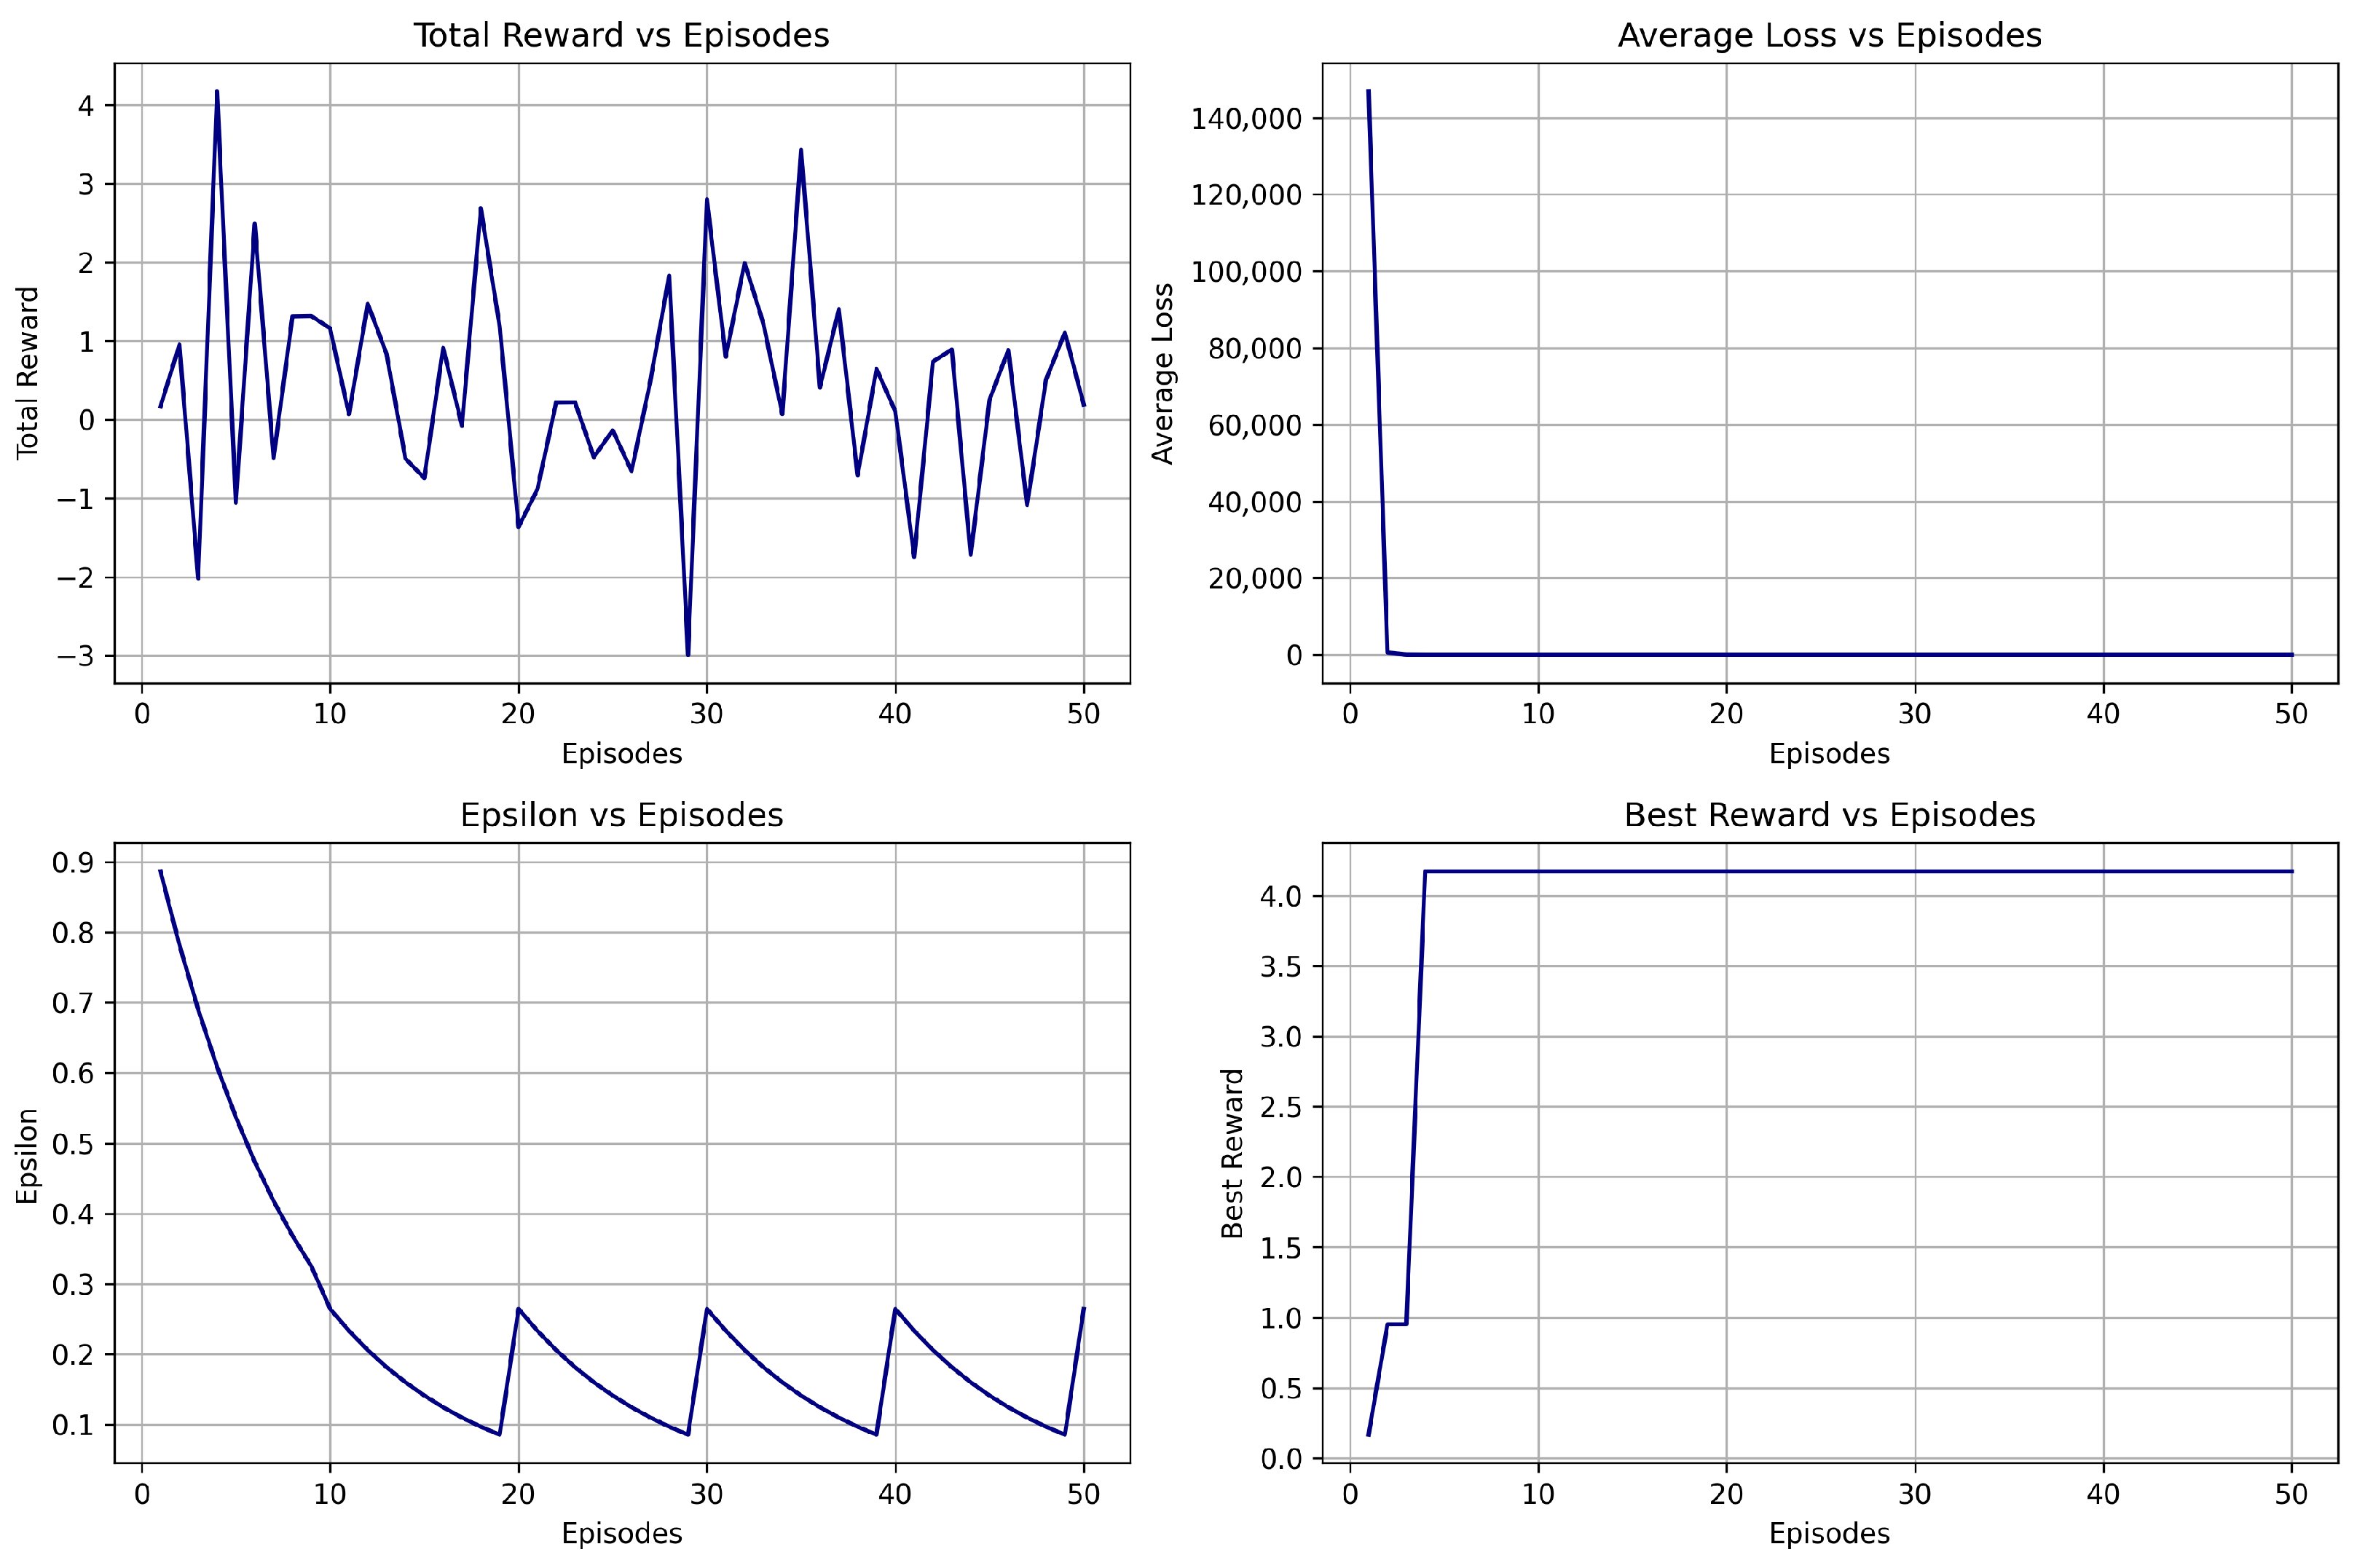
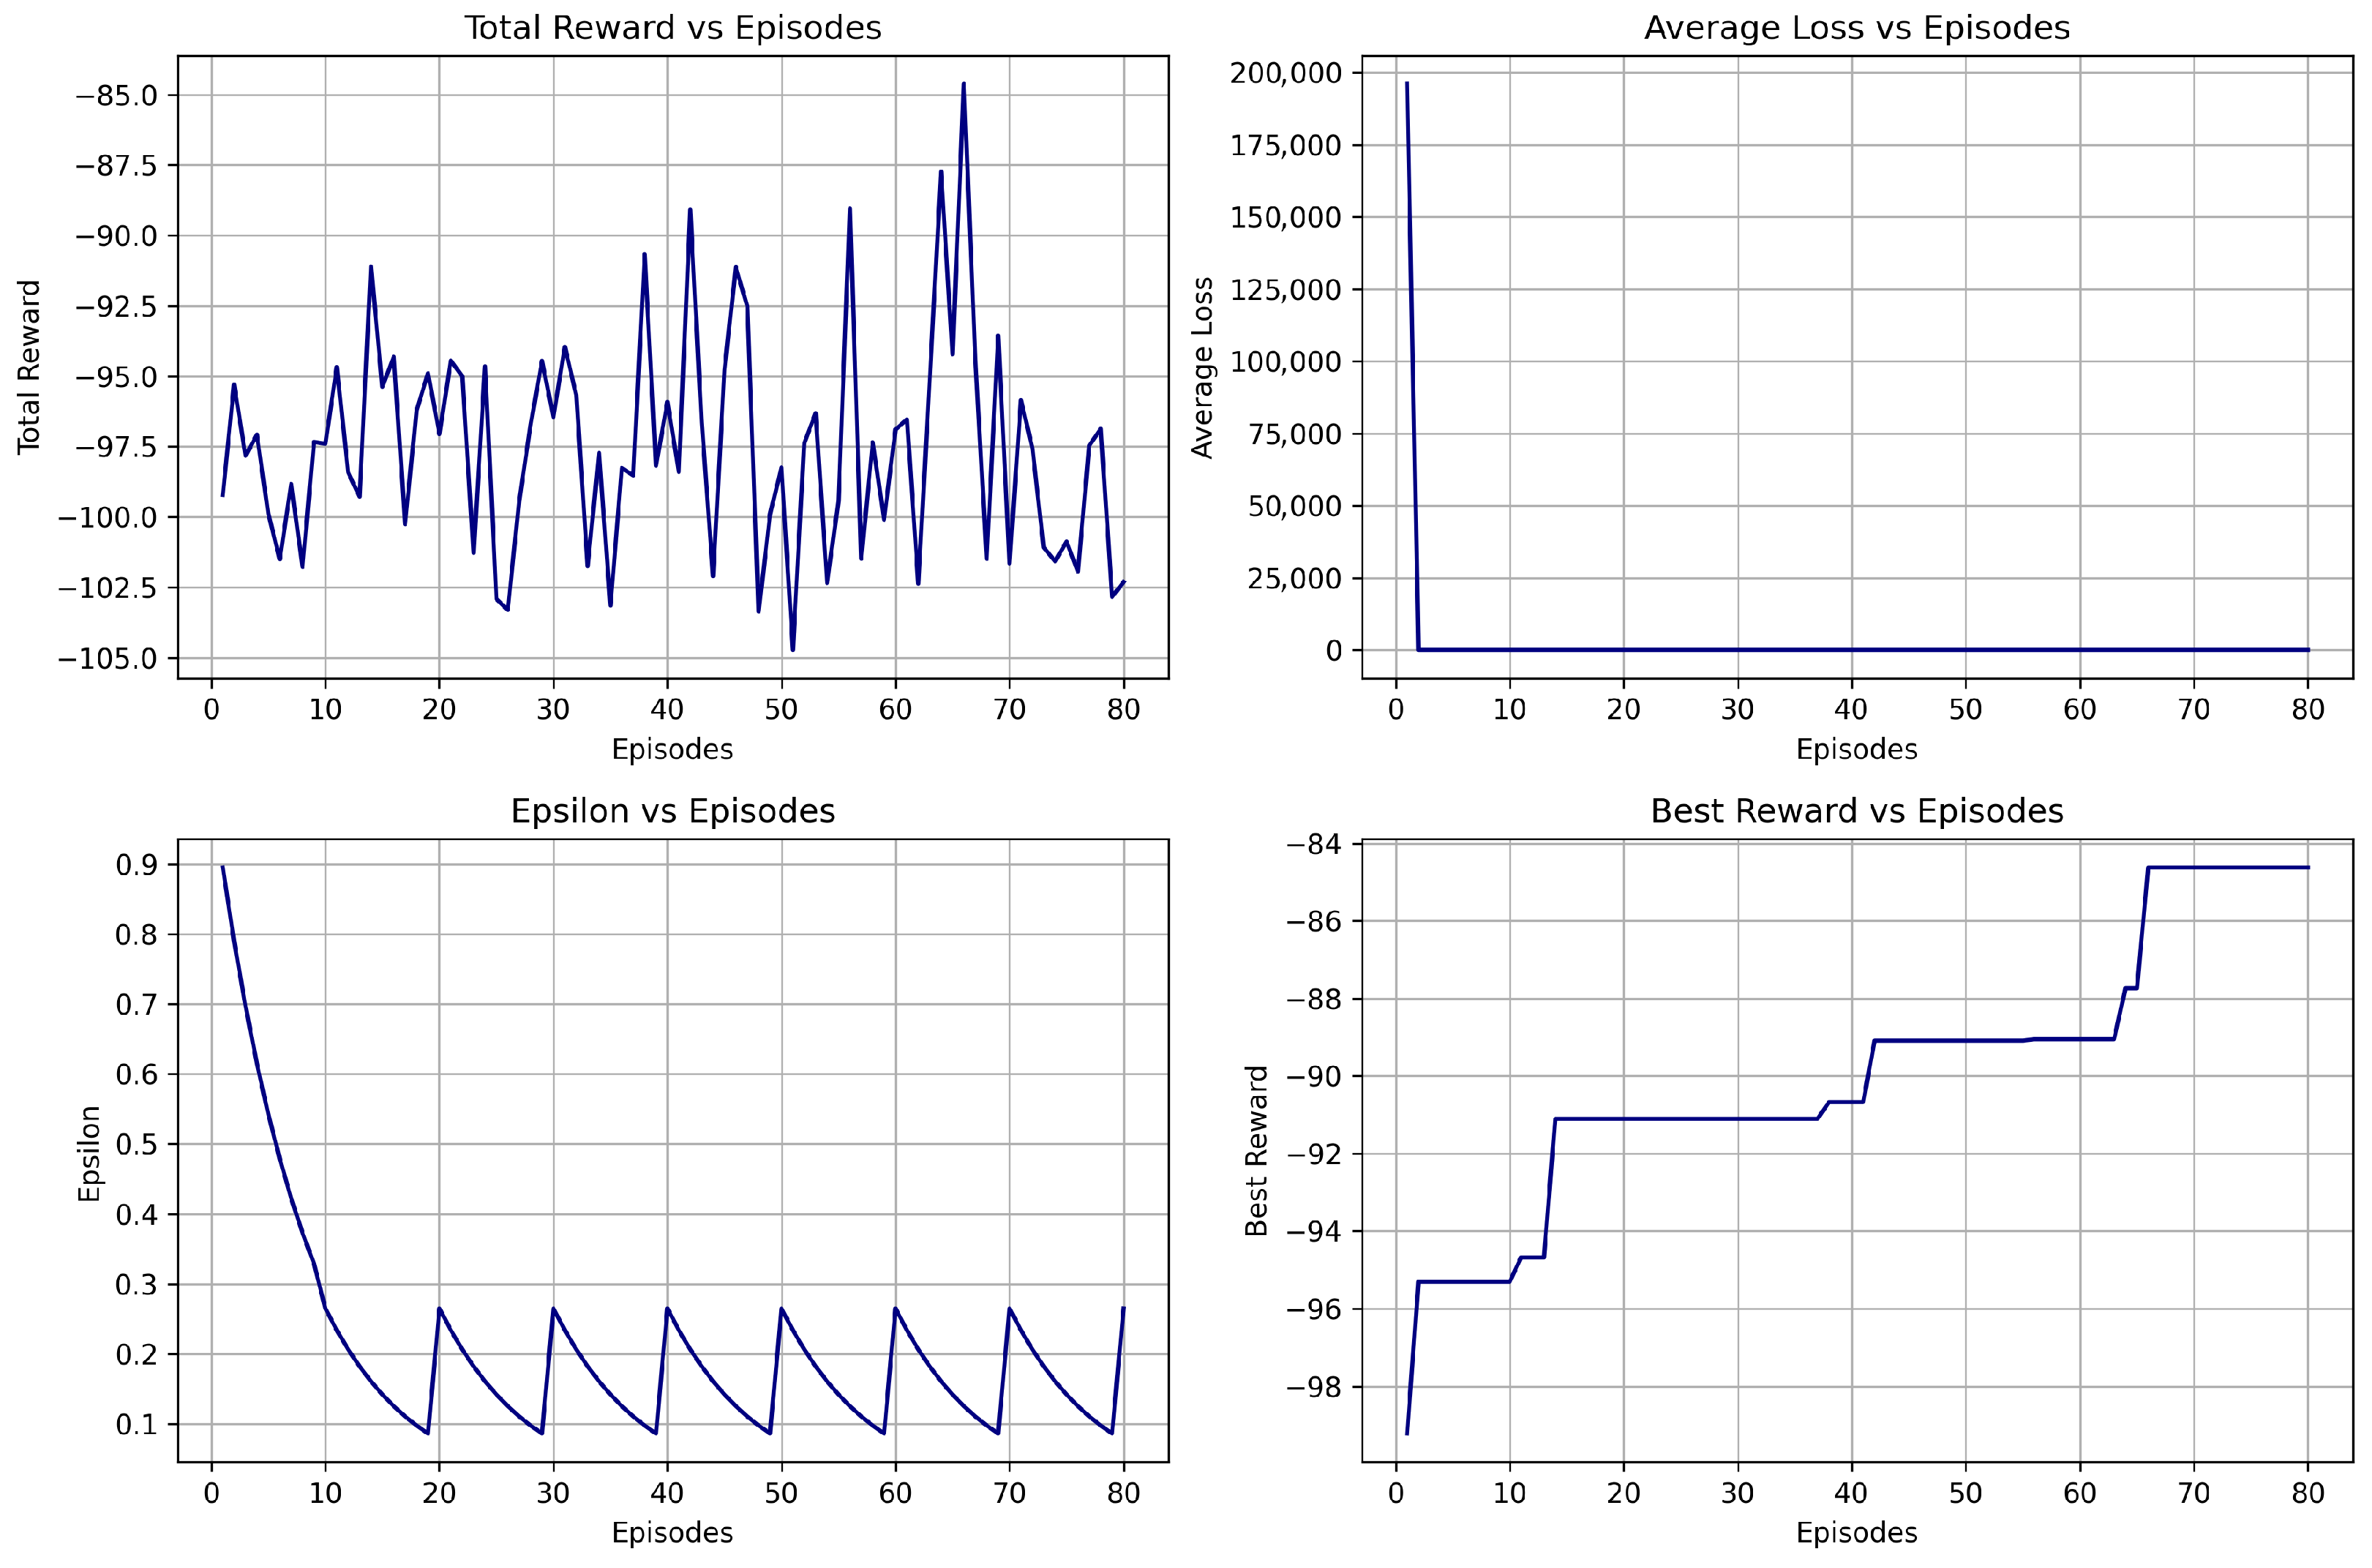
6.1.3. Training Summary
6.1.4. Evaluation Summary on Test Data
6.1.5. Transition to Advanced Architectures
6.2. Double Deep Q-Network (DDQN)
6.2.1. Hyperparameters
6.2.2. Model Variants
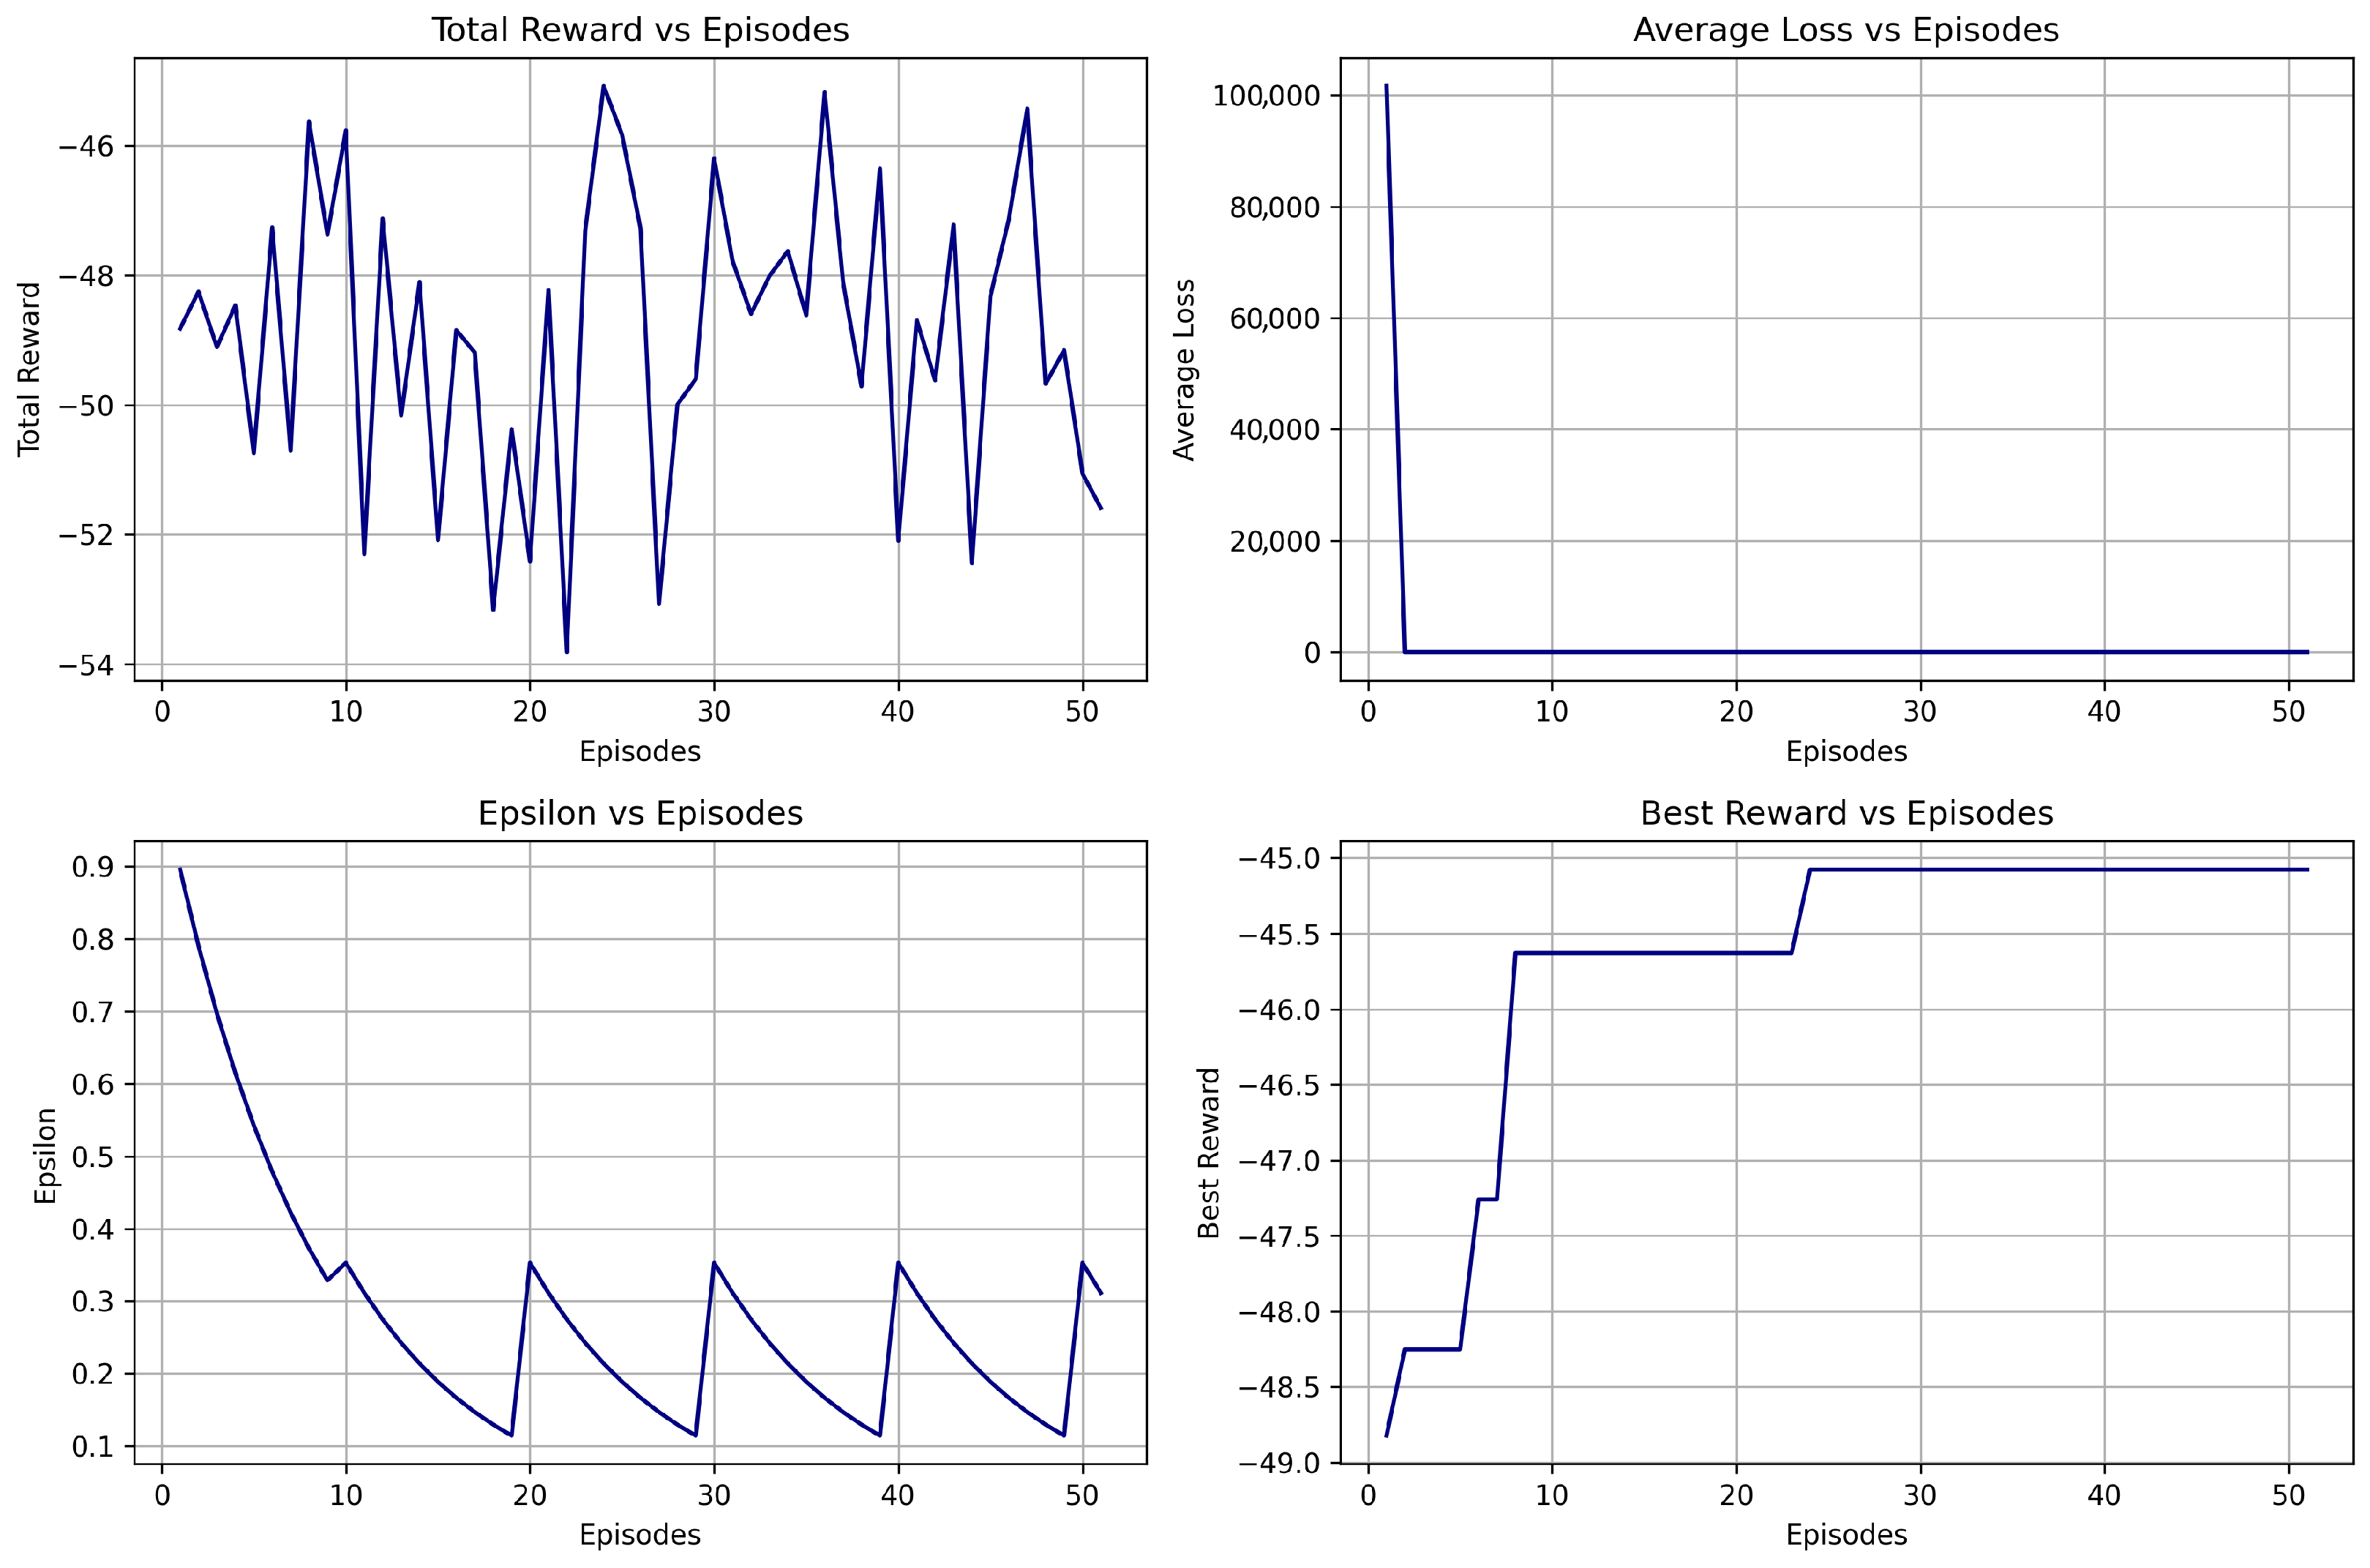
- DDQN V1 is the baseline model with prioritized experience replay and steady epsilon decay.
- DDQN V2 incorporates periodic epsilon resets to encourage exploration in later episodes.
- DDQN V3 integrates softmax action sampling, cooldown logic, and a reduced over-trading penalty to enhance stability and profitability.
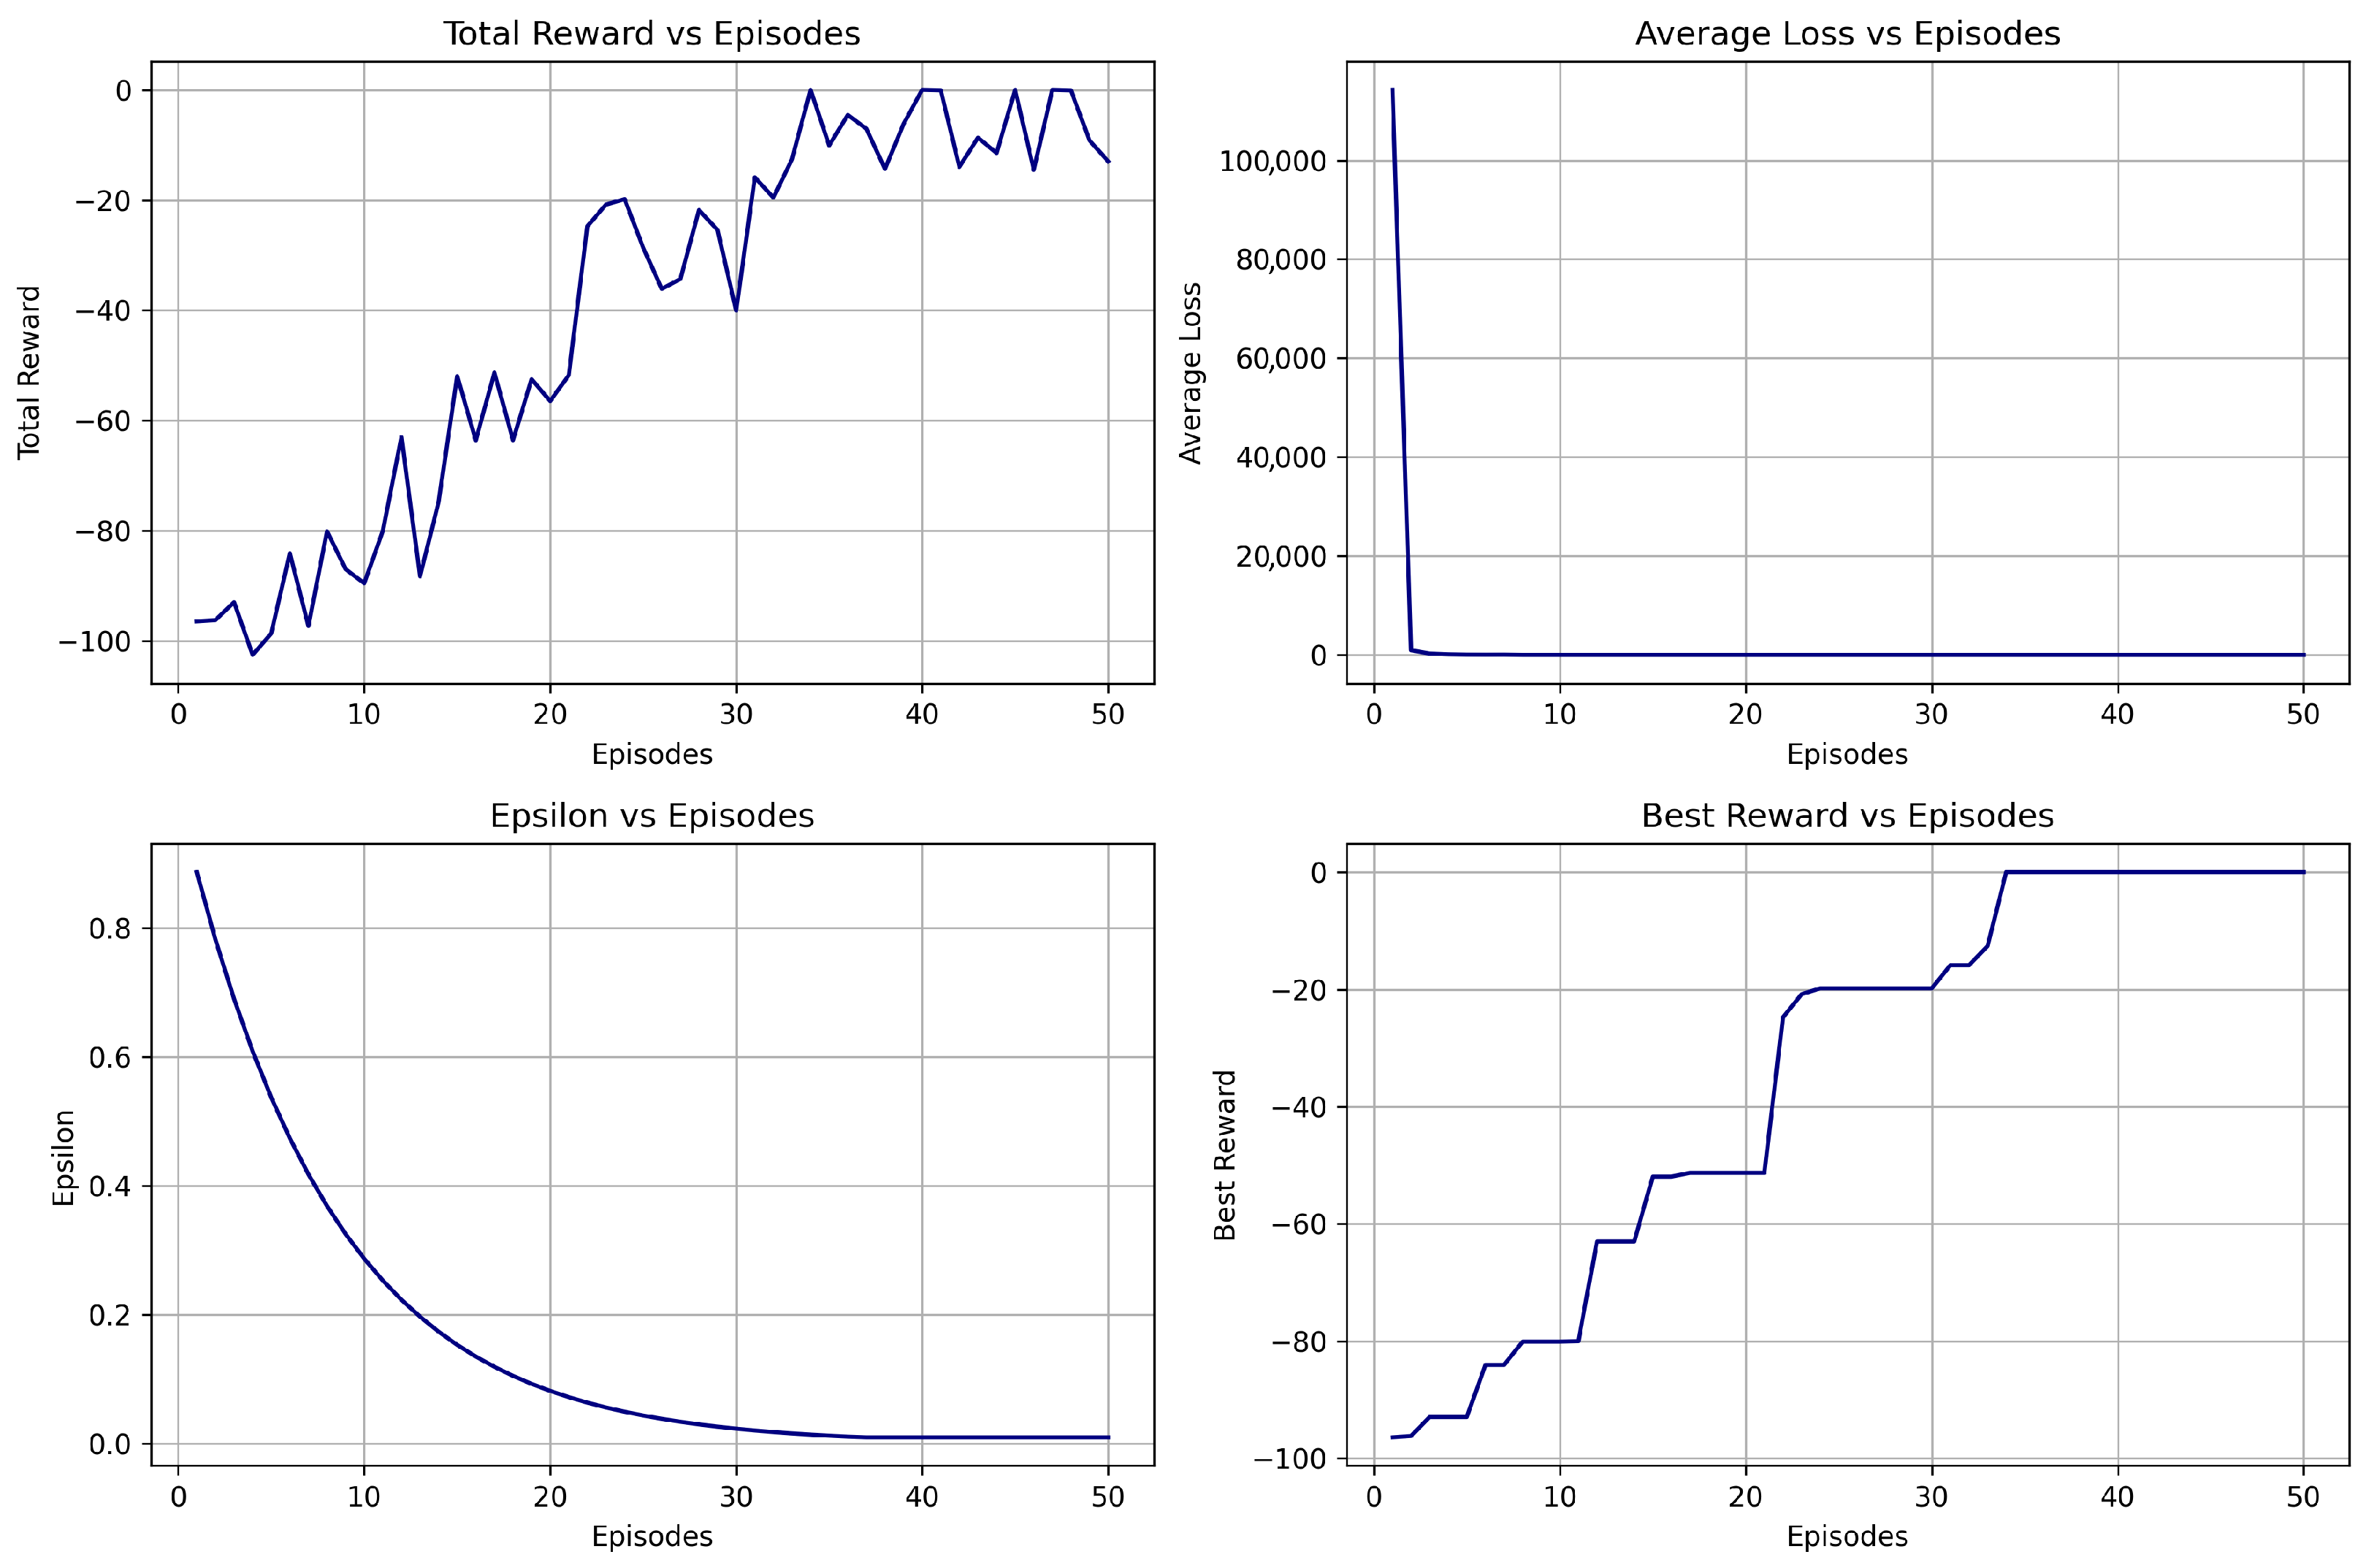
6.2.3. Training Summary
6.2.4. Evaluation Summary on Test Data
6.2.5. Transition to Advanced Architectures
6.3. Dueling Double Deep Q-Network (Dueling DDQN)
6.3.1. Hyperparameters
6.3.2. Model Variants
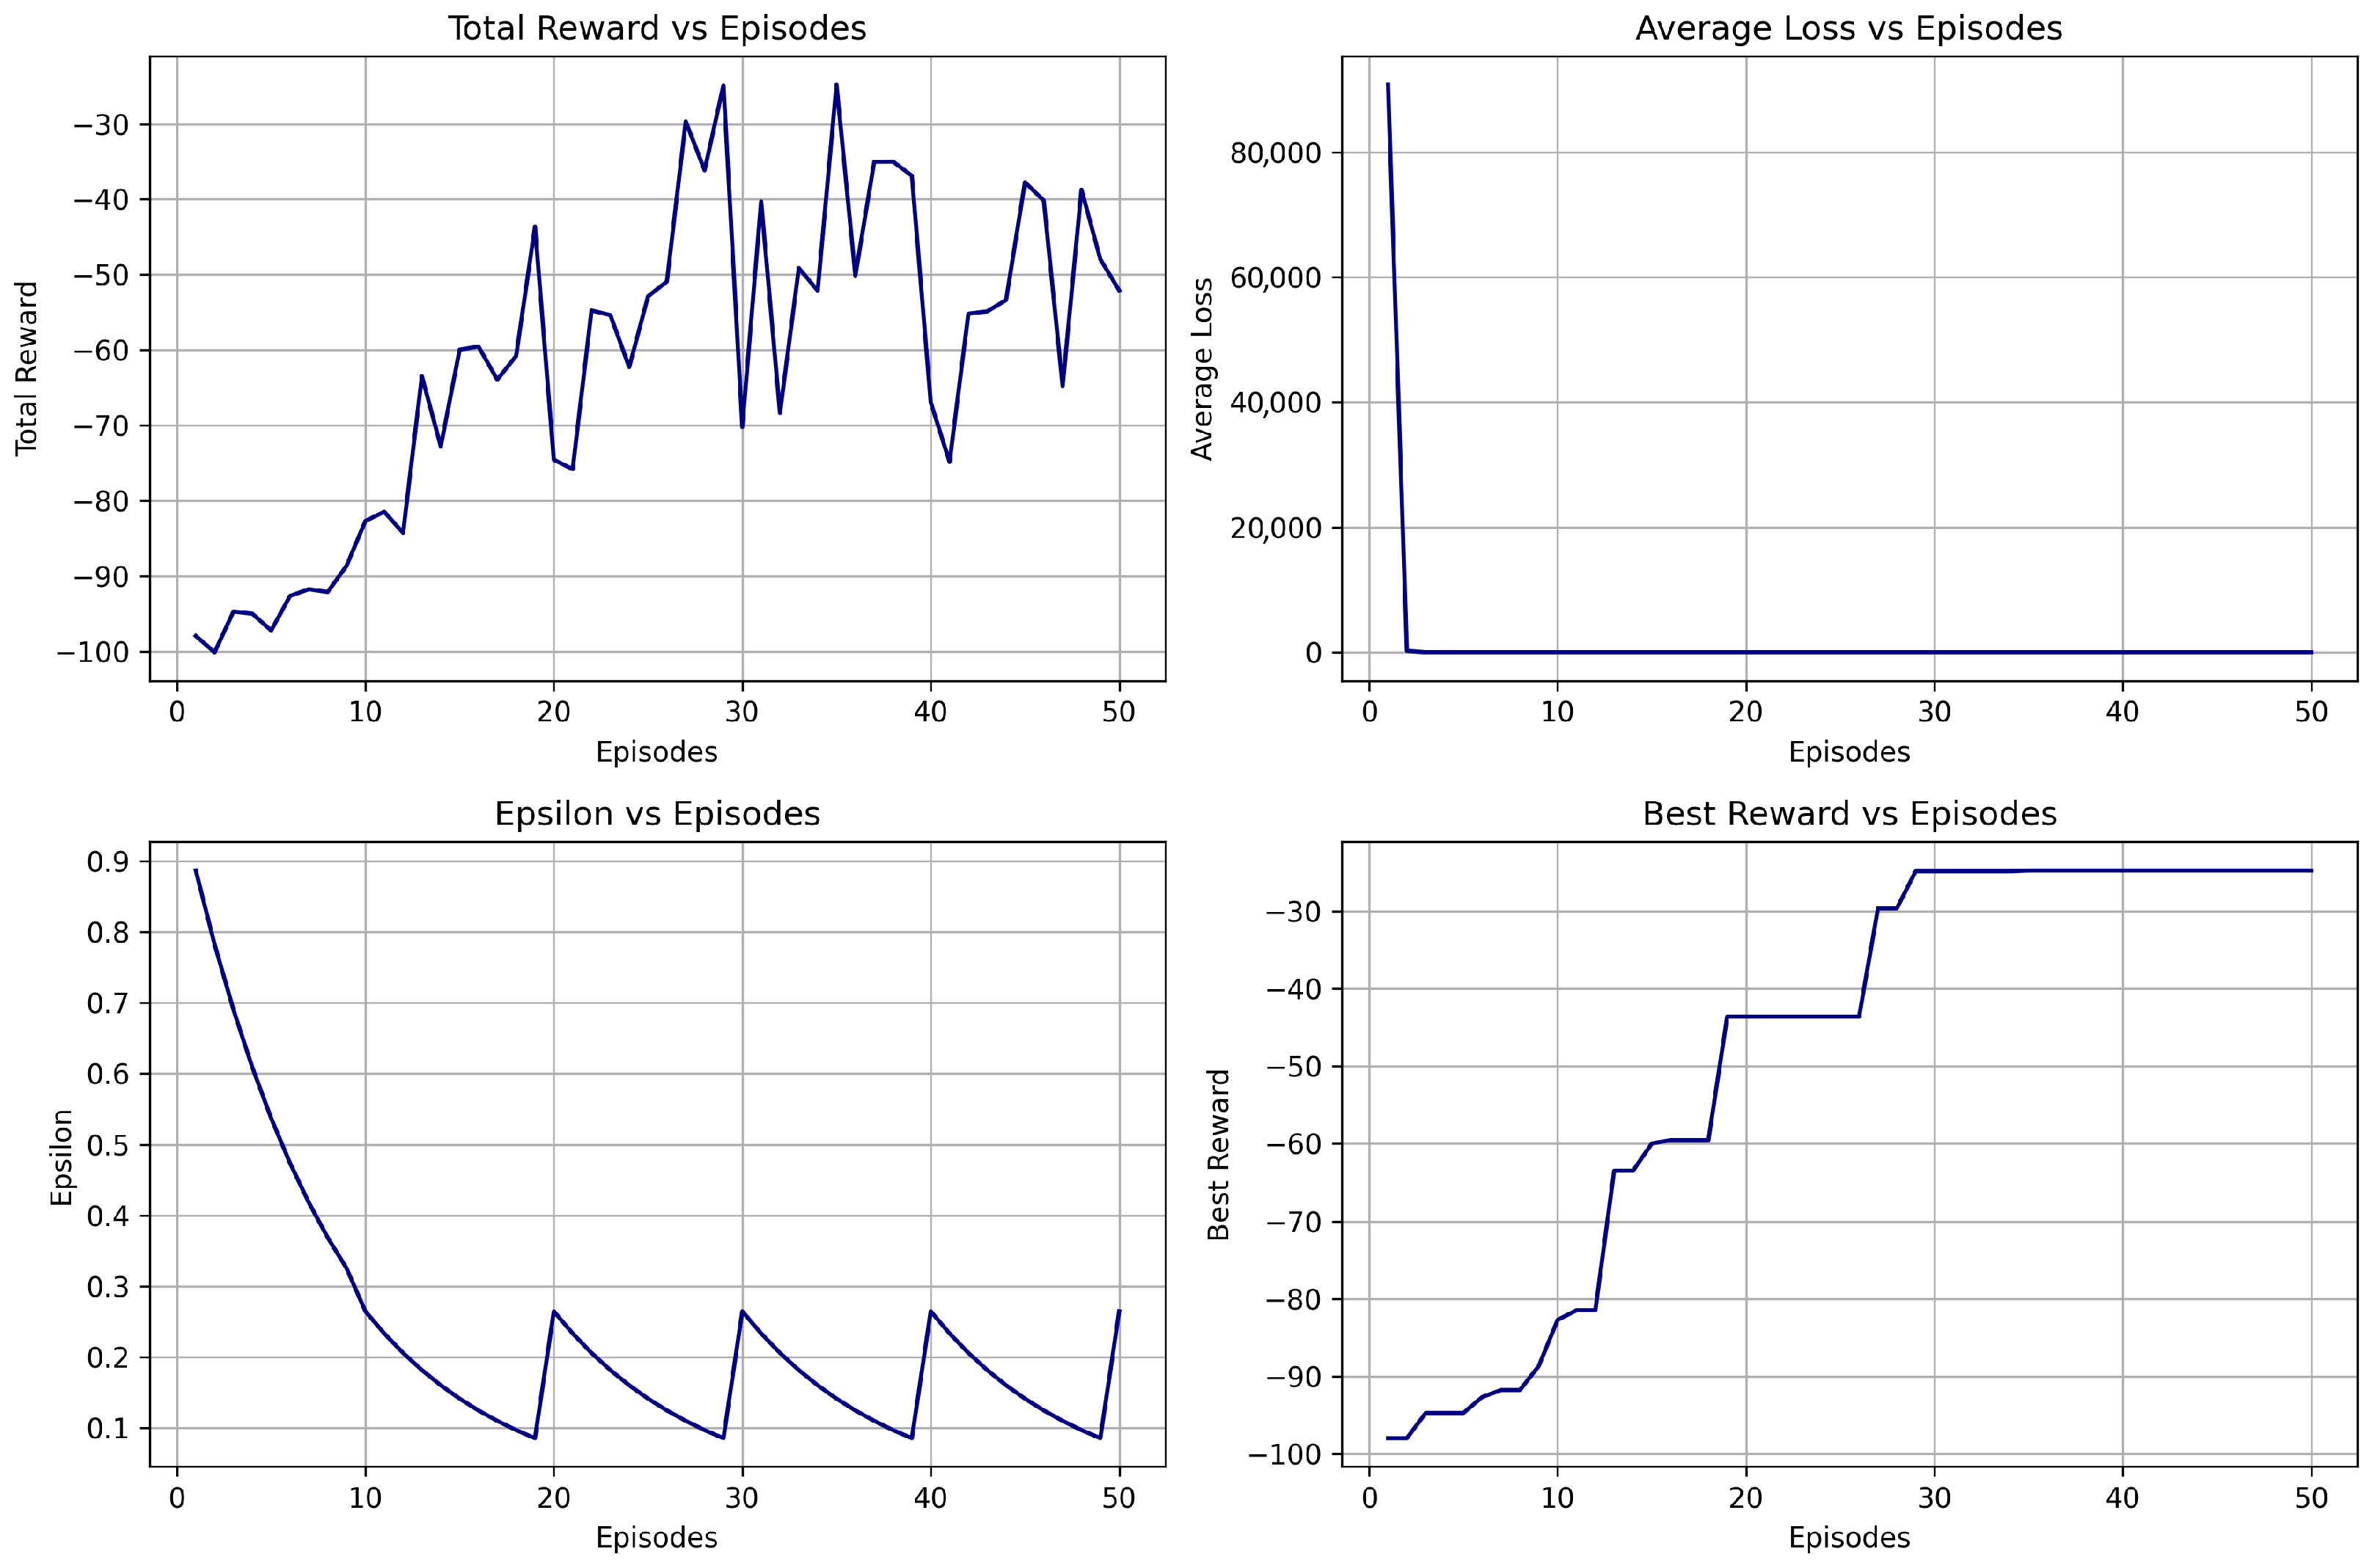
- Dueling DDQN V1 is the baseline model with prioritized experience replay and steady epsilon decay.
- Dueling DDQN V2 incorporates periodic epsilon resets to encourage exploration and prevent local optima entrapment.
- Dueling DDQN V3 integrated softmax action sampling, cooldown logic, and a reduced reward penalty structure to balance exploration–exploitation trade-offs and enhance policy stability.
6.3.3. Training Summary
6.3.4. Evaluation Summary on Test Data
6.4. Cross-Model Performance Metrics
6.4.1. Evaluation Metrics Comparison
6.4.2. Training Stability Analysis
6.4.3. Overall Model Performance
7. Discussion
7.1. DQN Model: Interpretation and Key Insights
7.2. DDQN Model: Interpretation and Key Insights
7.3. Dueling DDQN Model: Interpretation and Key Insights
7.4. Comparison with Existing Literature
7.5. Cross-Model Performance Interpretation
7.6. Strategic Recommendations and Practical Considerations
7.7. Study Limitations and Constraints
8. Conclusion and Future Work
Author Contributions
Funding
Institutional Review Board Statement
Informed Consent Statement
Data Availability Statement
Conflicts of Interest
References
- Economic Times. Every 4th Rupee in Mutual Funds Belong to Retail Investors, HNIs Own 1/3rd AUM: Franklin Templeton India MF. Economic Times. 6 February 2024. Available online: https://economictimes.indiatimes.com/mf/mf-news/every-4th-rupee-in-mutual-funds-belong-to-retail-investors-hnis-own-1/3rd-aum-franklin-templeton-india-mf/articleshow/122833651.cms (accessed on 23 July 2025).
- Ansari, Y.; Yasmin, S.; Naz, S.; Zaffar, H.; Ali, Z. A Deep Reinforcement Learning-Based Decision Support System for Automated Stock Market Trading. IEEE Access 2022, 10, 133228–133238. [Google Scholar] [CrossRef]
- Ryll, L.; Seidens, S. Evaluating the Performance of Machine Learning Algorithms in Financial Market Forecasting: A Comprehensive Survey. arXiv 2019. [Google Scholar] [CrossRef]
- Pricope, T.-V. Deep Reinforcement Learning in Quantitative Algorithmic Trading: A Review. arXiv 2021. [Google Scholar] [CrossRef]
- Awad, A.L.; Elkaffas, S.M.; Fakhr, M.W. Stock Market Prediction Using Deep Reinforcement Learning. Appl. Syst. Innov. 2023, 6, 106. [Google Scholar] [CrossRef]
- Nuipian, W.; Meesad, P.; Maliyaem, M. Innovative Portfolio Optimization Using Deep Q-Network Reinforcement Learning. In Proceedings of the 2024 8th International Conference on Natural Language Processing and Information Retrieval (NLPIR ’24), Okayama, Japan, 13–15 December 2024; pp. 292–297. [Google Scholar] [CrossRef]
- Du, S.; Shen, H. A Stock Prediction Method Based on Deep Reinforcement Learning and Sentiment Analysis. Appl. Sci. 2024, 14, 8747. [Google Scholar] [CrossRef]
- Hossain, F.; Saha, P.; Khan, M.; Hanjala, M. Deep Reinforcement Learning for Enhanced Stock Market Prediction with Fine-Tuned Technical Indicators. In Proceedings of the 2024 IEEE International Conference on Computing, Applications and Systems (COMPAS), Cox’s Bazar, Bangladesh, 25–26 September 2024; pp. 1–8. [Google Scholar] [CrossRef]
- Sagiraju, K.; Mogalla, S. Deployment of Deep Reinforcement Learning and Market Sentiment Aware Strategies in Automated Stock Market Prediction. Int. J. Eng. Trends Technol. 2022, 70, 37–47. [Google Scholar] [CrossRef]
- Mienye, E.; Jere, N.; Obaido, G.; Mienye, I.D.; Aruleba, K. Deep Learning in Finance: A Survey of Applications and Techniques. AI 2024, 5, 2066–2091. [Google Scholar] [CrossRef]
- Hu, Z.; Zhao, Y.; Khushi, M. A Survey of Forex and Stock Price Prediction Using Deep Learning. Appl. Syst. Innov. 2021, 4, 9. [Google Scholar] [CrossRef]
- Hiransha, M.; Gopalakrishnan, E.A.; Menon, V.K.; Soman, K.P. NSE Stock Market Prediction Using Deep-Learning Models. Procedia Comput. Sci. 2018, 132, 1351–1362. [Google Scholar] [CrossRef]
- Yang, H.; Liu, X.Y.; Zhong, S.; Walid, A. Deep Reinforcement Learning for Automated Stock Trading: An Ensemble Strategy. In Proceedings of the 1st ACM International Conference on AI in Finance (ICAIF), New York, NY, USA, 15–16 October 2020; pp. 1–8. [Google Scholar]
- Zhang, Z.; Zohren, S.; Roberts, S. Deep Reinforcement Learning for Trading. J. Financ. Data Sci. 2020, 2, 25–40. [Google Scholar] [CrossRef]
- Singh, V.; Chen, S.S.; Singhania, M.; Nanavati, B.; Gupta, A. How Are Reinforcement Learning and Deep Learning Algorithms Used for Big Data-Based Decision Making in Financial Industries—A Review and Research Agenda. Int. J. Inf. Manag. Data Insights 2022, 2, 100094. [Google Scholar] [CrossRef]
- Kabbani, T.; Duman, E. Deep Reinforcement Learning Approach for Trading Automation in the Stock Market. IEEE Access 2022, 10, 93564–93574. [Google Scholar] [CrossRef]
- Théate, T.; Ernst, D. An Application of Deep Reinforcement Learning to Algorithmic Trading. Expert Syst. Appl. 2021, 173, 114632. [Google Scholar] [CrossRef]
- Li, Y.; Zheng, W.; Zheng, Z. Deep Robust Reinforcement Learning for Practical Algorithmic Trading. IEEE Access 2019, 7, 108014–108022. [Google Scholar] [CrossRef]
- Cheng, L.-C.; Huang, Y.-H.; Hsieh, M.-H.; Wu, M.-E. A Novel Trading Strategy Framework Based on Reinforcement Deep Learning for Financial Market Predictions. Mathematics 2021, 9, 3094. [Google Scholar] [CrossRef]
- Taghian, M.; Asadi, A.; Safabakhsh, R. Learning Financial Asset-Specific Trading Rules via Deep Reinforcement Learning. Expert Syst. Appl. 2022, 195, 116523. [Google Scholar] [CrossRef]
- Li, Y.; Ni, P.; Chang, V. Application of Deep Reinforcement Learning in Stock Trading Strategies and Stock Forecasting. Computing 2020, 102, 1305–1322. [Google Scholar] [CrossRef]
- Bajpai, S. Application of Deep Reinforcement Learning for Indian Stock Trading Automation. arXiv 2021. [Google Scholar] [CrossRef]
- Guéant, O.; Manziuk, I. Deep Reinforcement Learning for Market Making in Corporate Bonds: Beating the Curse of Dimensionality. Appl. Math. Financ. 2019, 26, 387–452. [Google Scholar] [CrossRef]
- Wang, H.; Zhou, X.Y. Continuous-Time Mean–Variance Portfolio Selection: A Reinforcement Learning Framework. Math. Financ. 2020, 30, 1015–1050. [Google Scholar] [CrossRef]
- Hambly, B.; Xu, R.; Yang, H. Recent Advances in Reinforcement Learning in Finance. Math. Financ. 2023, 33, 437–503. [Google Scholar] [CrossRef]
- Fu, Y.-T.; Huang, W.-C. Optimizing Stock Investment Strategies with Double Deep Q-Networks: Exploring the Impact of Oil and Gold Price Signals. Appl. Soft Comput. 2025, 180, 113264. [Google Scholar] [CrossRef]
- Carta, S.; Ferreira, A.; Podda, A.S.; Recupero, D.R.; Sanna, A. Multi-DQN: An Ensemble of Deep Q-Learning Agents for Stock Market Forecasting. Expert Syst. Appl. 2021, 164, 113820. [Google Scholar] [CrossRef]
- Huang, Y.; Lu, X.; Zhou, C.; Song, Y. DADE-DQN: Dual Action and Dual Environment Deep Q-Network for Enhancing Stock Trading Strategy. Mathematics 2023, 11, 3626. [Google Scholar] [CrossRef]
- Liu, W.; Gu, Y.; Ge, Y. Multi-Factor Stock Trading Strategy Based on DQN with Multi-BiGRU and Multi-Head ProbSparse Self-Attention. Appl. Intell. 2024, 54, 5417–5440. [Google Scholar] [CrossRef]
- Chen, X.; Wang, Q.; Hu, C.; Wang, C. A Stock Market Decision-Making Framework Based on CMR-DQN. Appl. Sci. 2024, 14, 6881. [Google Scholar] [CrossRef]
- Huang, Z.; Gong, W.; Duan, J. TBDQN: A Novel Two-Branch Deep Q-Network for Crude Oil and Natural Gas Futures Trading. Appl. Energy 2023, 347, 121321. [Google Scholar] [CrossRef]
- Chakole, J.B.; Kolhe, M.S.; Mahapurush, G.D.; Yadav, A.; Kurhekar, M.P. A Q-Learning Agent for Automated Trading in Equity Stock Markets. Expert Syst. Appl. 2021, 163, 113761. [Google Scholar] [CrossRef]
- Shi, Y.; Li, W.; Zhu, L.; Guo, K.; Cambria, E. Stock Trading Rule Discovery with Double Deep Q-Network. Appl. Soft Comput. 2021, 107, 107320. [Google Scholar] [CrossRef]
- Nagy, P.; Calliess, J.-P.; Zohren, S. Asynchronous Deep Double Dueling Q-Learning for Trading-Signal Execution in Limit Order Book Markets. Front. Artif. Intell. 2023, 6, 1151003. [Google Scholar] [CrossRef]




| Feature | DQN | DDQN | Dueling DDQN |
|---|---|---|---|
| Overestimation Bias | Yes | Reduced | Reduced |
| Architecture Type | Standard | Double | Dueling + Double |
| Value Advantage Split | No | No | Yes |
| Metric | Training Set | Test Set |
|---|---|---|
| Timeframe | April 2015 to April 2024 | May 2024 to April 2025 |
| Rows | 57,478 | 6014 |
| Mean ‘Close’ | 12,860.42 | 23,875.94 |
| Max/Min ‘Close’ | 22,772/6902.01 | 26,267.27/21,468.15 |
| Hyperparameter | DQN V1 | DQN V2 | DQN V3 |
|---|---|---|---|
| Window Size | 10 | 10 | 100 |
| Batch Size | 32 | 32 | 64 |
| Episodes | 51 | 50 | 80 |
| Learning Rate | 0.001 | 0.001 | 0.00025 |
| Gamma (Discount) | 0.95 | 0.95 | 0.95 |
| Epsilon (Start) | 1.0 | 1.0 | 1.0 |
| Epsilon Min | 0.01 | 0.01 | 0.01 |
| Epsilon Decay | 0.995 | 0.995 | 0.995 |
| Epsilon Reset | No | Yes (every 10 episodes) | Yes (every 10 episodes) |
| Optimizer | Adam | Adam | Adam |
| Loss Function | MSE | MSE | MSE |
| Experience Replay | Prioritized | Prioritized | Prioritized |
| Reward Penalty | No | Yes (time and frequency) | Yes (time and frequency) |
| Softmax Sampling | No | No | Yes |
| Cooldown Logic | No | No | Yes |
| Variant | Reward Penalty | Epsilon Reset | Softmax Sampling | Cooldown Logic |
|---|---|---|---|---|
| DQN V1 | No | No | No | No |
| DQN V2 | Yes | Yes | No | No |
| DQN V3 | Yes | Yes | Yes | Yes |
| Model | Best Reward | Avg Reward | Convergence | Notes |
|---|---|---|---|---|
| DQN V1 | 4.89 | +0.24 | Fastest | Best performer overall |
| DQN V2 | 4.17 | +0.44 | Stable | Unstable performance |
| DQN V3 | −84.6 | −97.5 | Most Balanced | Over-constrained strategy |
| Model | Total Trades | Win Rate | Profit Factor | Sharpe Ratio | Final Balance (in INR) |
|---|---|---|---|---|---|
| Buy–Hold–Sell | 1 | 0% (1 trade, loss) | 0 | −0.459 | 188,111.00 (∼USD 2178) |
| 50–200 EMA Crossover | 14 | 50% | 1.12 | 0.074 | 227,730.00 (∼USD 2636) |
| DQN V1 | 38 | 65.8% | 1.35 | 0.0969 | 329,737.81 (∼USD 3818) |
| DQN V2 | 251 | 46.2% | 1.01 | 0.0040 | 207,708.13 (∼USD 2405) |
| DQN V3 | 12 | 50.0% | 1.37 | 0.1126 | 206,074.06 (∼USD 2386) |
| Hyperparameter | DDQN V1 | DDQN V2 | DDQN V3 |
|---|---|---|---|
| Window Size | 10 | 10 | 100 |
| Batch Size | 32 | 32 | 64 |
| Episodes | 50 | 50 | 51 |
| Learning Rate | 0.001 | 0.001 | 0.00025 |
| Gamma (Discount) | 0.95 | 0.95 | 0.95 |
| Epsilon (Start) | 1.0 | 1.0 | 1.0 |
| Epsilon Min | 0.01 | 0.01 | 0.01 |
| Epsilon Decay | 0.995 | 0.995 | 0.995 |
| Epsilon Reset | No | Yes (every 10 episodes) | Yes (every 10 episodes) |
| Optimizer | Adam | Adam | Adam |
| Loss Function | MSE | MSE | MSE |
| Experience Replay | Prioritized | Prioritized | Prioritized |
| Reward Penalty | Time and Frequency | Time and Frequency | Time and Frequency |
| Softmax Sampling | No | No | Yes |
| Cooldown Logic | No | No | Yes |
| Variant | Reward Penalty | Epsilon Reset | Softmax Sampling | Cooldown Logic |
|---|---|---|---|---|
| DDQN V1 | Yes | No | No | No |
| DDQN V2 | Yes | Yes | No | No |
| DDQN V3 | Yes | Yes | Yes | Yes |
| Model | Best Reward | Average Reward | Notes |
|---|---|---|---|
| DDQN V1 | −0.002 | −40.69 | Demonstrated steady learning, but with moderate Sharpe ratio. |
| DDQN V2 | −34.45 | −67.05 | Periodic exploration observed; achieved higher balance but lower Sharpe ratio. |
| DDQN V3 | −45.08 | −48.92 | Recorded the highest profitability and best volatility-adjusted performance. |
| Model | Total Trades | Win Rate | Profit Factor | Sharpe Ratio | Final Balance (in INR) |
|---|---|---|---|---|---|
| Buy–Hold–Sell | 1 | 0% (1 trade, loss) | 0 | −0.459 | 188,111.00 (∼USD 2178) |
| 50–200 EMA Crossover | 14 | 50% | 1.12 | 0.074 | 227,730.00 (∼USD 2636) |
| DDQN V1 | 57 | 52.63% | 1.13 | 0.0375 | 210,770.94 (∼USD 2440) |
| DDQN V2 | 26 | 42.31% | 1.13 | 0.0353 | 220,681.25 (∼USD 2555) |
| DDQN V3 | 15 | 73.33% | 16.58 | 0.7394 | 270,155.94 (∼USD 3128) |
| Hyperparameter | Dueling DDQN V1 | Dueling DDQN V2 | Dueling DDQN V3 |
|---|---|---|---|
| Window Size | 10 | 10 | 100 |
| Batch Size | 32 | 32 | 64 |
| Episodes | 50 | 50 | 80 |
| Learning Rate | 0.001 | 0.001 | 0.00025 |
| Gamma (Discount) | 0.95 | 0.95 | 0.95 |
| Epsilon (Start) | 1.0 | 1.0 | 1.0 |
| Epsilon Min | 0.01 | 0.01 | 0.01 |
| Epsilon Decay | 0.995 | 0.995 | 0.995 |
| Epsilon Reset | No | Yes (every 10) | Yes (every 10) |
| Optimizer | Adam | Adam | Adam |
| Loss Function | MSE | MSE | MSE |
| Experience Replay | Prioritized | Prioritized | Prioritized |
| Reward Penalty | Time and Frequency | Time and Frequency | Time and Frequency |
| Softmax Sampling | No | No | Yes |
| Cooldown Logic | No | No | Yes |
| Model | Best Reward | Avg Reward | Notes |
|---|---|---|---|
| Dueling DDQN V1 | −0.002 | −38.47 | Baseline learning with moderate trade frequency. |
| Dueling DDQN V2 | −24.77 | −61.78 | Exploration resets improved stability but increased volatility. |
| Dueling DDQN V3 | 316.08 | −41.91 | Highest reward achieved; consistent profitability with volatility-adjusted returns. |
| Model | Total Trades | Win Rate | Profit Factor | Sharpe Ratio | Final Balance (in INR) |
|---|---|---|---|---|---|
| Buy–Hold–Sell | 1 | 0% (1 trade, loss) | 0 | −0.459 | 188,111.00 (∼USD 2178) |
| 50–200 EMA Crossover | 14 | 50% | 1.12 | 0.074 | 227,730.00 (∼USD 2636) |
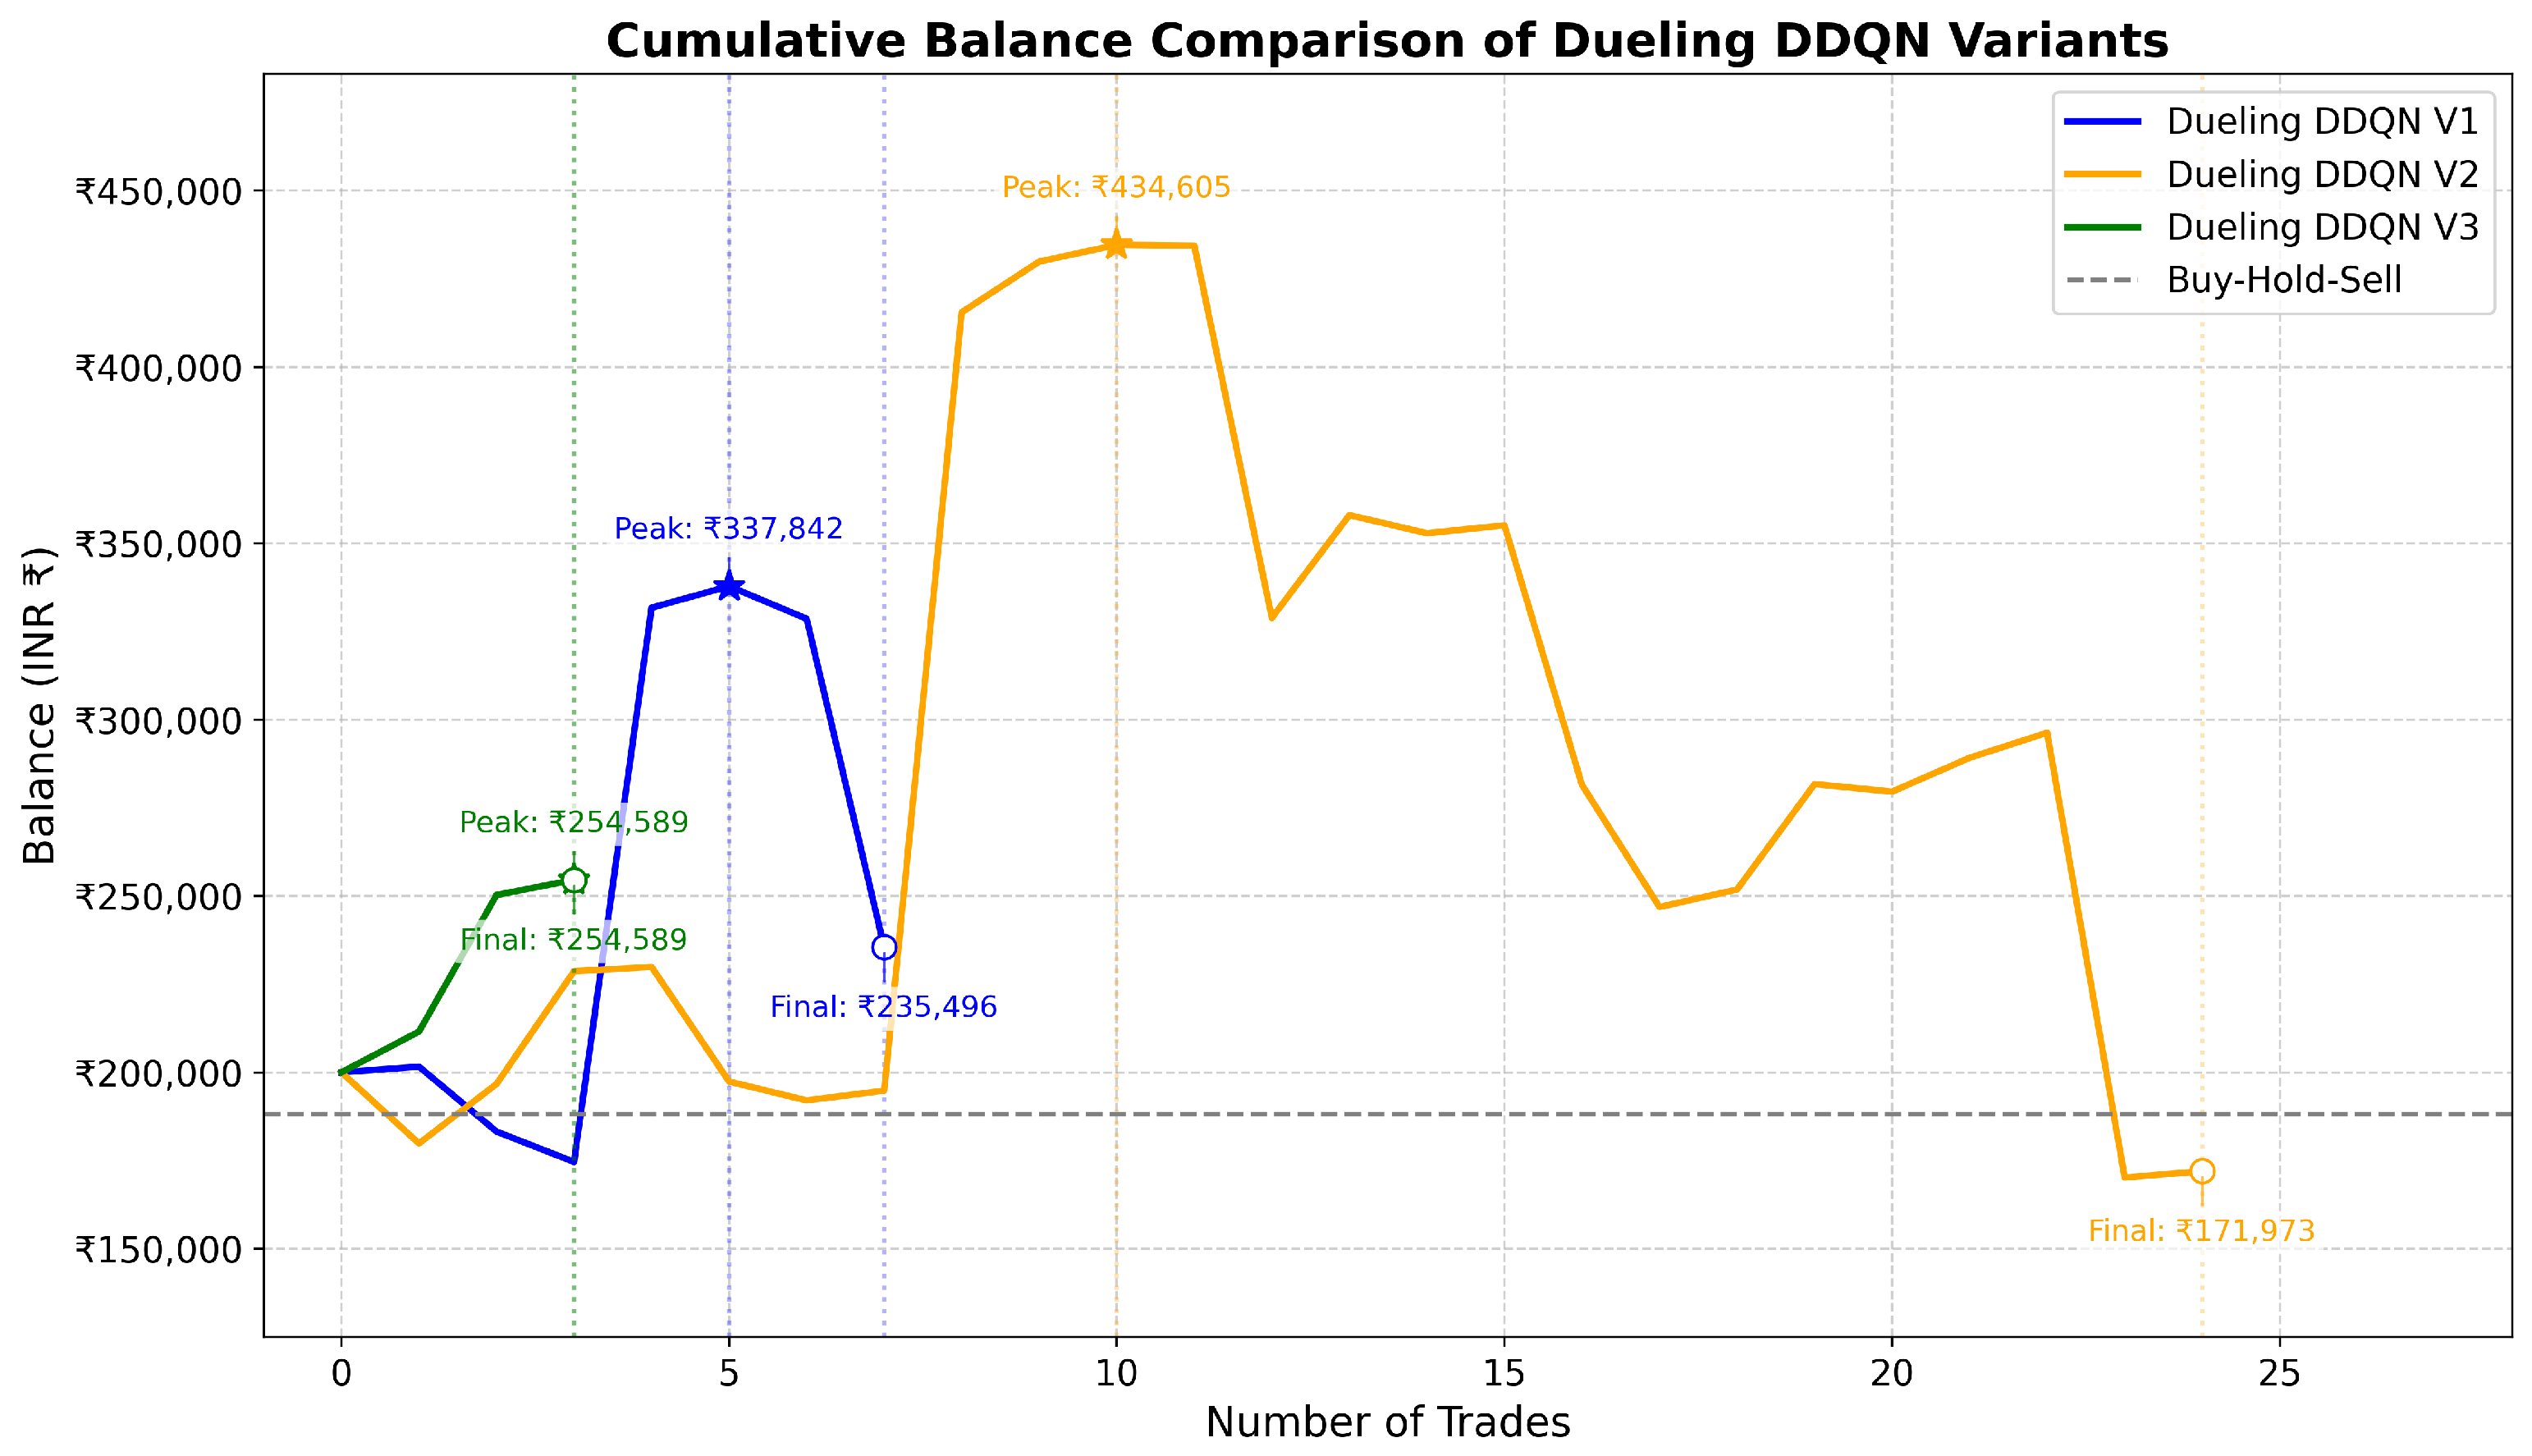
| Dueling DDQN V1 | 7 | 42.86% | 1.27 | 0.0731 | 235,495.63 (∼USD 2726) |
| Dueling DDQN V2 | 24 | 58.33% | 0.93 | −0.0194 | 171,973.44 (∼USD 1991) |
| Dueling DDQN V3 | 3 | 100.0% | NA | 1.2278 | 254,588.75 (∼USD 2948) |
| Model | Total Trades | Win Rate | Profit Factor | Sharpe Ratio | Mean PnL (in INR) | 95% Confidence Interval (in INR) | Final Balance (in INR) | Total Profit (in INR) |
|---|---|---|---|---|---|---|---|---|
| DQN (V1) | 38 | 65.79% | 1.35 | 0.097 | 3414.15 (∼USD 39.50) | [−8416.31, 14,265.13] | 329,738 (∼USD 3818) | 129,738 (∼USD 1500) |
| DDQN (V3) | 15 | 73.33% | 16.58 | 0.739 | 4677.06 (∼USD 54.10) | [1739.27, 8071.12] | 270,156 (∼USD 3128) | 70,156 (∼USD 811.40) |
| Dueling DDQN (V3) | 3 | 100.00% | NA | 1.228 | 18,196.25 (∼USD 210.60) | [4294.68, 38730] | 254,589 (∼USD 2948) | 54,589 (∼USD 631.40) |
| Paper | DRL Model | Dataset/Market | Timeframe and Granularity | Sharpe Ratio Reported | Baseline Comparison | Key Notes |
|---|---|---|---|---|---|---|
| Nuipian et al. [6] | DQN | Selected stocks: AAPL, INTC, META, TQQQ, TSLA (InnovorX by SCB Thailand) | 2017–2024, daily | TQQQ: 0.78; TSLA: 0.40; META: −4.1; INTC: −0.5 | Not reported | Effective for TQQQ, AAPL; INTC underperformed; limited to 5 stocks; suggests hybrid DRL for volatile assets. |
| Du and Shen [7] | DQN, SADQN-R, SADQN-S | Chinese market: 90 stocks + sentiment from East Money | 2022–2024, daily | Not reported | UBAH, UCRP, UP | SADQN-S best performance; effective on newly listed stocks; depends on SnowNLP comment quality. |
| Hossain et al. [8] | DQN | US market: 10+ stocks (IBM, AAPL, AMD, etc.) | 2000–2012, daily | Not reported | Not stated | Uses technical indicators (SMA, RSI, OBV); periodic retraining needed; data provider inconsistencies. |
| Bajpai [22] | DQN, DDQN, Dueling DDQN | Indian stocks (e.g., TCS, ULTRACEMCO) | Not specified, daily | Not reported | Not specified | Trained on buy–hold–sell; tested on unseen data; limitations due to available stock data and market changes. |
| Proposed Method | DQN, DDQN, Dueling DDQN | NIFTY 50 index | 2015–2023 (training), 2024–2025 (testing), 15-min OHLC | DQN: 0.097; DDQN: 0.739; Dueling DDQN: 1.228 | Buy–Hold–Sell, 50–200 EMA Crossover | DRL study on NIFTY 50 using high-frequency data. Results include Sharpe, profit factor, CI, and equity curves. |
Disclaimer/Publisher’s Note: The statements, opinions and data contained in all publications are solely those of the individual author(s) and contributor(s) and not of MDPI and/or the editor(s). MDPI and/or the editor(s) disclaim responsibility for any injury to people or property resulting from any ideas, methods, instructions or products referred to in the content. |
© 2025 by the authors. Licensee MDPI, Basel, Switzerland. This article is an open access article distributed under the terms and conditions of the Creative Commons Attribution (CC BY) license (https://creativecommons.org/licenses/by/4.0/).
Share and Cite
Mishra, R.G.; Sharma, D.; Gadhavi, M.; Pant, S.; Kumar, A. A Deep Reinforcement Learning Framework for Strategic Indian NIFTY 50 Index Trading. AI 2025, 6, 183. https://doi.org/10.3390/ai6080183
Mishra RG, Sharma D, Gadhavi M, Pant S, Kumar A. A Deep Reinforcement Learning Framework for Strategic Indian NIFTY 50 Index Trading. AI. 2025; 6(8):183. https://doi.org/10.3390/ai6080183
Chicago/Turabian StyleMishra, Raj Gaurav, Dharmendra Sharma, Mahipal Gadhavi, Sangeeta Pant, and Anuj Kumar. 2025. "A Deep Reinforcement Learning Framework for Strategic Indian NIFTY 50 Index Trading" AI 6, no. 8: 183. https://doi.org/10.3390/ai6080183
APA StyleMishra, R. G., Sharma, D., Gadhavi, M., Pant, S., & Kumar, A. (2025). A Deep Reinforcement Learning Framework for Strategic Indian NIFTY 50 Index Trading. AI, 6(8), 183. https://doi.org/10.3390/ai6080183


_Zheng.png)


