Abstract
Chaetognaths play an essential role in zooplankton communities and significantly contribute to their overall biomass. Changes in the hydrographic properties of the water column, driven by hydrodynamic processes, affect their species richness and abundance. This study investigates the species richness and abundance of chaetognaths, as well as their relationship with circulation patterns at the boundary of the Pacific Ocean and the Gulf of California, Mexico. The analysis is based on high-resolution hydrographic data and zooplankton samples collected during the early summer of 2019. The results revealed a cyclonic circulation pattern that impacted the chaetognath community at depths greater than 200 m. This pattern resulted in higher chaetognath densities along the peninsular coast compared to the mainland coast. A total of 15 species from three different families were identified. Among these, Flaccisagitta enflata had the highest density, recorded at 16,143 ind 100 m−3, while Aidanosagitta neglecta exhibited a significantly lower density of only 48 ind 100 m−3. Multivariate statistical analyses indicated that hydrographic variables were key factors influencing the distribution of the chaetognath community during the sampling period. Given the significant research gap regarding this group in the region, our findings contribute to a deeper understanding of chaetognath communities and their relationship with circulation patterns in the Southern Gulf of California, recognized as an oasis of marine life.
1. Introduction
Marine zooplankton consists of a diverse group of species from nearly all phyla of organisms found in the marine environment, including both invertebrates and vertebrates [1]. Within this diverse group, different species exhibit various feeding habits, playing a crucial role in the transfer of energy and carbon throughout the pelagic food chain. These feeding habits can be categorized as omnivorous, herbivorous, and carnivorous behaviors [2].
Among the carnivorous zooplankton, chaetognaths (Chaetognatha: Sagittoidea) are essential structural and functional components of the zooplankton community. Chaetognaths are a phylum of exclusively marine organisms characterized by a coelomate body with bilateral symmetry, typically ranging in sizes from 1 to 100 mm [3]. Due to their elongated, thin, and generally transparent bodies, they are commonly referred to as “glass worms”. Key distinguishing features include lateral and tail fins, spines or grasping hooks on either side of the mouth, and rows of teeth located at the front of the mouth [4].
The ecological importance of chaetognaths is primarily linked to their role in trophic dynamics. As active planktonic predators, juvenile chaetognaths feed on naupliar stages of copepods and tintinnids, while adults consume a variety of prey, including crustaceans, fish larvae, and even other chaetognaths. This predatory behavior is vital for the transfer of energy and carbon sequestration within marine ecosystems, contributing to the efficient functioning of the biological pump [5]. Moreover, chaetognaths are sensitive to environmental changes, making them valuable indicators of water masses and oceanic processes [6]. They also serve as attractive prey for commercially important fish species (e.g., hakes, anchovies, sardines), highlighting their economic significance [7].
Chaetognaths are a significant component of zooplankton communities, often accounting for more than 15% of the total zooplankton biomass. Thus, they can be found in a wide range of environments, including estuaries, open ocean waters, deep-sea ecosystems, and even polar regions [8].
Chaetognaths, like all zooplankton organisms, are sensitive to changes in the hydrographic properties of the water column, particularly temperature and salinity. These properties can be influenced by hydrodynamic processes such as internal waves [9], upwelling events [10], and eddies [11]. In the Romanian Black Sea, for example, salinity combined with temperature accounts for over 80% of the variability in the zooplankton abundance groups, including chaetognaths [12,13]. In the Bay of Bengal and the Arabian Sea, located in the northern Indian Ocean, eddies play a crucial role in regulating the species richness and distribution of chaetognaths. These eddies create significant alterations in the hydrographic properties of the water column, resulting in strong gradients in density and temperature [11]. In the northern South China Sea, the horizontal distribution of chaetognaths is closely linked to the presence of mesoscale eddies, which further contribute to considerable variability in the hydrographic properties throughout the water column [14]. Additionally, in the Yellow Sea, it has been suggested that changes in temperature regimes, driven by the advection of warm currents, affect the composition and distribution of chaetognaths [15].
In the Gulf of California, a large interior sea located on the North American continent, in Mexico, the ecosystem is highly dynamic, influenced by various physical processes such as internal waves, upwelling events, eddies and fronts. It is known that chaetognaths are a significant numerical component of this ecosystem. In the 1960s, the first taxonomic lists of chaetognaths were published, identifying three species in coastal waters off Sinaloa [16] and 13 species in oceanic waters [17]. Over time, the list increased to include 17 species. Among the most abundant species included Sagitta enflata Grassi, 1881 (now called as Flaccisagitta enflata (Grassi, 1881), Sagitta minima Grassi, 1881 (now called as Mesosagitta minima (Grassi, 1881), Sagitta euneritica Alvariño, 1961 (now called as Parasagitta euneritica (Alvariño, 1961) and Sagitta decipiens Fowler, 1905 (now called as Decipisagitta decipiens (Fowler, 1905). The horizontal distribution of these species varies seasonally, primarily influenced by changes in water temperature [18]. Research conducted a few years later confirmed the dominance of S. enflata in the Gulf’s interior, a species that can occasionally account for 100% of the chaetognath community in the region [19].
Research on chaetognaths has regained importance after many years of neglect. In the early 2000s, Thuesen & Haddock [20] identified a new species of chaetognath (Archeterokrohnia docrickettsae) in the Southern Gulf of California. Across the gulf, among zooplankton, chaetognaths are the second most abundant group, after copepods [21], which is usually the primary food source of emblematic species like the whale shark [22].
Despite this, few studies have explored the relationship between the physical environment of the Southern Gulf of California and chaetognath communities. Some research has investigated how these communities respond to large-scale events, such as the El Niño Southern Oscillation. This research indicates that the movement of unusually warm and nutrient-poor water masses during El Niño phases impacts these organisms [23,24]. However, the effects of circulation patterns on the composition, distribution, and abundance of chaetognaths in the Southern Gulf of California remain largely unknown.
This study evaluated chaetognath assemblages and their relationship with circulation patterns in the Southern Gulf of California during June 2019. We utilized high-resolution hydrographic data and zooplankton samples collected during a multidisciplinary research cruise. Our sampling strategy involved 13 stations distributed across two transects linking the Gulf to the open Pacific Ocean, stretching from Baja California Peninsula to Sinaloa (Figure 1). These field observations were complemented by concurrent satellite data on sea surface temperature and chlorophyll-a. We hypothesize that variability in hydrographic conditions in the water column will lead to changes in species composition, as well as variations in assemblages between the two coasts of the Gulf. Our goal is to enhance the understanding of the dynamics of these organisms in the waters of the Southern Gulf of California by providing new insights compared to past studies, using innovative approaches. These approaches include: (1) the incorporation of recent high-resolution hydrographic data throughout the water column, (2) the analysis of community–circulation linkages under contemporary oceanographic conditions, (3) the application of multiple multivariate statistical techniques, and (4) an update of the taxonomic nomenclature for this group, which has undergone significant revisions in recent years. The results presented in this study can also serve as a base for understanding species of high ecological and economic value that support important commercially valuable fisheries. Furthermore, since chaetognaths are organisms with a broad diet, our findings may contribute to understanding the dynamics of other groups that are part of the zooplankton community.
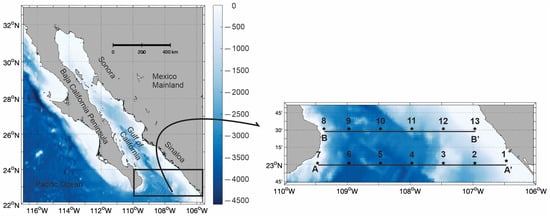
Figure 1.
The study area, the Gulf of California, Mexico. The * black symbols indicate the localities where hydrographic data and chaetognaths were collected, specifically in the area connecting the Gulf of California to the Pacific Ocean. The A-A’ and B-B’ transects represent locations where the vertical distribution of hydrographic parameters and chaetognath species were analyzed. The A-A’ transect included stations 1 to 7, while the B-B’ transect included stations 8 to 13. Bathymetry is shown in meters.
2. Materials and Methods
2.1. Study Area
The Gulf of California is a long, narrow inland sea located in Mexico, positioned between the Baja California peninsula and the mainland of Mexico. It stretches over 1000 km in length (Figure 1). The Gulf is renowned for its rich biodiversity, providing a habitat for many species, including several that are threatened or endangered [25]. Additionally, it supports various commercially valuable species that are essential for important fisheries [26]. For these reasons, the Gulf of California has been designated as one of the Large Marine Ecosystems of the world [27] and was declared a UNESCO World Heritage Site.
This dynamic ecosystem features a variety of processes at different scales, including internal waves, upwelling events, fronts, and eddies [21]. Each of these processes contributes to a nutrient-rich euphotic zone that supports phytoplankton and, subsequently, all levels of the food chain [21]. The Gulf of California experiences significant climatic variations between winter and summer and it is important to the North American Monsoon [28]. In winter, strong, persistent northwesterly winds create a deep mixed layer. In contrast, during the summer, increased solar radiation and weak southeasterly winds cause the surface water to warm, leading to the stratification of the water column.
The southern part of the Gulf is scientifically significant due to its connection to the Pacific Ocean, meaning that processes in the Pacific can significantly influence interior of the Gulf. This includes phenomena such as upwelling events, heatwaves [29], and eddies [21].
2.2. Sampling
The data and materials used in this study were collected during the oceanographic research cruise “FIBGOC-I,” which took place aboard the R/V “El Puma” operated by the National Autonomous University of Mexico, from June 28 to 30 of 2019. High-resolution hydrographic data were gathered in 13 locations (* black symbols in Figure 1) using a CTD sonde (SeaBird SBE-9 Plus, Sea-Bird Electronics, Inc., Bellevue, WA, USA) equipped with a dissolved oxygen sensor (SeaBird 43, Sea-Bird Electronics, Inc., Bellevue, WA, USA) and a chlorophyll-a fluorescence sensor (ECO Wet Lab, WET Labs, Inc., Philomath, OR, USA). All instruments were calibrated by the manufacturers prior to the cruise. CTD casts were conducted throughout the water column, extending from the surface to approximately 10 m above the bottom. The equipment was set to record data at a frequency of 24 Hz.
Immediately following each CTD cast, zooplankton organisms were collected using Bongo nets with a mesh size of 333 µm and a mouth diameter of 60 cm. These nets were equipped with mechanical flowmeters (General Oceanics 2030R, General Oceanics, Inc., Miami, FL, USA) which were also calibrated before the cruise. The zooplankton collections were made obliquely, from a depth of 200 m depth to the surface or from near the bottom at shallower stations, with each collection lasting 15 min at a speed of 2 knots. Once back on board, the nets were inspected and rinsed carefully with seawater, and the collected organisms were preserved in a 4% formalin solution with sodium borate. After 24 h, the organisms were transferred to 70% ethanol for final preservation.
2.3. Laboratory Analyses
Chaetognaths were separated from the collected zooplankton samples using dissection forceps and needles. The remaining samples, which included other zooplankton groups, were preserved in a solution of 70% ethanol for future research purposes. The organisms were identified at the species level using a Carl Zeiss Stemi 508 stereoscopic microscope (Carl Zeiss Microscopy GmbH, Jena, Germany), equipped with a Carl Zeiss Axiocam 105 color digital camera (Carl Zeiss Microscopy GmbH, Jena, Germany). Standard identification keys [30,31,32], as well as those specific to the Gulf of California region [17], were utilized for this process. Finally, the number of organisms from each identified species was standardized to density units (ind 100 m−3) following the standard protocols suggested by Kramer et al. [33].
2.4. Data Analyses
The hydrographic data were processed at various organizational levels. Initially, they were converted into a machine-readable format using the software and processing protocols provided by the manufacturer (SBE Data Processing v. 7.26.7). During this phase, several filters were applied to eliminate false data and spikes. Standard algorithms were then employed to derive conservative temperature and absolute salinity [34]. This processed data was subsequently utilized to calculate geostrophic velocities relative to 500 m, or to the bottom at shallower stations, following the standard protocols outlined by Pond and Pickard [35]. Finally, the hydrographic data were analyzed in vertical sections, which included conservative temperature, absolute salinity, density (sigma-t), geostrophic velocity, chlorophyll-a, and dissolved oxygen, along transects A-A’ and B-B’ (Figure 1).
Additionally, satellite data on sea surface temperature and chlorophyll-a were collected from the Moderate Resolution Imaging Spectroradiometer (MODIS-AQUA, NASA, Washington, DC, USA) on 3 July 2017. This data was processed according to the protocols described in Durán-Campos et al. [29], while maps of both variables were generated using MATLAB 2021b (MathWorks, Natick, MA, USA) routines.
2.5. Statistical Analyses
To investigate how hydrography affects the composition, distribution, and density of the chaetognaths identified in this study, we utilized several statistical methods and techniques. First, we employed non-metric multidimensional scaling (NMDS) to identify similarities among chaetognath communities during the sampling [36]. The NMDS was supported by an analysis of similarity (ANOSIM). Next, we conducted a principal component analysis (PCA) to assess the physical variables influencing the organisms at each sampling station [37]. Both the NMDS and PCA analyses were carried out using standard routines in PRIMER v6 software. Finally, we performed a canonical correspondence analysis (CCA) to explore the relationship between biological and environmental variables [38]. For the CCA, we created two data matrices: one containing environmental parameters obtained from the CTD data, temperature, salinity, and fluorescence and oxygen sensor readings, and geostrophic velocity components, while the other represented the density of each species identified at each sampling station. The CCA analysis was executed using CANOCO v4.5 software. Before conducting the analyses, we applied forward selection procedures to choose the most significant environmental variables, which resulted in the elimination of all nonsignificant variables (p > 0.05). In all cases, the data were transformed using a double square root to reduce variance [38].
3. Results
3.1. Hydrography
The vertical distribution of the hydrographic parameters was analyzed along transects A-A’ and B-B’ displayed in Figure 1.
Along transect A-A’, which includes stations 1 to 7 (Figure 2), strong stratification was observed in the upper layer, with the thermocline occurring at approximately 50 m depth. The isotherms and isopycnals exhibited a distinct dome-shaped uplift, reaching their maximum elevation at the center of the transect (station 5). This pattern is indicative of cyclonic circulation, which will be later confirmed by the horizontal distribution of sea surface temperature. In terms of temperature, surface readings in the eastern region ranged from 24 to 28 °C, with higher values (Figure 2A). For salinity, notably high values (35 g kg−1) were recorded at the surface in the eastern transect (Figure 2B). At station 6, near the dome, a low salinity core of 34.4 g kg−1 was identified. This core was linked to another low salinity area located in the eastern part of the transect, situated within the mainland zone of the study area.
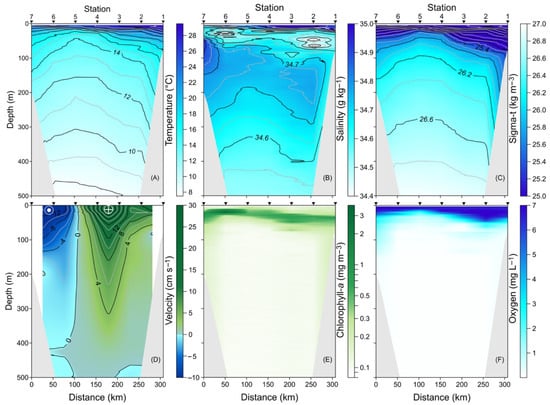
Figure 2.
Vertical distribution along the A-A’ transect in the upper 500 m layer of (A) conservative temperature (°C), (B) absolute salinity (g kg−1), (C) density (sigma-t, kg m−3), (D) meridional component of the geostrophic velocity (cm s−1), (E) chlorophyll-a (mg m−3), and (F) dissolved oxygen (mg L−1).
The vertical distribution of density showed a pattern consistent with temperature, indicating less dense waters (25 kg m−3) in the eastern part of the transect (Figure 2C). The meridional component of the geostrophic velocity with positive values between stations 1 and 5, reaching up to 30 cm s−1, which signifies a flow towards the Gulf (Figure 2D). This region of positive velocity extended throughout nearly the entire upper 500 m of the water column. In contrast, in the western section of the transect, from stations 5 to 7, negative geostrophic velocities were observed, indicating a flow exiting the Gulf and moving towards the Pacific Ocean. These observations support the initial inference of cyclonic circulation, characterized by the upward lifting of isotherms and isopycnals, which created a pronounced dome-shaped zone.
The vertical distribution of chlorophyll-a revealed surface layer concentrations of up to 3.5 mg m−3 (Figure 2E). A maximum concentration was identified at a depth of 30 m between stations 5 and 7, associated with the current towards the Pacific Ocean; these maximum chlorophyll-a values also exhibited a dome shape. Finally, the vertical distribution of dissolved oxygen showed high values (7 mg L−1) in the surface layer, with a decrease in oxygen levels as depth increased, reaching very low values (<1 mg L−1) indicative of hypoxia (Figure 2F). Additionally, the upward shift in the low dissolved oxygen levels is associated with the cyclonic circulation.
In the B-B’ transect, which spans stations 8 to 13, the maximum recorded temperature exceeded 28 °C along the mainland coast and was observed in a thicker layer (Figure 3A). The distribution of salinity (Figure 3B) and density (Figure 3C) exhibited a similar pattern to that of the first transect. Salinity reached up to 35 g kg−1, while density presented a value of 25.0 kg m−3 in the upper layer.
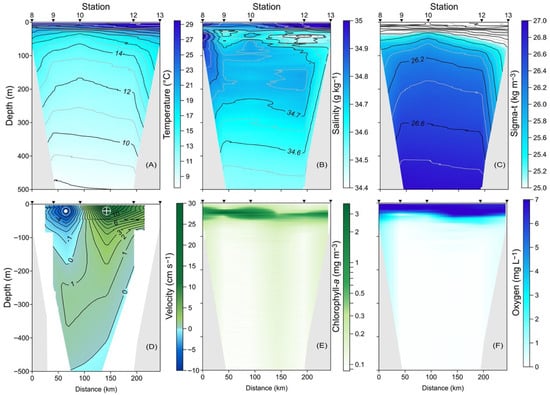
Figure 3.
Vertical distribution along the B-B′ transect in the upper 500 m layer of (A) conservative temperature (°C), (B) absolute salinity (g kg−1), (C) density (sigma-t, kg m−3), (D) meridional component of the geostrophic velocity (cm s−1), (E) chlorophyll-a (mg m−3), and (F) dissolved oxygen (mg L−1).
The meridional component of the geostrophic velocity indicated an inflow into the Gulf, with velocities reaching up to 17.5 cm s−1 in the eastern portion of the vertical section, starting at station 10 (Figure 3D). In contrast, to the west of station 10, from the surface down to approximately 180 m, an outflow was noted, characterized by velocities of up to 8.5 cm s−1, suggesting cyclonic circulation.
The distribution of chlorophyll-a showed surface concentrations of 0.2 mg m−3 (Figure 3E); however, a significant increase was observed at a depth of 50 m at station 13, reaching up to 2.0 mg m−3. Finally, the distribution of dissolved oxygen (Figure 3F) displayed a uniform pattern, with high concentrations at the surface ranging from 6 to 7 mg L−1, which decreased with increasing depth, ultimately reaching very low values that indicated hypoxic conditions. Both chlorophyll-a and dissolved oxygen showed a shift in the dome westward of station 10.
Satellite images of sea surface temperature and chlorophyll-a during the sampling period revealed some interesting features. Initially, warm water (>30 °C) was observed in the eastern portion of the study area, near the mainland coast. This warm water extended in a northward tongue, covering a considerable portion of the study area (Figure 4A). In contrast, a substantial decrease in temperature was noted in the western Gulf near the Baja California Peninsula, where temperatures dropped to 26 °C (Figure 4A). The observations align with Figure 2 and Figure 3, which also show warm surface water in the eastern part of the study area adjacent to the continent. Regarding chlorophyll-a levels, the image indicates generally low concentrations (<1 mg m−3) throughout the area. However, along both coasts at the boundary of the Pacific Ocean and the Gulf of California, the values tend to increase, reaching higher concentrations (>2 mg m−3) along the mainland coast (Figure 4B).
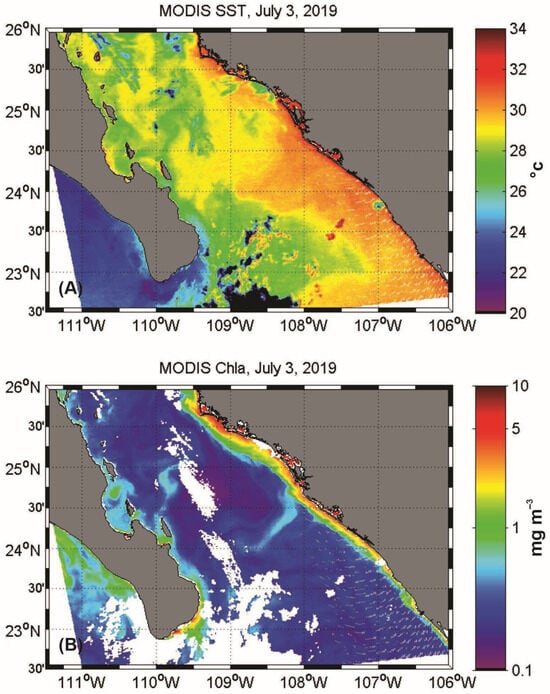
Figure 4.
Satellite images (MODIS-AQUA) 3 July 2019, during the sampling period: (A) sea surface temperature (°C) and (B) chlorophyll-a (mg m−3).
3.2. Chaetognaths Species Composition
A total of 15 species of chaetognaths were identified, categorized into three families: Sagittidae, Eukrohniidae and Krohnittidae. The species Flaccisagitta enflata (Grassi, 1881) exhibited the highest density, with 16,143 ind 100 m−3, followed by Serratosagitta serratodentata (Krohn, 1853) and Serratosagitta bierii (Alvariño, 1961) with 969 and 958 ind 100 m−3, respectively. In contrast, Aidanosagitta neglecta (Aida, 1897) had a significantly lower density of only 48 ind 100 m−3 (Table S1).
When analyzing the horizontal distribution of the species, clear differences were noted based on the geographical position of each station. Stations 7, 8, and 9, situated near the Baja California Peninsula, recorder the highest densities. In contrast, stations 1, 2, 12, and 13, located on the mainland, exhibited lower densities (Table S1). For the dominant species, F. enflata, higher density values were noted along the peninsular coast compared to the mainland coast (Figure 5 and Table S1).
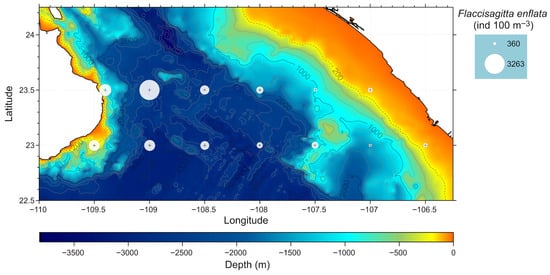
Figure 5.
Horizontal distribution of the dominant specie Flaccisagitta enflata.
The NMDS analysis conducted in our study indicated a relatively low stress level of 0.17, suggesting that the data is adequately represented. We observed a clustering of sampling stations based on the composition and density of organisms, which allowed us to identify four distinct regions: (1) a coastal region, (2) an oceanic region, (3) a region associated with cyclonic circulation, and 4) a region located at the periphery of the cyclonic circulation (Figure 6). The analysis also revealed groupings based on the geographical positions of the stations. For instance, stations 1 and 2 located at A-A’ transect off mainland coast, station 1 presents higher species number, stations 12 and 13, located along the B-B′ transect, exhibited a high degree of similarity. Meanwhile, stations 5, 7, 6, 9, and 10 showed a strong relationship with the core of the cyclonic circulation, forming a subgroup with a similarity of 65%. In contrast, the stations situated near the cyclonic circulation, specifically stations 8 and 11, formed a separate subgroup, while the oceanic stations (stations 3 and 4) created another subgroup. The ANOSIM test confirmed the separation of these groups (p = 0.001).
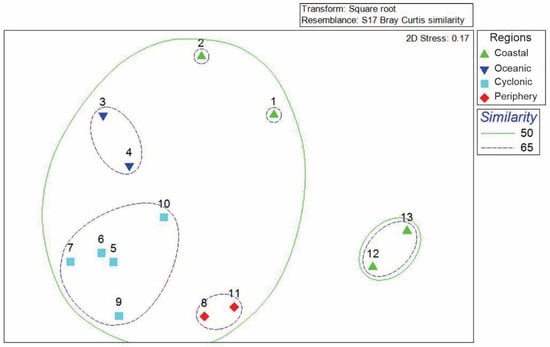
Figure 6.
Non-metric multidimensional scaling diagram.
The PCA analysis revealed that Component 1 accounted for 38.4% of the environmental variability, while Component 2 explained 25.1%, resulting in a total of 63.5%. For the first component, the environmental variables with the highest influence included the zonal component of the geostrophic velocity (U), dissolved oxygen, and temperature. Conversely, the second component was primarily influenced by chlorophyll-a, meridional component of geostrophic velocity (V), and temperature (Table S2).
The diagram generated (Figure 7) shows that temperature and dissolved oxygen are aligned in the same direction, indicating a relationship between them. This suggests that in areas with higher temperatures, there is also an increase in dissolved oxygen concentration. On the other hand, chlorophyll-a and salinity are oriented along axis but with opposite signs compared to temperature and oxygen. This implies that regions with high salinity and chlorophyll-a typically experience lower temperatures and oxygen levels. Additionally, along axis 2, the velocities in the U and V directions are positively related to chlorophyll-a and salinity, which independently affect other variables.
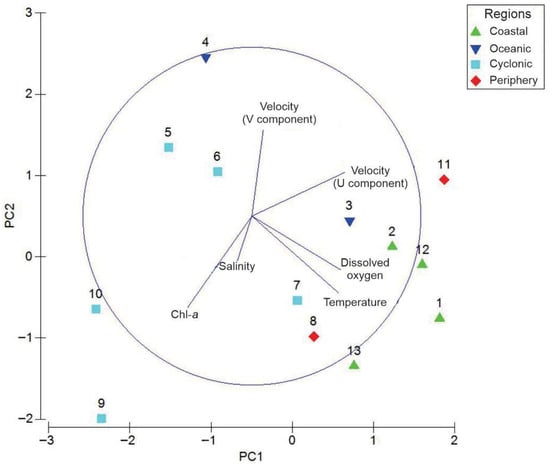
Figure 7.
Principal Component Analysis of the main environmental variables at the boundary of the Pacific Ocean and the Gulf of California, during early summer 2019.
The ordination diagram generated from the CCA shows that axis 1 explains 56% of the variance, while axis 2 accounts for 28.3%. Together, these axes explain 84.3% of the variability in the data (Figure 8).
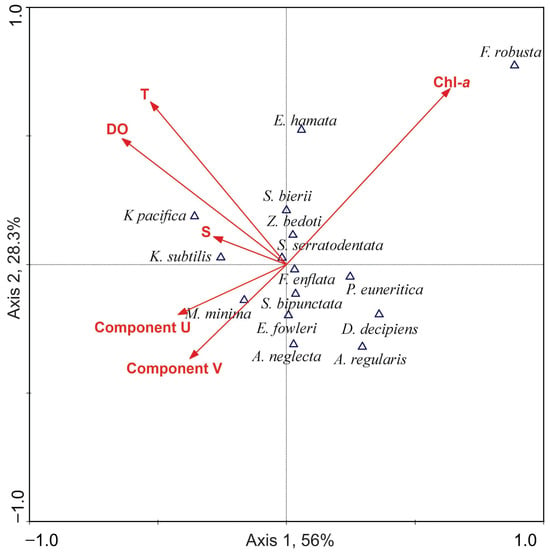
Figure 8.
CCA biplot with species density and environmental variables.
The species K. pacifica and K. subtilis exhibit a strong association with temperature, salinity, and dissolved oxygen levels but a weaker connection to chlorophyll-a concentrations and geostrophic velocities. In contrast, F. enflata, S. bipunctata, E. fowleri, and A. neglecta are located near the origin of the diagram, indicating that these species have a more general distribution and are not strongly dependent on any single environmental variable. Notably, F. enflata, due to its abundance and wide distribution, appears to be more influenced by moderate temperatures and the availability of dissolved oxygen and chlorophyll-a, with lower dependence on other factors.
For D. decipiens and A. regularis, the data suggest a relationship with geostrophic velocities, indicating that these ocean currents may affect their distribution. Lastly, F. robusta shows a clear association with high concentrations of chlorophyll-a, implying that the cyclonic circulation pattern may influence its distribution.
4. Discussion
The sampling strategy used in our study allowed us to identify and describe the chaetognath species at the boundary of the Pacific Ocean and the Gulf of California during early summer of 2019. The Gulf of California experiences notable seasonal variability in its surface circulation patterns and thermohaline structure. The exchange with the Pacific Ocean is crucial for circulation in this region; during summer, there is inflow near the mainland coast and outflow close to the peninsula’s coast, which results in the formation of a cyclonic circulation [28].
Our findings revealed a taxonomic list of 15 species, which aligns with the numbers reported in previous studies [17,18,19], confirming the dominance of F. enflata. This dominance has been noted for over fifty years in early research on this group within the Gulf of California [18,19].
The density of the 15 chaetognath species was higher along the peninsular coast compared to the mainland coast (Table S1). F. enflata, which is the dominant species, exhibited a similar distribution. This species is widely found in tropical and subtropical regions around the world [39]. It has been reported in high abundances, particularly in the Pacific Ocean off the coast of Mexican [40]. F. enflata is also known for its resilience to environmental changes [41], allowing it to adapt to fluctuating conditions.
Over the past 50 years, the Gulf has experienced various phenomena, including heat waves, the Blob, and El Niño events, suggesting that the chaetognath community’s structure may have changed during this period. However, it has been proposed that a series of hydrodynamic processes, such as upwelling events, eddies, and internal waves, help “protect” the Gulf from the negative effects of these events [26]. This could explain why F. enflata has remained dominant for the past five decades. Nonetheless, further studies are needed to confirm this hypothesis. Additionally, while specific information on the life-history plasticity of F. enflata is limited, research on other invertebrates indicates that environmental factors such as temperature and food availability likely influence its life history. As a pelagic invertebrate, F. enflata probably exhibits phenotypic plasticity in development, growth, and reproductive timing in response to these conditions, similar to other invertebrates [42].
Our results indicated differences in the horizontal distribution patterns of chaetognath species, with higher densities found in the Baja California peninsula region compared to the mainland. The difference in chaetognath density between the peninsular and mainland coasts, specifically at the boundary of the Pacific Ocean and the Gulf of California, can be attributed to several factors. One primary factor is the inflow of oligotrophic waters near the mainland coast, along with the uplift of clines near the peninsular coast. This uplift, combined with divergence driven by cyclonic circulation, facilitates the transport of nutrients into the euphotic zone and their subsequent distribution outwards. Azimuthal currents then carry these nutrients towards the peninsular coast, enhancing local productivity and resulting in a higher density of chaetognaths in that area.
Based on the hydrographic data we collected, we observed that temperatures in the mainland region exceeded 28 °C, while temperatures were lower in the peninsular region, where chlorophyll-a levels were higher (Figure 2, Figure 3 and Figure 4). These differences may explain the maximum chaetognath densities observed near the Baja California peninsula, suggesting that temperature and chlorophyll-a concentrations influence the structure of the chaetognath community. Similar conditions have been documented in various environments around the world, including the Atlantic Ocean [43], the East China Sea [44], the northwestern Persian Gulf [45], and the coasts of Chile [46]. In marine zooplankton populations, temperature is a critical factor as it affects metabolism, particularly respiration, excretion, and feeding behaviors of various species, including the chaetognaths [47].
Our results indicate that the peninsular region has higher concentrations of chlorophyll-a, an indicator of phytoplankton biomass, compared to the mainland region. It is important to note that chaetognaths are strictly carnivorous and do not consume phytoplankton [4]. However, the presence of phytoplankton supports herbivorous species, such as certain copepods, which are prey for chaetognaths [8]. This relationship may explain the maximum density of chaetognaths observed at stations near the Baja California peninsula.
The role of cyclonic circulation in planktonic organisms is well documented. This type of circulation causes the pumping of subsurface water, resulting in the formation of a cold-water dome at its center [48], similar to what we observed in our study. Typically, this cold-water dome is rich in nutrients, which fertilizes the euphotic zone. This process benefits phytoplankton and, in turn, supports the growth of zooplankton [49].
The relationship between cyclonic circulation and its impact on zooplankton populations has been recognized for several decades. One of the earliest observations occurred in the Gulf Stream, where the presence of a cold cyclonic circulation leads to an increase in biomass in the areas affected by the circulation, compared to surrounding areas [50]. Subsequent studies have confirmed that certain organisms benefit from the temperature changes caused by this type of circulation. This phenomenon that has been documented in various environments, including the Arabian Sea and the Black Sea [51], the Sargasso Sea [52], and the North Atlantic [53].
Despite numerous studies investigating the relationship between cyclonic circulation and zooplankton populations worldwide, significant gaps remain in the Southern Gulf of California. Some research has shown that cyclonic circulation in the Gulf’s coastal environments, such as Bay of La Paz, leads to a differential distribution of zooplankton. Herbivorous organisms tend to dominate the center of the eddy, while omnivorous organisms are more prevalent at its periphery [54]. Additionally, it has been observed that this circulation affects copepod populations, causing these organisms to aggregate in a “belt” around the periphery of the eddy [55].
There is even less research focused on the oceanic waters of the Southern Gulf of California. However, recent studies have begun to address this gap, revealing that the cyclonic circulation at the boundary between the Pacific Ocean and the Gulf of California influences the horizontal distribution of copepods in the region. Some groups of copepods are dominant in the center, while others are located at the periphery, depending on their feeding habits [56]. Nonetheless, further research is still needed to gain a more comprehensive understanding of this phenomenon [1].
5. Conclusions
After several years without formal studies on the chaetognath community in the Southern Gulf of California, we identified a species richness of 15, which is consistent with earlier taxonomic lists from the mid-20th century. Since then, there have been no significant changes in the community, despite several processes affecting the Gulf, such as heat waves and the merging of phenomena like The Blob, and El Niño. This stability may be due to the resilience of chaetognaths or to the numerous hydrodynamic processes in the Gulf that could “mask” the negative impacts of these large-scale events. However, it is essential to emphasize the importance of sustained, seasonal, and interannual monitoring to evaluate how chaetognath assemblages respond to climate anomalies, such as El Niño or marine heatwaves.
Additionally, with this work, we have updated the taxonomic nomenclature for this group to reflect recent changes in classification. However, there are still gaps to address, such as analyzing the seasonal variability in species richness concerning environmental changes. To achieve this, continuous monitoring programs should be implemented to enable multidisciplinary analyses. This approach will help develop more effective conservation strategies for marine resources, particularly in areas recognized for their extreme biodiversity, such as the Gulf of California.
Supplementary Materials
The following supporting information can be downloaded at: https://www.mdpi.com/article/10.3390/oceans6040076/s1, Table S1: Species richness and density values of Chaetognaths (ind 100 m−3) at the boundary of the Pacific Ocean and the Gulf of California during early summer of 2019; Table S2: Coefficients involved in each of the components.
Author Contributions
Conceptualization, M.P.d.L.R.-B., M.A.M.-G., E.C.-M., D.A.S.-d.-L. and E.D.-C.; methodology, M.P.d.L.R.-B., M.A.M.-G., E.D.-C. and E.C.-M.; software, M.P.d.L.R.-B., M.A.M.-G., E.C.-M., D.A.S.-d.-L., E.D.-C. and S.C.-O.; validation, M.P.d.L.R.-B., M.A.M.-G., E.C.-M., D.A.S.-d.-L., E.D.-C. and S.C.-O.; formal analysis, M.P.d.L.R.-B., M.A.M.-G., E.C.-M., D.A.S.-d.-L., E.D.-C. and S.C.-O.; investigation, M.P.d.L.R.-B., M.A.M.-G., E.C.-M., D.A.S.-d.-L., E.D.-C. and S.C.-O.; resources, M.A.M.-G., E.C.-M., D.A.S.-d.-L. and E.D.-C.; data curation, M.P.d.L.R.-B., M.A.M.-G., E.C.-M., D.A.S.-d.-L., E.D.-C. and S.C.-O.; writing—original draft preparation, M.P.d.L.R.-B., M.A.M.-G., E.C.-M., D.A.S.-d.-L., E.D.-C. and S.C.-O.; writing—review and editing, M.P.d.L.R.-B., M.A.M.-G., E.C.-M., D.A.S.-d.-L., E.D.-C. and S.C.-O.; supervision, M.P.d.L.R.-B., M.A.M.-G., E.C.-M., D.A.S.-d.-L., E.D.-C. and S.C.-O.; funding acquisition, M.A.M.-G., E.C.-M., D.A.S.-d.-L. and E.D.-C. All authors have read and agreed to the published version of the manuscript.
Funding
This study was financially supported by the Instituto de Ciencias del Mar y Limnología, Universidad Nacional Autónoma de México (UNAM) (grants 144, 145, 627). The ship time of the research cruise FIBGOC-I on board the R/V “El Puma” was funded by UNAM. SECIHTI, México sponsored M.P.d.L.R.-B during this study (CVU # 1273480), while Posgrado en Ciencias del Mar y Limnología provided her with additional support. DGAPA-PAPIIT-UNAM project (IG100421) provided partial support.
Data Availability Statement
The original contributions presented in this study are included in the article/Supplementary Material. Further inquiries can be directed to the corresponding author.
Acknowledgments
The authors appreciate the contributions of the captains and crew of the R/V “El Puma” as well as the students who participated in the research cruise. Jorge Castro improved the figures.
Conflicts of Interest
The authors declare no conflicts of interest.
References
- Uttieri, M.; Carotenuto, Y.; Di Capua, I.; Roncalli, V. Ecology of Marine Zooplankton. J. Mar. Sci. Eng. 2023, 11, 1875. [Google Scholar] [CrossRef]
- Le Quéré, C.; Harrison, S.P.; Colin, I.; Buitenhuis, E.T.; Aumont, O.; Bopp, L.; Claustre, H.; Cotrim, L.; Geider, R.; Giraud, X.; et al. Ecosystem dynamics based on plankton functional types for global ocean biogeochemistry models. Glob. Change Biol. 2005, 11, 2016–2040. [Google Scholar] [CrossRef]
- Pauly, D.; Liang, C.; Xian, W.; Chu, E.; Bailly, N. The sizes, growth and reproduction of arrow worms (Chaetognatha) in light of the Gill-Oxygen Limitation Theory (GOLT). J. Mar. Sci. Eng. 2021, 9, 1397. [Google Scholar] [CrossRef]
- Harzsch, S.; Müller, C.H.; Perez, Y. Chaetognatha. In Evolutionary Developmental Biology of Invertebrates 1; Wanninger, A., Ed.; Springer: Vienna, Austria, 2015; pp. 215–240. [Google Scholar]
- Stukel, M.R.; Irving, J.P.; Kelly, T.B.; Ohman, M.D.; Fender, C.K.; Yingling, N. Carbon sequestration by multiple biological pump pathways in a coastal upwelling biome. Nat. Comm. 2023, 14, 2024. [Google Scholar] [CrossRef]
- Thompson, G.A.; Molinari, G.N.; Ehrlich, M.E.; Daponte, M.C. Distribution, abundance, and reproductive stages of salps, doliolids, and chaetognaths in different water masses of the shelf and open ocean of the Southwestern Atlantic Ocean between 31° and 38° S. J. Mar. Syst. 2024, 246, 10400. [Google Scholar] [CrossRef]
- Borme, D.; Legovini, S.; de Olazabal, A.; Tirelli, V. Diet of Adult Sardine Sardina pilchardus in the Gulf of Trieste, Northern Adriatic Sea. J. Mar. Sci. Eng. 2022, 10, 1012. [Google Scholar] [CrossRef]
- Bone, Q.; Kapp, H.; Pierrot-Bults, A.C. The Biology of Chaetognaths; Oxford University Press: Oxford, UK, 1991; p. 184. [Google Scholar]
- Greer, A.T.; Cowen, R.K.; Guigand, C.M.; Hare, J.A.; Tang, D. The role of internal waves in larval fish interactions with potential predators and prey. Progr. Oceanogr. 2014, 127, 47–61. [Google Scholar] [CrossRef]
- Purushothaman, A.; Thomas, L.C.; Nandan, S.B.; Padmakumar, K.B. Influence of upwelling on the chaetognath community along the Southeastern Arabian Sea. Wetl. Ecol. Manag. 2021, 29, 731–743. [Google Scholar] [CrossRef]
- Nair, V.R.; Kusum, K.K.; Gireesh, R.; Nair, M. The distribution of the chaetognath population and its interaction with environmental characteristics in the Bay of Bengal and the Arabian Sea. Mar. Biol. Res. 2014, 11, 269–282. [Google Scholar] [CrossRef]
- Bisinicu, E.; Lazar, L.; Timofte, F. Dynamics of Zooplankton along the Romanian Black Sea Coastline: Temporal Variation, Community Structure, and Environmental Drivers. Diversity 2023, 15, 1024. [Google Scholar] [CrossRef]
- Bisinicu, E.; Harcota, G.-E.; Lazar, L. Interactions between environmental factors and the mesozooplankton community from the Romanian Black Sea waters. Turk. J. Zool. 2023, 47, 202–215. [Google Scholar] [CrossRef]
- Chen, Y.; Lin, S.; Wang, C.; Yang, J.; Sun, D. Response of size and trophic structure of zooplankton community to marine environmental conditions in the northern South China Sea in winter. J. Plankton Res. 2020, 42, 378–393. [Google Scholar] [CrossRef]
- Ge, R.; Chen, Y.; Chen, H.; Zhang, X.; Shi, J.; Li, H.; Zhuang, Y.; Liu, G. Effects of Yellow Sea Warm Current on zooplankton community composition and functional groups in winter. Mar. Environ. Res. 2024, 202, 106715. [Google Scholar] [CrossRef] [PubMed]
- Laguarda, A. Contribución al conocimiento de los quetognatos de Sinaloa. Anales Inst. Biol. Univ. Nac. Autón. Méx. 1965, 36, 215–228. [Google Scholar]
- Alvariño, A. Quetognatos epiplanctónicos del Mar de Cortés. Rev. Soc. Mex. Hist. Nat. 1963, 24, 97–204. [Google Scholar]
- Alvariño, A. Zoogeografía del Mar de Cortés. Chaetognatha, Siphonophora y Medusas. Anales Inst. Biol. Univ. Nac. Autón. Méx. 1969, 40, 11–54. [Google Scholar]
- Medina, M.D. Análisis Sobre la Distribución Horizontal de Organismos Planctónicos en El Sur Del Golfo de California, Con referencia Especial Al Phylum Chaetognatha. Master’s Thesis, Instituto Politécnico Nacional, Mexico City, Mexico, 1979; p. 76. [Google Scholar]
- Thuesen, E.V.; Haddock, S.H.D. Archeterokrohnia docrickettsae (Chaetognatha: Phragmophora: Heterokrohniidae), a new species of deep-sea arrow worm from the Gulf of California. Zootaxa 2013, 3717, 320–328. [Google Scholar] [CrossRef]
- Quiroz-Martínez, B.; Salas-de-León, D.A.; Gil-Zurita, A.; Monreal-Gómez, M.A.; Coria-Monter, E.; Durán-Campos, E. Latitudinal and archipelago effect on the composition, distribution, and abundance of zooplanktonic organisms in the Gulf of California. Oceanologia 2023, 65, 371–385. [Google Scholar] [CrossRef]
- Whitehead, D.A.; Jakes-Cota, U.; Pancaldi, F.; Galván-Magaña, F.; González-Armas, R. The influence of zooplankton communities on the feeding behavior of whale shark in Bahia de La Paz, Gulf of California. Rev. Mex. Biodiv. 2020, 91, e913054. [Google Scholar] [CrossRef]
- Lavaniegos, B.E.; González-Navarro, E. Grupos principales del zooplancton durante El Niño 1992–93 en el Canal de San Lorenzo, Golfo de California. Rev. Biol. Trop. 1999, 47 (Suppl. 1), 129–140. [Google Scholar]
- Lavaniegos-Espejo, B.E.; Lara-Lara, R. Zooplankton of the Gulf of California after the 1982–1983 EI Nino Event: Biomass Distribution and Abundance. Pac. Sci. 1990, 44, 297–310. [Google Scholar]
- Álvarez-Borrego, S. Phytoplankton biomass and production in the Gulf of California: A review. Bot. Mar. 2012, 55, 119–128. [Google Scholar] [CrossRef]
- Coria-Monter, E.; Monreal-Gómez, M.A.; Salas-de-León, D.A.; Durán-Campos, E. Impact of the “Godzilla El Niño” Event of 2015–2016 on Sea-Surface Temperature and Chlorophyll-a in the Southern Gulf of California, Mexico, as Evidenced by Satellite and In Situ Data. Pac. Sci. 2018, 72, 411–422. [Google Scholar] [CrossRef]
- Sherman, K.; Hempel, G. Perspectives on regional seas and the large marine ecosystem approach. In The UNEP Large Marine Ecosystem Report: A Perspective on Changing Conditions in LMEs of the World’s Regional Seas; Sherman, K., Hempel, G., Eds.; United Nations Environment Programme: Nairobi, Kenia, 2009; pp. 3–22. [Google Scholar]
- Lavín, M.F.; Castro, R.; Beier, E.; Godínez, V.M.; Amador, A.; Guest, P. SST, thermohaline structure, and circulation in the southern Gulf of California in June 2004 during the North American Monsoon Experiment. J. Geophys. Res. 2009, 114, 1–22. [Google Scholar] [CrossRef]
- Durán-Campos, E.; Salas-de-Léon, D.A.; Coria-Monter, E.; Monreal-Gómez, M.A.; Aldeco-Ramírez, J.; Quiroz-Martínez, B. ENSO effects in the southern gulf of California estimated from satellite data. Cont. Shelf Res. 2023, 266, 105084. [Google Scholar] [CrossRef]
- Alvariño, A. Two new chaetognaths from the Pacific. Pac. Sci. 1961, 15, 67–77. [Google Scholar]
- Boltovskoy, D. South Atlantic Zooplankton; Publicaciones especiales del INIDEP: Mar del Plata, Argentina, 1999; p. 1075. [Google Scholar]
- Tokioka, T. The taxonomical outline of Chaetognatha. Publ. Seto Mar. Biol. Lab. 1965, 12, 335–357. [Google Scholar] [CrossRef]
- Kramer, D.; Kalin, M.J.; Stevens, E.G.; Thrailkill, J.R.; Zweifel, J.R. Collecting and Processing Data on Fish Eggs and Larvae in the California Current; NOAA Technical Report NMFS 370; NMFS: Seattle, WA, USA, 1972; pp. 1–38. [Google Scholar]
- IOC; SCOR; IAPSO. The International Thermodynamic Equation of Seawater 2010. Calculation and Use of Thermodynamic Properties; Intergovernmental Oceanographic Commission Manuals and Guides No. 56; UNESCO: Paris, France, 2010; p. 196. [Google Scholar]
- Pond, S.; Pickard, G.L. Introductory Dynamical Oceanography; Pergamon Press: Oxford, UK, 1995; p. 329. [Google Scholar]
- Dexter, E.; Rollwagen-Bollens, G.; Bollens, S.M. The trouble with stress: A flexible method for the evaluation of nonmetric multidimensional scaling. Limnol. Oceanogr. Methods 2018, 16, 434–443. [Google Scholar] [CrossRef]
- Clarke, K.R. Non-parametric multivariate analysis of changes in community structure. Austral. Ecol. 1993, 18, 117–143. [Google Scholar] [CrossRef]
- ter Braak, C.J.F. Canonical correspondence analysis: A new eigenvector technique for multivariate direct gradient analysis. Ecology 1986, 67, 1167–1179. [Google Scholar] [CrossRef]
- Noblezada, M.M.P.; Campos, W.L. Spatial distribution of chaetognaths off the northern Bicol Shelf, Philippines (Pacific coast). ICES J. Mar. Sci. 2008, 65, 484–494. [Google Scholar] [CrossRef]
- Cota-Meza, M.S.; Fernández-Alamo, M.A.; Funes-Rodríguez, R. Abundance of Flaccisagitta enflata and analysis of Chaetognatha community in a circadian cycle in Bahía Magdalena lagoon system Baja California Sur, Mexico. Hidrobiológica 2015, 25, 417–426. [Google Scholar]
- Lie, A.A.; Tse, P.; Wong, C.K. Diel vertical migration and feeding of three species of chaetognaths (Flaccisagitta enflata, Aidanosagitta delicata and Aidanosagitta neglecta) in two shallow, subtropical bays in Hong Kong. J. Plank. Res. 2012, 34, 670–684. [Google Scholar] [CrossRef]
- Ali Panhwar, W.; Bano Mustafa, S. Phenotypic plasticity in grasshoppers and locusts: A review. AJSET 2022, 1, 38–51. [Google Scholar] [CrossRef] [PubMed]
- Stone, S.E.; Stone, J.P. Diversity, seasonal abundance, and environmental drivers of chaetognath populations in North Inlet Estuary, South Carolina, USA. Ecol. Evol. 2022, 13, e10151. [Google Scholar] [CrossRef] [PubMed]
- Zhang, D.; Xu, Z.-L. Estimating optimal salinity and temperature of chaetognaths. J. Mar. Biol. Assoc. UK 2012, 92, 1399–1407. [Google Scholar] [CrossRef]
- Haghi, M.; Savari, A.; Madiseh, S.D.; Zakeri, M. Abundance of pelagic chaetognaths in northwestern Persian Gulf. Plankton Benthos Res. 2010, 5, 44–48. [Google Scholar] [CrossRef]
- Ulloa, R.; Palma, S.; Silva, N. Bathymetric distribution of chaetognaths and their association with water masses off the coast of Valparaíso, Chile. Deep Sea Res. I 2000, 47, 2009–2027. [Google Scholar] [CrossRef]
- Seibel, B.A.; Dymowska, A.; Rosenthal, J. Metabolic temperature compensation and coevolution of locomotory performance in pteropod molluscs. Integr. Comp. Biol. 2007, 47, 880–891. [Google Scholar] [CrossRef]
- McGillicuddy, D.J., Jr. Mechanisms of physical-biological-biogeochemical interaction at the Oceanic Mesoscale. Ann. Rev. Mar. Sci. 2016, 8, 125–159. [Google Scholar] [CrossRef]
- Coria-Monter, E.; Monreal-Gómez, M.A.; Salas-de-León, D.A.; Durán-Campos, E.; Merino-Ibarra, M. Wind driven nutrient and subsurface chlorophyll-a enhancements in the Bay of La Paz, Gulf of California. Estuar. Coast. Shelf Sci. 2017, 196, 290–300. [Google Scholar] [CrossRef]
- Wiebe, P.; Hulburt, E.M.; Carpenter, E.J.; Jahn, A.E.; Knapp III, G.P.; Boyd, S.H.; Ortner, P.B.; Cox, J.L. Gulf Stream cold core rings: Large-scale interaction sites for open ocean plankton communities. Deep-Sea Res. Oceanogr. Abstr. 1976, 23, 695–710. [Google Scholar] [CrossRef]
- Piontkovski, S.A.; Williams, R.; Peterson, W.; Kosnirev, V.K. Relationship between oceanic mesozooplankton and energy of eddy fields. Mar. Ecol. Prog. Ser. 1995, 128, 35–41. [Google Scholar] [CrossRef][Green Version]
- Eden, B.R.; Steinberg, D.K.; Goldthwait, S.A.; McGillicuddy, D.J. Zooplankton community structure in a cyclonic and mode-water eddy in the Sargasso Sea. Deep-Sea Res. I 2009, 56, 1757–1776. [Google Scholar] [CrossRef]
- Hernández-León, S.; Almeída, C.; Gómez, M.; Torres, S.; Montero, I.; Portillo- Hahnefeld, A. Zooplankton biomass and indices of feeding and metabolism in island-generated eddies around Gran Canarias. J. Mar. Syst. 2001, 30, 51–66. [Google Scholar] [CrossRef]
- Durán-Campos, E.; Salas de León, D.A.; Monreal-Gómez, M.A.; Aldeco-Ramírez, J.; Coria- Monter, E. Differential zooplankton aggregation due to relative vorticity in a semi-enclosed bay. Estuar. Coast Shelf Sci. 2015, 164, 10–18. [Google Scholar] [CrossRef]
- Rocha-Díaz, F.A.; Monreal-Gómez, M.A.; Coria-Monter, E.; Salas-de-León, D.A.; Durán-Campos, E.; Merino-Ibarra, M. Copepod abundance distribution in relation to a cyclonic eddy in a coastal environment in the southern Gulf of California. Cont. Shelf Res. 2021, 222, 104436. [Google Scholar] [CrossRef]
- Rocha-Díaz, F.A.; Monreal- Gómez, M.A.; Coria-Monter, E.; Salas- de-León, D.A.; Durán-Campos, E.; Cházaro-Olvera, S. The Influence of Summer Cyclonic Circulation in the Southern Gulf of California on Planktonic Copepod Communities. J. Mar. Sci. Eng. 2025, 13, 1394. [Google Scholar] [CrossRef]
Disclaimer/Publisher’s Note: The statements, opinions and data contained in all publications are solely those of the individual author(s) and contributor(s) and not of MDPI and/or the editor(s). MDPI and/or the editor(s) disclaim responsibility for any injury to people or property resulting from any ideas, methods, instructions or products referred to in the content. |
© 2025 by the authors. Licensee MDPI, Basel, Switzerland. This article is an open access article distributed under the terms and conditions of the Creative Commons Attribution (CC BY) license (https://creativecommons.org/licenses/by/4.0/).