Abstract
Urbanisation and the increasing concentration of populations in cities present significant challenges for achieving sustainable mobility and advancing the energy transition. Private vehicles, particularly those powered by internal combustion engines, remain the primary contributors to urban air pollution and greenhouse gas emissions. This situation has prompted the European Union to accelerate transport decarbonisation through comprehensive policy frameworks, notably the “Fit for 55” package, which aims to reduce net greenhouse gas emissions by 55% by 2030. These measures underscore the urgency of shifting towards low-emission transport modes. In this context, electric vehicles (EVs) play a key role in supporting Sustainable Development Goal 7 by promoting cleaner and more efficient transport solutions, and Sustainable Development Goal 11, aimed at creating more sustainable and liveable cities. Despite growing policy attention, the adoption of EVs remains constrained by users’ concerns regarding purchase costs, driving range, and the availability of charging infrastructure, as shown by the findings of this study. In this context, this study explores the determinants of EV adoption in Italy by employing a combined methodological approach that integrates a stated preference (SP) survey with discrete choice modelling. The analysis aims to quantify the influence of economic, technical, and infrastructural factors on users’ willingness to switch to EVs, providing insights for policymakers and industry stakeholders to design effective strategies for accelerating the transition toward the sustainable mobility.
1. Introduction
The rapid pace of urbanisation presents opportunities and challenges for cities around the world. As urban areas expand, effective organisation and planning are increasingly critical to ensure the sustainability of transportation systems. The United Nations projects that, by 2050, 68% of the global population will reside in urban areas, up from just 30% in 1950 [1]. The ongoing transformation of urban transport systems is associated with increasing concerns regarding mobility efficiency, air pollution, and the overall environmental footprint of transportation networks. Private cars, mostly powered by internal combustion engines, represent a major source of air pollutants and greenhouse gas emissions, emitting harmful substances such as carbon monoxide (CO), carbon dioxide (CO2), and ammonia (NH3) [2], with detrimental effects on human health and the environment. In response, governments and international organisations have increasingly promoted a transition toward cleaner and more sustainable modes of transportation. The European Commission has recognised the urgency of this transition and has outlined ambitious goals in the initiative “Fit for 55 in 2030”. One of the core objectives of this initiative is to achieve a 55% reduction in pollutant and greenhouse gas emissions by 2030 (compared to 1990 levels) and to phase out internal combustion engine vehicles by 2035. Such measures play a pivotal role in decarbonising the transport sector and promoting sustainable urban development. Electric vehicles (EVs) play a key-role in this transition. They directly support Sustainable Development Goal 7 (Affordable and Clean Energy), which aims to provide access to reliable, modern, and sustainable energy, and Sustainable Development Goal 11 (Sustainable Cities and Communities), which promotes the creation of more sustainable and liveable cities. EVs contribute to these goals by reducing dependence on fossil fuels, improving energy efficiency, and enabling the integration of renewable energy sources into the power grid through smart charging and vehicle-to-grid technologies [3]. Therefore, promoting EV adoption is both a technological advancement and a key strategy for climate mitigation and sustainable urban mobility.
Despite the clear environmental benefits, the adoption of EVs has been gradual and a number of factors influence consumers’ decisions to shift from conventional vehicles to electric alternatives [4,5]. Understanding these factors is essential to develop effective strategies and policies that can encourage faster and greater adoption of electric mobility. This study aims to identify and analyse the key factors influencing users’ willingness to adopt EVs in urban environments. The findings of this research contribute to the growing body of knowledge on sustainable urban transportation and provide valuable information for policymakers, urban planners, and businesses seeking to accelerate the transition to electric mobility. Starting from an overview of the state of the art (Section 2), the rest of the paper is organised as follows. Section 3 introduces the methodology for determining alternatives and attributes, in order to carry out survey scenarios, useful for the design of the questionnaire (including the stated preference experiments). Section 4 presents the results of the application of the methodology to the Italian context. Finally, the conclusions and the road ahead are drawn in Section 5.
2. Literature Review
The transition to EVs has accelerated in Europe, with a significant increase in the market share of EVs. In the first half of 2023, the European car market grew by 17.9%, reaching 5.4 million registrations, although still below pre-pandemic levels. In June 2023, the market share of EVs reached 15.1%, surpassing that of diesel cars for the first time, which accounted for 13.4% [6]. However, while countries such as Germany, France, and the Netherlands have experienced a substantial increase in EV registrations, Italy continues to lag behind. Despite a 29.63% rise in EV registrations during the first seven months of 2023, the market share of EVs in Italy remained significantly below the European average, i.e., 3.42% in July compared to 15.1% across the EU. The Netherlands, in particular, reached an EV market share of 28.9%. In Italy, the adoption of hybrid electric vehicles (HVs and mild HVs) is considerably more widespread than that of fully EVs. This is likely due to the lower cost of hybrid models and their lower dependence on charging infrastructure, which is still insufficient in the country [7]. As said, despite the growth in EV registrations, the overall pace of adoption in Italy remains slower than in other European countries. This highlights the need for more investment in charging infrastructure and stronger incentives to promote the large-scale adoption of EVs [8]. The growing interest in e-mobility is driven by multiple factors, including the urgent need to mitigate climate change, rising oil prices, and continuous technological advancements. Nevertheless, the transition toward e-mobility still faces significant challenges [9]. Even with technological improvements, such as advances in battery efficiency and energy management systems, the large-scale adoption of EVs requires coordinated efforts in policy, infrastructure and consumer awareness [10]. Therefore, the transition to electric mobility represents a critical milestone in reducing emissions within the transport sector and in addressing the pressing challenges posed by climate change [11]. Despite significant progress, particularly in European countries, the transition to fully sustainable mobility requires overcoming economic, technical, and infrastructural obstacles. A number of recent studies have examined the different variables that influence the adoption of EVs, using advanced methodologies to analyse consumer preferences and purchase intentions. These approaches explored the psychological, socioeconomic and political factors that determine the propensity to buy EVs, highlighting the key-role of information, individual perceptions and socio-political contexts. A notable example of these approaches is a study carried out in China [11], which examined how the total cost of ownership (TCO) and fuel expenses over a five-year period influence the purchase intentions of EVs among young consumers (under 40 years old). The researchers used a rank-ordered logit model, which is proved to be more suitable than conventional multinomial logit, as it allowed them to take full advantage of the ordinal nature of the options chosen by the participants, which included combustion vehicles (CVs), battery electric vehicles (BEVs) and plug-in hybrid vehicles (PHEVs). The results highlighted that information on the total cost of ownership has a significant positive effect on purchase intent, suggesting that consumers are sensitive to economic aspects in their choice of an EV. In addition, it was found that socioeconomic factors such as sex and education level influenced preferences, with a greater impact on women and consumers with a higher level of education [12]. A recent study examined how message framing, reference points, and political affiliation influence the perceived value of social media information and intentions to purchase EVs. Based on an experiment involving 506 participants, the researchers found that social media posts emphasising personal benefits of EV adoption were preferred over those highlighting environmental benefits. Although framing and political affiliation affected the perceived value of information, these factors did not significantly influence purchase intentions. The effect of framing was most evident among participants with a democratic political orientation, suggesting that purchase intentions may be shaped by political context and message presentation [11]. Other studies have shown that positive attitudes, perception of behavioural control, subjective norms, moral norms, and price value have a significant positive impact on EV adoption intentions. In particular, the perception of behavioural control, i.e., the belief that you can buy an electric vehicle without difficulty, was one of the most relevant aspects in the adoption process. Results have been obtained by Pamidimukkala et al. [13], using planned behaviour theory (TPB), integrated with factors such as price value and moral norms, to analyse the adoption intentions of electric vehicles. The data were collected through a survey involving 733 participants, and the analysis was carried out using a structural equation (SEM) model. Another study [14] that applied TPB in a different context explored the acceptance of EV sharing. The researchers used a structural equation (SEM) model to examine how factors such as perceived control, subjective norms and the influence of public policies impact the acceptance of EV sharing. Data were collected in Beijing through questionnaires administered to travellers, and the findings indicate that perceived behavioural control emerged as the most influential factor in shaping acceptance of electric vehicle sharing services. In addition, the influence of public policies, such as incentive programmes and the creation of charging infrastructure, has been instrumental in fostering positive attitudes towards EV sharing. Shahrier et al. [15], starting from the analysis of the impact of EV adoption on road networks and greenhouse gas emissions and using an innovative approach that combines the ITLE (Integrated Transport Land-use and Energy) model with traffic and emissions simulators, revealed a significant reduction in greenhouse gas emissions, with a 18.5% reduction in emissions in the morning peak of 2027 and 31.8% in 2032. In addition, the results find that younger generations, higher incomes, and full-time workers were more likely to adopt EVs, with an expected adoption rate of 31% by 2032. By analysing consumer behaviour and using a hybrid model that integrates the analytic hierarchy process (AHP) with the hybrid binomial logit, it is revealed that attitudes towards the environment and the perception of disadvantages are the main factors influencing the decision to buy an electric vehicle [12]. In particular, a positive attitude towards the environment favours the purchase, while the perception of disadvantages, such as limited autonomy, has a negative impact on the choice. In addition, the need to develop adequate charging infrastructure to meet the growing demand for charging stations, especially in workplaces and educational institutions, is also emphasised [9,16]. Another factor that could influence the choice is the role of status and reputation in consumer preferences for EVs. Using a logit model, the researchers analysed over 2000 responses to identify the socio-demographic factors and external variables that influence EV adoption. The results suggested that status-motivated consumers are more likely to buy an EV, especially when the price is higher than traditional vehicles. This study emphasised the importance of the symbolic value of EVs [4]. Short-term learning and experiences also influence EV preferences. In Ireland, using a self-choice experiment, researchers found that direct experiences with EVs, such as a short test drive of the vehicle, significantly increase the willingness to buy EVs [17].
In general, these studies emphasise that intentions to adopt electric vehicles are shaped by a combination of economic, psychological, and socio-cultural factors. Key determinants include cost-related information, supportive public policies, direct user experience, and motivations linked to social status and reputation. Despite these efforts, several research gaps also persist. Few studies simultaneously examine economic and socio-demographic variables within a probabilistic-behavioural framework, and comparative evidence across traditional, hybrid, and fully electric vehicles remains limited. Moreover, most analyses overlook variations among age groups and income levels, which can significantly influence willingness to adopt. This study addresses these gaps by integrating data from a stated preference (SP) survey with a multinomial logit model to evaluate the impact of technical, economic, and behavioural factors on EV adoption in Italy. This approach enables researchers and planners to capture preference heterogeneity across demographic segments, thereby providing more representative insights and supporting the design of public policies tailored to the specific needs of different user groups.
3. Methodology
To investigate how consumers are influenced in the purchase of EVs, a methodology has been developed aiming to obtain an overall view of the factors that determine the adoption of EVs and to provide useful indications to promote their faster and more efficient deployment. The methodology, developed and illustrated in Figure 1, consists of the following steps:
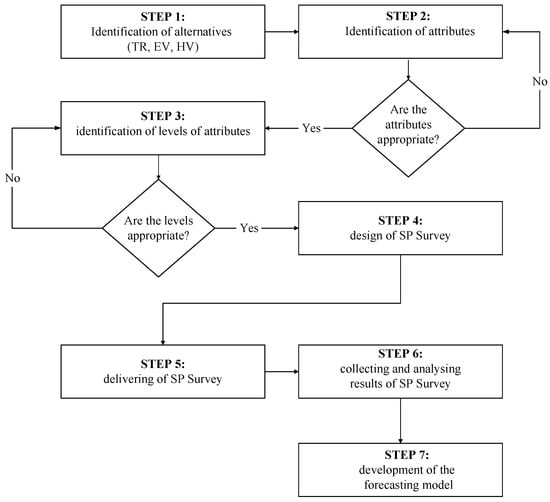
Figure 1.
The proposed methodology.
- identification of alternatives,
- identification of attributes that drive user’ choices,
- identification of levels of attributes,
- design of the stated preference (SP) survey,
- delivering of SP survey,
- collecting and analysing results of SP survey,
- development of the forecasting model, which consists of specification, calibration, and validation.
3.1. Identification of Alternatives
To identify vehicle alternatives, it is useful to follow a structured process based on the analysis of emerging trends in the automotive sector and consumer preferences. The literature review and market research suggest that, in the near future, the main types of vehicles will be traditional (TR), electric (EVs), and hybrid vehicles (HVs). Fuel cell electric vehicles (FCEVs) were excluded from the analysis due to their negligible market penetration in Italy and Europe, and the lack of adequate hydrogen refuelling infrastructure, which currently prevents them from being a viable option for urban users, as highlighted by recent studies [18,19,20]. Furthermore, hydrogen production entails significant ecological drawbacks, as it is highly energy-intensive and requires transportation from production sites to refuelling stations, adding environmental and logistical burdens. Additionally, fuel cell systems remain costly, primarily due to the use of platinum as a catalyst [21,22].
3.2. Identification of Attributes
Identifying attributes that influence user’ decisions when purchasing a vehicle is a crucial step in understanding consumer preferences, particularly for EVs. Key attributes are typically identified through a combination of market research, surveys, expert opinions, and an analysis of consumer’s behaviour. The selection of attributes needs to be based on a thorough literature review and practical relevance in influencing users’ decisions when purchasing a vehicle. For example, the purchase cost should be included as the main economic factor that influenced the holding decision [8]. Operating costs reflect annual expenses such as fuel and maintenance, which are decisive for cost-conscious consumers [12]. The driving range and charging time capture the technological limitations of EVs [9], while the distance to the nearest charging station represents the accessibility to the infrastructure, a known barrier to adoption [16]. Finally, the environmental impact (measured in gCO2/km) accounts for the ecological awareness of users and the perceived sustainability of the vehicle [5,23]. Each selected factor should be therefore selected to represent one of the key decision dimensions, economic, technical, or environmental.
3.3. Identification of Level of Attributes
Once the key attributes have been identified, the next step is to define the specific levels of each attribute. The levels represent different variations or values that each attribute can take within the context of a choice model. These levels are critical because they help to model real-world decisions and simulate how changes in these attributes affect consumer’s choices. The determination of levels is often grounded in both existing market data and insights from the literature. These levels can be defined in absolute terms, for example, specific travel times and costs, or obtained as percentage variations with respect to the values of attributes for a real context known to the decision-maker [24]. Researchers use methods such as discrete choice experiments (DCE) or conjoint analysis to determine the optimal set of levels for each attribute. The resulting data help identify which levels are most likely to drive purchasing decisions.
3.4. Design of Stated Preference Survey
In this phase, a survey will be designed to collect user’s preferences on the identified attributes. The SP questionnaire is structured to simulate the user’s choices in what if scenarios, where different attributes are combined to assess individual preferences. Designing an SP survey involves carefully defining various elements in which the analyst’s experience and sensitivity play a crucial role [24]. Below the main operational guidelines derived from extensive research and years of practical experimentation are briefly summarised:
- realism of scenarios; choice scenarios should be based on direct experiences of the decision-maker, such as scenarios from a revealed preference (RP) interview carried out on a real context; this reduces distortions and improves the quality of the results;
- preference for “choice” over “ranking” and “rating”; better results are achieved when the decision-maker is asked to choose between options, rather than ranking or evaluating;
- simplification of scenarios, reduction in the number of attributes, and alternative options; scenarios with few attributes tend to produce clearer and more reliable results;
- limiting the number of scenarios per decision-maker to avoid fatigue and reduced quality of results; each decision-maker should be exposed to no more than 9–10 scenarios;
- scenario selection and factorial design; the number of theoretical scenarios can be very large, especially when attributes have multiple levels; the full factorial drawing technique explores all possible combinations, but methods are used to select a representative subset to reduce the number of scenarios; for multilevel factors, these can be decomposed into two-level factors with compatibility constraints.
3.5. Delivery of SP Survey
After design, the survey is distributed to the target participants (e.g., urban users, potential buyers of EVs) through appropriate modalities (e.g., online, face-to-face interviews). The data collected will make it possible to analyse the preferences and factors that influence the users’ choices.
3.6. Collecting and Analysing Results of SP Survey
Once data have been collected, the data is analysed to identify the most relevant factors driving users to adopt EVs, such as the importance of price, range, or availability of charging infrastructure. The subsequent analysis aims to examine the differences between the groups of various users, for example, based on sociodemographic characteristics.
3.7. Development of the Forecasting Model
The results of the SP survey can be used to calibrate demand models based on decision-makers’ choices, with estimation methods similar to those used in RP surveys. Each scenario presented to decision-makers is an observation on choice behaviour, and the SP sample size is determined by the number of scenarios and decision-makers involved. The attributes of each alternative in a scenario are associated with the element chosen by the decision-maker (or with the greatest attractiveness in ranking or rating surveys). If it is assumed that the observations are independent, it is possible to formulate likelihood and logarithmic likelihood functions for the SP sample, extending the estimation techniques to SP models [24,25].
4. Application to a Real Case Study
As mentioned, this study aims to explore the key factors that influence the users’ willingness to use EVs in urban environments. To understand how consumers choose to purchase/hold EVs, the methodology described in the earlier section has been implemented in the Italian context. The goal is to provide valuable information that can help to facilitate the faster and more effective deployment of EVs.
4.1. Identification of Alternatives and Attributes
As earlier discussed, the proposed alternatives are traditional vehicles (TR), electric vehicles (EVs), hybrid vehicles (HVs), while the considered attributes selected to characterise the choice alternative are the following (Table 1):

Table 1.
Selected attributes for vehicle adoption/holding choice.
- charging time up to 80% of the battery, expressed in minutes; it only concerns EVs, since hybrid and internal combustion vehicles (ICVs) do not need periodic charging;
- distance to the charging station, this factor also affects only EVs;
- driving range, expressed in km; it only affects EVs, as for combustion vehicles it is not a relevant factor since refuelling takes place quickly, while recharging an EV can take hours;
- environmental impact, measured in gCO2/km; it indicates the average CO2 emissions per kilometre travelled throughout the life cycle of the vehicle;
- the purchase cost that represents the purchase price of a new vehicle, including any incentives;
- operating costs, expressed in euros per year; they include expenses for maintenance, fuel, parking, and other ongoing costs related to the use of the vehicle.
4.2. Identification of Levels of Attributes
After identifying the attributes, it was necessary to establish the levels of variation for each factor so that each factor could have different values in different scenarios. In each scenario, each factor has a specific value for each type of vehicle. For example, based on a desk analysis on vehicle prices, the purchase cost of a mid-size economy car for the considered type of vehicles has been assumed to be 35,000 € for the EV, 27,500 € for the hybrid, and 25,000 € for the TR. The other identified attributes of the EVs and HVs have three levels for each attribute, which include: absolute numerical values for charging time and range; different types of location for the charging station; percentage changes compared to the internal combustion vehicle in terms of environmental impact, purchase cost and operating costs. For example, as shown in Table 2, the purchase cost of the electric vehicle can be 10%, 25%, or 40% higher than that of the internal combustion vehicle, with values ranging from 27,500 € to 35,000 €.
Table 2.
Levels defined for each combination of factors and vehicles.
4.3. Design and Delivery of the SP Survey
Ngene 1.4 © software was used to build the choice scenarios, which are based on comparing different characteristics (levels and attributes) of alternatives. Based on 3 alternatives and 6 attributes with 1–3 levels, 18 scenarios were created and divided into 2 blocks, as in the example shown in Figure 2. To develop the scenarios, a reduced design space was selected from the full factorial design by applying a fractional factorial design approach. This approach was adopted because implementing the full factorial design was impractical given the large number of attributes and levels involved.
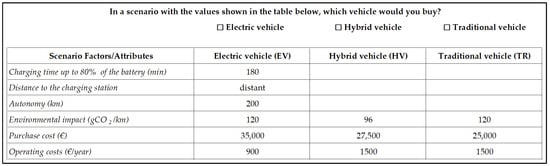
Figure 2.
Example of a proposed choice scenario.
The questionnaire used for this study is described below in detail. Its main objective, as said, is to investigate users’ willingness to purchase EVs. The questionnaire consists of two main sections:
- general questions section; this section collects socio-demographic information and data about respondents’ mobility habits and vehicle ownership; it includes questions regarding age, sex, occupation, education level, income, household composition, and car use patterns (e.g., daily and annual distance travelled, type of vehicle and engine, and purposes of use); additionally, it explores respondents’ attitudes toward electric mobility, such as the availability of charging stations nearby, willingness to purchase an EV, acceptable charging times, and the importance attributed to different vehicle attributes when purchasing a car (e.g., purchase cost, fuel consumption, operating costs, emissions, aesthetics, resale value, and purchase incentives); the section also includes questions about respondents’ awareness and potential participation in vehicle-to-grid (V2G) energy services, asking about their willingness to sell energy from the vehicle battery, minimum acceptable state of charge after energy transfer, and preferred selling price compared to purchase cost;
- stated preference (SP) section; this section presents nine hypothetical scenarios, each describing the three identified vehicle alternatives (electric, hybrid, and internal combustion engine); respondents are asked to select their preferred vehicle in each scenario; the alternatives are characterised by specific attributes (or factors), whose values vary across the scenarios; the considered factors are those specified in the section Identification of alternatives and attributes; these attributes allow analyst the estimation of the relative importance of each factor in simulating the respondents’ vehicle choice.
Finally, the questionnaire includes a consent section, in which respondents can indicate whether they wish to receive a summary report of the study findings and whether they agree to be contacted for follow-up purposes, providing their email address. The questionnaire was launched in September–October 2024 and January–April 2025 in Italy, collecting 494 useful answers equally distributed between the two blocks.
4.4. Collecting and Analysing Results of SP Survey
The sample interviewed is made up of 56.07% men and 43.93% women, with an age ranging from 19 to 75 years, with about 75% younger than 55 years old. Most users are students (33.4%) and permanent workers (28.3%) followed by fixed-term workers (8.7%) and retired ones (8.3%). Around 34.8% of participants have an income of less than 10,000 € per year, with only 3.4% earning more than 50,000 €. In the questionnaire, they were asked to assign weight to certain factors, on a scale of 1 to 5. This part of the work allowed a profile of preferences for each user to be outlined. The results indicate that the cost of purchasing a vehicle is the most important attribute for users. In fact, the 48.3% of the participants attributed it the maximum importance, but also a further 35.6% consider it very relevant, for a total of 83.9%. This represents one of the main barriers to the widespread adoption of EVs, as this category of vehicles typically comes with a higher purchase price compared to others. This is followed by fuel consumption and operating costs, which are particularly relevant for users, suggesting a favourable predisposition toward EVs due to consumption savings. Responses to the questionnaire were collected with careful attention to data quality, employing measures such as designing a concise and clear survey and assuring respondents of confidentiality. The results of the stated preference (SP) survey (Table 3) reveal substantial variability in user preferences according to vehicle characteristics.
Table 3.
Vehicle choices from the SP survey.
These results suggest interest in EVs, as long as they have certain characteristics (e.g., price, vehicle range, charging infrastructure). However, the hybrid one emerges as the main choice, probably because of its balance between efficiency and travel range, which combines the advantages of EVs and the familiarity of TR. In addition, tax incentives for hybrids and their environmental benefits, such as greater fuel efficiency and lower emissions, make them more attractive to those looking for eco-friendly solutions.
4.5. Development of a Forecasting Model
The Nlogit 5 © software was used for the estimation of discrete choice models. The process of estimating a model is divided into three basic steps, specification, parameter estimation (calibration), and validation:
- specification; in this phase, the mathematical structure of the model has been defined, choosing the functional form (e.g., logit multinomial) and the explanatory variables/attributes, avoiding collinearity between them; the choice of shape depends on computational tractability, similar models, and the independence of random residuals;
- calibration; the value of the model parameters has been estimated using the data collected from the sample of users; in this phase, methods were applied to estimate the parameters;
- validation; once the model has been calibrated, its ability to reproduce user choices, the reasonableness of the estimated parameters, and the adequacy of the functional form were verified; this step included formal and informal tests to assess how well the model fits.
The probability to choose the alternative y among the three available, i.e., EV, HV and TR, p [y], has been expressed as follows:
where Vy is the systematic utility associated with the alternative y, which is expressed as a linear combination of the attributes reported in Table 1 through the parameters b as shown below.
The entire process is iterative, with the steps of specification, calibration, and validation repeated until a robust and validated model is achieved. The best-performing model obtained is presented below, where the systematic utility (V) of each alternative is expressed according to the attributes listed in Table 1:
The goodness of the estimated parameters for each model, which are reported in Table 4 together with the relative values of the t-students (t-st), was evaluated in the validation phase.
Table 4.
Parameter estimation results.
The validation phase of the model was designed to verify the consistency and significance of the estimated parameters, as well as to evaluate the ability of the model to predict the choices made by users. To achieve these goals, informal and formal tests were performed [24,25,26]. This analysis confirmed the consistency of the coefficients, reinforcing the validity of the model. Therefore, to verify the accuracy of the model in reproducing users’ choices, the rho-square and the corrected one were calculated and are, respectively, 0.211 and 0.203. Although the rho-square and the corrected rho-square indicate a not particularly high predictive capacity, are in line with the values in the literature for such studies, and are thus acceptable in light of the complexity of the data and the hypothetical nature of the choice scenarios [26]. The models developed can therefore be considered adequate to represent the users’ preferences in the purchase of electric, hybrid and traditional vehicles.
An elasticity analysis was performed to assess the sensitivity of the probability of choosing an EV to variations in model parameters. Among the attributes considered, purchase cost and distance to the nearest charging station emerged as the most influential and were therefore in-deep assessed. The results indicate a direct elasticity of −2.08 for purchase cost and −0.80 for charging station distance, suggesting that demand for EVs is highly responsive to changes in these factors. Overall, respondents exhibit a favourable disposition toward EV adoption when specific conditions are met; nevertheless, HVs garnered the highest preference. As age increases, users’ willingness to purchase EVs decreases. As annual income increases, users prefer TR. With a future perspective, some questions on vehicle-to-grid (V2G) were asked a solution that allows EVs to exchange the electricity stored in their batteries with the electricity grid, and therefore to transfer part of the own energy [3,27]. A total of 74.34% of the sample declared that they were available to use this service. About half of the users (53.93%) would like, at the end of the service participation, a minimum percentage of residual electricity charge equal to or greater than 60%. Only 9.7% of the participants would be willing to sell the energy at a price equal to its purchase cost.
5. Conclusions
This study examined the factors influencing users’ willingness to adopt electric vehicles through a SP survey and a multinomial logit model. By analysing six key vehicle attributes (i.e., purchase cost, operating cost, driving range, charging time, distance to the nearest charging station, and environmental impact), the research quantified their relative importance in shaping users’ preferences among electric, hybrid, and traditional vehicles.
The results highlight that purchase cost remains the dominant barrier to EV adoption, while HVs emerge as the most preferred choice due to their balance between driving range and efficiency. Charging-related attributes also play a significant role, confirming the relevance of infrastructure availability and charging performance in consumer decision-making.
The originality of this study lies in its comprehensive analysis of the factors influencing user choice, the inclusion of socioeconomic variables, and the use of predictive models to assess consumer behaviour. The inclusion of all age groups and the comparative evaluation of traditional, hybrid, and electric vehicles strengthen the robustness and generalisability of the findings. These results offer actionable insights for future policies and strategies aimed at accelerating a more efficient transition toward sustainable mobility.
Future work could extend this study in these directions. First, integrating data from SP and RP surveys would enhance the validity and robustness of behavioural models. In fact, SP data allow researchers to explore hypothetical scenarios and capture preferences for emerging technologies such as electric vehicles, while RP data reflect actual choices made in real-world contexts, providing greater external validity. Combining these approaches mitigates the limitations inherent in each (e.g., such as hypothetical bias in SP and limited variability in RP) resulting in more accurate and generalisable estimates of consumer behaviour.
Second, enlarging the sample size would improve representativeness and strengthen the statistical reliability of the results. A larger and more diverse sample would capture variations across demographic, socioeconomic, and geographic segments, reducing sampling bias and enhancing the generalisability of findings.
Finally, applying advanced choice modelling techniques, such as mixed logit or latent class models, would allow for a more nuanced analysis of preference heterogeneity. Mixed logit models account for random taste variations and relax the independence of irrelevant alternatives assumption, while latent class models identify distinct population segments based on unobserved characteristics. These methodological improvements would provide deeper insights into user’s behaviour and enable more accurate predictions in emerging mobility scenarios, supporting the design of targeted policies and business strategies.
Author Contributions
Conceptualisation, A.C.; methodology, A.C.; software, A.C. and O.H.; validation, A.C., I.I., O.H. and U.C.; formal analysis, A.C. and I.I.; investigation, A.C. and O.H.; resources, A.C.; data curation, A.C., I.I. and O.H.; writing—original draft preparation, A.C., I.I. and O.H.; writing—review and editing, A.C. and I.I.; visualisation, A.C. and I.I.; supervision, A.C. and U.C.; project administration, A.C.; funding acquisition, A.C. All authors have read and agreed to the published version of the manuscript.
Funding
This research was funded by the University of Rome Tor Vergata, Bando Ricerca Scientifica d’Ateneo RSA 2024 (DR 3392 del 23 October 2024) “Driving style analysis to support the development, monitoring and control of road vehicle performances—DRIVE”, CUP: E83C25000830005, and by the European Union—Next Generation EU. PNRR—Missione 4, Componente 2, Investimento 1.1—Prin 2022—Decreto Direttoriale n. 104 del 2 February 2022 Project: PULSe: Pre-feasibility analysis for Urban Logistics Solutions based on Eco-friendly vehicles. CUP Master: F53D23005490006; CUP: E53D23010110006.
Data Availability Statement
The raw data will be made available by the authors on motivated and reasonable request.
Acknowledgments
The authors thank Eng. Alessandro Palmoni for his support in data collection and SP scenario development, editors and reviewers whose suggestions and comments were very useful in improving the paper.
Conflicts of Interest
The authors declare no conflicts of interest.
References
- United Nations. World Urbanization Prospects: The 2018 Revision (ST/ESA/SER.A/420). United Nations—Department of Economic and Social Affairs, 2019. Available online: https://population.un.org/wup/assets/WUP2018-Report.pdf (accessed on 25 November 2025).
- EEA. National Emissions Reported to the UNFCCC and to the EU Greenhouse Gas Monitoring Mechanism. European Environment Agency, 2022. Available online: https://europa.eu (accessed on 25 November 2025).
- Comi, A.; Crisalli, U.; Sportiello, S. Forecasting the vehicle energy potential to support the needs of electricity grid: A floating car data-based methodology. Front. Future Transp. 2024, 5, 1500224. [Google Scholar] [CrossRef]
- Buhmann, K.M.; Criado, J.R. Consumers’ preferences for electric vehicles: The role of status and reputation. Transp. Res. Part D Transp. Environ. 2023, 114, 103530. [Google Scholar] [CrossRef]
- Rotaris, L.; Giansoldati, M.; Scorrano, M. The slow uptake of electric cars in Italy and Slovenia. Evidence from a stated-preference survey and the role of knowledge and environmental awareness. Transp. Res. Part A Policy Pract. 2021, 144, 1–18. [Google Scholar] [CrossRef]
- European Climate; Infrastructure and Environment Executive Agency. EU Road Safety: Towards Vision Zero; European Commission: Luxembourg, 2022; Available online: https://data.europa.eu/doi/10.2840/853053 (accessed on 22 April 2024).
- Biresselioglu, M.E.; Kaplan, M.D.; Yilmaz, B.K. Electric mobility in Europe: A comprehensive review of motivators and barriers in decision making processes. Transp. Res. Part A Policy Pract. 2018, 109, 1–13. [Google Scholar] [CrossRef]
- European Commission. Sustainable and Smart Mobility Strategy—Putting European Transport on Track for the Future. Available online: https://transport.ec.europa.eu/system/files/2021-04/2021-mobility-strategy-and-action-plan.pdf (accessed on 25 November 2025).
- She, Z.Y.; Sun, Q.; Ma, J.J.; Xie, B.C. What are the barriers to widespread adoption of battery electric vehicles? A survey of public perception in Tianjin, China. Transp. Policy 2017, 56, 29–40. [Google Scholar] [CrossRef]
- Rani, S.; Jayapragash, R. Review on electric mobility: Trends, challenges and opportunities. Results Eng. 2024, 23, 102631. [Google Scholar] [CrossRef]
- Chung, A.; Chon, M.G. Promoting the Use of Electric Vehicles on Social Media: The Effects of Message Framing, Point of Reference, and Political Affiliation on Perceived Information Value for Others and Purchase Intentions. Commun. Rep. 2024, 37, 153–168. [Google Scholar] [CrossRef]
- De Luca, S.; Di Pace, R.; Bruno, F. Accounting for attitudes and perceptions influencing users’ willingness to purchase Electric Vehicles through a Hybrid Choice Modeling approach based on Analytic Hierarchy Process. Transp. Res. Procedia 2020, 45, 467–474. [Google Scholar] [CrossRef]
- Pamidimukkala, A.; Kermanshachi, S.; Rosenberger, J.M.; Hladik, G. Examining Drivers of Electric Vehicle Adoption. In Proceedings of the International Conference on Transportation and Development 2024, Atlanta, GA, USA, 15–18 June 2024; American Society of Civil Engineers: Atlanta, GA, USA, 2024; pp. 788–797. [Google Scholar] [CrossRef]
- Zhang, K.; Guo, H.; Yao, G.; Li, C.; Zhang, Y.; Wang, W. Modeling Acceptance of Electric Vehicle Sharing Based on Theory of Planned Behavior. Sustainability 2018, 10, 4686. [Google Scholar] [CrossRef]
- Shahrier, H.; Arunakirinathan, V.; Hossain, F.; Habib, M.A. Developing an Integrated Activity-Based Travel Demand Model for Analyzing the Impact of Electric Vehicles on Traffic Networks and Vehicular Emissions. Transp. Res. Rec. J. Transp. Res. Board 2024, 2679, 1403–1421. [Google Scholar] [CrossRef]
- Gezmish, M.; Truong, L.T. Estimating the Potential of Electric Vehicles for Travelling to Work and Education in Melbourne, Victoria. Future Transp. 2021, 1, 737–746. [Google Scholar] [CrossRef]
- Aravena, C.; Denny, E. The impact of learning and short-term experience on preferences for electric vehicles. Renew. Sustain. Energy Rev. 2021, 152, 111656. [Google Scholar] [CrossRef]
- Alvarez-Meaza, I.; Zarrabeitia-Bilbao, E.; Rio-Belver, R.M.; Garechana-Anacabe, G. Fuel-Cell Electric Vehicles: Plotting a Scientific and Technological Knowledge Map. Sustainability 2020, 12, 2334. [Google Scholar] [CrossRef]
- Selmi, T.; Khadhraoui, A.; Cherif, A. Fuel cell–based electric vehicles technologies and challenges. Environ. Sci. Pollut. Res. 2022, 29, 78121–78131. [Google Scholar] [CrossRef] [PubMed]
- Ala, G.; Di Filippo, G.; Viola, F.; Giglia, G.; Imburgia, A.; Romano, P.; Castiglia, V.; Pellitteri, F.; Schettino, G.; Miceli, R. Different Scenarios of Electric Mobility: Current Situation and Possible Future Developments of Fuel Cell Vehicles in Italy. Sustainability 2020, 12, 564. [Google Scholar] [CrossRef]
- Wei, S.; Sacchi, R.; Tukker, A.; Suh, S.; Steubing, B. Future environmental impacts of global hydrogen production. Energy Environ. Sci. 2024, 17, 2157–2172. [Google Scholar] [CrossRef]
- Osman, A.I.; Mehta, N.; Elgarahy, A.M.; Hefny, M.; Al-Hinai, A.; Al-Muhtaseb, A.H.; Rooney, D.W. Hydrogen production, storage, utilisation and environmental impacts: A review. Environ. Chem. Lett. 2022, 20, 153–188. [Google Scholar] [CrossRef]
- Zhang, J.; Tang, T.-Q.; Yan, Y.; Qu, X. Eco-driving control for connected and automated electric vehicles at signalized intersections with wireless charging. Appl. Energy 2021, 282, 116215. [Google Scholar] [CrossRef]
- Cascetta, E. Transportation Systems Analysis; Springer Optimization and Its Applications; Springer: Boston, MA, USA, 2009; Volume 29. [Google Scholar] [CrossRef]
- Ortúzar, J.d.D.; Willumsen, L.G. Modelling Transport, 4th ed.; John Wiley & Sons: Chichester, UK, 2011. [Google Scholar]
- Washington, S.; Karlaftis, M.G.; Mannering, F.L. Statistical and Econometric Methods for Transportation Data Analysis, 2nd ed.; CRC Press: Boca Raton, FL, USA, 2011. [Google Scholar]
- Comi, A.; Idone, I. The Use of Electric Vehicles to Support the Needs of the Electricity Grid: A Systematic Literature Review. Appl. Sci. 2024, 14, 8197. [Google Scholar] [CrossRef]
Disclaimer/Publisher’s Note: The statements, opinions and data contained in all publications are solely those of the individual author(s) and contributor(s) and not of MDPI and/or the editor(s). MDPI and/or the editor(s) disclaim responsibility for any injury to people or property resulting from any ideas, methods, instructions or products referred to in the content. |
© 2025 by the authors. Licensee MDPI, Basel, Switzerland. This article is an open access article distributed under the terms and conditions of the Creative Commons Attribution (CC BY) license (https://creativecommons.org/licenses/by/4.0/).