Abstract
The straightness of rail joints is one of the critical factors affecting passenger comfort in high-speed railways, and investigating its influence on the dynamic performance of the vehicle–track system and riding comfort is of great significance. In this study, long-term field measurements were conducted at a turnout joint of a newly constructed high-speed railway in China, combined with multibody dynamics simulations, to systematically analyze the long-term evolution of rail joint straightness under various conditions, including pre- and post-grinding, joint commissioning, official operation, and extreme weather. Based on normalized data processing, the root mean square (RMS) index of joint straightness was extracted for feature quantification. Together with vertical acceleration and the Sperling index obtained from vehicle–track coupled dynamics simulations, a quantitative relationship between straightness and comfort was established. The results indicate that the cubic polynomial fitting method can effectively characterize the nonlinear mapping between the RMS of joint straightness and the Sperling index, further revealing a critical threshold at approximately 0.4 mm RMS beyond which vehicle running stability deteriorates and ride comfort significantly worsens. This study provides a reliable theoretical basis and engineering reference for the evaluation of rail joint quality and the optimization of maintenance strategies.
1. Introduction
The construction and operation of high-speed railways have greatly improved transportation efficiency and promoted rapid socioeconomic development. During high-speed train operations, ride comfort not only affects the travel experience but also serves as a key indicator for evaluating service quality and track condition. As a weak component of the track structure, welded rail joints are susceptible to various influencing factors during construction, grinding, and service stages. High-quality welded joints are essential to meet the requirements of high smoothness, high reliability, and high stability in high-speed railways. Owing to their structural discontinuity, track joints are prone to inducing significant impact wheel loads and rail displacements []. Rail joint straightness refers to the linearity of the welded rail within a specified length range, which directly affects the safety and comfort of train operations []. When deviations in rail joint straightness occur, they tend to induce impacts and vibrations within the vehicle–track system, which not only degrade the dynamic performance of the structure but also accelerate the deterioration of track components. Ultimately, such effects impair ride comfort and increase maintenance costs. Therefore, accurately characterizing the relationship between rail joint straightness and ride comfort is of great significance for achieving a quantitative evaluation of track condition and optimizing maintenance strategies.
Extensive research has been conducted worldwide on the relationship between rail joint conditions and ride comfort. In terms of joint detection, Xiao et al. [] proposed a non-contact straightness measurement method based on a laser profilometer, which improved the accuracy of geometric deviation identification. Li [] designed a novel straightness detector and systematically analyzed its measurement errors. Tian [] investigated measures to improve joint straightness through welding process optimization tests. Zhong [] compared the geometric irregularities of flash welding and aluminothermic welding, providing guidance for the selection of welding methods. Xiao [] pointed out that longitudinal irregularities in rail conditions increase human vibration levels and reduce ride comfort indices. Aldo La Placa [] utilized seven longitudinal displacement sensors to monitor insulated rail joints, and the data obtained can provide a feasible real-time monitoring solution based on existing detection instruments. Additionally, methods commonly used both domestically and internationally for detecting the service condition of rail joints are classified into dynamic and static testing based on whether they occupy the operational time of locomotives. Compared to the traditional method of measuring rail joints with rulers and feeler gauges, various instruments have been invented in recent years for more portable measurements. For example, the Italian company MERMEC developed a handheld rail waviness measuring device, while the American company ENSCO designed and developed an onboard rail waviness detection system and an onboard rail waviness analyzer []. As shown above, existing research primarily focuses on different detection technologies and their application scenarios, with each conducting analysis under specific conditions. Given that this study requires efficient and portable acquisition of joint straightness data under field conditions, and considering the widespread applicability of portable instruments, this paper selects the MCRuler electronic straightedge as the measurement device to achieve high precision and high repeatability in field testing.
Regarding ride comfort evaluation, Wawryszczuk [] analyzed the influence of vibration acceleration on comfort based on ISO 2631. This standard was also used by Dragan Sekulić et al. [], who identified the comfort zone for vibrations according to this standard. Through modeling and simulations, they found that buses have different oscillation zones with varying comfort evaluations. Dižo et al. [] evaluated ride comfort according to the European standard EN 12299:2009, and Bakinowski et al. [] also utilized this standard to identify which seats in vehicles cause vibration discomfort. These indicators are represented in the frequency domain by the RMS with a weighting function, and another commonly used index is the Sperling Wz index proposed by Sperling, which was also adopted by Deng, who conducted a comparative analysis based on both time-domain and frequency-domain approaches using algorithms involving the squared and cubed terms of acceleration []. Additionally, some researchers have considered using different evaluation methods and influencing factors. For example, Peng et al. [] proposed a new evaluation model for passenger comfort, which combines full-body vibration measurements with subjective passenger comfort ratings to study the long-term passenger vibration comfort on high-speed trains under different operational environments. Zhou et al. [] studied whole-body vibration comfort on long-span bridges under crosswind conditions. Yakovenko [] additionally considered thermal comfort, and R. Wawryszczuk et al. [] incorporated multiple factors—including vibration acceleration, air temperature, relative humidity, and illumination—into comfort experiments. Grossoni et al. [] based on simulation, revealed the relationship between joint geometry and peak impact forces. Overall, these studies provide essential theoretical and data support for rail joint condition detection and ride comfort evaluation. However, it should be noted that most existing results focus on short-term measurements or analyses under single operating conditions, making it difficult to comprehensively reflect the life-cycle evolution characteristics of rail joints from welding, grinding, and commissioning to official operation. This study addresses this gap by proposing a rail joint condition analysis and comfort evaluation method based on the fusion of field measurement data and simulation results, aiming to establish a more timely and full-cycle analytical framework.
On the other hand, multibody dynamics simulations have been widely employed for comfort analysis. For instance, Li et al. [] developed a vehicle–track coupled model using Universal Mechanism (UM) version 7.0 to analyze dynamic characteristics such as nonlinear critical speed, derailment coefficient, vibration acceleration, and running stability index. Wang et al. [] incorporated the bending behavior of rail pads into the track dynamic model to enhance the accuracy of dynamic response predictions. Nevertheless, owing to the lack of long-term and systematic field data, simulation results still face limitations in reflecting actual service conditions. Similarly, Li et al. [] proposed a method for monitoring the reaction forces of rail fasteners through rail pad strain, calibrated by experimental finite element simulations. However, these studies have primarily focused on force monitoring, while investigations into the nonlinear or threshold effects between ride comfort indices and rail joint straightness remain scarce.
Based on the above literature review and current research status, this study proposes the following research hypothesis: whether long-term and continuous measurements of rail joint straightness, combined with multibody dynamics models validated by field data, can be used to establish a quantitative mapping between joint straightness and ride comfort, thereby enabling predictive evaluation of comfort.
To verify this hypothesis, a nine-month long-term monitoring campaign was carried out at the joints before and after a turnout on a newly constructed high-speed railway in China. The measurements covered multiple representative conditions, including pre- and post-grinding, commissioning, official operation, and extreme weather, thereby systematically capturing the evolution of joint straightness. On this basis, vehicle–track coupled dynamics simulations were further conducted to extract vertical acceleration and the Sperling comfort index, establishing a quantitative relationship between joint straightness and ride comfort. This research design aims to provide reliable data and modeling support for an in-depth investigation of the relationship between joint geometry and ride comfort, and to lay the foundation for the subsequent analyses presented in this paper.
This study establishes a comprehensive “measurement–simulation–mapping” framework to explore the quantitative relationship between rail joint straightness and ride comfort. The framework flowchart is illustrated in Figure 1 below. The paper is structured into six main sections. Section 2 introduces the long-term field measurement program, data preprocessing methods, and the process of multibody dynamics modeling. Section 3 presents the simulation results under different operating conditions and evaluates ride comfort based on the Sperling index. Section 4 develops a quantitative mapping between joint straightness and ride comfort through fitting analysis, followed by a discussion combining field measurements and simulation results. Section 5 provides an in-depth discussion of the conclusions, analyzes the study’s limitations, and highlights directions for future research. Finally, Section 6 summarizes the overall conclusions of the paper.
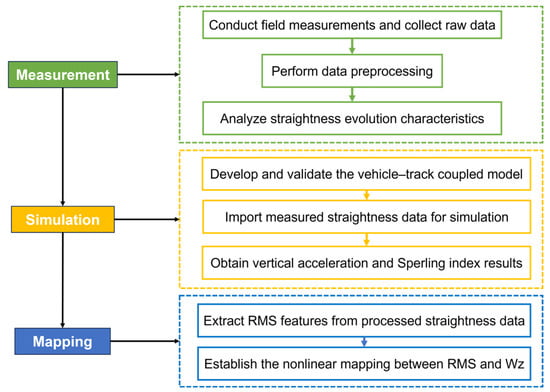
Figure 1.
Flowchart of the “Measurement–Simulation–Mapping” Framework.
2. Materials and Methods
2.1. Field Measurement
Field measurements were conducted at the aluminothermic welded rail joints located before and after Turnout No. 201 (construction code 101, mileage D1K31+414.600) on the downline of a newly constructed high-speed railway in China. The location of the test site and a photograph of the field measurements are shown in Figure 2.
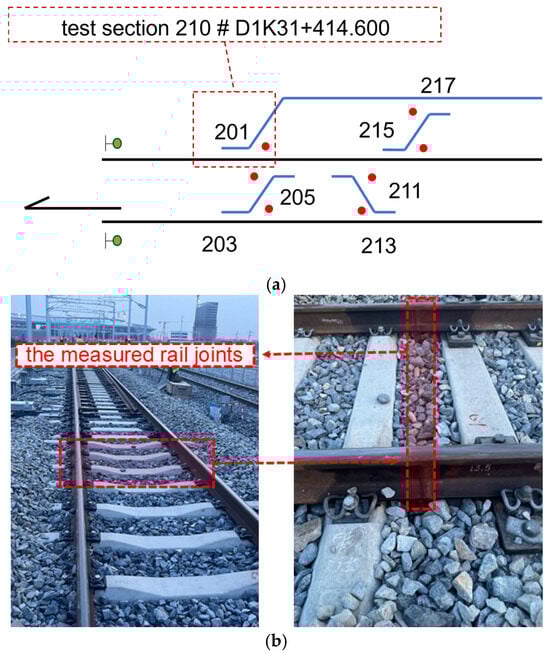
Figure 2.
Test Site Location. (a) Test section 210; the green dots denote railway signals, while the red dots indicate turnout numbers.; (b) Field-measured rail joint.
The commissioning tests of the high-speed line began on 14 September 2024, and commercial operation commenced on 26 December 2024. The field measurements started on 14 August 2024, and were conducted continuously for a period of nine months. The campaign covered multiple conditions, including pre- and post-rail grinding, the commissioning period, extreme weather, and post-operation scenarios. The specific measurement dates and corresponding conditions are summarized in Table 1.

Table 1.
Measurement Period and Operating Conditions.
For the measurements, three repeated tests were conducted on both the left and right rails at the joint before Turnout No. 201, with the measurement range extending 1.5 m on each side of the joint (corresponding to 5 spans and 6 sleepers, for a total of 3 m). Similarly, three repeated tests were carried out on both rails at the joint after Turnout No. 201, with the measurement range extending 0.9 m on each side of the joint (corresponding to 3 spans and 4 sleepers, for a total of 1.8 m).
To conduct the experimental investigation, a modern rail straightness measurement instrument, the MCRuler electronic straightedge (model CRMR-100M, Shenzhen EBORAIL Technology Co., Ltd., Shenzhen, China), was employed. The device features high measurement accuracy and operational stability. It provides a repeatability precision of 0.01 mm and an absolute accuracy of 0.02 mm, with a measurable wavelength range of up to 3000 mm. The instrument enables simultaneous dual-track measurements of both the rail top and side surfaces, and a single measurement operation can cover a length ranging from 10 m to 100 m. The total length of the device is 300 mm, and its weight is less than 3 kg, making it highly portable and suitable for on-site applications.
The measurement system is equipped with the MCRuler V2 software, which operates on an Android-based host platform and communicates with the measuring unit via Wi-Fi. The software allows real-time display of measurement results and supports data preview and export, thereby facilitating subsequent data analysis and processing. The device is factory-calibrated by the manufacturer to ensure the reliability and consistency of measurement results. Figure 3 illustrates the application of the MCRuler instrument during on-site rail straightness measurements.
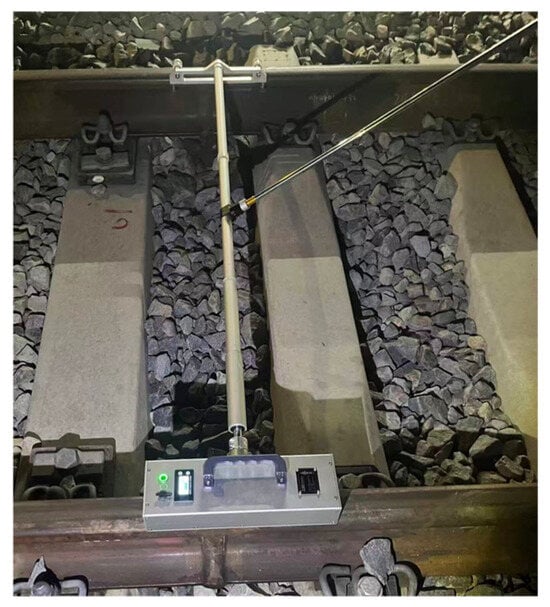
Figure 3.
Schematic diagram of the CRMR-100M instrument.
2.2. Data Preprocessing
Although a standard instrument was employed for straightness measurements, the manual nature of the testing made it impossible to ensure that the three repeated measurements at the same site were conducted at exactly the same mileage. In addition, each measurement inevitably contained certain human and instrumental errors. As a result, the raw data could not be directly used and required preprocessing to obtain normalized datasets. In this subsection, the top-surface waveform of the right rail before Turnout No. 201 is used as an illustrative example.
The raw data acquired from each measurement generally reflected the variation trend of rail straightness. However, the original signals were accompanied by disturbances such as jitter, unsmoothed profiles, sharp high-frequency fluctuations, and noise caused by alignment errors and external interferences during manual operations. Furthermore, surface oxides introduced “burrs” in the waveforms [], as highlighted in the circled region of Figure 4a.
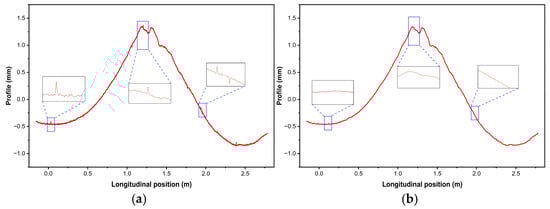
Figure 4.
Results of data filtering. (a) Raw measurement waveform; (b) Filtered waveform. The blue frames highlight the selected sections used for partial comparison between the raw and filtered waveforms.
Therefore, data preprocessing was required. With the rapid development of rail quality inspection technology in China, a relatively complete system of testing techniques, quality assessment criteria, and data processing methods has been established [,]. Existing approaches, such as trend component removal using Fourier transform and inverse Fourier transform, as well as moving-window techniques for eliminating abnormal segments, have demonstrated effectiveness in outlier handling [].
The moving average filtering algorithm replaces the central value of a data window with the average value of all points within that window []. The response of the central point under this filtering scheme is expressed as in Equation (1).
In Equation (1), represents the raw measurement data, and denotes the window length.
By adjusting the value of , different smoothing effects can be achieved []. This method is simple and reliable, allowing for the elimination of obvious instrumental errors or outliers in a single step, thereby producing processed data that are smoother than the original measurements.
In this study, the window length was set to 5 (kernel size = 5). After outlier removal and filtering, the results are shown in Figure 4b. It can be clearly observed that the data waveform became smoother after filtering, thereby providing more favorable conditions for subsequent alignment and analysis.
In addition, since three repeated measurements were conducted for each experiment and all were performed manually, it was not possible to ensure that each measurement started exactly from the same point. As a result, mileage deviations occurred, as shown in Figure 5a. Therefore, data alignment was performed to ensure absolute consistency in mileage across measurements. After alignment, the three datasets were averaged to obtain the final results, making the measurement data more standardized.
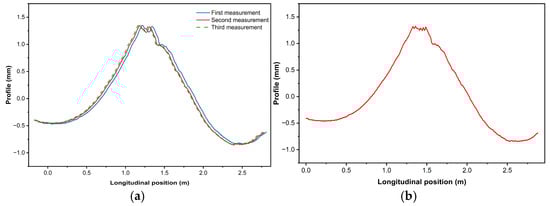
Figure 5.
Results of alignment and averaging. (a) Waveforms before alignment; (b) Waveforms after preprocessing.
During the data alignment process, the cross-correlation method was applied to register multiple measurement datasets by calculating their relative positional offsets and translating the signals to achieve mileage matching. Specifically, a “two-step alignment” strategy was adopted in this study: first, the first dataset was taken as the reference, and the second dataset was aligned accordingly; subsequently, the third dataset was aligned with the averaged waveform of the first two. After this procedure, the three datasets were merged to form the final averaged waveform, as shown in Figure 5b.
2.3. Data Analysis
A total of eight straightness measurements were conducted on both the left and right rails of the sections before and after Turnout No. 201. After mileage alignment, the results of each measurement were plotted and compared to analyze the trends, thereby revealing the variation characteristics of rail joint straightness under different operating conditions. The results are presented in Figure 6.
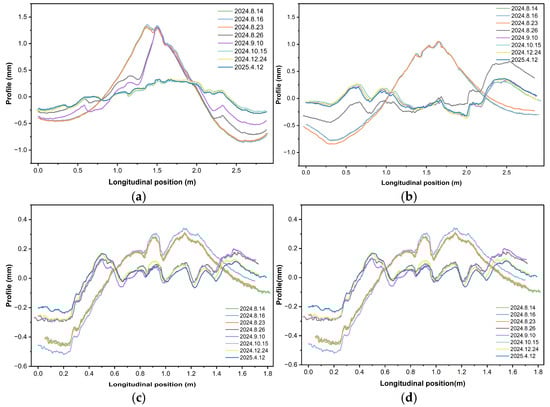
Figure 6.
Comparison of waveforms from eight measurements. (a) Left rail before the turnout; (b) Right rail before the turnout; (c) Left rail after the turnout; (d) Right rail after the turnout.
As shown in Figure 6a,b, comparative analysis reveals that both the left and right rails before the turnout exhibit a pronounced bulge in the 1.5–1.7 m range. This feature is stable and indicates the presence of a welded bead at the joint, with a maximum height of approximately 1.6 mm and a minimum of about –1.0 mm, resulting in a longitudinal variation exceeding 2.6 mm across the entire segment. The most significant changes occurred between 14 August and 26 August, corresponding to the period before and after grinding. Subsequently, the profiles gradually stabilized, and by 12 April 2025—three months after the start of commercial operation—the contours had become lower and smoother overall, although some localized irregular fluctuations still remained compared with the initial stage.
As shown in Figure 6c,d, comparative analysis of the eight measurement results indicates that both the left and right rails exhibit pronounced bulges in the critical region, for example between 1.5 m and 1.7 m. This feature remained stable across multiple measurements, confirming that it corresponds to the welded repair area at the joint. The maximum waveform amplitude reached approximately +1.6 mm, while the minimum was about −1.0 mm, resulting in a total longitudinal variation of around 2.6 mm. The most substantial changes in rail straightness occurred during the period from 14 August to 26 August, after which the profiles gradually stabilized. By 12 April 2025, three months after the commencement of commercial operation, the rail contours had become lower and smoother overall, although localized irregular undulations were still present compared with the initial stage.
A comprehensive analysis of the eight straightness measurements reveals that, prior to grinding, the overall waveform trends of each measurement were generally consistent, indicating good data stability; however, the straightness errors were relatively large, with pronounced local peaks and sharp fluctuations.
The most significant changes occurred before and after the first grinding on 26 August, when the results clearly showed that the bulges at the rail joints were substantially reduced, the overall straightness was markedly improved, and the waveforms became smoother compared with the pre-grinding condition, thereby verifying the effectiveness of grinding in mitigating local protrusions. In the measurements conducted on 10 September under extreme rainfall conditions, the straightness curve in the first half was generally lower than in the previous measurement, while the second half was slightly higher. Nevertheless, the overall variation remained limited, indicating that extreme rainfall introduced certain disturbances but did not fundamentally alter the overall trend. During the subsequent commissioning and commercial operation stages, continuous grinding maintenance was applied at the rail joints to ensure operational safety. The results from 15 October onward show that the waveforms gradually stabilized, with significantly enhanced smoothness, although minor local undulations or rebounds were still observed. Three months after the commencement of commercial operation, due to the combined effects of repeated train loads as well as temperature and human factors, the straightness curve at the joint exhibited a slight upward arch compared with the early operation stage. However, the overall profile became smoother, suggesting that the structure had gradually entered a stable service state.
3. UM Simulation Modeling and Analysis
3.1. Model Development
Irregularities at rail joints induce complex vehicle–track coupled dynamic responses. Field measurements alone are insufficient to fully reveal their effects on ride comfort, as straightness data only provide information on geometric deviations without directly establishing a relationship between straightness and comfort. Therefore, the multibody dynamics software Universal Mechanism (UM), version 9.0 (Moscow, Russia) was employed to build a simulation platform. By importing the measured straightness data as track irregularity inputs into the UM model and extracting the corresponding dynamic indices, a quantitative mapping from “geometric features” to “comfort indices” was established.
In Chinese high-speed trains, the car body, bogies, and wheelsets are modeled as rigid bodies, which together form a multibody system interconnected by nonlinear or linear springs and dampers. The vehicle degrees of freedom account for the displacements and rotations of the car body, bogies, and wheelsets, while wheel rotational irregularities caused by non-uniform angular velocity are not considered. The primary suspension system connects the wheelsets to the bogies, whereas the secondary suspension system connects the bogies to the car body.
The vehicle model consists of one car body, two bogies, and four wheelsets. The car body and each bogie are assigned five degrees of freedom, namely bounce, lateral displacement, pitch, roll, and yaw. Each wheelset is assigned four degrees of freedom, including bounce, lateral displacement, roll, and yaw. In total, a single vehicle comprises 31 degrees of freedom [], as illustrated in Figure 7, which presents the schematic of the vehicle model with degrees of freedom, stiffness, and damping.
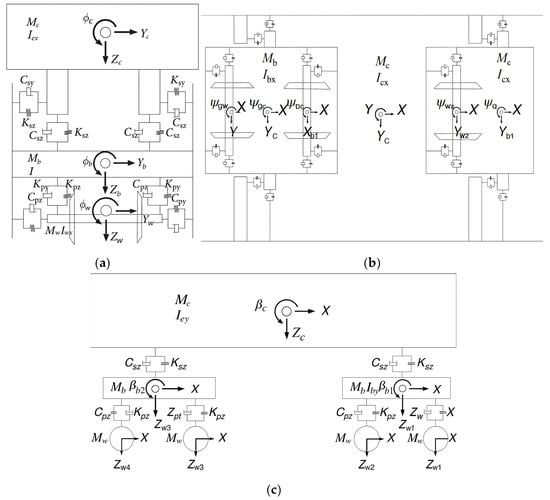
Figure 7.
Schematic diagram of vehicle calculation model. (a) Front view; (b) Plan view; (c) Side view.
Table 2.
Degree of freedom, stiffness and damping symbols of vehicle structures.
The governing equations of the vehicle system are given as:
As shown in Equation (2), , , denote the mass, damping, and stiffness matrices of the vehicle, respectively. represent the acceleration, velocity, and displacement vectors of the vehicle, respectively. denotes the wheel–rail contact force vector [].
The high-speed measurements on the railway line were conducted using the CRH380BJ-0301 comprehensive inspection train. This train performs integrated inspections on high-speed lines to ensure the proper operation of the track and related systems. Therefore, the parameters of the vehicle model were selected based on those of the CRH380 train, as referenced [,], and are summarized in Table 3.
Table 3.
Main parameters of the vehicle model.
In railway vehicle dynamics modeling, the construction process generally follows a bottom-up sequence of defining bodies, joints, and force elements. Specifically, the wheelsets, axle boxes, bogie frames, car body, joints, and force elements are defined step by step, after which the bogie subsystem is further established []. Based on the aforementioned parameters, the bogie model was developed as illustrated in Figure 8.
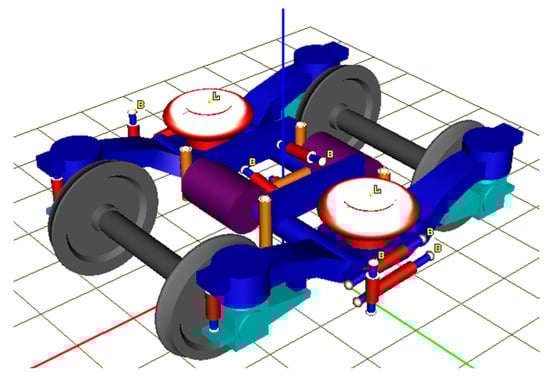
Figure 8.
The bogie model.
The track model was established using the flexible track module of UM software, which allows detailed simulation of the fastening system, sleepers, and subgrade support. The rails were modeled as flexible beams discretely supported by sleepers, the fastenings were represented by force elements, and the sleepers were modeled as rigid bodies connected to the underlying foundation through force elements. These components can be directly inserted in UM. Since this study focuses on straightness, only the track smoothness in UM was modified by inputting the measured straightness data; therefore, it was not necessary to build separate track models. The simulation approach and conclusions reported in references [,,] were used as references for the UM simulation setup. The final integrated model is shown in Figure 9.
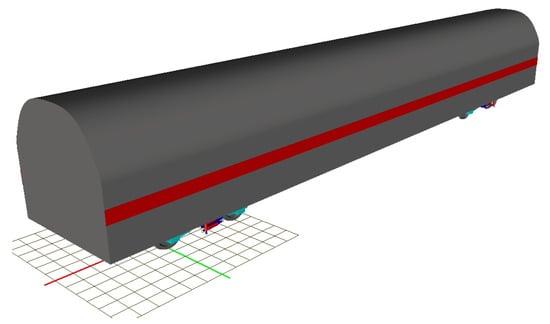
Figure 9.
Vehicle–track coupled model established in UM.
3.2. Simulation Validation
To verify the accuracy of the established model, a benchmark simulation was performed using the irregularity sample officially provided by the UM software. The resulting car body vertical acceleration curve is shown in Figure 10, and the corresponding Sperling index of the sample is Wz = 0.8049. In high-speed railway operations, the target comfort range of the Sperling index is generally controlled between 0.8 and 1.3. The result obtained in this study falls within this range, indicating that the established model is reasonable and can be effectively used to calculate car body acceleration and Sperling index values under different rail joint straightness conditions.
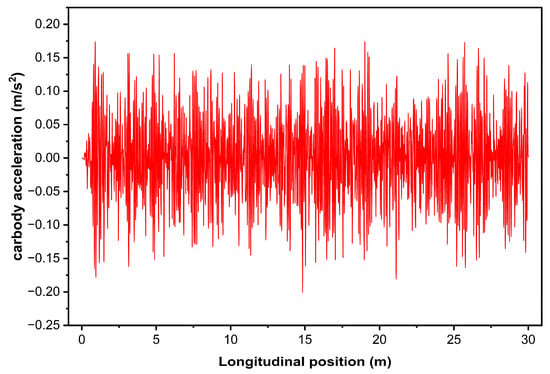
Figure 10.
Vertical acceleration waveform of the sample.
3.3. Simulation Analysis
In this section, the processed top-surface straightness data of the rail joints were imported into the UM model to obtain vertical acceleration responses and calculate the corresponding comfort indices.
Since the irregularity spectrum file (way) in UM requires a mileage interval of 0.1 m, while the preprocessed data had an interval of 0.005 m, further transformation was necessary. Specifically, integers from 0 to 19 were first added at the beginning of the mileage sequence. Subsequently, each value in the preprocessed first column was increased by 20 and arranged in order. After this, additional integers were appended to extend the sequence to the maximum value of 100. Meanwhile, the second column of the preprocessed data was multiplied by 0.001 and aligned with the shifted first column (i.e., offset by 20), while the remaining mileage values in the first column were assigned zero waveform values. The final processed dataset was then imported into UM and converted into an irregularity spectrum.
On the one hand, several international standards have explicitly required the use of acceleration to evaluate ride comfort. A direct and critical relationship exists between acceleration and ride comfort, as variations in vehicle acceleration are the primary physical factor causing passenger discomfort; in essence, “ride comfort” can be regarded as an evaluation index of the acceleration signal. On the other hand, the instrument used in this study was capable of collecting longitudinal and lateral irregularities at welded joints, corresponding to the rail top and rail side waveforms, respectively. Considering that vertical acceleration exhibits significant sensitivity to ride comfort, particularly due to the induced sensations of vertical bumping and longitudinal push–pull, vertical acceleration (i.e., in the Z-axis direction) was therefore selected as the primary evaluation index. It directly affects passenger comfort and is the most commonly used parameter for comfort assessment, especially in the context of high-speed rail.
The processed top-surface irregularity spectra under different operating conditions were input into the multibody dynamics software UM. Based on field measurements of the high-speed line, the train operating speed was set to 300 km/h for the simulations, and the resulting vertical acceleration responses were obtained. The eight sets of processed straightness data were individually imported into the UM model to calculate the car body vertical acceleration, and the corresponding waveforms were plotted in the same coordinate system. The results are presented in the box plots shown in Figure 11, where (a) corresponds to the car body vertical acceleration before Turnout No. 201, and (b) corresponds to that after Turnout No. 201.

Figure 11.
Vertical acceleration. (a) Before Turnout No. 210; (b) After Turnout No. 210.
As shown in Figure 11, the car body vertical acceleration exhibits clear periodic oscillations along the running direction, directly reflecting the influence of rail joint geometric irregularities on the vehicle dynamic response. The mean and median values of the measurements are close to each other, with the distributions being relatively symmetric and without evident skewness, indicating that the dynamic responses during train operation remained stable.
From August 2024 to April 2025, as grinding maintenance was performed and the line gradually entered a stable operational stage, the amplitudes of acceleration curves before and after the turnout both showed a decreasing trend, with the waveforms becoming smoother. This indicates that under long-term train operation and maintenance interventions, rail joint irregularities were effectively controlled and the dynamic performance of the vehicle–track system progressively improved. For the section before the turnout, the acceleration waveforms displayed larger oscillation amplitudes with significant peak-to-valley differences, suggesting that the geometric irregularities of the rail joint exerted stronger excitation on the vehicle dynamic response. In the early stage, before grinding, the waveforms exhibited sharp fluctuations and pronounced peaks, whereas after grinding, the oscillation amplitudes decreased considerably and the waveforms became smoother, demonstrating the effectiveness of the grinding process in reducing vehicle vibrations. In contrast, the overall amplitudes of the acceleration curves after the turnout were smaller, indicating that the irregularities at the post-turnout joint had a weaker influence on the vertical response of the car body. Although differences among operating conditions still existed, the overall fluctuations remained moderate, reflecting a more stable dynamic state at the post-turnout location.
The Sperling index, established on the basis of extensive experimental studies, serves as a stability criterion for evaluating both the running quality of vehicles and passenger ride comfort. Since the present study primarily focuses on quantitatively analyzing the relationship between track alignment and ride comfort under different operating conditions—aiming to provide relative comparisons and trend assessments rather than an in-depth investigation of comfort itself—the Sperling index is adopted as the evaluation indicator. Moreover, the UM software used in this study is equipped with a built-in function that directly outputs the Sperling index, making it more convenient compared with other comfort evaluation indices. Therefore, the Sperling index is ultimately selected as the ride comfort metric. Its relationship with acceleration is expressed in Equation (3).
where denotes the vibration acceleration, and represents a correction factor associated with vibration frequency. This factor is introduced to account for the varying sensitivity of the human body to different vibration frequencies.
The processed measurement data were imported into UM, and the Sperling index results Wz for different operating conditions were finally obtained, as summarized in Table 4.
Table 4.
Results of the Sperling index Wz.
The Sperling index is a commonly used indicator for evaluating ride comfort. A larger value corresponds to stronger vibration perception and poorer comfort, while a smaller value indicates higher ride comfort. In general, when Wz > 1.5 passenger comfort is adversely affected, whereas when Wz < 1.5, passengers generally feel comfortable. The results of the Sperling index presented in Table 4 show that different operating conditions yield different values, confirming that the state of rail joints influences ride comfort. Specifically, when rail welds are poorly ground, local straightness deteriorates, leading to geometric irregularities. This condition amplifies the wheel–rail system response, producing impacts and jolts that increase car body or seat vibrations and elevate acceleration levels, ultimately causing passenger discomfort. These findings demonstrate that rail joint straightness has a measurable influence on ride comfort, and a mathematical relationship exists between the two.
4. Results and Analysis
4.1. Data Feature Extraction
To conduct the data fitting analysis, the measured rail joint straightness data were correlated with the ride comfort indices obtained from the subsequent UM simulations to establish the corresponding trend curves. Accordingly, a scalar indicator was extracted from the processed rail joint straightness profiles to enable a quantitative description of the geometric deviation at the rail joints.
During the field measurement stage, due to the structural constraints of the instrument, the straightness at the left and right rail joints could only be measured separately, resulting in two independent straightness profiles. In the UM multibody dynamics model, however, the left and right rail straightness irregularities are applied simultaneously as a combined input to the vehicle system, and the model outputs a single car body vertical acceleration response together with the corresponding Sperling index. To ensure a one-to-one correspondence between the measured data and the simulation results, it is therefore necessary to fuse the left and right rail straightness into a single representative indicator. On this basis, the root mean square (RMS) is adopted in this study as the characteristic index of rail joint straightness.
The RMS can comprehensively evaluate the overall deviation intensity of rail joint waveforms and has been widely used in railway engineering as a robust indicator of overall roughness levels []. It not only reflects the energy content of irregular signals but is also less sensitive to local peaks or noise. The governing equation is given in Equation (4).
In Equation (4), denotes the squared amplitude of each sampling point of the waveform.
Considering that, in the UM simulations, the irregularities of the two rails act jointly on the vehicle system, the left and right rails should also be treated as an integrated entity when constructing the indicator, without assigning any preference to either side. Accordingly, based on the standard RMS definition, the composite root mean square (composite RMS) is calculated by first summing the squared straightness deviations of the left and right rails at each corresponding sampling point, then averaging over all sampling points, and finally taking the square root. This composite RMS provides a more appropriate global measure of the combined irregularity that governs the dynamic response. Moreover, the field test results indicate that the joint straightness levels of the two rails on the investigated line are of the same order of magnitude. Therefore, the composite RMS indicator can reasonably characterize the overall geometric deviation at the joint and reflect the straightness level of both rails. The calculation is expressed in Equation (5).
The parameters in Equation (5) are defined as follows:
- left rail straightness waveform: ;
- right rail straightness waveform:
The RMS values of the preprocessed straightness data were extracted as feature indicators, and the results are summarized in Table 5.
Table 5.
RMS values of the preprocessed straightness data.
4.2. Data Fitting Analysis
According to previous studies, for example, Li et al. [] employed rail pad strain data as the most direct response of the track structure to evaluate strain-related damage. However, the relationship between rail joint straightness and ride comfort cannot be measured in real time or conveniently, and can only be estimated through indirect measurement techniques. To address this limitation, this study proposes a data fitting analysis approach. Using field measurement data, combined with simulation and computation, a mapping between rail joint straightness and ride comfort was established, thereby revealing the nonlinear relationship between the RMS index of rail joint straightness and passenger comfort (Sperling index).
4.2.1. Nonlinear Regression Models and Comparative Analysis
To characterize the complex nonlinear relationship between rail joint irregularities and the resulting passenger comfort indices, a nonlinear regression model was employed to establish the correlation between rail joint straightness and ride comfort. Nonlinear models include generalized linear models, nonparametric regression models, and curve-fitting approaches. Among these, curve fitting is one method of nonlinear regression, in which an appropriate curve model is applied to experimental data, and the fitted curve is derived by applying the least squares method to obtain its mathematical expression [].
In this study, a polynomial function was employed for the curve-fitting task to establish the nonlinear relationship between the of rail joint straightness (geometric feature) and the Sperling index (comfort indicator). The fitting objective is expressed in Equation (6).
where denotes the RMS value of rail joint straightness (in mm).
To determine the optimal regression model, linear (first-order), quadratic (second-order), and cubic (third-order) polynomial fittings were performed. The coefficient of determination () was adopted as the evaluation metric [], and its calculation is given in Equation (7).
where denotes the regression sum of squares, the total sum of squares, and SSE the residual sum of squares, with , is the number of experimental samples, represents the predicted value, the mean value, and the observed value.
The fitting results show that the coefficient of determination was for the linear polynomial fitting, for the quadratic fitting, and for the cubic fitting, and the corresponding results are summarized in Table 6.
Table 6.
Coefficients of determination R2 for different models.
Specifically, the linear model explains approximately 93% of the variance, the quadratic model improves slightly to 94%, while the cubic model approaches 99%, providing a more accurate characterization of the nonlinear relationship between RMS and ride comfort. The fitted curves of the three models are plotted in Figure 12.
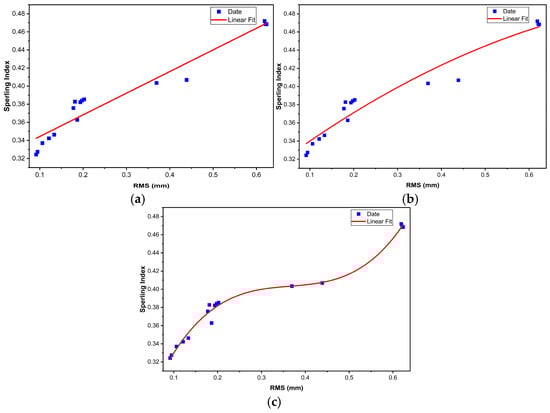
Figure 12.
Fitting curves between RMS and the Sperling index. (a) Linear polynomial fitting; (b) Quadratic polynomial fitting; (c) Cubic polynomial fitting.
As shown in Figure 12, the linear polynomial fitting curve exhibits an overall monotonic increasing trend without reflecting any apparent threshold. The quadratic polynomial fitting curve shows slight curvature, but the variation is limited and insufficient to capture abrupt changes. In contrast, the cubic polynomial fitting curve demonstrates a “gentle–steep” progression, forming a clear S-shaped inflection and successfully capturing the trend of accelerated deterioration.
In addition to the comparative analysis of first-, second-, and third-order polynomial nonlinear regression models, this study further tested exponential and logarithmic fitting models to verify the superiority of the nonlinear mapping approach. The results show that the exponential model yields R2 = 0.9615, while the power-law model yields R2 = 0.9048, both significantly lower than that of the cubic polynomial fitting (R2 = 0.9898). The corresponding results are summarized in Table 6.
Meanwhile, to compare the fitting performance with a more advanced nonlinear model and further demonstrate the superiority of the finally selected model, an SVR model with a radial basis function (RBF) kernel was constructed by using the RMS index as the input feature and the Sperling index Wz as the output variable. A standard workflow consisting of data standardization, SVR fitting, and hyperparameter tuning via grid search combined with five-fold cross-validation was adopted to optimize the penalty parameter C, the kernel parameter γ, and the insensitive loss parameter ε, leading to the optimal combination C = 1000, γ = 0.1, and ε = 0.01. With these hyperparameters, the SVR model retrained on the entire dataset achieves a coefficient of determination of R2 = 0.9692, and the corresponding results are summarized in Table 6.
The coefficient of determination R2 ranges from 0 to 1, and values closer to 1 indicate better goodness of fit. As shown in Table 6, the cubic polynomial model and the SVR model exhibit substantially better fitting performance than the other candidate models. However, the SVR model does not provide a concise, standardized analytical expression; its predictions rely on a large number of support vectors, which makes it less interpretable from an engineering point of view. In contrast, the cubic polynomial model yields a clear and easily interpretable explicit expression that explicitly reveals the threshold position of joint straightness, and is therefore more straightforward and convenient to use for maintenance decision-making.
In summary, a cubic polynomial nonlinear regression model was selected, and the resulting Equation (8) is given as:
4.2.2. Significance and Robustness Tests of the Model
- Significance test
To verify the robustness and stability of the fitting model, a significance test was performed on the cubic polynomial nonlinear regression model. The significance test evaluates the model by analyzing the -statistic and its corresponding significance level (sig.) in the analysis of variance. A larger F value indicates a stronger effect of the independent variable on the dependent variable, while a more significant F value implies that the regression equation is more meaningful. Similarly, a smaller sig. value denotes higher model significance []. The governing Equation (9) is expressed as follows:
where denotes the number of independent variables.
The calculation result is as follows: . This result indicates that, although overfitting is to some extent unavoidable, the nonlinear model established between RMS and the Sperling index in this study is statistically significant, and the regression relationship is meaningful.
- 2.
- Robustness test
To quantitatively assess and confirm that the high R2 is not an artifact of overfitting, the robustness of the cubic polynomial model was further examined. A leave-one-out cross-validation (LOOCV) procedure was applied to the sample data. In each iteration, the cubic polynomial model was fitted using 15 out of the 16 samples, and the remaining sample was then predicted by the obtained model to yield its Sperling index. Based on all the predicted and measured values, the LOOCV coefficient of determination and root-mean-square error (RMSE) were subsequently calculated.
The results show that R2(LOOCV) = 0.9854 and RMSE(LOOCV) = 0.0057. Compared with the coefficient of determination obtained from the full-sample fitting, the LOOCV decreases only slightly, while the RMSE remains at a very low level. This indicates that the cubic polynomial model maintains good predictive performance on “unseen” data and that its high R2 is not merely due to severe overfitting. Under the current sample conditions, the established cubic polynomial model can therefore be regarded as statistically meaningful, and the nonlinear mapping between RMS and the Sperling index exhibits satisfactory robustness.
4.2.3. Analysis of Fitting Results and Threshold
The fitting results indicate that the model achieves high accuracy and reveal that RMS ≈ 0.4 mm represents a critical threshold for significant changes in ride comfort: beyond this value, ride comfort exhibits a rapidly deteriorating nonlinear effect. As the severity of joint irregularities increases, comfort shows a distinct nonlinear decline, with the deterioration becoming more pronounced once the threshold is exceeded. In engineering practice, passengers can generally tolerate minor irregularities, but once this threshold is surpassed, ride comfort decreases sharply.
Furthermore, the proposed model can not only be used to predict the impact of different joint qualities on ride experience but also provides a theoretical basis for track maintenance and comfort optimization. In the future, this fitting model could be embedded into track inspection systems to enable automated evaluation and early warning of joint-related comfort issues, thereby offering data support for maintenance decision-making.
5. Discussion
This study verified, through the combination of long-term field measurements and numerical simulations, that a strong nonlinear correlation exists between the RMS index of rail joint straightness and the Sperling index of ride comfort. The results demonstrate that even a slight deterioration in rail joint straightness can cause a nonlinear decline in passenger comfort. This trend is consistent with the findings of Wawryszczuk et al. [] and Dumitriu [], who investigated ride comfort based on ISO 2631 and EN 12299 standards. The key distinction, however, lies in the fact that the present study directly explores the relationship between rail joint straightness and passenger comfort from the perspective of long-term monitoring, revealing the critical role of geometric straightness variation in comfort degradation. In addition, Grossoni et al. [] reported a correlation between joint geometry and peak impact forces, which is also confirmed by the results of this study. Therefore, the proposed measurement–simulation–mapping methodology proves to be both feasible and effective. Moreover, compared with previous studies, this work presents an innovative contribution by conducting long-term monitoring on a newly constructed railway line and establishing a cubic polynomial fitting model to describe the relationship between rail joint straightness and passenger comfort under various operating conditions, effectively capturing their nonlinear interdependence.
Meanwhile, most existing engineering guidelines specify the permissible limits of high-speed railway track geometry by constraining the peak values of vertical irregularities within different wavelength bands, and these limits are primarily aimed at ensuring safety, running stability, and overall track quality. For example, the European EN 13848 series defines the minimum requirements for track geometry quality levels and prescribes safety-related limits for each geometric parameter, which essentially indicate the maximum allowable geometric deviations under different speed ranges and wavelength intervals []. In China, the “Maintenance Rules for High-Speed Railway Lines” issued by the National Railway Administration also stipulate the scope of maintenance work, the main operational requirements, and the maintenance criteria for high-speed railway infrastructure, with a primary focus on controlling the global track geometry quality. These standards are generally concerned with the global quality of track geometry. In contrast to such engineering guidelines, the present study focuses on proposing a ride-comfort-oriented RMS threshold for individual rail joints. Based on the mapping between joint straightness and ride comfort established in this work, and using the cubic polynomial regression model, the results indicate that an RMS value of approximately 0.4 mm at the joint can be regarded as a “critical threshold” at which ride comfort begins to deteriorate significantly. This threshold reflects the level of local joint straightness under the investigated line and operating conditions at which the Sperling index starts to exceed the target range and passenger comfort shows a noticeable degradation. It should be emphasized that this comfort-based threshold is not intended to replace the existing track geometry standards, but rather to complement them: in practical engineering applications, it can provide a more refined basis for joint rectification and early warning on high-speed lines where ride comfort is a key performance requirement.
However, this study still has certain limitations. Due to measurement constraints and restricted access during maintenance windows, the number of measurement samples analyzed in this work is limited, making overfitting to some extent unavoidable. Although various operating conditions were selected for measurement, the range remains relatively narrow, and the effects of vehicle load, running speed, and train type have not been systematically investigated. Moreover, the validation process primarily relied on UM multibody dynamic simulations without incorporating direct subjective comfort assessments from passengers, which may lead to discrepancies between objective and subjective evaluations.
In future work, the measurement database will be further expanded by incorporating field test data from different lines, joint configurations, and wheel–rail contact conditions, including highly asymmetric joint cases, so that the relationship between joint straightness and ride comfort can be validated over a broader range of applications. Repeated validations will be carried out under different regions, track structures, and operating conditions to enhance the adaptability and engineering applicability of the proposed model. In addition, more advanced machine-learning-based models for long-term comfort prediction will be further explored, with the aim of achieving intelligent, life-cycle monitoring of rail joint conditions.
6. Conclusions
This study systematically investigated the relationship between rail joint straightness and ride comfort. By combining long-term field measurements with numerical simulations, the root mean square index of rail joint straightness was extracted. A vehicle–track dynamic model was established in UM software to calculate vertical acceleration and subsequently derive the Sperling comfort index. Finally, a cubic polynomial fitting model was constructed to reveal the quantitative relationship between the RMS of rail joint straightness and the Sperling comfort index. The main conclusions are as follows:
Long-term measurements were conducted at the rail joints before and after Turnout No. 201 on a newly constructed high-speed railway in China, covering multiple operating conditions, including pre- and post-grinding, pre- and post-commissioning, pre- and post-commercial operation, and extreme weather. By applying preprocessing methods such as filtering and alignment, the evolution characteristics of joint straightness at different stages were analyzed. The results show that: prior to grinding, distinct bulges and severe waveform fluctuations existed at the joints; after grinding, the waveforms became significantly smoother; during the commissioning stage, repeated wheel loading produced a self-grinding effect with only minor waveform changes; after official operation, the overall profiles became smoother, though slight irregularities remained, indicating that rail joints should remain a focus in subsequent maintenance.
Based on UM vehicle dynamics simulations, a vehicle–track coupled model was developed, with measured straightness data imported as inputs. The vertical acceleration responses and the corresponding Sperling indices were obtained for different joint conditions. By extracting and comparing the RMS characteristic values of the joints, a significant mathematical relationship was identified between rail joint straightness and ride comfort.
On this basis, linear, quadratic, and cubic polynomial models were employed to fit the relationship between RMS and the Sperling index. A comparison of the fitting results shows that the cubic polynomial model achieved the highest accuracy, with a coefficient of determination (R2) of approximately 0.99, which is significantly better than the linear and quadratic models. The fitted curve further revealed a critical threshold at RMS ≈ 0.4 mm: once RMS exceeds this value, the Sperling index rises sharply, and ride comfort deteriorates significantly.
Author Contributions
Conceptualization, P.L.; methodology, P.L.; formal analysis, L.W.; data curation, Z.H.; writing—original draft preparation, L.W.; writing—review and editing, L.W., C.L., X.S. and Z.L.; visualization, L.W.; project administration, X.S.; funding acquisition, P.L. All authors have read and agreed to the published version of the manuscript.
Funding
This work was supported by the National Natural Science Foundation of China (51608317), International Joint Laboratory for China-Laos Railway Engineering (21210750300) and Science and Technology Program of Jiangsu Administration for Market Regulation (KJ2026017).
Data Availability Statement
The datasets presented in this article are not readily available because they are part of an ongoing study.
Acknowledgments
The authors would like to thank the editor and reviewers for providing valuable review comments.
Conflicts of Interest
The authors declare no conflicts of interest.
Abbreviations
The following abbreviations are used in this manuscript:
| UM | Universal Mechanism |
| RMS | Root mean square |
References
- Choi, J.-Y.; Yun, S.-W.; Chung, J.-S.; Kim, S.-H. Comparative Study of Wheel–Rail Contact Impact Force for Jointed Rail and Continuous Welded Rail on Light-Rail Transit. Appl. Sci. 2020, 10, 2299. [Google Scholar] [CrossRef]
- Gao, Y.; Wang, P.; Wang, K.; Xu, J.; Dong, Z. Damage Tolerance of Fractured Rails on Continuous Welded Rail Track for High-Speed Railways. Railw. Eng. Sci. 2021, 29, 59–73. [Google Scholar] [CrossRef]
- Xiao, Y.; Liu, J.; Yang, H.; Jiang, S.; Yuan, B.; Yang, P. Study on Flatness and Straightness Measurement Algorithm of Non-Contact Rail Type Large Components. J. Metrol. 2020, 39, 56–59. [Google Scholar] [CrossRef]
- Li, S. Research on the Design and Error Analysis and Performance Experiment of Steel Rail Level Straightness Detector. Master’s Thesis, Xi’an University of Technology, Xi’an, China, 2023. [Google Scholar]
- Tian, T. Straightness Optimization Research on Rail Welded Joint of High-Speed Railway. Master’s Thesis, China Academy of Railway Sciences, Beijing, China, 2018. [Google Scholar]
- Zhong, H. Study on Irregularity of Rail Welded Joints Based on Flash Welding and Aluminothermic Welding. Mech. Eng. Autom. 2022, 3, 143–145. [Google Scholar]
- Xiao, X.; Xu, H.; Yang, Y.; Chen, P.; Hu, Q. Analysis of the Influence of Track Irregularity on High-Speed Train Ride Comfort. Veh. Syst. Dyn. 2024, 62, 1658–1685. [Google Scholar] [CrossRef]
- La Placa, A.; Freddi, F.; Giuliani, F. Monitoring of Insulated Rail Joints Based on Gap Value Measurement. Urban Rail Transit 2024, 10, 28–41. [Google Scholar] [CrossRef]
- Shi, Y.; Wang, Y.; Liu, X.; Wang, P. Comparison Study on Measurement of Rail Weld Joint between Inertial Reference Method and Multi-Point Chord Reference Method. Railw. Sci. 2024, 3, 69–83. [Google Scholar] [CrossRef]
- Wawryszczuk, R.; Kardas-Cinal, E. Analysis of Ride Comfort in Selected Types of Rail Vehicles. J. Konbin 2021, 51, 67–84. [Google Scholar] [CrossRef]
- Sekulić, D.; Dedović, V.; Jovanović, M.; Banić, M.; Simeunović, N.; Madić, M. Definition and Determination of the Bus Oscillatory Comfort Zones. Int. J. Ind. Ergon. 2016, 53, 328–339. [Google Scholar] [CrossRef]
- Dižo, J.; Blatnický, M.; Gerlici, J.; Leitner, B.; Melnik, R.; Semenov, S.; Mikhailov, E.; Kostrzewski, M. Evaluation of Ride Comfort in a Railway Passenger Car Depending on a Change of Suspension Parameters. Sensors 2021, 21, 8138. [Google Scholar] [CrossRef]
- Bakinowski, Ł.; Firlik, B.; Czerwiński, A. Influence of the Type of Place Occupied by a Tram Passenger on the Ride Comfort. Arch. Transp. 2022, 62, 7–26. [Google Scholar] [CrossRef]
- Deng, C.; Zhou, J.; Thompson, D.; Gong, D.; Sun, W.; Sun, Y. Analysis of the Consistency of the Sperling Index for Rail Vehicles Based on Different Algorithms. Veh. Syst. Dyn. 2021, 59, 313–330. [Google Scholar] [CrossRef]
- Peng, Y.; Wu, Z.; Fan, C.; Zhou, J.; Yi, S.; Peng, Y.; Gao, K. Assessment of Passenger Long-Term Vibration Discomfort: A Field Study in High-Speed Train Environments. Ergonomics 2022, 65, 659–671. [Google Scholar] [CrossRef]
- Zhou, Y.; Chen, S. Vehicle Ride Comfort Analysis with Whole-Body Vibration on Long-Span Bridges Subjected to Crosswind. J. Wind Eng. Ind. Aerodyn. 2016, 155, 126–140. [Google Scholar] [CrossRef]
- Yakovenko, Y.; Voichyshyn, Y.; Horbay, O. Analysis of Thermal Comfort Models of Users of Public Urban and Intercity Transport. Ukr. J. Mech. Eng. Mater. Sci. 2022, 8, 67–74. [Google Scholar] [CrossRef]
- Wawryszczuk, R.; Kardas-Cinal, E.; Lejk, J.; Sokołowski, M. Methods of Passenger Ride Comfort Evaluation—Tests for Metro Cars. Sensors 2023, 23, 5741. [Google Scholar] [CrossRef]
- Grossoni, I.; Iwnicki, S.; Bezin, Y.; Gong, C. Dynamics of a Vehicle–Track Coupling System at a Rail Joint. Proc. Inst. Mech. Eng. Part F J. Rail Rapid Transit 2014, 229, 364–374. [Google Scholar] [CrossRef]
- Li, G.; Yao, Y.; Ding, W. Modeling and Simulation Analysis of Vehicle–Track Coupling Dynamics. J. Lanzhou Jiaotong Univ. 2016, 35, 142–146. [Google Scholar] [CrossRef]
- Wang, M.; Li, P.; Li, S.; Yu, T.; Zhang, Z.; Zeng, Y.; Feng, N.; Yang, K.; Chen, C. A Refined Track Dynamic Model Considering the Bending Properties of Iron Pad: Proposal and Validation. Eng. Fail. Anal. 2024, 165, 108780. [Google Scholar] [CrossRef]
- Li, P.; Wang, M.; Yu, T.; Feng, N.; Lan, C.; Yang, K.; Li, S.; Zhang, H. A Monitoring Method of Rail Fastener Reaction Force Based on Iron Pad Strain. Constr. Build. Mater. 2024, 418, 135169. [Google Scholar] [CrossRef]
- Yang, F.; Li, G.; Liu, J.; Sun, S. Research on the Maximum Amplitude of Preset Test for High-Speed Railway Track Irregularity. Railw. Constr. 2011, 7, 112–115. [Google Scholar]
- Liu, J. Diagnosis and Evaluation Method for Periodic Geometric Irregularities of Railway Track. Railw. Constr. 2016, 7, 1–5. [Google Scholar] [CrossRef]
- Yang, F.; Zhao, G.; You, M.; Liang, X.; Jin, H.; Li, D. Research on Identification and Early Warning Model for Track Slab Arch Based on Variation Characteristics of Longitudinal Irregularity. J. China Railw. Soc. 2021, 43, 106–116. [Google Scholar] [CrossRef]
- Zhan, D.; Yu, L.; Xiao, J.; Chen, T.; Zhang, D. Study on Global Calibration Approach of Multiple Vision Sensors for Railway Track Profile Measurement. J. China Railw. Soc. 2016, 38, 87–95. [Google Scholar] [CrossRef]
- Zhan, D.; Yu, L.; Xiao, J.; Chen, T. Study on High-Accuracy Vision Measurement Approach for Dynamic Inspection of Full Cross-Sectional Rail Profile. J. China Railw. Soc. 2015, 37, 96–106. [Google Scholar]
- Zhang, L. Research on Train Load Transfer Characteristics and Mechanism in Ballastless Track of High-Speed Railway. Ph.D. Thesis, Beijing Jiaotong University, Beijing, China, 2020. [Google Scholar] [CrossRef]
- Song, P. Coupled Vibration Simulation Analysis of High-Speed Train–Simply Supported Beam Bridge. Master’s Thesis, Shijiazhuang Tiedao University, Shijiazhuang, China, 2019. [Google Scholar] [CrossRef]
- Zhai, W.; Wei, K.; Song, X.; Shao, M. Experimental Investigation into Ground Vibrations Induced by Very High Speed Trains on a Non-Ballasted Track. Soil Dyn. Earthq. Eng. 2015, 72, 24–36. [Google Scholar] [CrossRef]
- Lan, C.; Liang, X.; Niu, X.; Yang, R.; Li, P. Research on Inversion of Wheel-Rail Force Based on Neural Network Framework. Eng. Struct. 2024, 304, 117662. [Google Scholar] [CrossRef]
- Lan, C. Research on Safety Evaluation Method of Ballastless Track of High-Speed Railway Based on Vehicle-Track Data Fusion. Master’s Thesis, Shanghai Institute of Technology, Shanghai, China, 2022. [Google Scholar] [CrossRef]
- Haji Abdulrazagh, P.; Hendry, M.T.; Gül, M.; Roghani, A.; Toma, E. Use of Measured Accelerations from a Passenger Rail Car to Evaluate Ride Quality and Track Roughness—A Case Study. Proc. Inst. Mech. Eng. Part F J. Rail Rapid Transit 2022, 236, 733–742. [Google Scholar] [CrossRef] [PubMed]
- Li, P.; Li, S.; Wang, M.; Zhang, Y.; Zhang, Z.; Cai, J.; Li, J.; Feng, N. A Damage Evaluation Method for Track Structures Based on Iron Pad Strain. Eng. Fail. Anal. 2025, 171, 109358. [Google Scholar] [CrossRef]
- Liu, H.; Deng, H. Optimization of Dehydration Process of Automatic Filter Press Based on Curve Fitting. Sci. Technol. Eng. 2023, 23, 542–549. [Google Scholar]
- Torres-Hernandez, A.; Ramirez-Melendez, R.; Brambila-Paz, F. Proposal for the Application of Fractional Operators in Polynomial Regression Models to Enhance the Determination Coefficient R2 on Unseen Data. Fractal Fract. 2023, 9, 393. [Google Scholar] [CrossRef]
- EN 13848-5:2017; Railway Applications—Track—Track Geometry Quality—Part 5: Geometric Quality Levels—Plain Line, Switches and Crossings. European Committee for Standardization (CEN): Brussels, Belgium, 2017.
Disclaimer/Publisher’s Note: The statements, opinions and data contained in all publications are solely those of the individual author(s) and contributor(s) and not of MDPI and/or the editor(s). MDPI and/or the editor(s) disclaim responsibility for any injury to people or property resulting from any ideas, methods, instructions or products referred to in the content. |
© 2025 by the authors. Licensee MDPI, Basel, Switzerland. This article is an open access article distributed under the terms and conditions of the Creative Commons Attribution (CC BY) license (https://creativecommons.org/licenses/by/4.0/).