Abstract
This paper evaluates Advanced Driver Assistance Systems (ADASs) in test scenarios derived from naturalistic driving and crash data, mapped to ISO 26262, ISO/PAS 21448 (SOTIF), and ISO 34502. From eight high-risk scenarios, it is validated for left turns across oncoming traffic on a proving ground using a Škoda Superb iV against a soft Global Vehicle Target. ODD and spatiotemporal thresholds are parameterized and speed/acceleration profiles from GNSS/IMU data are analyzed. AEB and FCW performance varies across nominally identical runs, driven by human-in-the-loop variability and target detectability. In successful interventions, peak deceleration reached −0.64 g, meeting UNECE R152 criteria; in other runs, late detection narrowed TTC below intervention thresholds, leading to contact. Limitations in current protocols are identified and argue for scenario catalogs with realistic context (weather, surface, masking) and latency-aware metrics. The results motivate extending validation beyond standard tracks toward mixed methods linking simulation, scenario databases, and instrumented field trials.
1. Introduction
ADAS and increasing automation promise to mitigate human-error crashes, but their real-world effectiveness depends on the operational design domain (ODD). Compared with proving-ground tests, traffic environments are more variable and less predictable, so current validation protocols may miss relevant boundary conditions and overstate safety benefits.
We contribute (i) a scenario-based test procedure mapped to ISO 26262 [1], ISO/PAS 21448 (SOTIF [2]), and ISO 34502 [3], and (ii) an empirical application to a selected ADAS under controlled conditions. The workflow identifies relevant collision scenarios and evaluates vehicle dynamics with precise positioning (see Figure 1).
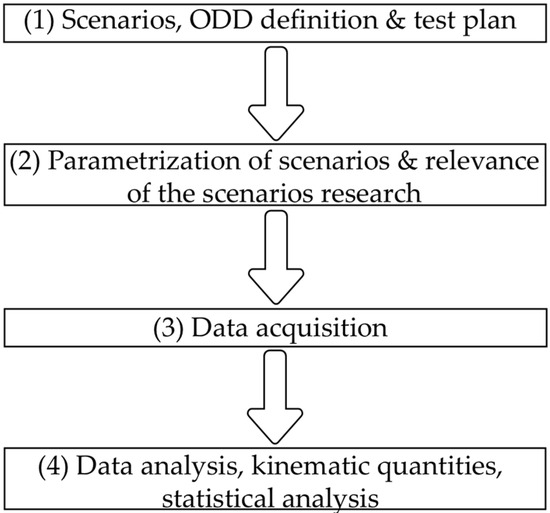
Figure 1.
Methodological diagram flowchart (Source: Author).
Section 2 reviews literature and standards; Section 3 specifies scenarios; Section 4 details experiments and data; and Section 5 reports results and discusses limitations. The subsequent chapter presents experimental measurements, including a description of the hardware and software used, test protocols, and data collection procedures. The concluding chapters deal with the statistical evaluation of results and a discussion of the implications of the identified limitations.
Clarifying ADAS limits in realistic scenarios can reduce crashes and inform technology-neutral regulation. Despite progress, fatalities remain high and real-world effectiveness is uncertain. A concise, data-driven view of reliability boundaries also supports industry adoption and policy, given the sector’s shift toward higher automation.
2. Literature Review
ADAS comprise perception, decision, and actuation aids aimed at reducing human-error crashes and improving comfort. Since 2024, EU Regulation 2019/2144 mandates selected systems (e.g., ISA, LKA, AEB) in new vehicles, bringing them under EU-wide type approval [4].
Following Vaculín et al. (2020), driver-assistance functions can be grouped into (i) comfort aids; (ii) information/warning; (iii) emergency interventions (e.g., AEB); and (iv) continuous-operation control (e.g., ACC) [5].
Evidence indicates meaningful benefits: broad ADAS deployment could cut thousands of crashes and dozens of fatalities annually, with strong effects for warning and AEB functions; LKA-equipped vehicles show substantially fewer fatal run-off-road crashes [4,6]. Research on vulnerable road users (VRUs) has indicated that second-generation pedestrian/cyclist detection reduces pedestrian collisions by 23% and cyclist crashes by 6%, although estimates are not yet statistically significant [7]. The long-term potential of large-scale automation has been illustrated through a nationwide multi-agent simulation for Japan, where a 50% share of automated vehicles with optimal driver trust yielded a 27% reduction in fatalities; over- or under-trust diminished benefits by up to 5 percentage points, underscoring behavioral adaptation as a key determinant [8].
In the Czech Republic, tens of thousands of crashes occur annually (see Figure 2) and 411 fatalities were recorded in 2024 (see Figure 3), indicating substantial scope for ADAS to reduce crash frequency and severity in support of Vision Zero. Globally, road deaths stabilized around 1.19 million in 2023 with large regional disparities [9]. Nationally, 527 fatalities were reported in 2022—a 14.6% decrease versus the 2017–2019 average—yet still 17th among 27 EU states; since 1990, mortality has fallen by 65%, though the previous National Strategy target to halve fatalities by 2020 was not achieved [10,11].
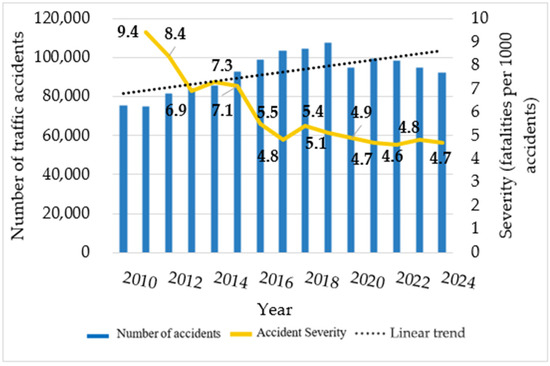
Figure 2.
Development of the number of fatalities from road traffic accidents in the Czech Republic, 2010–2024 (Source: Transport Research Centre, v.v.i.).
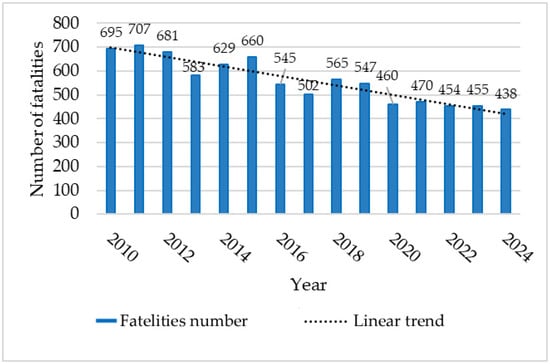
Figure 3.
Development of the number and severity of road traffic accidents in the Czech Republic, 2010–2024. Note: Severity is expressed as the number of fatalities per 1000 road traffic accidents (Source: Transport Research Centre, v.v.i.).
A key limitation for transferability in the cited simulation work is the homogenization of infrastructure parameters and calibration based solely on Japanese speed profiles [8].
The evolution of road safety in the Czech Republic reflects rapid post-1989 motorization, when a growing vehicle fleet and weak enforcement temporarily worsened crash rates. The introduction of the penalty-point system and harmonization with EU law later stabilized and reduced fatalities [10]. Building on this trend, the BESIP Strategy 2021–2030 adopted Vision Zero principles, targeting a 50% reduction in fatalities and serious injuries by 2030 and zero road deaths by 2050 [12].
Although long-term declines continue, progress has slowed and still lags behind the safest EU countries. Both passive and proactive factors—seat-belt use, speed compliance, and vehicle kinematics—remain decisive. The COVID-19 pandemic further highlighted how accident numbers flexibly follow traffic volume and the importance of behavioral influences on safety.
A retrospective study by Bucsuházy et al. [13] demonstrated that pandemic-related mobility restrictions in 2020–2021 temporarily reduced crash numbers, but drivers’ risk behavior remained unchanged. After the restrictions ended, traffic volumes and accident patterns rapidly returned to previous levels, as also confirmed by Gavrilov [14].
A temporary reduction in mobility alone has not been shown to deliver lasting safety gains, underscoring the need for adaptive, data-driven interventions [13,14]. A global meta-analysis (1990–2021) reported declines in population-adjusted fatal and severe injury risk but rising absolute fatalities in lower-income regions, with highest risk among men aged 15–49 and VRUs; potential biases stem from model-based traffic estimates and under-reporting of minor crashes [15].
The reliability and comparability of source data have been questioned due to heterogeneous crash definitions and severity granularity; standardizing automation labels in VIN and expanding EDR use were recommended, though findings were exploratory [16].
Evidence on ADAS safety benefits is broad but context-dependent. Second-generation VRU detection in claims data suggested a 12% overall collision reduction in relevant scenarios (23% pedestrians; 6% cyclists), albeit without statistical significance due to sparse events [7]. Patterns in AV–VRU crashes highlighted hazardous combinations of low AV speed, reduced visibility, and unlawful cyclist behavior, with limits on geographic scope and exposure metrics [17]. Scenario-based projections for Austria indicated sizable potential reductions from warning/AEB and ISA, while emphasizing uncertainty from assumptions about penetration and user behavior [4].
Naturalistic fleet data associated warning ADAS with rapid decreases in alerts and aggressive-driving indicators, with clear contextual effects [18]. Simulation studies identified risk-elevating highway geometries (e.g., ~1000 m curves with 1–3% downgrade) [19] and suggested optimal AV penetration around 50–70% at skewed intersections, beyond which safety can deteriorate; connectivity benefits were non-linear and in some cases conventional control performed better [20]. Empirically, AVs exhibited higher struck-from-behind rates per mile than human-driven vehicles, narrowing in urban segments, consistent with conservative AV profiles provoking surrounding drivers [21]. At network scale, higher AV penetration reduced conflicts and severity, but the mixed-traffic transition increased variability, reinforcing the need for infrastructure adaptation and active management [22]. A centralized scenario database has been proposed, though coverage and IP governance remain open issues; complementary national initiatives were noted [23,24]. Scenario Factory 2.0 demonstrated rapid, controllable criticality generation with preserved macroscopics and sub-3 s runtime, while depending on map conversions, agent support, and calibration for transferability [25].
Quantitative complexity metrics have been introduced to prioritize critical cases at scale, improving agreement with expert assessments, yet requiring calibration and showing limits in certain environments and actor sets [26].
Analytical and verification research from a vehicle-dynamics perspective has established safe-set methods for longitudinal control under uncertainties and delays (Kianfar et al.) [27], online reachability checks for collision-free planning (Althoff & Dolan) [28], and the statistical infeasibility of proving AV safety superiority by real-world mileage alone, motivating combined digital verification, scenario-based testing, and targeted on-road exposure [29].
Regulatory milestones define fitment and approval conditions for driver-assistance/automated functions and serve here as methodological boundaries rather than objects of legal analysis: Regulation (EU) 2019/2144; UN R152 and UN R157; ISO 19206:2018 (Regulation (EU) 2019/2144; UNECE, 2020; UNECE, 2024). In brief, AEB reference conditions include standardized surrogate specifications and environmental envelopes, with minimum commanded deceleration (≥5 m/s2) and operational constraints that inform low-speed AEB evaluation; detailed procedures are referenced to the cited documents.
Regulatory and consumer-testing protocols provide the procedural baseline for AEB/ADAS evaluation and scenario-based proving-ground assessment, ensuring comparability and repeatability while not fully covering real-world context (e.g., masking/occlusion, weather/surface variability) [3,30,31]. In this study, the standards relevant to analysis and methods have been limited to ISO 26262, ISO/PAS 21448 (SOTIF), and ISO 34502, with UNECE R152 and Euro NCAP used as reference envelopes for low-speed AEB conditions.
Consumer programs (NCAPs) complement type approval by assessing AEB/ISA/LKA with comparable criteria (UNECE/NHTSA/JARI guidance adopted by Euro NCAP and others). Procedures vary across regions; our comparisons refer to Euro NCAP, whose robot-assisted tests with precise positioning offer higher repeatability.
Euro NCAP evaluates AEB in three domains—City, Inter-Urban, and Pedestrian—but focuses on limited canonical scenarios and omits driver behavior, supporting comparability yet under-representing real-world variability [5].
Related initiatives inform scenario description and safety criteria—ASAM OpenSCENARIO (dynamic content), AVSC and CAMP-AVR (practices and test methods), PEGASUS/CETRAN/ENABLE-S3 (validation ecosystems), and IIHS/HLDI (real-world effectiveness) [32,33,34,35,36].
The entire ecosystem of technical standardization is further supported by the SAE ORAD committee (Society of Automotive Engineers On-Road Automated Driving), which continuously publishes standards and recommended practices for the verification of automated driving. A similar effort toward systematic and transparent validation is also evident in the Czech context. The development of transport automation in the Czech Republic has been supported both by the creation of a catalog of testing areas on selected sections of public roads (Transport Research Centre [37]), and by the approval of the Strategic Autonomous Mobility Plan 2030, in which the state has declared its ambition to position itself as a regional center for research and testing [24].
Recent national amendments enabling Level-3 operation on designated roads complement international standardization; we note them for context but do not analyze legal impacts here [38].
Taken together, these studies and standards show that ADAS and autonomous vehicles deliver safety benefits in both empirical measurements and simulation. However, the magnitude of the effect varies significantly depending on the technological generation, penetration level, and specific operational context. This variability confirms the current absence of a unified and sufficiently universal methodology that would, across all system categories and automation levels, clearly define representative scenarios, evaluation criteria, and boundary parameters.
Differences in the approaches of individual manufacturers and legislative jurisdictions complicate the comparability of results and slow the deployment of innovative solutions.
Key tasks that continue to require verification include maintaining safe following distances across different speed regimes, reliable detection of obstacles and vulnerable road users, rapid response to sudden changes in surrounding dynamics, robust navigation across infrastructural variability, correct interpretation of traffic signs and signals, the handling of emergency maneuvers, and reliability under adverse weather conditions. Cybersecurity also remains a critical factor. Although verification and standardization procedures are progressing rapidly, their implementation remains fragmented. The absence of an internationally accepted framework for scenario-based testing thus creates an opportunity for a research contribution that integrates formal methods, extensive experimental datasets, and a systemic perspective on safety. The following chapters of this work therefore provide a detailed synthesis of the approach outlined in the introduction, with the aim of contributing to safer and more sustainable road transport.
3. Genesis and Parameterization of Testing Scenarios
The genesis and parameterization of traffic scenarios represent a key step in the research and validation of advanced driver-assistance systems (ADAS) and automated driving functions. In this study, a multi-source strategy was adopted, combining regulatory frameworks (Euro NCAP, UNECE VMAD), real-world accident analysis (CzIDAS project), and telemetric data from naturalistic drives. This approach enabled the creation of a library of eight representative scenarios that reflect both their high frequency of occurrence in road traffic and their potential to trigger critical interactions between participants. At the same time, requirements for compatibility with international validation standards (e.g., ISO 34502, ASAM OpenSCENARIO) were respected.
For the construction of the scenarios, methodological rules were established with the aim of ensuring repeatability and objectivity. The basic principles included (i) isolation of test variables to eliminate interference; (ii) clear characterization of the environment with emphasis on reproducibility of conditions; (iii) parameterization with regard to a “reasonable degree of worst-case scenarios”; and (iv) a multi-level approach in which low-level scenarios define the boundaries for more complex system-level tests. The resulting library covers the full spectrum of high-risk interactions—from intersection maneuvers and conflicts with cyclists and pedestrians to less frequent parking and evasive situations (see Table 1 and Table 2).

Table 1.
Overview table of identified vehicle–vehicle interaction scenarios (Source: Author).
Table 2.
Overview table of identified vehicle–VRU interaction scenarios (Source: Author).
Each scenario was described using a uniform structure that included the test objective, characterization of the actors (vehicles, vulnerable road users, traffic infrastructure), geometry and initial conditions, specification of the operational design domain (ODD), and the expected behavior of the systems under test. This uniformity ensured not only comparability across scenarios but also their applicability in the broader context of simulation studies and proving-ground experiments. From a traffic safety perspective, intersection situations emerged as the most critical group.
Analyses of accident databases and prior studies show that left-turn conflicts across oncoming traffic are among the most severe. Among the eight predefined scenarios, the CC-I-LTAP was selected for experimental validation because it represents one of the most safety-critical and technically demanding situations for Advanced Driver Assistance Systems. This configuration typically combines high crash severity due to angular impact geometry with short time-to-collision intervals, creating a complex perception and decision-making challenge for sensor-fusion architectures. Furthermore, LTAP-OD conflicts are among the most frequent causes of severe injury crashes in urban environments and have high relevance for the verification of AEB and forward-sensing systems.
In contrast to other well-established and extensively validated scenarios—such as those involving Vulnerable Road Users (VRUs), longitudinal car-following, or pedestrian crossing events—the CC-I-LTAP case has received limited experimental attention in proving-ground and simulation-based testing. This gap underscores the need for deeper empirical validation and methodological refinement. This scenario, designated as CC-I-LTAP (Car-to-Car Intersection—Left Turn Across Path), was therefore selected as the central case for further experimental validation. The CC-I-LTAP scenario models a situation in which the vehicle under test (VUT) makes a left turn at an intersection and enters the lane of an oncoming vehicle that, from the left arm of a T-intersection (from the VUT’s perspective), is also turning left in an aggressive manner (see Figure 3).
The criticality of the situation arises from the combination of relatively high speeds, limited spatial margins, and the need for rapid response from detection systems and decision-making logic.
From a test-methodology perspective, the scenario was adopted and further developed from the Euro NCAP protocol. For experimental validation, the ZalaZone proving ground infrastructure was selected, where the intersection section was constructed with precisely defined geometry and physical parameters (lane width 3.5 m, turning radius 8 m, asphalt surface with an adhesion coefficient of 0.82). The scenario was tested at several speed levels (10, 15, and 20 km/h), with detailed analyses focused on the intermediate value of 15 km/h. The Škoda Superb iV was equipped with standard FCW and AEB systems, while the oncoming vehicle was simulated using a soft Global Vehicle Target (GVT).
From a road safety perspective, the CC-I-LTAP scenario has high relevance. It not only reflects one of the most hazardous categories of real-world crashes but also enables the testing of sensor fusion and decision-making algorithms under conditions where vehicle paths intersect at relatively high speeds. Nevertheless, the representation of this initial layout type in the HADN accident database was insufficient for further assessment, and the dataset was therefore expanded to encompass the entire category of two-passenger-vehicle intersection collisions with varying initial and final positions. In total, this accounted for 162 cases, representing 7.09% of all accident types. At the same time, this share constituted 42.19% of all crashes included in the relevant accident group. Within this group of crashes—covering collisions between two passenger vehicles entering an intersection from adjacent arms—the variable day_of_week proved to be statistically significant (see Figure 4). A chi-square test confirmed that the distribution of these accidents across days of the week differed markedly from that of the remainder of the dataset. The highest proportions were observed on Thursdays and Saturdays, where the occurrence of such accidents was above average. By contrast, Mondays and Sundays showed lower frequencies than would be expected from the overall distribution (see Figure 5).
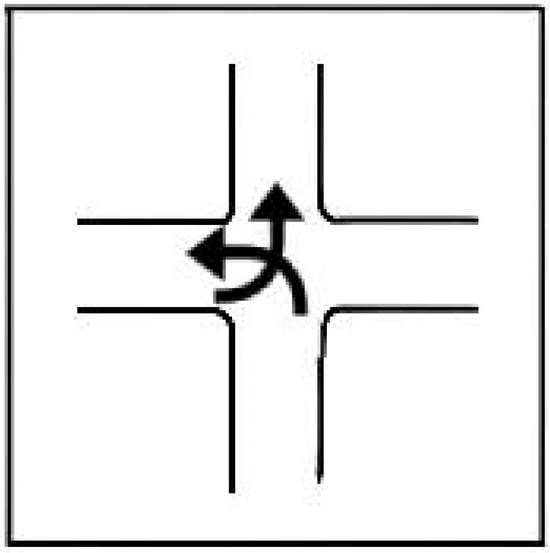
Figure 4.
Schematic representation of a left-turn collision (Source: Author).
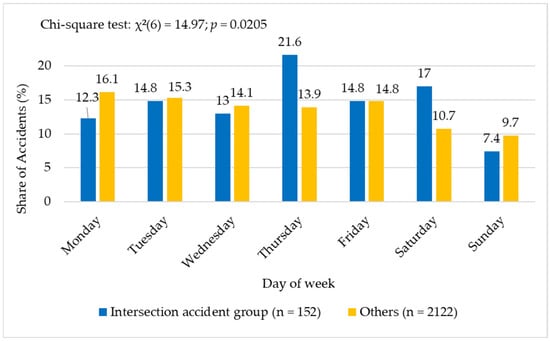
Figure 5.
Proportion of accidents by variable day of week: compared with other accident groups (Source: Author).
Based on these results, a new binary variable risky day was created for the purposes of regression analysis, which distinguishes between so-called critical days (Thursday and Saturday) and other days of the week (see Figure 6).
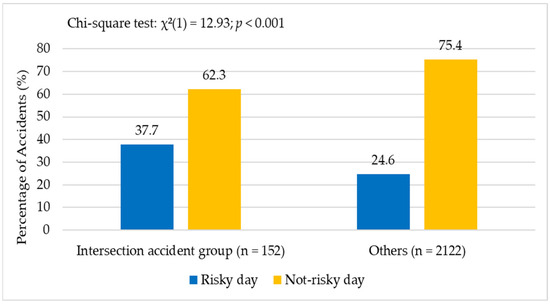
Figure 6.
Share of accidents by variable risky day: intersection accident group compared to other groups (Source: Author).
In the case of the intersection accident group, the modeling procedure was divided into several steps. In the first step, a baseline model was constructed that included only the variables identified as statistically significant based on prior chi-square tests. In this case, the key variable was risky days which distinguish Thursday and Saturday as days with an above-average frequency of such accidents. The model was then expanded with contextual variables that could influence the probability of the accident type: weather, road condition, time of day (light/dark), location, and day phase. In the final step, a potential interaction between weather and road condition was tested by including an interaction term in the third model. The results of the regression models show that the probability of an accident belonging to the intersection accident group is significantly influenced by the day of the week. Risk days (Thursday and Saturday) increase the likelihood of this type of accident. In the extended model, adverse weather and poor road conditions also emerged as significant predictors. Although these two variables are related—even if the VIF factor did not indicate multicollinearity, their association (Cramer’s V = 0.405) is moderately strong, which may explain the fluctuation of significance when included separately or jointly in the model. Both variables become statistically significant only when included simultaneously. Due to the potential interaction between adverse weather and road condition, a model with an interaction term was also tested.
However, this effect was not statistically significant, suggesting that the two factors act additively rather than synergistically. Adverse weather therefore remains a predictor of increased probability of accidents in the intersection accident group even in this model. Figure 7 illustrates the results of the logistic regression in terms of predicted probabilities rather than log-odds. The estimates show the probability of an accident from the intersection accident group as a function of two key variables—weather and type of day of the week. The results clearly indicate that adverse weather (e.g., rain, fog, snow) increases the likelihood of this type of accident compared to clear weather (see Figure 7).
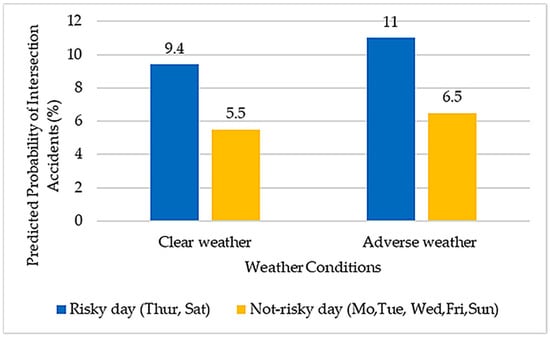
Figure 7.
Prediction of day_intersection accident group accidents based on key predictors (Source: Author).
4. Experimental Validation
Proving-ground tests used a Škoda Superb iV TS 115/1.4 A6F (M1 category), a five-door, five-seat passenger car measuring 4869 mm × 1864 mm × 1503 mm. The curb weight is 1730 kg, the total weight including standard equipment is 1789 kg, and the maximum permissible weight was set at 2250 kg. Propulsion is provided by a four-stroke spark-ignition engine with OHV valve timing, supplemented by a plug-in hybrid system enabling external charging. The inline four-cylinder unit with a displacement of 1395 cm3 delivers a maximum net output of 115 kW at 5000 rpm, while the electric motor contributes up to 85 kW. Power transmission to the wheels is ensured by an automatic transmission, allowing a maximum speed of 225 km/h. Comfort and traction are supported by 215/55 R17 P4V tires. The declared electricity consumption is 136 Wh/km, which, given the traction battery capacity, allows for an all-electric range of up to 70 km. The Škoda Superb is equipped with a collision-prevention assistance system known as Front Assist, which includes forward collision warning (FCW) and autonomous emergency braking (AEB) functionalities. The system is designed to monitor the distance from vehicles ahead and to actively assist in braking in critical situations where the safe following distance is not maintained. Its primary purpose is to alert the driver to the risk of collision and, if necessary, to prevent the accident or mitigate its consequences. Upon detecting a collision threat, the driver is warned via visual symbols on the instrument cluster display and, in some cases, by an acoustic signal. If the driver does not react, the system automatically increases brake pressure and initiates braking. At speeds up to 30 km/h, automatic braking may occur even without prior warning.
Active braking can be interrupted by pressing the accelerator pedal or moving the steering wheel. In such cases, the brake pedal cannot be operated within its normal range due to increased pressure in the braking system. For the system to function correctly, traction control (ASR) must be activated and the vehicle speed must exceed 5 km/h. In pedestrian detection mode, the activation of the Front Assist system is required, with vehicle speeds between 5 and 60 km/h. The system may be limited or unavailable under certain conditions—for example, for approximately 30 s after start-up, when negotiating sharp curves, or when the Electronic Stability Control (ESC) system intervenes. The system is automatically activated each time the ignition is switched on. The driver has the option to deactivate it via the multifunction steering wheel or through the vehicle’s infotainment system. System functionality can also be negatively affected by contamination of the radar sensor. In such cases, Front Assist may become unavailable, which is indicated by an icon on the display. The pedestrian detection feature extends the functionality of Front Assist by enabling recognition of moving persons crossing the roadway. If a collision risk is detected at speeds between 5 and 30 km/h, the vehicle initiates automatic braking without prior warning. At speeds between 30 and 60 km/h, the driver is first warned, and if no response follows, automatic braking is initiated [39].
In the experimental measurements, a device known as the Guided Soft Target (GVT, see Figure 8), developed by Dynamic Research, Inc., was also used.
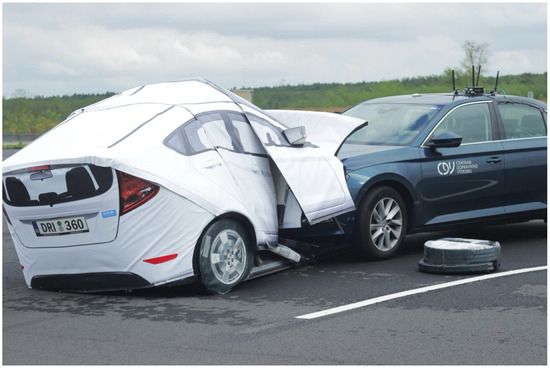
Figure 8.
Guided Soft Target (GVT) in the collision vehicle Škoda Superb iV during the test (Source: Author).
The system comprises two key components: (i) a Low-Profile Robotic Vehicle (LPRV) and (ii) the GVT impact element. The entire mechanism enables precise control of the target vehicle’s movement relative to the vehicle under test within a closed-loop control system. Its design allows impacts from any direction, making the device suitable for a wide range of pre-crash simulation scenarios [40]. For event recording during experimental measurements, three static tripod-mounted cameras and one onboard camera were consistently installed. As an external video source, a Panasonic HC-V250 model with a resolution of 2.51 megapixels in full HD quality was used.
For the experimental measurements, a set of measurement modules was integrated into the Škoda Superb iV in order to capture the dynamics of the entire system with the highest possible precision. An ADIS16488 inertial measurement unit (IMU) from Analog Devices, based on three-axis microelectromechanical accelerometers and gyroscopes, was employed, with outputs digitized at a sampling frequency of 1000 Hz. To ensure localization accuracy at the decimeter level, a dual-channel Septentrio AsteRx-m2 receiver with real-time differential corrections was deployed. All sensors were mounted using sensor standoff struts from AB Dynamics, selected for their ability to mechanically isolate vehicle body vibrations from sensitive measurement components. The standoff struts were designed with preloaded springs and an aluminum alloy structure, with their natural frequency deliberately placed above 50 Hz to eliminate resonance effects during rough-surface driving and accelerations exceeding 1 g. The mounting elements were installed between the vehicle floor and the roof frame.
5. Evaluations of Experimental Measurements
The experimental measurements were performed at three speed levels: 10, 15, and 20 km/h. Since no significant differences between the individual speed levels were found in the experimental measurement results, the analysis will continue to focus on the average value of 15 km/h. The 10–20 km/h window was selected to represent urban approach speeds typical for CC-I-LTAP conflicts and to remain within a safe operating envelope for the soft GVT surrogate and the proving-ground layout. At these speeds, TTC and closing-distance dynamics are comparable to Euro-NCAP “City” AEB conditions, while keeping sufficient margin to avoid surrogate damage and vehicle wear. Very low speeds (<10 km/h) provide limited discriminatory power because controller and wheel-speed quantization dominate timing, whereas higher speeds (>20 km/h) would require longer run-out zones and increase risk and cost without changing the underlying sensing logic under study. Each configuration was repeated three times (n = 3) to enable estimation of central tendency and dispersion and to support basic repeatability checks, while fitting within fixed track time and target requirements.
First, we will examine the speed profiles of all experimental runs (see Figure 9).
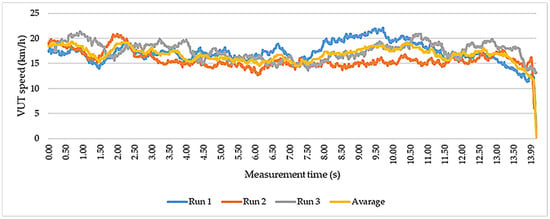
Figure 9.
Instantaneous speed of the VUT during three CC-I-LTAP runs at 15 km/h and the across-run average. AEB activation is visible in Runs 1 and 2 near the end of the record (Source: Author).
The graph shows instantaneous speeds for three runs (‘Run 1’, ‘Run 2’, ‘Run 3’) and the across-run average (‘Average’). At the start, Run 1 was ~17 km/h, Run 2 ~19 km/h, and Run 3 ~18.4 km/h. Run 2 remained the fastest and most stable, with limited variability and no large deviations. Run 1 followed a lower profile with a gradual speed decrease and larger local fluctuations. Run 3 tracked Run 2 initially, then converged toward Run 1 and fell below 18 km/h near the end. At the end of the record, Runs 1 and 2 showed AEB activation and braking to avoid a collision. In the second run, such activation did not occur, resulting in a collision of the test vehicle with the GVT. Overall, the data confirm that despite an identical experimental configuration, differences between individual runs emerged due to the VUT being driven by a human driver rather than a robotic system capable of ensuring identical trajectories across experimental runs. Run 2 reached an average speed 8–10% higher than Runs 1 and 3.
The summary distribution of values is illustrated in Figure 10 and Table 3, which, for each run, includes the set of mean values, the median, the interquartile range (IQR), extreme quartiles, and identified outliers. The median of Run 2 lies significantly higher than the medians of the other runs, reflecting an overall shift of the data distribution toward higher speeds (see Figure 10 and Table 3).
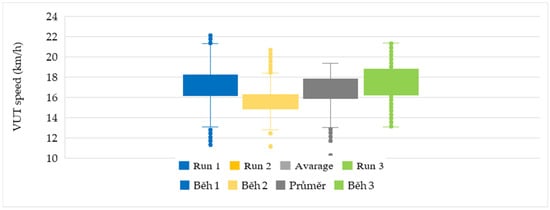
Figure 10.
Distribution of speeds by run (Source: Author).
Table 3.
Summary statistics for each run at 15 km/h in the CC-I-LTAP test (Source: Author).
At the same time, the width of the IQR for Run 2 is the smallest, confirming the relatively homogeneous nature of this run. In contrast, Runs 1 and 3 exhibit wider IQRs and a greater number of outliers, particularly at the lower end of the distribution, indicating increased variability and a more frequent occurrence of short-term decelerations. The ‘Average’ values lie between Runs 2 and 3; the median nearly matches the mean, indicating that row-based aggregation partly smooths extreme deviations. The overlap of the median and mean indicates that the aggregate measures are not strongly influenced by data asymmetry and that the resulting average system behavior is robust to local fluctuations. Furthermore, the figure shows that even after including mean values, the data variance remains primarily a function of the individual runs rather than of the aggregation method itself. This offers useful guidance for evaluating experimental repeatability and for optimizing future testing protocols.
A direct comparison of the mean speed data from all runs of the experimental testing with the most variable series, Run 3, reveals three characteristic differences. The “Average” curve starts at 18.43 km/h and decreases linearly during the first ~40 samples at a rate of ≈0.015 km/h·s, which is about 12% slower than in Run 3. In the middle section of the record (5.5 s–10.50 s), both curves run almost in parallel; however, the difference in the arithmetic mean corresponds to a relative deviation of 2.0%. The highest local maximum of Run 3 (19.96 km/h) exceeds the maximum of the average curve (19.33 km/h) by ≈3%. At the opposite end of the spectrum, the average values settle at 0.18 km/h, whereas in Run 3 the speed drops to zero nearly half a minute earlier and oscillates several times at very low values. The median of the average curve is 18.34 km/h, while the median of Run 3 was ≈0.37 km/h higher; however, this difference does not appear to be statistically significant (p ≈ 0.21, Mann–Whitney U test).
At the point of AEB activation, as evident from the time–speed profile, the vehicle speed was 12.6 km/h in Run 1, 16.19 km/h in Run 2, and 14.56 km/h in Run 3. The corresponding value in the average speed profile was 12.11 km/h. Figure 11 also shows that in Run 2 the AEB was likely activated 0.6 s earlier than in Run 1, as indicated by the subsequent pronounced drop in speed. The stopping time from the speed at which AEB activation likely occurred was 1.3 s in Run 1 and 1.2 s in Run 2.
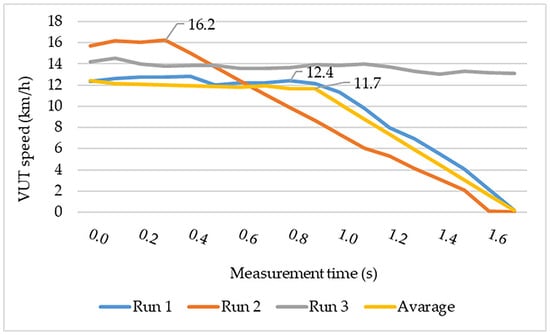
Figure 11.
Detail of speed reduction around AEB activation (Source: Author).
Figure 11 isolates the portion of the time–speed trajectories where the AEB either activates or should have activated. Two features make the link between kinematics and automation unambiguous. First, the onset of AEB is marked by a rapid break in slope (large negative dv/dt), producing a steeper speed drop than anywhere else in the run. This discontinuity occurs earlier in Run 2 than in Run 1 (≈0.6 s), which is consistent with the shorter delay between threat recognition and commanded braking in Run 2. Second, the stopping intervals measured from the inferred trigger point are compact and repeatable (≈1.2–1.3 s), which is characteristic of an automated, high-pressure brake demand rather than progressive driver braking. At the instant of activation, vehicle speed was 12.4 km/h (Run 1) and 16.2 km/h (Run 2), with the across-run mean showing 12.11 km/h. These values anchor the visual inference that the sharp velocity break coincides with AEB actuation and that small differences in trigger time translate to measurable differences in residual speed and stopping time (see Figure 11).
It was also possible to examine the longitudinal and lateral acceleration of the test vehicle. Figure 12 shows the profile of longitudinal acceleration. Figure 12 shows that automated interventions have a distinct longitudinal acceleration signature that differs qualitatively from manual braking. Runs with AEB exhibit a short pre-activation “build-up” (minor fluctuations around 0 g as the system transitions) followed by a sudden, high-magnitude negative peak. In contrast, Run 3 lacks that peak and never departs from a mild, slowly varying deceleration band. The absence of a sharp minimum in Run 3 indicates that the vehicle was not subject to an automated, full-pressure brake command; instead, deceleration was driver-limited and insufficiently steep to mirror the automated profile seen in the other runs. Thus, Figure 12 operationalizes AEB activation. The presence of a pronounced, localized negative acceleration extremum is a reliable marker of system-initiated braking, whereas a low-slope, low-amplitude curve is consistent with manual modulation without AEB support (see Figure 12).
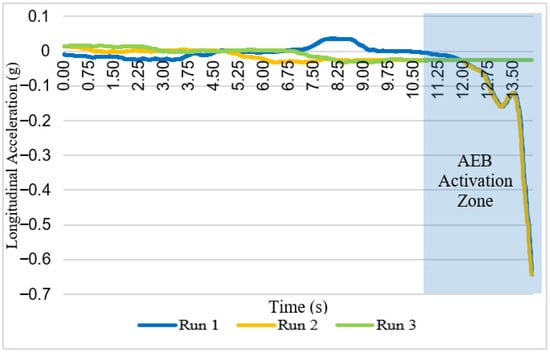
Figure 12.
VUT longitudinal acceleration profiles for each run (Source: Author).
Figure 13 then presents the profile of the average deceleration curve in the AEB activation zone. The figure shows deceleration followed by a slight increase in acceleration between 13 and 13.5 s. The averaged curve in Figure 13 decomposes the intervention into two phases. In the first phase, a shallow segment appears, with small oscillations in longitudinal acceleration (~0.041 g), consistent with brake-system pressurization and transition from warning/stand-by to action. This is followed by the activation phase, where acceleration reaches a distinct minimum of −0.642 g (≈−6.3 m/s2). The magnitude and abruptness of this drop, together with its brief duration, are diagnostic of an automated emergency demand rather than human input. Functionally, the first segment corresponds to controller engagement and pressure build-up (≈0.5 s), and the second to full brake effectiveness leading to stop (≈0.5 s). This pattern explains the sharp speed knees in Figure 11 and, importantly, satisfies the deceleration capability required for an AEB event in the relevant regulatory envelope (see Figure 13).
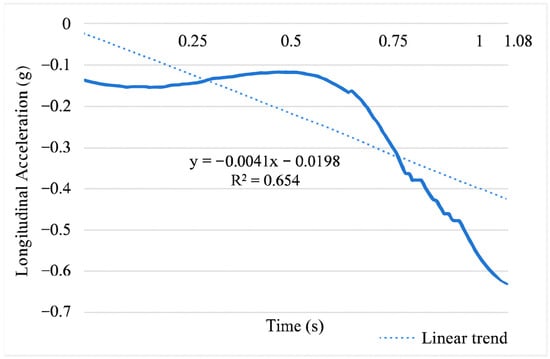
Figure 13.
Average longitudinal acceleration around AEB activation at 15 km/h (Source: Author).
During this interval, braking pressure likely increased and acceleration fluctuated by ~0.041 g (0.4 m/s2), consistent with the system preparing to intervene. This is followed by a clear deceleration—the AEB activation zone—where acceleration reaches a minimum of −0.642 g (≈−6.3 m/s2). The sharp change in longitudinal acceleration indicates an autonomous AEB response rather than driver-initiated braking. This phase is typical for the automatic response of the AEB system, which immediately activates the braking system with maximum intensity when it detects an imminent collision threat. The first area can thus be considered the start-up area (approx. 0.5 s) and the second the effective area, which leads to the complete stopping of the vehicle (approx. 0.5 s).
This sequence can be considered an example of effective activation of the emergency braking system. From a traffic safety perspective, this behavior is essential because it allows the vehicle to minimize its braking distance and increase the chances of avoiding a collision or mitigating the consequences of an accident.
Figure 14 shows longitudinal deceleration for a run without AEB response. Unlike activation cases, no sudden drop indicated automated intervention. Instead, deceleration progressed gradually, with a maximum of ~−0.3 g and only a slight overall slope. Linear regression with a slope coefficient of −0.0003 and a coefficient of determination of R2 = 0.5807 indicates that some deceleration did occur, but it was a slow, manually controlled process by the human driver. The curve does not display any abrupt break, which is typical for scenarios without AEB activation (see Figure 14).
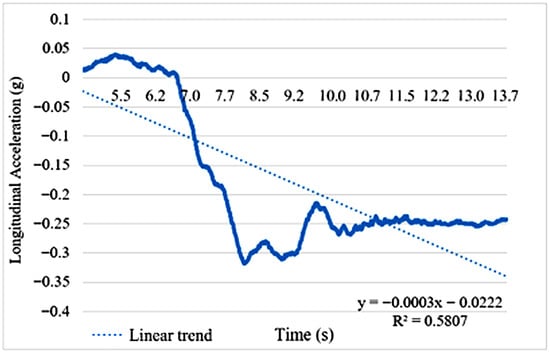
Figure 14.
VUT longitudinal acceleration in a run without AEB activation (Source: Author).
Pronounced fluctuations in certain sections may also reflect the driver’s attempt to adjust speed to the situation, but without sufficient intensity to fully eliminate the risk of collision. From a safety assessment perspective, this type of profile represents a significant hazard.
The absence of a forceful intervention, such as that observed during AEB activation, results in an extended braking distance and a potentially reduced ability of the vehicle to avoid an obstacle. This study thus documents the limits of manual reaction in critical situations and underscores the importance of autonomous assistance systems in enhancing road safety.
Next, we focused on a systematic approach to deriving two decisive time milestones that are key to assessing the safety function of autonomous emergency braking in the CC-I-LTAP intersection scenario. The first was the moment of physical detection of the GVT by the VUT on-board radar, and the second was the latest point in time at which AEB activation could still prevent a collision. Due to the absence of internal data records from the VUT control unit, the procedure had to be based on a synthesis of available experimental measurements from external sensors and on an analytical model of the trajectories of both participants in the conflict. The methodology was based on precise tracking of the position of the VUT and GVT using GNSS and an inertial unit, followed by reconstruction of the radiation pattern of the front radar sensor.
To determine the first milestone, the intersection of the radar antenna beam with the GVT trajectory is analyzed, and the time is identified when the target enters the radar’s projection area under the criterion of minimum reflective surface. The second milestone is defined as the point at which the distance between the vehicles decreases to the level at which the braking distance of the VUT, at the declared deceleration of the AEB system, equals the remaining distance to collision. By comparing these two times, the detection margin can be quantified—the interval between the physical registration of the GVT and the last possible moment for an effective reaction. This time margin makes it possible to retrospectively assess whether the VUT’s radar had sufficient opportunity to recognize the threat posed by the GVT’s left-turn maneuver and whether the control logic, under ideal conditions, could have activated emergency braking in time. The analytical framework therefore provides robust threshold values for calibrating the warning level of forward collision warning systems and for triggering autonomous braking of the VUT’s forward motion. It also enables verification of the dynamic parameters of the AEB braking response, even in cases where internal diagnostic records are not available.
The first step was temporal synchronization of data files from the VUT and GVT. During measurement, the records of the individual vehicles were captured by independent onboard data loggers, each starting with their own internal clock. Although both loggers record absolute UNIX time at 1 ms resolution, millisecond-level offsets can accumulate over several seconds into decimeter-level position errors. In this study, therefore, all timestamps were converted to a common, offset-free origin of t = 0 s, defined by the beginning of the VUT recording. This conversion was a simple subtraction of the constant Δtsync and does not affect either the originality or the structure of the data.
On this unified time axis, the second step consists of transforming the global coordinates into the coordinate system associated with the radar. In the logger, each vehicle was represented by its center of gravity in the Cartesian coordinate system of the test field. From the VUT’s center-of-gravity coordinates, a fixed vector corresponding to the radar sensor’s location is first subtracted. According to the technical documentation of the Škoda Superb iV 2020, the radar is positioned 1 m ahead of the center of gravity along the vehicle’s x-axis and 0.65 m above the road surface. The result was the relative radar position xr, yr, zr (see Figure 15).
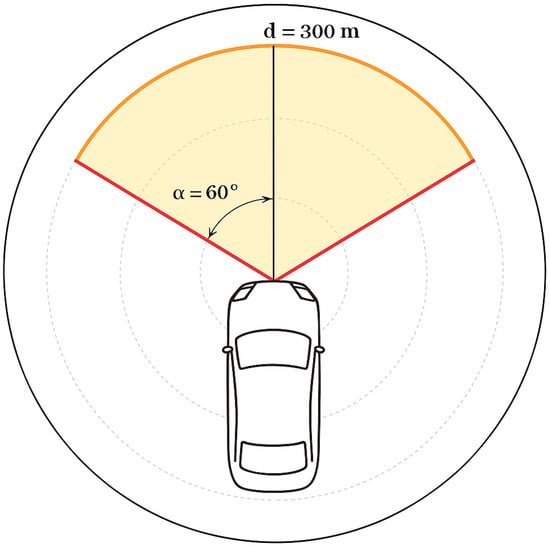
Figure 15.
Radar detection cone used in the CC-I-LTAP analysis (Source: Author).
Since in the CC-I-LTAP scenario the instantaneous yaw angle ψ reaches values ranging from −1.2° to 90.6°, coordinate rotation cannot be neglected. The relationship between the global PWGS coordinates and the VUT coordinate system was therefore expressed through a complete 2D rotation and translation.
where ψ denotes the current yaw angle of the vehicle.
PVUT = R(−ψ) × (PGVT − PVUT),
At the same time, the origin of the local GVT coordinate system was shifted to the geometric center of the vehicle—rather than to the front mask—in order to ensure a symmetrical radar signature.
In the third step, the geometric condition is formulated that must be satisfied for the GVT to be physically observable by the radar sensor. The radar installed in the test vehicle has a field of view of 120° and a maximum range of 300 m.
If the relative coordinates of the target are denoted as xr and yr, then the condition is as follows:
xr > 0,
The radar cone space and the inequality are defined:
This excludes targets located behind the vehicle. Only the final inequality accounts for the receiver’s sensitivity with respect to distance.
In the datasets of the relative positions of both vehicles over time, this procedure was applied from the beginning of the measurement until the three described inequalities were simultaneously satisfied for the first time. The timestamp of the identified row represents the fourth step, namely the moment of first detection t_det. This moment was found at 10.23 s for the first run, 9.47 s for the second run, and 29.42 s for the third run after the start of recording. The positional variables associated with this time were as follows: a distance of 85.75 m and an azimuth of 38.04° for the first run; a distance of 88.1 m and an azimuth of 41.7° for the second run; and a distance of 51.11 m and an azimuth of 19.86° for the third run. These results are solely derived from the trigonometric definitions of the right-angled triangle formed between the VUT radar and the GVT, i.e., the formula:
where (xs, ys) are the coordinates of the GVT.
θ = arctg 2(ys, xs),
The fifth step introduces an ideal braking model for the host vehicle. A constant negative acceleration of a = 0.51 g (5 m/s2) was assumed, corresponding to the values specified in UNECE Regulation No. 152 (adopted into EU Regulation 2019/2144 and related implementing provisions). This regulation states, “If the system detects the possibility of an imminent collision, it shall issue a braking demand to the vehicle service braking system leading to a deceleration of at least 5.0 m/s2” [40]. The braking distance then follows from the elementary equation:
In a realistic AEB system, braking does not begin at detection. We considered system latency Δt_s, combining radar delay (~90 ms), fusion/decision delay (~50 ms), and brake response (~80 ms), totaling ~0.22 s. During this time, the relative approach of the two objects is not halted: the target vehicle (GVT) continues to travel at a constant speed, while the VUT does not brake. The model therefore assumes that after the latency period, the VUT begins braking with a predefined constant deceleration, and that during the latency interval the GVT covers a distance given by the following equation:
sGVT = vGVT × Δts
The sixth step determines the time t_AEB at which the sum of the VUT’s braking distance and the distance covered by the GVT—both during the latency phase and during the VUT’s own braking—exactly equals the initial separation distance d. To obtain an analytical expression, all partial distance components are summed, and the total is set equal to d. The unique solution of the following equation then gives the moment of the last possible reaction:
Under the specified parameters, the calculated times were 10.71 s for the first run, 10.75 s for the second run, and 10.90 s for the third run after the start of measurement (see Table 4).
Table 4.
Timing and kinematic quantities for the CC-I-LTAP analysis (Source: Author).
The seventh and final step consists of interpreting the reaction time allowance of the system, i.e., the temporal difference between the moment of the last possible reaction that would have prevented the collision and the first possible moment of object detection. A time interval of 3.13 s for the first run, 3.25 s for the second run, and 3.2 s for the final run represents the time window within which the vehicle software must confirm object detection, classify the target, calculate the time-to-collision (TTC), compare it with the internal threshold criterion, issue a braking request to the electronic stability module, and trigger system activation (see Figure 16). The adequacy of this window can be evaluated both against typical sensor fusion latencies—which in modern control units remain around 100 ms—and against Euro NCAP requirements, which define the minimum allowable TTC for AEB intervention at low speeds at 1.7 s [31]. At the moment of first detection, the TTC was 19.2 s for the first measurement run; 10.3 s decreasing to 0.67 s in the second run; and 12.2 s decreasing to 0.63 s in the third run.
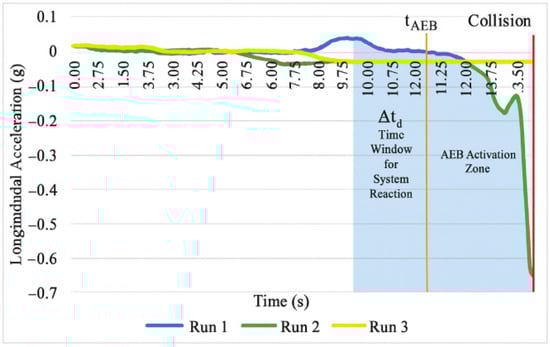
Figure 16.
Longitudinal acceleration of the VUT with highlighted AEB activation zone (Source: Author).
6. Discussions
The approach was chosen to overcome the limitations of conventional system validations, such as standardized proving-ground tests with low operational complexity. A review of the state of the art [28,33] indicates that most testing frameworks do not sufficiently address realistic operational environments and therefore fail to provide adequate predictive validity in relation to real-world user safety. Scenario selection was carried out through a multi-source integration, combining empirical evidence from traffic accidents, recommendations from international publications (e.g., De Gelder et al., 2020), and scenarios embedded in verification frameworks such as Euro NCAP, ISO 34502, and UNECE R152 [41]. The analytical component revealed that many critical scenarios, particularly those involving vulnerable road users in urban environments, are not tested in current practice. This finding aligns with the results of the ENABLE-S3 project [35], which explicitly noted that commonly used tests cannot capture the full range of ADAS behavior in complex contexts.
The experimental part of the research was based on tests with a 2020 Škoda Superb iV under controlled proving-ground conditions, with scenarios designed to replicate real-world situations of high collision risk. Both kinematic and spatial characteristics of the test vehicles and other moving devices within the scenarios (GVTs) were measured. High-precision technologies including GNSS and IMU enabled detailed reconstruction of the trajectories of the vehicle and all other actors. In most cases, the AEB system in the vehicle detected the threat and initiated braking at the expected moment. However, situations were also recorded in which the target was detected only at a point when a collision could no longer be fully avoided. This outcome that AEB effectiveness declines in scenarios with late-detectable targets, and it also highlights the limitations of sensor fusion algorithms when objects are masked.
Compared with the results of Ireland et al. [42], who simulated the responses of autonomous systems in modeled scenarios using Monte Carlo analysis, the experimental approach of this study is grounded in real-world measurements under corresponding operational conditions. This allows for a more precise evaluation of system performance, albeit with reduced coverage of the scenario space. The results are therefore complementary to simulation-based projects such as PEGASUS [33], providing them with much-needed empirical anchoring. In several scenarios, it was observed that the AEB system failed to respond even when the predicted time-to-collision fell below the activation threshold. In retrospective reflection, certain aspects of the research could be optimized in future replications. For instance, incorporating more scenarios in the early research phase and conducting preliminary analyses through simulation models could better predict their risk levels and likelihood of occurrence. Similarly, implementing automated data logging of the internal states of test vehicles would increase reproducibility and result consistency. To strengthen generalizability, we plan to (a) enlarge the dataset with higher repetition counts across speed levels and scenario variants; (b) test multiple vehicle models and sensing stacks; (c) extend beyond proving-ground conditions to naturalistic driving with instrumented on-road deployments that capture weather, surface, masking/occlusion, and traffic interactions; and (d) integrate ECU-level triggers with high-rate GNSS/IMU for improved event timing, complemented by simulation-in-the-loop to stress rare edge cases. Together, these steps will enable variance and significance testing on a larger sample, and provide more robust estimates of AEB effectiveness across broader ODDs.
The use of advanced simulation tools such as BeamNG.drive could also allow replication of more complex scenarios without physical testing, thereby reducing costs and minimizing equipment damage risks. In hypothetical cases where certain input data or environmental parameters (e.g., reduced visibility, wet pavement) were altered, the results could differ substantially. This observation corroborates the conclusions of Kianfar et al. [27] that safety assessments must include variation analysis of operational conditions. The results of this study therefore underscore the need to develop scenarios directly linked to real-world operational conditions, including contextual variables such as weather, road surface condition, visibility, and line-of-sight obstructions.
When interpreting the results, several methodological constraints limit external validity. (i) Limited repetitions and scenarios. Although we conducted repeated trials, the overall number of test runs and included scenarios was small (e.g., three nominally identical runs at 15 km/h), which reduces statistical power and constrains deeper analyses such as variance testing across trials or formal significance testing between conditions or vehicles. As a result, estimates of AEB trigger time, peak deceleration, stopping time, and TTC_AEB should be read as indicative trends, not population-level effects. (ii) Single platform. All measurements were obtained on one vehicle model with a single sensing/actuation stack; performance may differ for platforms with other radar characteristics, fusion strategies, brake systems, or controller tuning. (iii) Proving-ground environment. Experiments were executed on a controlled track with a soft GVT surrogate and simplified traffic; variability in surface, weather/visibility, occlusion, multipath, and background traffic was intentionally constrained and thus under-represented. (iv) Measurement and modeling assumptions. Kinematic inferences relied on external GNSS/IMU logs rather than ECU-internal trigger records, so AEB activation timing was identified from acceleration profiles rather than controller ground truth.
Another area requiring attention is the limitations of the sensors used. Camera, radar, and ultrasonic sensors are sensitive to external conditions such as lighting, weather, and road surface state. Reduced adhesion or low contrast between an object and its background, for example, may lead to delayed detection and thus affect AEB reaction times. These factors were only partially considered in the experiment, although their impact on reliability is likely significant. From this perspective, the presented results should be regarded as corresponding to the specific test conditions rather than as a universal characterization of system performance. Finally, potential sources of measurement error must also be acknowledged. Despite the use of standardized equipment and precise time synchronization, minor deviations in speed, position, or acceleration measurements are unavoidable, especially when relying on GNSS and inertial units. Such inaccuracies may accumulate and influence, for instance, the determination of TTC values or deceleration. Although their impact was minimized through repeated measurements and subsequent averaging, the results inevitably carry a degree of instrumental uncertainty that must be considered in their interpretation.
7. Conclusions
This study has demonstrated that the safety performance of Advanced Driver Assistance Systems (ADAS), and in particular Autonomous Emergency Braking (AEB), can only be meaningfully assessed when test methodologies capture the complexity of real-world traffic environments. By synthesizing insights from accident databases, international validation frameworks, and naturalistic driving data, we constructed a library of representative scenarios that span the spectrum of high-risk interactions. The subsequent focus on the CC-I-LTAP (Car-to-Car Intersection—Left Turn Across Path) scenario provided a concrete case study of how scenario-based testing can reveal both the capabilities and the limitations of state-of-the-art ADAS technologies.
The experimental campaign with a Škoda Superb iV under controlled proving-ground conditions confirmed that AEB and FCW systems are able to mitigate collision risks in specified instances. Analytical modeling of radar detection margins and last-possible-intervention times confirmed that the AEB system operated within the thresholds prescribed by UNECE regulations. However, the narrow time windows available for system decision-making—on the order of three seconds—demonstrate that even minor delays in sensing, fusion, or actuation can critically erode safety margins.
This reinforces the necessity for verification procedures that explicitly account for system latency and the dynamic interplay between host and target trajectories. The empirical measurements also revealed that while AEB activation produces a distinct and forceful deceleration profile, manual driver reactions lack the required intensity and consistency, leading to longer stopping distances and elevated collision risk. The experimental data also revealed specific limitations of the AEB system under the CC-I-LTAP conditions. In several trials, the system failed to activate braking early enough, even though the detection criteria were technically met. Analysis of the longitudinal deceleration traces showed that a reaction delay of only a few tenths of a second substantially reduced the available braking distance and led to unavoidable contact. This finding confirms the strong sensitivity of AEB performance to perception, fusion, and decision latency within the sensing-to-actuation chain. The observed variability between runs further suggests that stability of the system response may be influenced by small differences in trajectory alignment, target reflectivity, or lighting conditions. Overall, the results indicate that AEB performs effectively when timely detection and sufficient time-to-collision are available, but even minor delays or atypical sensor conditions can lead to intervention failure. This comparison illustrates the essential contribution of automation to road safety, while also highlighting the limits of human performance in high-stress situations.
The study is not without limitations. The restricted number of test runs reduces the statistical robustness of the results, and the reliance on a single vehicle model constrains generalizability. Moreover, the controlled conditions of the proving ground, while necessary for reproducibility, cannot fully replicate the variability of open-road traffic. Nevertheless, these constraints underscore rather than diminish the significance of the findings: they highlight the urgent need for larger datasets, expanded scenario coverage, and hybrid validation approaches that combine physical experiments, high-fidelity simulation, and naturalistic data analysis.
Methodologically, this research provides a replicable framework for constructing, parameterizing, and evaluating critical traffic scenarios aligned with ISO 34502 and ASAM OpenSCENARIO. From an analytical perspective, it provides empirical evidence of both the potential and the limitations of current ADAS technologies when confronted with intersection conflicts—a crash type consistently identified as among the most severe in global accident statistics.
In broader terms, the results reaffirm that the safety benefits of ADAS are real but context-dependent. Their effectiveness varies with technological maturity, market penetration, driver behavior, and environmental conditions. A unified, internationally recognized framework for scenario-based testing remains a prerequisite for transparent, reproducible, and comparable safety evaluations across jurisdictions and manufacturers. Such a framework must bridge the gap between regulatory protocols, consumer tests, and the lived complexity of real-world traffic.
Funding
This research was funded by Ministry of Transport of Czech Republic grant number 1/RVO.
Data Availability Statement
The dataset supporting the findings of this study is openly available in the Zenodo repository at the following DOI: https://doi.org/10.5281/zenodo.16948972.
Acknowledgments
This paper was produced with the financial support of the Ministry of Transport within the framework of the long-term conceptual development programme for research organizations.
Conflicts of Interest
The author declares no conflict of interest.
References
- ISO 26262; Road Vehicles—Functional Safety. International Organization for Standardization: Geneva, Switzerland, 2018.
- ISO/PAS 21448; Road Vehicles—Safety of the Intended Functionality (SOTIF). International Organization for Standardization: Geneva, Switzerland, 2019.
- ISO 34502; Road Vehicles—Test Scenarios for Automated Driving Systems—Specification for Operational Design Domain. International Organization for Standardization: Geneva, Switzerland, 2022.
- Aleksa, M.; Schaub, A.; Erdelean, I.; Wittmann, S.; Soteropoulos, A.; Fürdös, A. Impact analysis of Advanced Driver Assistance Systems (ADAS) regarding road safety—Computing reduction potentials. Eur. Transp. Res. Rev. 2024, 16, 39. [Google Scholar] [CrossRef]
- Vaculín, O.; Gellrich, M.; Matawa, R.; Witschass, S. Testing of automated driving systems. J. Middle Eur. Constr. Des. Cars 2020, 17, 7–13. [Google Scholar] [CrossRef]
- Scharber, H. Estimating Effectiveness of Lane Keeping Assist Systems in Fatal Road Departure Crashes (Report No. DOT HS 813 663); National Highway Traffic Safety Administration: Washington, DC, USA, 2024.
- Isaksson Hellman, I.; Lindman, M. Estimating the crash reducing effect of Advanced Driver Assistance Systems (ADAS) for vulnerable road users. Traffic Saf. Res. 2023, 4, e000036. [Google Scholar] [CrossRef]
- Kitajima, S.; Chouchane, H.; Antona-Makoshi, J.; Uchida, N.; Tajima, J. A nationwide impact assessment of automated driving systems on traffic safety using multiagent traffic simulations. IEEE Open J. Intell. Transp. Syst. 2022, 3, 302–312. [Google Scholar] [CrossRef]
- World Health Organization. Global Status Report on Road Safety 2023; World Health Organization: Geneva, Switzerland, 2023; Available online: https://iris.who.int/handle/10665/375016 (accessed on 10 September 2025).
- International Transport Forum (ITF). IRTAD Road Safety Annual Report 2023; OECD Publishing: Paris, France, 2023. [Google Scholar] [CrossRef]
- Ministerstvo Dopravy České Republiky. Strategie BESIP 2021–2030. 2021. Available online: https://besip.gov.cz/Besip/media/Besip/data/web/Strategie-BESIP-2021-2030.pdf (accessed on 10 September 2025).
- Transport Research Centre. (n.d.) Vize Nula. Retrieved July 3 2025. Available online: https://www.cdv.cz/vizenula (accessed on 28 July 2025).
- Bucsuházy, K.; Zůvala, R.; Ambros, J.; Baran, M. Analysis of COVID restrictions’ influence on road traffic crashes and related road users’ behaviour in the Czech Republic. Arch. Transp. 2023, 66, 109–121. [Google Scholar] [CrossRef]
- Gavrilov, I. Post-pandemic road accident analysis: Patterns and impacts. Neural Netw. World 2024, 34, 317–328. [Google Scholar] [CrossRef]
- Zhang, S.; Wei, G.; Han, L.; Zhong, W.; Lu, Z.; Niu, Z. Global, regional and national burden of decubitus ulcers in 204 countries and territories from 1990 to 2021: A systematic analysis based on the global burden of disease study 2021. Front. Public Health 2025, 13, 1494229. [Google Scholar] [CrossRef] [PubMed] [PubMed Central]
- Goodall, N.J. Comparability of driving automation crash databases. J. Saf. Res. 2025, 92, 473–481. [Google Scholar] [CrossRef]
- Kutela, B.; Das, S.; Dadashova, B. Mining patterns of autonomous vehicle crashes involving vulnerable road users to understand the associated factors. Accid. Anal. Prev. 2022, 165, 106473. [Google Scholar] [CrossRef]
- Masello, L.; Sheehan, B.; Castignani, G.; Shannon, D.; Murphy, F. On the impact of advanced driver assistance systems on driving distraction and risky behaviour: An empirical analysis of irish commercial drivers. Accid. Anal. Prev. 2023, 183, 106969. [Google Scholar] [CrossRef] [PubMed]
- Jung, A.; Jo, Y.; Oh, C.; Park, J.; Yun, D. A multi-agent driving-simulation approach for characterizing hazardous vehicle interactions between autonomous vehicles and manual vehicles. Appl. Sci. 2024, 14, 1468. [Google Scholar] [CrossRef]
- Yang, Z.; Yao, Y.; Zhang, L. Optimizing autonomous taxi deployment for safety at skewed intersections: A simulation study. Sensors 2025, 25, 3544. [Google Scholar] [CrossRef]
- Goodall, N.J. Comparison of automated vehicle struck-from-behind crash rates with national rates using naturalistic data. Accid. Anal. Prev. 2021, 154, 106056. [Google Scholar] [CrossRef] [PubMed]
- Antonakaki, A.; Oikonomou, M.G.; Garefalakis, T.; Yannis, G. Driving automation systems penetration and traffic safety: Implications for infrastructure design and policy. Infrastructures 2024, 9, 234. [Google Scholar] [CrossRef]
- Vass, S.; Galassi, M.C.; Ciuffo, B.; Baldini, G. A common scenario database for Automated Vehicles validation and certification. Transp. Res. Procedia 2023, 72, 3845–3852. [Google Scholar] [CrossRef]
- Ministerstvo Dopravy, Č.R. Plán Autonomní Mobility do Roku 2025 s Výhledem do roku 2030. 2024. Available online: https://www.mdcr.cz/Uzitecne-odkazy/Autonomni-mobilita (accessed on 30 July 2025).
- Yu, R.; Zheng, Y.; Qu, X. Dynamic driving environment complexity quantification method and its verification. Transp. Res. Part C Emerg. Technol. 2021, 127, 103051. [Google Scholar] [CrossRef]
- Finkeldei, F.; Thees, C.; Weghorn, J.N.; Althoff, M. Scenario Factory 2.0: Scenario-Based Testing of Automated Vehicles with CommonRoad. Automot. Innov. 2025, 8, 207–220. [Google Scholar] [CrossRef]
- Kianfar, R.; Falcone, P.; Fredriksson, J. Safety Verification of Automated Driving Systems. IEEE Intell. Transp. Syst. Mag. 2013, 7, 73–86. [Google Scholar] [CrossRef]
- Althoff, M.; Dolan, J. Online Verification of Automated Road Vehicles Using Reachability Analysis. IEEE Trans. Robot. 2014, 30, 903–918. [Google Scholar] [CrossRef]
- Kalra, N.; Paddock, S.M. Driving to safety: How many miles of driving would it take to demonstrate autonomous vehicle reliability? Transp. Res. Part A Policy Pract. 2016, 94, 182–193. [Google Scholar] [CrossRef]
- European Union. UN Regulation No. 152: Uniform provisions concerning the approval of motor vehicles with regard to the Advanced Emergency Braking System (AEBS) for M1 and N1 vehicles (2020/1597). Official Journal of the European Union. 2020. Available online: https://eur-lex.europa.eu/legal-content/EN/TXT/?uri=CELEX:42020X1597 (accessed on 10 September 2025).
- European New Car Assessment Programme. Euro NCAP Assessment Protocol—Vulnerable Road User Protection (Version 114); Euro NCAP: Leuven, Belgium, 2023. [Google Scholar]
- ASAM. ASAM OpenSCENARIO Transfer Project; Association for Standardization of Automation and Measuring Systems: Munich, Germany, 2019. [Google Scholar]
- PEGASUS Project. PEGASUS [Project Website]. 2018. Available online: https://www.connectedautomateddriving.eu/test-sites/?project=pegasus (accessed on 22 July 2025).
- Centre of Excellence for Testing & Research of Autonomous & Navigational Systems [CETRAN]. Report on CETRAN Guidelines for Autonomous-Vehicle Testing in Singapore; Land Transport Authority: Singapore, 2018.
- ENABLE-S3 Consortium. ENABLE-S3 [Project Website]. 2018. Available online: http://www.enable-s3.eu (accessed on 28 July 2025).
- Insurance Institute for Highway Safety. Status Report; Insurance Institute for Highway Safety: Arlington, VA, USA, 2018; Volume 53. [Google Scholar]
- Transport Research Centre (CDV). Vznikl Katalog Testovacích Oblastí Pro Autonomní Vozidla [Tisková Zpráva]. 5 May 2020. Available online: https://www.cdv.cz/file/tz-vznikl-katalog-testovacich-oblasti-pro-autonomni-vozidla/ (accessed on 13 July 2025).
- AutoSAP. Česká Republika Otevřela Cestu Autonomnímu Řízení: Prezident Podepsal Klíčovou Novelu Zákona [Tisková Zpráva]. 28 October 2025. Available online: https://autosap.cz/aktualita/ceska-republika-otevrela-cestu-autonomnimu-rizeni-prezident-podepsal-klicovou-novelu-zakona (accessed on 29 July 2025).
- Škoda Auto. (n.d.) Front Assist: Asistence pro Prevenci Kolizí—Návod k Obsluze Škoda Superb. Získáno [Datum Přístupu, Např. 15 April 2025]. Available online: https://digital-manual.skoda-auto.com/w/cs_CZ/show/616b75380fc4473aac1445252008ad27_1_cs_CZ?ct=616b75380fc4473aac1445252008ad27_1_cs_CZ&subt=d197660355e131734~d197660355e133414~d197660355e134569~d197660355e142932#titled197660355e143019 (accessed on 28 July 2025).
- AB Dynamics. GST Product Specification (ROW). January 2024. Available online: https://www.abdynamics.com/app/uploads/2024/01/AB-Dynamics-GST-Product-Specification-ROW.pdf (accessed on 28 July 2025).
- United Nations Economic Commission for Europe. UN Regulation No. 152: Uniform Provisions Concerning the Approval of Motor Vehicles with Regard to the Advanced Emergency Braking Systems (AEBS) for M1 and N1 Vehicles (Revision 2, Amendment 3; Supplement 3 to the 02 Series of Ammendments). 2023. Available online: https://unece.org/sites/default/files/2024-05/R152r2am3e.pdf (accessed on 21 July 2025).
- Ireland, M.L.; Hoffmann, R.; Miller, A.; Norman, G.; Veres, S.M. A continuous-time model of an autonomous aerial vehicle to inform and validate formal verification methods. arXiv 2016, arXiv:1609.00177. [Google Scholar] [CrossRef]


Disclaimer/Publisher’s Note: The statements, opinions and data contained in all publications are solely those of the individual author(s) and contributor(s) and not of MDPI and/or the editor(s). MDPI and/or the editor(s) disclaim responsibility for any injury to people or property resulting from any ideas, methods, instructions or products referred to in the content. |
© 2025 by the author. Licensee MDPI, Basel, Switzerland. This article is an open access article distributed under the terms and conditions of the Creative Commons Attribution (CC BY) license (https://creativecommons.org/licenses/by/4.0/).