Abstract
Embedded vision systems play a crucial role in the advancement of intelligent transportation by supporting real-time perception tasks such as traffic sign recognition and lane detection. Despite significant progress, their performance remains sensitive to environmental variability, computational constraints, and scene complexity. This review examines the current state of the art in embedded vision approaches used for the detection and classification of traffic signs and lane markings. The literature is structured around three main stages, localization, detection, and recognition, highlighting how visual features like color, geometry, and road edges are processed through both traditional and learning-based methods. A major contribution of this work is the introduction of a practical taxonomy that organizes recognition techniques according to their computational load and real-time applicability in embedded contexts. In addition, the paper presents a critical synthesis of existing limitations, with attention to sensor fusion challenges, dataset diversity, and deployment in real-world conditions. By adopting the SALSA methodology, the review follows a transparent and systematic selection process, ensuring reproducibility and clarity. The study concludes by identifying specific research directions aimed at improving the robustness, scalability, and interpretability of embedded vision systems. These contributions position the review as a structured reference for researchers working on intelligent driving technologies and next-generation driver assistance systems. The findings are expected to inform future implementations of embedded vision systems in real-world driving environments.
1. Introduction
Road safety has been growing in the last few years, due to road traffic that can be interpreted as exponentially evolving [1,2]. The thing that can guarantee the safety of all road users is the proposal of an intelligent in-vehicle system (ITS) that can be feasibly used in the future for Smart Cities [3,4]. Smart roads also play a key role by integrating technologies that support automation, connectivity, and energy-efficient traffic management. Nonetheless, recent studies [5] have highlighted existing uncertainties regarding their real impact on road safety and traffic operations.
This system has the objective of identifying and recognizing traffic road signs, as well as road edges, to assist the vehicle’s driver, as this is a major problem in the analysis of road scenes [6]. Several driver assistance systems have been proposed and implemented, and until now, research has continued to optimize traffic sign detection and recognition [7], as well as road lane detection [8]. Most approaches can be divided into three phases: localization, detection, and recognition (classification) [9,10,11,12]. Apparently, the first two phases are complementary, and most authors summarize them into only two categories: detection [13] and recognition for traffic signs [14,15] and road lanes [16,17,18]. The detection phase is very important, because it is used to detect all the signs and lanes of the road in order to eliminate as many objects as possible that may appear in the image, allowing us to reduce the false positive rate. Even if there is false detection in the detection phase, the performance will be corrected in the recognition phase, as this is performed in an intelligent way, using artificial intelligence for signs [19,20,21,22,23] and lanes [24,25,26].
Intelligent Transport Systems (ITSs) play a crucial role in the evolution of modern transportation, integrating advanced technologies to enhance safety, efficiency, and user comfort. For example, one study explored research and development programs for intelligent vehicles across the globe, highlighting emerging trends in this field. Another paper [27] explored the application of intelligent systems to optimize urban mobility and security through IoT-based innovations. It proposed models for smart traffic lights, parking systems, and vehicle theft detection, leveraging technologies like sensors, Raspberry Pi processors, and cloud databases. These systems dynamically adjust traffic signals based on density, monitor parking space availability, and provide real-time theft alerts. The research highlights the role of intelligent systems in improving traffic flow, enhancing parking experiences, and ensuring vehicle security. This research [28] investigates the role of unmanned aerial vehicles (UAVs) in optimizing the movement of emergency medical vehicles in Smart Cities. Using a hybrid Cascade-ResNet model, the study analyzed video data to detect congestion and unusual activity, facilitating faster and more efficient route planning. UAVs, functioning as IoT edge devices, enhanced traffic management and public safety through real-time insights. The approach demonstrated a 2.5% improvement in accuracy over comparable methods, showcasing its practical utility in urban emergency response systems. Moreover, research on embedded systems for autonomous vehicles has emphasized the importance of artificial intelligence in real-time decision-making [29], enabling vehicles to dynamically analyze their environment and the context in which they operate. These technological advancements highlight the growing importance of ITSs in developing safer and smarter vehicles [30], addressing the challenges of modern urban environments.
The evolution of visual perception in autonomous vehicles has progressed from rule-based methods and handcrafted features (e.g., Hough Transform, SVM) to modern deep learning architectures such as CNNs and Vision Transformers. Each generation has improved accuracy, generalizations, and robustness in complex road environments. Recent developments include end-to-end models that integrate perception, reasoning, and control in unified frameworks. This historical trajectory underscores the growing importance of AI-driven vision in automotive systems.
This paper undertakes an in-depth review of embedded vision systems tailored to the detection and recognition of road signs and lane markings, which are critical for enhancing road safety. By analyzing existing studies, it highlights both the strengths and limitations of current approaches, with a focus on their practical implementation under diverse conditions. The primary aim is to underscore the role of these systems in reducing accidents and improving traffic flow while addressing challenges such as environmental variability and computational efficiency. To add clarity and originality, the review intends to identify research gaps and suggest potential advancements, positioning itself as a resource for developing more effective vision-based solutions in modern transportation systems. Including a distinct problem statement in the Introduction further emphasizes the paper’s objectives and its contribution to the field. Also, a comprehensive summary of modern, real-time techniques utilized for both detecting and classifying traffic signs and road markings is provided. In this discourse, we delineate the methodologies for locating and detecting road signage and boundaries into a tripartite framework:
- Colorimetric Techniques: This division includes strategies that implement segmentation processes for the purpose of localization.
- Geometrical Approaches: This segment comprises methods that utilize geometric principles.
- Learning-Based Algorithms: This category encompasses techniques that incorporate learning paradigms for identification and classification tasks.
The categorization of recognition methodologies within this study bifurcates into two distinct streams:
- Feature-Based Methods: This category encompasses techniques wherein attributes are meticulously traced by domain experts.
- Deep Learning Approaches: This classification pertains to methods that employ deep learning algorithms for feature extraction and pattern recognition tasks [31].
Embedded vision systems are quintessentially integrated within a paradigm known as advanced driver assistance systems (ADASs), depicted in Figure 1 [32]. These systems harness sensorial input, predominantly from cameras, to assimilate environmental data. Subsequently, they synthesize decisions that align with both the perceived information and predefined objectives, thereby influencing the environment through iterative actions. This cyclical process persists until the attainment of the designated goal [33]. Specifically, within autonomous vehicular technology, the perception component is pivotal for obstacle detection including other vehicles, pedestrians, and miscellaneous objects, as well as for infrastructure recognition and self-localization within the milieu. It is customary to categorize perception systems into distinct classes based on their functional attributes and sensor modalities.
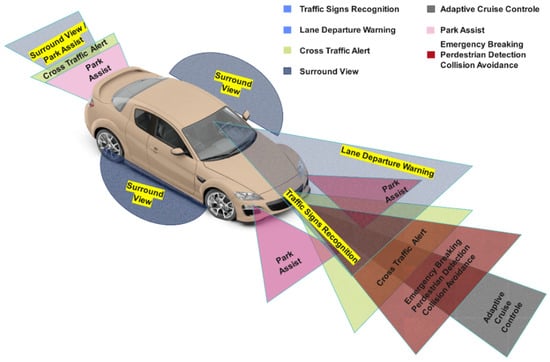
Figure 1.
Driver assistance systems: the circle of safety.
Road signs and road lanes play a vital role in allowing traffic to develop under very good conditions (speed, safety), but we would nevertheless like to remind you that
- -
- Sign supports must not encroach on the left and right lane and must be positioned as far as possible from surfaces accessible to vehicles.
- -
- Supports for gantries, jibs, etc., must generally be isolated by safety guardrails.
The role of road signs is to
- To make road traffic safer and easier.
- To remind you of certain traffic regulations.
- To indicate and remind the various special regulations.
- To provide information about the road user.
To structure this comprehensive review and guide the reader through its analytical goals, the following research questions are addressed:
- RQ1: What are the most efficient embedded vision techniques for road element detection?
- RQ2: What are the current limitations of these systems under real-world constraints?
- RQ3: Which unexplored areas can lead to safer, more scalable ADAS integration?
- RQ4: What types of processors are most commonly used in embedded vision systems for traffic sign and lane detection, and how do they impact system performance under real-time constraints?
The objective of this manuscript is to furnish a comprehensive survey delineating the myriad methodologies employed in the detection and recognition of traffic signs and lane markings within the realm of embedded vision systems. Section 2 delineates the categorization of signage into horizontal and vertical typologies. Section 3 proffers an exhaustive overview of the extant systems prevalent within the automotive sector, accompanied by a systematic critique. Section 4 scrutinizes the prevalent Image Processing (IM) and Artificial Intelligence (AI) [34] techniques utilized for the localization, detection, and recognition of traffic elements, analyzing the most ubiquitously adopted methodologies. Section 5 deliberates on extensive empirical experimentation pertaining to detection and recognition processes. Lastly, Section 6 encapsulates the findings and implications of the study.
2. Materials and Methods
To ensure clarity, focus, and scientific rigor of this review, our primary aim is to assist researchers working specifically on the development of embedded vision systems in the automotive sector, with a particular emphasis on road user safety. Rather than addressing a general audience, this paper is intended as a research-oriented contribution, offering both a structured overview of existing techniques and a critical discussion of ongoing challenges and future opportunities. To structure this narrative review, we followed the SALSA framework (Search, Appraisal, Synthesis, and Analysis) (Table 1). This methodology not only helps narrow the scope of relevant studies but also highlights technical advances, gaps, and implementation barriers within real-world embedded automotive systems.

Table 1.
Overview of the SALSA methodology applied in this review.
2.1. Types of Signs
Several techniques or identification methods can be applied for the detection and recognition of road signs and road markings to extract and identify them in an urban environment, for example, using image processing techniques, computer vision, and artificial intelligence. An embedded vision system allows changing the information with a large number of devices on the road:
- ❖
- Road infrastructure server;
- ❖
- From one vehicle to another.
In the context of this inquiry, we commence with a succinct exposition on the typologies of road signs employed for the regulation of vehicular flow. The taxonomy of these signs is bifurcated into two categories: vertical signs, which are predominantly utilized for conveying regulations, warnings, and guidance in a perpendicular orientation to the road; and horizontal signs, which are marked directly on the road surface to delineate traffic lanes, convey directional information, and provide other operational instructions [34,35,36].
Road signs and markings are key elements for safe and structured traffic flow. Horizontal markings such as dashed, solid, dashed–solid, and solid–dashed lines define lane boundaries and dictate overtaking or lane-changing rules (Figure 2). Dashed lines allow movement between lanes, while solid or double solid lines indicate restrictions or prohibitions. Vertical road signs (Figure 3, Figure 4, Figure 5 and Figure 6) provide regulatory, warning, informational, and mandatory messages to drivers. These include circular prohibition signs, triangular warning signs, rectangular information signs, and round blue obligation signs, all of which follow standardized shapes and colors to support quick recognition [37,38,39].
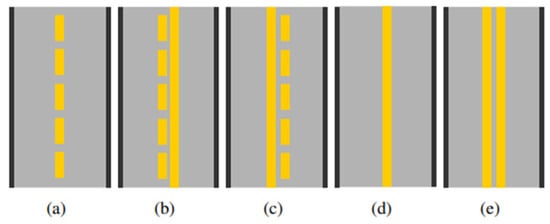
Figure 2.
Varieties of lane markings corresponding to categories (a–e): (a) dashed, (b) dashed–solid (dashed to solid), (c) solid–dashed (solid to dashed), (d) single solid, (e) and double solid.
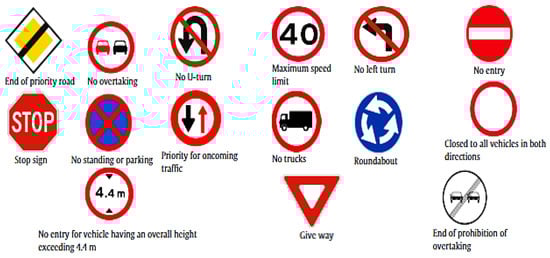
Figure 3.
Examples of regulatory signs.
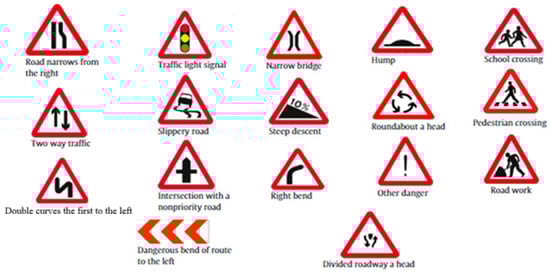
Figure 4.
Examples of warning signs.
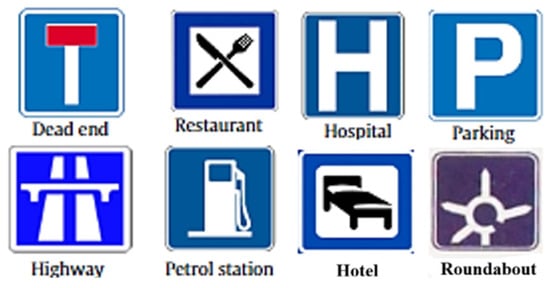
Figure 5.
Signs of the information.
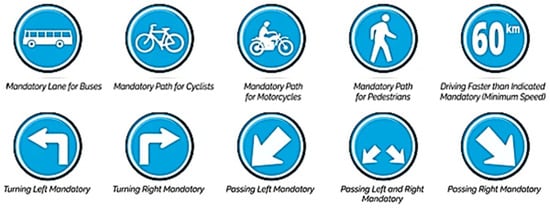
Figure 6.
Signals of obligation.
Both horizontal and vertical signs are essential visual cues interpreted by embedded vision systems in modern vehicles. Their standardization enables accurate real-time detection, which is crucial for advanced driver assistance systems (ADASs) and autonomous driving functions. Recognizing these signals helps systems navigate roads, enforce safety rules, and interact effectively with the traffic environment. The upcoming section introduces commonly used optical character detection and recognition techniques in such embedded vision applications.
According to what was explained before, generally, a road sign can have a triangular, square, or rectangular shape. It should be noted that the style or shape of road signs is standardized. Based on these characteristics, we propose, in the subsequent section, the most commonly employed techniques in systems for optical character detection and recognition.
2.2. The Different Systems Existing in the Automotive Industry
Nowadays, there are many traffic sign recognition systems in the automotive sector. Currently, there are some car brands that have already been equipped with these TSR systems. Below is an example of a TSR application in a car (Figure 7).
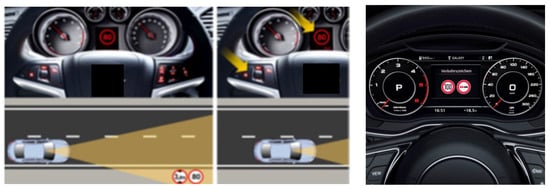
Figure 7.
Examples of TSR application in a car.
- a.
- Advantages of TSR Systems
- Facilitate accurate traffic sign readings;
- Ensure interrupted performance;
- Provide complete speed solutions (avoid accidents);
- Ability to encrypt image data with other systems;
- Reads all types of infrared and non-reflective infrared plates.
- b.
- Limitations of TSR Systems
- A road sign outside the camera’s detection zone will not be detected.
- The systems operate only within the limits of the system and assist the driver.
- The driver must remain attentive while driving and remains fully responsible for their actions.
When it comes to TSR systems integrated in vehicles, there are two types of TSR technology applications:
- Passive application: consists of informing the driver by means of pictograms or sounds that they are entering a zone that has a new limit indicated by a traffic light. In this case, it will be the driver’s decision whether they obey the signal or not.
- Active application: consists of automatically intervening in the car when it detects a sign. For example, if the driver is driving at an excessive speed and the TSR system detects a stop sign but the car does not interpret that the driver intends to stop, the command to brake will be sent directly to the car to avoid a possible accident.
2.3. Horizontal Signs: Road Lanes
The utilization of image processing in the design and development of embedded vision systems for the detection and recognition of traffic signs and road markings is a critical aspect of modern vehicular technology. These systems integrate advanced algorithms that analyze visual data to identify and interpret traffic signs and lane information, thereby enhancing the safety and efficiency of navigation in both driver-assisted and autonomous vehicles [40]. The sophistication of these systems lies in their ability to process complex visual inputs with high accuracy and speed, contributing significantly to the advancement of intelligent transportation systems. Image processing techniques are fundamental to the development of embedded vision systems in the automotive sector [41]. These techniques enable vehicles to interpret and understand the environment around them, which is crucial for both driver assistance and autonomous driving applications. Here is a deeper look into their essential role:
- Enhanced Perception of Safety: Image processing algorithms are key to enhancing a vehicle’s perception of its surroundings. They process visual data from cameras to detect objects, lanes, signs, and pedestrians, which is vital for safety features like collision avoidance and lane-keeping assistance [34,42].
- Real-time processing: Embedded vision systems must process and analyze visual data in real time to be effective. Image processing techniques allow for the quick interpretation of data, enabling immediate responses to dynamic road conditions [43].
- Machine Learning Integration: The integration of machine learning with image processing has led to more accurate and adaptive vision systems. These systems can learn from vast amounts of data, improving their ability to recognize and respond to various traffic scenarios over time [44].
- Reduced Computational Load: Advanced image processing techniques help in reducing the computational load on embedded systems. By preprocessing visual data and extracting relevant features, these systems can operate efficiently without compromising on speed or accuracy.
- Sensor Fusion: Although camera-based vision systems are fundamental in enabling perception for autonomous vehicles, they exhibit several inherent limitations. Environmental conditions such as fog, shadows, glare, or heavy rain can reduce the reliability of image-based detection. Moreover, vision alone, especially from monocular cameras, fails to provide accurate depth information, which is critical for tasks like distance estimation and obstacle avoidance. In contrast, sensors like LiDAR and radar offer more consistent depth measurements and greater resilience to weather variations, though they may lack the resolution and semantic detail provided by visual sensors. By combining complementary sensor modalities, sensor fusion techniques significantly enhance perception reliability. As demonstrated in [45], fusing visual data with LiDAR or radar improves detection confidence, reduces false positives, and strengthens decision-making, particularly in edge-case scenarios [46].
In summary, image processing is a cornerstone of modern automotive technology, enabling vehicles to see and interpret the world with precision and intelligence. As the automotive industry continues to evolve towards autonomous driving, the role of image processing in embedded vision systems becomes increasingly significant.
2.4. Harnessing Artificial Intelligence in the Automotive Sector
Artificial intelligence (AI) refers to a range of technologies enabling the simulation of intelligent behavior and the automated execution of perception, comprehension, and decision-making tasks. These methodologies primarily encompass mathematics (particularly statistics), computer science, electronics, cognitive science, and neuroscience. Consequently, artificial intelligence has developed very strongly for more than 10 years, with an acceleration in the last 5 years, to allow uses such as [15,47,48]
- Visual perception: object recognition or scene description.
- Understanding of written or spoken natural language: automatic translation, automatic production of press articles, and sentiment analysis.
- Automatic analysis by “understanding” a query and returning relevant results, even if the result does not contain the words of the query.
- Autonomous decision-making for ADASs and autonomous vehicles.
AI currently requires considerable data and computational resources to learn efficiently. Research is now developing techniques to reduce energy consumption and limit the need for data [49] and other techniques to allow a solution to be generalized to multiple uses or to make AI robust to a single disruptive event.
- a.
- Exploring Artificial Intelligence Technologies
Even though artificial intelligence is mainly associated with mathematical disciplines and algorithmic techniques, it also includes other aspects to support comprehensive use, as shown in Figure 8. The main building blocks of an AI system are digital platforms (user data) or sensor infrastructure [45,50] (machine or environmental data) to generate regular data/events flow. This infrastructure consists of networks of sensors strategically deployed to capture and transmit data from the physical world to computational systems for analysis and interpretation [51,52,53]. A communication network allows the collection of data/events used by the AI. This data must be sufficiently representative of the use case we are trying to address. By taking these special considerations into account and implementing robust data collection strategies, organizations can ensure that the data captured by sensor infrastructure is sufficiently representative of the specific use case, enabling more accurate information to be obtained and informed decisions to be made [54].
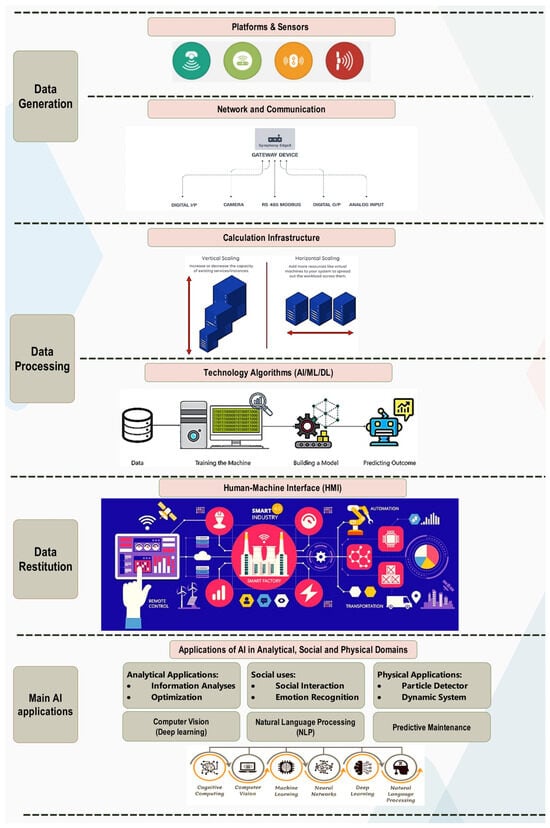
Figure 8.
AI technology bricks.
A hyperscale computing infrastructure stores and exploits the data streams in a reasonable timeframe. Globally, hyperscale IT infrastructure [55] represents a paradigm shift in data center design and operation, enabling organizations to efficiently and cost-effectively support the growing demands of the digital enterprise, cloud computing, big data analytics, and emerging technologies such as AI/ML [56]. Artificial intelligence algorithmic technologies (machine learning, deep learning, neural networks, etc.), a performance measurement, an error measurement, and a set of reference events for learning are required. These performance measurement techniques are essential for assessing the effectiveness and reliability of AI algorithms in different tasks and domains. By carefully choosing appropriate metrics and methodologies, researchers and practitioners can gain valuable insights into algorithm performance, identify areas for improvement, and make informed decisions about algorithm selection and deployment [57].
A simple man/machine interface of the platform types accessible via mobile or computer for “decision support”-type uses or an advanced interface (drone, robot, autonomous vehicle) for “autonomous decision”-type uses is the element that associates an algorithmic technology with a sectorial use [58].
- b.
- The usefulness of AI for embedded vision systems in the automotive sector
The application of AI in embedded vision systems is pivotal for the progression towards fully autonomous vehicles, as it allows for the interpretation of complex visual data, ensuring safety and reliability of diverse driving conditions. Moreover, AI models and methods have been systematically reviewed for their application in automotive manufacturing, highlighting the potential and applicability of AI for automotive original equipment manufacturers (OEMs) and suppliers [47]. Furthermore, advancements in computer vision algorithms and remote sensing data fusion techniques contribute significantly to the automotive sector by enhancing visual perception and navigation systems [59]. In the realm of automotive technology, AI-driven embedded vision systems are pivotal for the evolution of vehicles that are not only autonomous but also cognizant of safety and operational efficiency. The burgeoning corpus of scholarly articles attests to the critical role and swift progression of AI in this domain. The recent literature has elucidated the integration of deep learning with autonomous vehicle systems (AVSs), significantly impacting road safety and the future of transportation [60].
These advancements are particularly noteworthy in the context of sensor fusion cost reduction and the amalgamation of top-tier solutions to address uncertainties on the road. The systematic review of AVS employing deep learning spans a decade, focusing on RGB (Red, Green, and Blue) camera vision and its application in various vehicular functions, from perception analysis to augmented reality-based head-up displays [61]. Furthermore, the digitalization of the automotive sector accelerates the convergence of perception, computing, connectivity, and data fusion for Electric, Connected, Autonomous, and Shared (ECAS) vehicles. This convergence fosters cutting-edge computing paradigms with embedded cognitive capabilities, propelling vehicles towards sustainable green mobility through intelligent functions and automotive digital infrastructure [62].
The challenges of embedding computer vision in automotive safety systems are manifold, yet the continuous innovation in AI methodologies and virtual validation and testing is paving the way for more advanced and reliable ECAS architectures [63]. As vehicles become increasingly intelligent and interconnected, functioning as edge microservers on wheels, the embedded AI facilitates a myriad of autonomous capabilities, enhancing the overall driving experience and safety [62]. In essence, AI for embedded vision systems is not merely a technological enhancement but a transformative force driving the automotive sector towards an era of intelligent mobility. The commitment to research and development in this field is crucial for realizing the full potential of AI in automotive applications, ensuring that the vehicles of tomorrow are equipped to navigate the complexities of real-world driving environments.
Furthermore, the following diagram (Figure 9) shows the evolution of processor sales by economic sector over the last few years. The industrial, tertiary (including financial services), and commercial sectors are the three sectors that consume the most chips. This number is growing overall in all sectors, apart from the economic crisis of 2008. GPU-based processors (led by NVIDIA) currently dominate the AI gas pedal market. Other technological approaches are still in the research and development stage. Just like the GPU, which took a decade to become established, solutions should be available by 2020/2025. They focus on solving specific AI problems, once the learning phase is over, such as the inference phase (FPGA) [57,58] or the use of constrained consumption (QUALCOMM) on mobile devices.
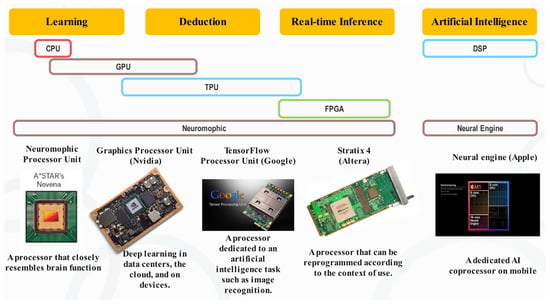
Figure 9.
AI usage of processors according to their architecture.
2.5. Vision Transformers in Object Detection and Tracking
Vision Transformers (ViTs) have recently emerged as strong alternatives to CNN-based (convolution neural network) approaches for object detection and tracking, particularly in autonomous driving scenarios. Unlike convolutional models, ViTs utilize self-attention mechanisms to capture the global context, which improves detection performance in complex visual scenes. However, their computational demands often limit their use in embedded systems. To address this, recent works have focused on designing lightweight and hybrid models. For example, MobileViT integrates convolutions with transformer blocks to reduce latency while maintaining accuracy, showing promising results in mobile and real-time platforms [64]. Similarly, DeViT introduces a modular design that partitions the model across low-power devices for efficient inference without significant accuracy degradation [65]. Fast-COS, introduced by [66], proposes reparametrized attention tailored for driving scenes, outperforming traditional models like YOLO and FCOS in terms of speed and throughput on edge devices. Moreover, Lai-Dang highlighted the importance of software–hardware co-design and model compression in deploying ViTs under strict resource constraints [67]. These developments underline a key trade-off: ViTs offer better detection accuracy, but only recent innovations have made their deployment feasible on embedded platforms. A comparative discussion of these models is essential to reflect the current state of the art and guide future research.
3. Related Work
This section is divided by subheadings. It should provide a concise and precise description of the experimental results, their interpretation, and the experimental conclusions that can be drawn.
The proposal of an embedded vision system should efficiently and accurately detect and recognize traffic signs, while also robustly identifying road edges. These systems play a vital role in functions such as driver assistance systems [68], pedestrian detection, lane departure warning, traffic sign recognition, and autonomous driving. By leveraging AI algorithms and advanced image processing techniques, these systems can accurately detect and recognize objects, pedestrians, road signs, and lane markings, providing invaluable insights to both drivers and autonomous driving systems. As automotive manufacturers continue to invest in the research and development of embedded vision technologies, we can expect further advancements that will drive the future of transportation towards safer, smarter, and more efficient vehicles.
Traffic signs are characterized by regions of interest that can identify them in road traffic (color and geometric shape), followed by the recognition or classification of the detected signs according to the type of their pictograms. For road edges, detection is based on a model of the road, followed by the recognition or estimation of the steering angle of wheels according to the scenario (left, middle, or right), in order to assist the driver during the conduction period.
A Multi-Cue Visual Tracking Framework refers to a system in computer vision designed to track objects using a combination of visual cues, which can originate from a single modality or multiple sources. Single-modal tracking relies solely on one type of input, typically visual data, while multimodal tracking integrates various inputs such as depth, motion, or thermal information to enhance robustness. These frameworks aim to improve accuracy and adaptability by incorporating features like color, shape, texture, and motion.
As illustrated in Figure 10, visual tracking methods are generally divided into two major categories: traditional tracking approaches and deep learning-based approaches. Traditional methods include stochastic, deterministic, generative, and discriminative strategies, which are typically based on handcrafted features and fixed models. In contrast, deep learning-based methods, including those that utilize deep or hyper features, offer more flexible and data-driven solutions that adapt to complex environments and object variations. This comparison highlights the evolution from rule-based models to learning-based systems, reflecting a broader trend in the field toward higher accuracy and scalability. Implementation of these frameworks involves algorithms for feature extraction, object representation, and model updating, often leveraging modern machine learning techniques. Ongoing research continues to explore more efficient and reliable tracking solutions, particularly for use in real-time, dynamic settings such as autonomous vehicles, surveillance, and interactive systems.
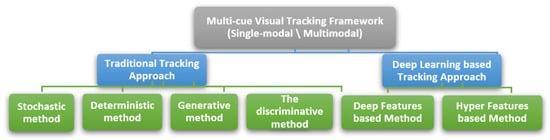
Figure 10.
Object tracking methods.
3.1. Traditional Tracking Approach
The traditional tracking approach in computer vision relies on predefined rules and manually designed features for object tracking in a video. It involves extracting features like color, texture, or edges, creating a model or template for object representation, and estimating motion using methods like optical flow or template matching. Matching and localization are performed across frames, often employing correlation-based techniques. Filtering methods, such as Kalman filters, are used for accuracy improvement [69].
Each tracking method offers distinct strengths (Table 2): deterministic approaches ensure stability and precision in structured tasks, while stochastic methods enhance adaptability under uncertainty. Generative models enable synthetic data creation by learning data distributions, supporting augmentation and representation learning.
Table 2.
Two-dimensional tracking approaches and their mathematical models.
The discriminative methods excel in classification by learning decision boundaries, but require labeling data. The choice of method depends on the task complexity, data variability, and system objectives.
3.2. Deep Leaming Based Tracking Approach
In tracking objects in video sequences, a deep learning-based approach employs neural networks, particularly deep ones, to enhance tracking performance. This methodology leverages convolutional neural networks (CNNs) for extracting hierarchical features, Siamese networks for discrimination between target objects and backgrounds, and recurrent neural networks (RNNs) or Long Short-Term Memory (LSTM) networks to capture temporal dependencies. Object detection networks like region-based CNNs (R-CNN) or You Only Look Once (YOLO) are integrated for simultaneous detection and tracking. Online learning and fine-tuning strategies allow adaptation during tracking. Tracking-by-detection methods use pre-trained object detectors, and data augmentation techniques enhance generalizations. Challenges include addressing occlusions, scale, and pose variations and maintaining real-time performance. Some approaches strive for end-to-end learning, directly processing raw input frames to object tracks without explicit feature engineering. These methods showcase improved accuracy, especially in scenarios with complex motions and appearance variations, evolving with advancements in neural network architectures and training strategies.
This Table 3 summarizes advanced tracking strategies leveraging deep learning and hybrid features. Deep and hyper features improve robustness by combining semantic and handcrafted cues, while transformer-based models offer global attention mechanisms for superior context modeling. These methods significantly enhance accuracy and adaptability in complex visual environments.
Table 3.
Deep feature extraction methods in visual tracking.
3.3. Three-Dimensional Perception and Structured Scene Understanding
Current research in intelligent transportation systems increasingly leverages 3D perception and structured scene understanding to complement traditional 2D approaches. In railway applications, RailVoxelDet introduces a lightweight voxel-based LiDAR pipeline optimized for long-range object detection with competitive inference speed and computational efficiency [81,82]. Similarly, Rail-PillarNet builds upon PointPillars with a parallel attention encoder and transfer learning enhancements to detect foreign objects effectively without substantial parameter increase.
Beyond railway scenarios, Bird’s-Eye-View (BEV) representations have become a standard for structuring multi-sensor data. Frameworks like BEVFormer learn unified BEV features via spatio-temporal transformers, effectively fusing camera and LiDAR data into a robust 3D scene understanding model [83]. End-to-end fusion models such as BevDrive integrate cameras–LiDAR fusion directly into motion planning via BEV constructs, demonstrating the value of perception planning synergy [84].
Another emerging area is non-destructive measurement and interpretable diagnostics, especially relevant in safety-critical systems. For example, methods using physical constraints-guided quadratic neural networks enable interpretable fault diagnosis without needing fault samples, enhancing reliability through explainability, a trend gaining traction for embedding perception into maintenance workflows. To provide a concise overview of the mathematical foundations supporting recent 3D perception methods, Table 4 summarizes representative approaches, their core equations, and key references.
Table 4.
Representative mathematical models in 3D perception and structured scene understanding.
Overall, these approaches reinforce the role of 3D perception as a necessary complement to traditional 2D methods, providing a more comprehensive perspective for intelligent transportation systems.
3.4. Dataset Description
Both traditional tracking methods and deep learning-based approaches fundamentally rely on comprehensive datasets of images and lane markings to achieve reliable performance. Traditional techniques, which utilize handcrafted features like edges and colors, require diverse image datasets to handle variations in lighting, weather, and road conditions. Likewise, deep learning methods demand well-annotated datasets for training and testing, allowing the models to learn and generalize effectively across different scenarios. To ensure robust real-world applications, datasets must encompass a wide range of environments, including challenging conditions like occlusions or extreme weather. Without such data, neither strategy can perform reliably or adapt to dynamic situations. These datasets cater to various aspects of the automotive sector, including lane detection, geolocation, traffic sign recognition, and driver behavior analysis, making them vital for advancing intelligent transportation systems.
3.4.1. German Traffic Sign Recognition Benchmark (GTSRB)
The GTSRB dataset is essential for training and evaluating automatic traffic sign classification algorithms, particularly for advanced driver assistance systems (ADASs) and autonomous vehicles [87]. GTSRB contains 43 classes of German traffic signs, with over 50,000 annotated images. The images vary significantly in terms of perspective, lighting, resolution, and environmental conditions (e.g., blur, shadows, and distortions). These characteristics make the dataset ideal for testing the robustness of models in real-world scenarios.
3.4.2. LISA Traffic Sign Dataset
This dataset is used to train models capable of recognizing American traffic signs, even in complex environments with variations in perspective, occlusions, and lighting conditions.
The LISA datatest contains over 6600 images with 7855 annotations covering 47 classes of signs [88]. The images are captured in urban and suburban environments. Each sign is annotated with detailed information about its position, size, and type, making it a valuable resource for training and testing visual recognition systems.
3.4.3. Cityscapes Dataset
Cityscapes is widely used for semantic segmentation of urban scenes, a crucial task for autonomous navigation and understanding complex road environments [89]. This dataset features thirty annotated classes, including eight related to traffic signs and road markings. It offers 5000 finely annotated images and 20,000 images with simplified annotations, captured in 50 European cities. The annotations include pedestrians, vehicles, signs, and other urban elements, enabling detailed interpretation of traffic scenarios.
3.4.4. TuSimple Lane Detection Dataset
This dataset is specifically designed for lane detection tasks, which are essential for lane-keeping systems and autonomous driving applications.
TuSimple provides 6408 annotated road images, primarily of highways. The annotations include precise lane line positions captured under various conditions (e.g., daylight and twilight). This dataset presents realistic challenges for developing reliable lane detection algorithms [90].
3.4.5. CULane Dataset
CULane is suited for studying road markings in complex urban environments, such as intersections and poorly marked roads. With approximately 133,000 annotated images, this dataset covers diverse scenarios, including roads bordered by vegetation, intersections, and unmarked areas [91]. The detailed annotations help identify both straight and curved lanes, making it ideal for navigation studies in real-world environments.
3.4.6. U.S. Traffic Signs Dataset
This dataset is critical for recognizing traffic signs specific to the United States, offering a wide range of scenarios to test the robustness of recognition models [92]. It includes several thousand annotated images representing over 100 classes of traffic signs. The images show variations in lighting, perspective, and weather conditions, reflecting real-life situations.
3.4.7. Traffic Sign Dataset—Classification
This dataset enables the study of traffic signs in European environments, providing data tailored to regional diversity of robust models. It contains thousands of annotated images across 58 classes of signs [93]. The images capture varied environments, from rural areas to large cities, under different weather conditions.
3.4.8. Caltech Pedestrian Dataset
This dataset is crucial for pedestrian detection, a fundamental task for ensuring the safety of autonomous driving systems in urban environments.
The dataset contains approximately 250,000 annotated images capturing pedestrians under diverse conditions, including varying lighting and crowd density [94]. These annotations help train models to detect pedestrians accurately and efficiently.
3.4.9. KITTI Dataset
The KITTI dataset is widely recognized in the autonomous driving community as a foundational benchmark for evaluating both visual and geometric perception algorithms. Collected using a real-world vehicle equipped with stereo cameras, a rotating LiDAR scanner, GPS, and inertial sensors, KITTI captures diverse urban and highway scenes with high precision. It includes ground truth annotations for object detection, lane estimation, optical flow, and depth prediction, enabling robust cross-modal training and validation of perception systems [95]. Its multimodal structure makes it particularly valuable for the development of end-to-end models that integrate both spatial and semantic understanding. Recent advancements in this area include Vision–Language Models (VLM) and Vision–Language–Action (VLA) frameworks, which unify perception and decision-making by leveraging aligned visual and textual data. These architectures enhance interpretability and improve decision robustness in complex urban scenarios [96].
3.4.10. Malaysia Roads Dataset
This dataset is designed for recognizing road markings and signs specific to Malaysian roads. It contains thousands of annotated images featuring road markings and signs unique to the region. This data is crucial for adapting visual recognition systems to local requirements [97].
3.4.11. STS Dataset (Simulated Traffic Sign Dataset)
The STS dataset is designed for training and testing algorithms for traffic sign recognition in simulated and real-world environments. This dataset includes a large number of traffic sign images generated through simulation tools to represent diverse conditions [98]. It focuses on various weather conditions, lighting scenarios, and perspectives. STS datasets are particularly useful for augmenting training datasets where real-world data is limited.
3.4.12. Belgian Traffic Sign Classification Dataset
The BTSC dataset is used for traffic sign classification tasks, specifically focusing on Belgian traffic signs. It supports the development of systems that recognize diverse regional traffic signs [99]. The dataset contains more than 10,000 images of 62 classes of Belgian traffic signs, including regulatory, warning, and informational signs. The images cover varying conditions such as partial occlusions, different angles, and lighting variations, making it highly suitable for robust model training.
3.4.13. Driver Inattention and Traffic Sign Dataset
The DITS dataset focuses on driver behavior analysis in relation to traffic sign recognition. It is useful for evaluating driver attention and alert systems. DITS includes synchronized data of driver behavior, traffic signs, and vehicle performance [100]. The dataset contains recordings of traffic sign encounters in various driving conditions, including challenging scenarios like night driving or adverse weather. It helps in developing systems that detect driver inattention and generate warnings when signs are ignored.
3.4.14. Text-Based Traffic Sign Dataset in Chinese and English (TTSDCE) Dataset
The Traffic Guide Panel dataset includes thousands of images focused on highway guide panels with English text, serving as a benchmark for text-based traffic sign recognition. Due to limited availability of annotated training data, the method relies on a self-collected dataset named TTSDCE. This dataset contains 1800 images featuring traffic signs in Chinese and English, collected from various sources such as cameras and online images. It demonstrates flexibility in multilingual scenarios and is expected to be released for research in the future.
3.4.15. Comprehensive Analysis and Comparison of Automotive Datasets
Table 5 offers an in-depth comparison of various automotive datasets, each tailored to specific research and application needs in the field of intelligent transportation systems. The datasets vary widely in terms of category, image volume, class diversity, and annotation types, reflecting their unique purposes. For instance, the GTSRB dataset and LISA datatest are focused on traffic sign recognition, boasting 43 and 47 classes, respectively, making them ideal for developing models that classify diverse road signs. In contrast, datasets like CULane and TuSimple prioritize lane detection tasks, with thousands of annotated images capturing road lane points under challenging conditions such as occlusions and poor lighting. The Cityscapes datatest stands out for its pixel-level annotations across 30 classes, making it a prime choice for urban scene segmentation in autonomous navigation.
Table 5.
Comparison of automotive datatests.
The KITTI datatest and Caltech Pedestrian datatest diversify the landscape by targeting multiple vision tasks, including 3D bounding box annotations and pedestrian detection, respectively. While some datasets, such as the GNSS datatest, offer geospatial metadata crucial for localization, others like the STS datatest and BTSC datatest excel in providing robust traffic sign classification data. Additionally, datasets such as Malaysia Roads and Tunisian Road Signs are particularly valuable for region-specific research, ensuring adaptability across varying environments. The inclusion of details like resolution, annotation type, and metadata availability further highlights the datasets’ tailored applications. Datasets offering augmentation options, such as GTSRB, present an edge by simulating real-world complexities, whereas proprietary datasets like U.S. Traffic Signs and DITS underline the importance of accessible data-sharing initiatives in advancing the field. The Traffic Guide Panel dataset and the TTSDCE dataset are essential for advancing text-based traffic sign detection and recognition, particularly in multilingual contexts.
Each dataset, while addressing unique challenges, collectively forms a comprehensive foundation for developing innovative solutions in intelligent transportation, showcasing a balance between global applicability and specialized focus areas. This diversity ensures that researchers can choose the most appropriate datasets for their specific needs, whether the task involves recognizing a multitude of traffic signs, detecting lanes in varied conditions, or analyzing driver behavior in response to environmental cues.
Beyond the technical details summarized in Table 5, the comparison should also account for differences in licensing and commercial restrictions, as well as the strategies and costs of adapting models trained on synthetic data to real-world driving scenarios.
4. Results and Discussions
Identifying and recognizing traffic signs as well as road lane markings are essential for modern intelligent transportation systems and autonomous vehicle operations. Various innovative techniques rooted in artificial intelligence (AI) and image processing have been developed to enhance precision and robustness in these tasks. Deep learning methods, including convolutional neural networks (CNNs), are commonly utilized for classifying traffic signs, while object detection frameworks such as YOLO (You Only Look Once) and the Faster R-CNN have shown success in detecting signs in real time. For lane marking detection, segmentation models such as U-Net and SegNet are frequently applied, providing accurate delineation of road boundaries. Traditional approaches like edge detection using Canny and Sobel filters, alongside Hough Transform techniques, also play a significant role in identifying lane structures. Recent studies have further incorporated temporal analysis using neural networks like RNNs and LSTM to address dynamic road environments. To optimize performance, preprocessing techniques such as noise reduction, contrast adjustment, and region-of-interest (ROI) selection are often implemented.
While vision-based techniques offer detailed spatial and semantic information, they remain sensitive to variations in lighting, weather, and occlusion. Visual sensors alone cannot guarantee consistent performance across all conditions. As a result, many systems now incorporate data from complementary sensors, such as LiDAR and radar, which provide depth and robustness in challenging environments. This fusion of modalities helps compensate for the weaknesses of camera-only perception, making the overall system more reliable and better suited for real-world deployment. While the reviewed approaches highlight the strengths and weaknesses of 2D vision-based detection, several recent studies stress that extending perception into 3D provides a way to mitigate these weaknesses. Depth-aware cues from LiDAR or stereo enhance stability under occlusions, night driving, or adverse weather, where 2D methods alone often fail [101]. This perspective confirms that 3D is not a substitute but a complementary extension, ensuring more reliable intelligent transportation systems [102].
4.1. Image Processing Methods
Detection approaches vary depending on the methodology or strategy adopted, but they generally fall into three main categories. Firstly, there is the detection of object geometry. Secondly, there is color-based detection for localizing objects through segmentation, which identifies regions of interest. Lastly, artificial intelligence, particularly deep learning techniques, is increasingly employed for object detection tasks.
4.2. The Color-Based Methods
Color-based segmentation stands out as a swift detection method. Utilizing specific filters, algorithms swiftly extract regions of interest, enabling the identification of distinct objects. Nonetheless, fluctuations in lighting conditions can introduce inaccuracies or unwanted outcomes. To mitigate this challenge, researchers have explored diverse segmentation techniques based on various color spaces. These approaches find utilities across a spectrum of applications, including lane recognition, traffic sign detection, and vehicle license plate recognition.
4.2.1. The Methods That Use the RGB Space
The majority of algorithms directly use the color space of vision, i.e., RGB, provided that the parameters are fixed. Ruta [20] applied a segmented color enhancement technique, specifically using the colors yellow, blue, and red, with the choice of the channel of the dominant color in relation to the others made according to the following transformation (Equation (26)):
For each pixel, S = r + b + g; x = [r, g, b].
One downside of employing RGB space is its vulnerability to variations in lighting conditions, as we can encounter scenes with insufficient or excessive light that can cause problems in segmentation [103].
An approach based on SVFs (Simple Vector Filters) [104] (Formula (27)) uses f(r, g, b) < 1 for achromatic color and f(r, g, b) ≥ 1 for chromatic color. R, g, and b represent the brightness of each color, respectively, and D is the degree of extraction.
The authors obtained good results in the separation of colors: red, blue, and yellow. For each pixel, x = [xr, xg, xb], the SVF will be calculated according to the following Equation (28):
The images are divided according to illumination changes into two classes: cloudy and sunny. The segmentation step takes 60 ms on average.
4.2.2. Methods That Use Non-Linear Color Spaces
Some algorithms use color enhancement techniques, which require color coordinate transforms, so Nnolim [8] applied color segmentation using non-linear color spaces. Studies using this solution have shown that the system is feasible. This includes the HSI and HSV color spaces. Equation (29) represents RGB transformation into HSV, as follows [105]:
In the HSV color space, hue represents the angle of rotation between the red plane and the origin, while saturation denotes the distance from any point in the color space to the color’s surface. The value (V) signifies the intensity or brightness attribute of the image’s channel.
Equations (30) and (31) for the conversion from RGB to HSI are given as follows:
such that
The HSI color space is grounded in human visual perception and color interpretation, characterized by a color hexagon, triangle, or circle model. Its attributes—hue, saturation, and intensity—bear resemblance to the HSV system, yet their mathematical formulations differ. In the hexagonal model, primary and secondary colors serve as vertices, while in the color triangle model, they are represented by line segments. The color wheel illustration demonstrates that primary and secondary colors are spaced apart by 120°.
Other authors [106] have used Otsu’s method with fuzzy logic in order to locate the regions of interest, applied exactly to extract the thresholds of the constituent elements (H, S, and V) of the HSV space, but the constraint that was posed is that the calculated distance between the colors is very close, because the HSV space is not symmetric. The method of Otsu applies automatic thresholding, compared to others that prefer to use manual thresholding [107], due to variations in the illumination of the RGB space. To limit the values of the optimal thresholds (Red, Blue) as is illustrated in Table 6, the pixel is considered red or blue if the H, S and V components meet the conditions. The advantage of this method is to eliminate noise.
Table 6.
The range of thresholds for the H, S, and V components of traffic signs.
Liu [108] also used manual thresholding, which performed well across different lighting conditions. Additionally, he introduced a novel thresholding approach that leverages color information from neighboring pixels to obtain output masks for each color using hue/saturation thresholding (Formula (32)).
where H and S are the hue and saturation channels; and et are the fixed thresholds that can be found in [109].
The HSI space has two color components, hue and saturation, which are closely related to human perception. Hue represents the dominant value of color. Saturation represents the purity of color. HSI components can be obtained from RGB [110]. Moreover, this space is unstable near achromatic colors and cannot be used directly on these pixels. So the authors applied the HST technique [109] for the colors red, yellow, and blue, as shown in Table 7. The obtained hue site H was in the range [0, 360], and the saturation S was between [0 and 255]. They also used the HEST method, based on the LUT technique, described by four parameters, hmin, htop, hmax and smin, shown in Figure 11, to improve the hue and saturation of colors that can be found in their paper [111]. It is in fact a flexible threshold, where different values are assigned using linear functions.
Table 7.
The range of thresholds for the HST space.
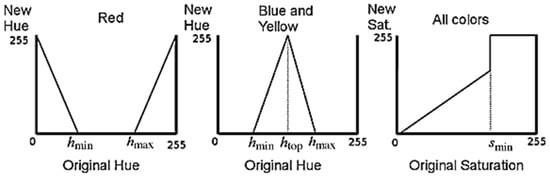
Figure 11.
HSET color LUTs for the HSET method [111].
4.2.3. The Methods That Use Color Spaces Linear
Specific lighting conditions profoundly affect the color perception of road signs. Most approaches are based on HSV or HSI color space, but the camera used for this application has a raw Bayer output, and a conversion would be too computationally expensive due to the introduced nonlinearity. L. Song [112] chose to use the color space YUV, where Y represents the intensity, and U/V represents the color difference. The linear transformation between RGB and YUV is given by the following Formula (33):
H. T. Manjunatha [113] used the YCbCr color space. The proposed strategy converts the traffic signs captured with RGB space to YCbCr space. The color thresholding technique is utilized to isolate the red color, which represents hazard signs, and subsequently eliminate any extraneous elements from the images. The transformation (Equation (34)) from RGB to YCbCr is shown below [114]:
Implementing the different methods led us to find the best method (color space), according to [115]:
- In individual images, optimal outcomes were achieved using the RGB method; however, in videos, this was not the case.
- The HSV space gives higher results, but on condition that the execution time constraint is eliminated.
4.3. Geometry-Based Methods
Detecting road signs through color segmentation faces numerous challenges, including adverse weather conditions like snow or rain, varying times of the day (morning, night), and fluctuations in object distance between the camera and the road sign. These factors significantly impact the signs’ appearance due to light reflections and other environmental factors. As a result, approaches relying solely on color-based methods may lack effectiveness and robustness in perceiving the environment accurately. To address this, some researchers are exploring more reliable detection techniques focusing on the signs’ geometry. This involves analyzing the contours of the objects in the image to detect signs, thus minimizing overlap with surrounding objects in the road environment.
4.3.1. Hough Transform
The Detection of the Roadway
During forward motion, a vehicle can be considered to undergo continuous movement. When searching for lane lines within a specific area, it is essential to streamline image processing. In cases where lane lines are typically distributed on both the left and right sides of the road, the Hough transform proves to be a valuable technique for feature extraction [116]. This method detects objects with distinct shapes, such as straight lines, circles, and ellipses. X. Wei [117] presented a road line detection approach primarily based on Hough line detection statistics. The core idea involves converting the Cartesian coordinate system of the image into a polar coordinate Hough space, transforming (Equation (35)) each pixel coordinate (P (x, y)) into (ρ, θ).
The point P (x, y) on the same line is satisfied:
t (Sx, Sy), and is the direction.
The discretization of and θ directly affects detection: coarse steps risk missing fine lane markings, while very fine steps increase computation and noise sensitivity. Selecting an adequate resolution is therefore a compromise between accuracy and real-time performance.
When utilizing an adjusted camera for lane line detection, there exists a substantial likelihood of the lane lines being obscured. Typically, these lines are situated on both the left and right sides of the roadway. To enhance the precision of the detection process, it is imperative to employ tracking technology, which augments both the velocity and accuracy of detection. This necessitates the application of the Hough transform to confine the scope of its voting space, as cited in [117]. Specifically, the parameters ρ and θ are adjusted to modulate the voting space’s range. The polar angle and polar radius are delimited by the boundary lines flanking the left and right sides, respectively.
The paramount criteria for traffic lane detection and tracking methods encompass both its velocity and dependability. W. Farage [118] introduced a novel approach termed LaneRTD (Lane Real-Time Detection), which leverages raw RGB imagery to delineate road margins, as depicted in Figure 12, through the segmentation of lane lines. The principal innovation of this method lies in its meticulous equilibrium between rapid processing, minimal resource consumption (notably in terms of memory and CPU usage), consistent reliability, and robustness, thereby satisfying the operational demands of systems designed for advanced driver assistance (ADAS) or autonomous vehicles. Predicated on the Hough Transform technique, this methodology incorporates a smoothing phase to mitigate the impact of discernible noise on the edge detection process, achieved through the application of a Gaussian filter. The Formula (36) for a Gaussian filter kernel with dimensions (2k + 1) × (2k + 1) is as follows:
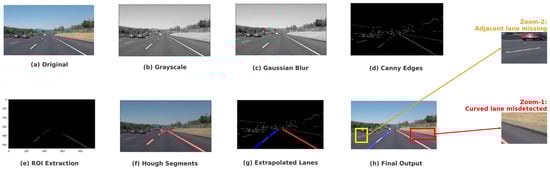
Figure 12.
LaneRTD pipeline for lane detection with annotated zooms highlighting failure cases (adjacent lane omission and misdetection of curved lanes). The red line represents the right lane boundary, and the blue line represents the left lane boundary.
The smoothing strength depends on σ and the kernel size k: larger values reduce noise but may blur lane edges, while smaller values preserve details but risk leaving residual noise. Proper tuning ensures a balance between robustness and efficiency.
For the purpose of edge detection and extraction, the Canny operator is employed. Given that an edge within an image may be oriented in various directions, the Canny method utilizes four distinct filters to accurately detect horizontal, vertical, and diagonal edges within the blurred image. The edge detection operator yields a value for the first derivative of both the horizontal direction (Gx) and the vertical direction (Gy). The gradient and direction of the edge can be ascertained as follows (Formula (37)):
The LaneRTD (Figure 12) method encounters important limitations: it mainly detects straight lane segments, which results in poor representation of curved lanes unless additional parameters are introduced to handle curvature. Experimental evaluation confirms this behavior: while detection accuracy on straight lanes remained above 90%, it dropped below 65% on curved lanes. Furthermore, adjacent lanes in multi-lane scenarios were frequently missed, with omission rates approaching 50% in our tests. Performance degradation was also observed under occlusions caused by vehicles and shadow patterns, where the false negative rate increased by nearly 40%. These findings highlight the need for more robust parameterization and feature modeling to improve stability under diverse driving conditions.
The segmentation method [119], utilizing the Hough Transform, was tested on sample pavement images (Figure 13), leveraging its intensive use for line detection by assessing connections between random point pairs and selecting those exceeding a user-defined voting threshold.
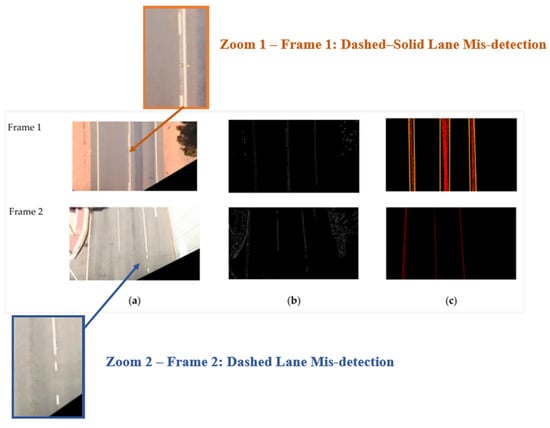
Figure 13.
Analysis of lane detection on pavement images highlighting misdetections: (a) input frames; (b) Canny edge maps; and (c) grouped Hough lines. Zoom 1—dashed–solid lane mis-detection; Zoom 2—dashed lane mis-detection. The red lines represent the detected lane boundaries, and the yellow lines represent the reference or fitted lanes.
For curved roads, the assumption remains valid, as only a 20 m segment in the near field was focused on. The transformation matrix was calculated to ensure that the resulting images approximately encompass the widest part of the pavement along the route and span a length of 20 m, enabling significant reductions in roadside facilities and plants (Figure 14).
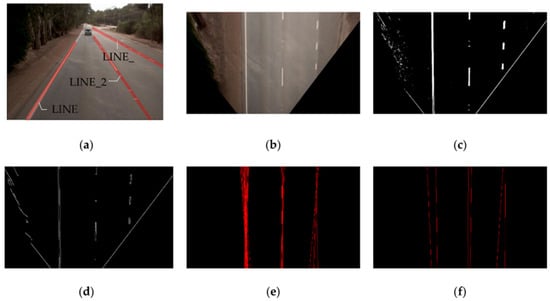
Figure 14.
Illustration of the image processing pipeline with segmentation results: (a) original input; (b) bird’s-eye perspective; (c) hybrid descriptor output; (d) Canny edge detection; (e) Hough transform output; and (f) segmentation stage.
The performance of lane detection methods depends strongly on the tuning of their parameters. Proper adjustment of discretization, smoothing, and thresholding ensures a balance between robustness, accuracy, and computational efficiency.
Detection of Traffic Signs
Traffic signs are categorized into three distinct groups based on geometric parameters that delineate their shapes: rectangles, circles, and triangles. The Hough transform, a dependable shape detection algorithm, is commonly employed due to its robustness against variations in illumination and partial obstructions. T. Bente [120] presented a driver assistance system in his paper, which is adept at identifying traffic signs through the use of an on-board camera. This system is also designed to alert drivers to potential lane deviations in videos recorded during daylight with moderately clear road markings. For the detection of traffic signs, the system utilizes an edge detection technique predicated on the Hough transform, as illustrated in Figure 15.
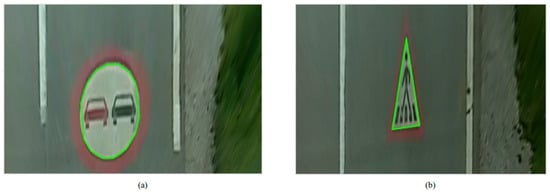
Figure 15.
Identifying various geometric shapes by HT: (a) Circular traffic sign forbidding overtaking.; (b) Triangular road sign alerting drivers to a pedestrian crossing.
Compared to other authors, M. García-Garrido [121] proposed a method for detecting triangular-shaped traffic signs. The idea is to detect three intersecting straight lines forming an angle of 60 degrees. Note that, since the number of intersecting straight lines could be very large if the Hough transform were applied to the entire image, more lines than the actual triangles existing in Figure 16 would be detected in the real road, presented in Figure 16.
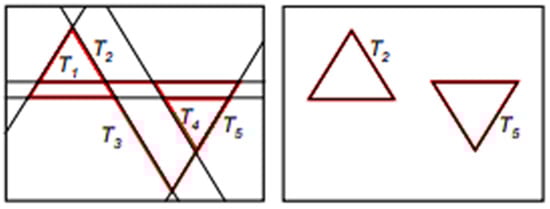
Figure 16.
Straight lines detected with the HT.
A limitation of this method is that we know neither the beginning nor the end of a straight line. This makes it necessary to apply the Hough transform to each contour, one after the other, which can increase the computation time in Figure 17.
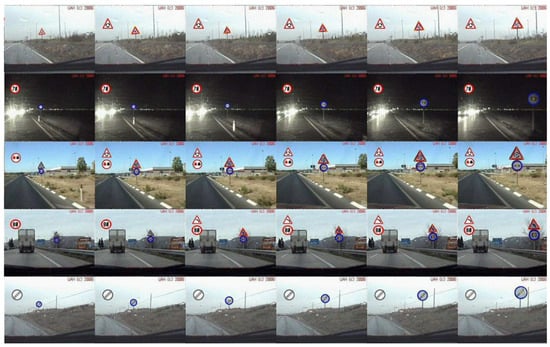
Figure 17.
Showcasing the detection of circular and triangular traffic signs.
The authors applied the same strategy for the detection of circular signs (including the stop sign). The estimation of the circular shape parameter is computed using the direction of the gradient of the studied contour according to [122]. Although the stop sign is octagonal, the difference between octagonal and circular signs is very small, and the former are also accepted. A circle in the (x, y) plane with center (χ, ψ) and radius ρ can be expressed according to the following Formula (38):
Á. González [123] conducted an extensive examination of the geometries present in traffic signs to enhance detection accuracy. The algorithm’s goal is to precisely locate signs within images. This is achieved through an analysis of shapes derived from edge images. The Hough transform is applied to detect arrow-shaped, triangular, and rectangular panels, as illustrated in Figure 18. Edge detection is performed using Canny’s method, preserving closed contours as an essential aspect of leveraging shape information in traffic sign detection. Encoded contours obtained through the Canny method include area and perimeter information, facilitating the identification of closed contours. Subsequently, only accepted contours meeting these criteria undergo Hough transform applications, leading to reduced CPU computation time.
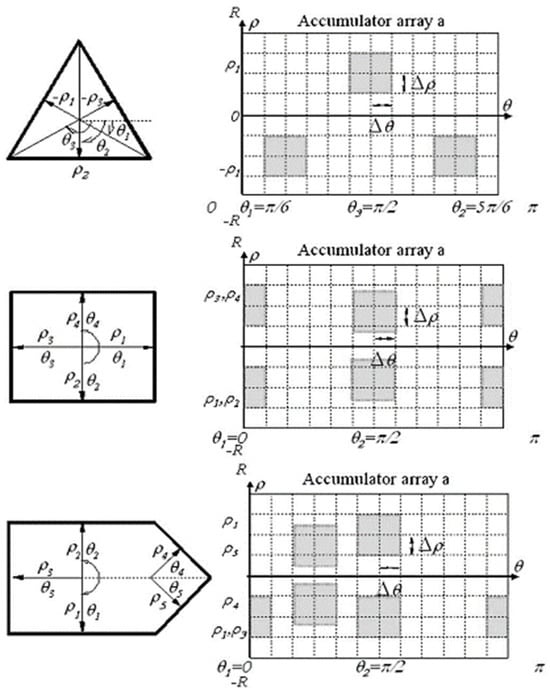
Figure 18.
HT Applied to detect triangular and rectangular panels.
The parameters that define these shapes are used to reduce the search space using an accumulation matrix. Therefore, any estimate of the parameters of a straight line is calculated using the following Formula (39).
where and have points belonging to the studied contour. These estimated parameters determine the search area inside matrix a, i.e., the shaded area in Figure 19.
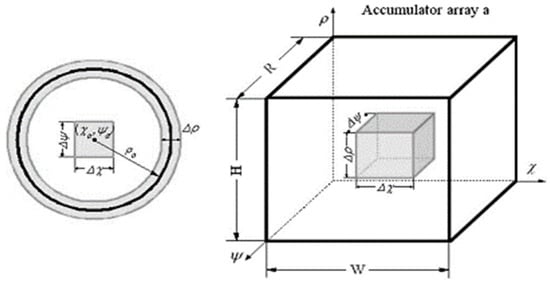
Figure 19.
HT applied to circular panel detection.
The search domain within the accumulator is confined; parameters pertaining to circular shapes are exclusively probed within designated shadow regions, as delineated in Figure 13. The pivotal advancement of this phase is the implementation of the Hough transform within constrained sectors of the accumulation matrix, maintaining precision. Employing this tactic enables the robust and real-time detection of diamonds, octagonal, and circular configurations, as evidenced in Figure 20.
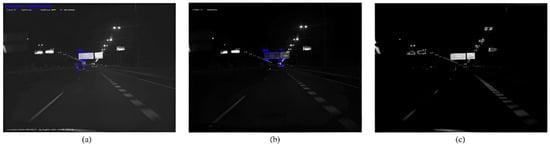
Figure 20.
Nighttime detection in real road environments. (a) Illuminated frame; (b) non-illuminated frame; (c) difference result.
The authors performed an assessment of detection and classification performances, outlined in Table 8, which presents the Hough detection ratios categorized by panel shapes. Panels were differentiated between detected and validated, with the latter requiring at least ten accurate detections. The overall detection rate achieved 99.81%, with a validation ratio of 98.10% for the signs. Particularly high ratios were observed for triangular, circular (STOP), and rectangular signs.
Table 8.
Detection ratio for HT method.
4.3.2. HOG Transforms
N. Romdhane [124] proposed a novel vision-based technique for detecting traffic signs. Initially, the method employs monocular segmentation, focusing on the color characteristics of candidate traffic signs. Subsequently, the Histogram of Oriented Gradients (HOG) operator is utilized to extract pertinent features. The results of this process are illustrated in Figure 21.
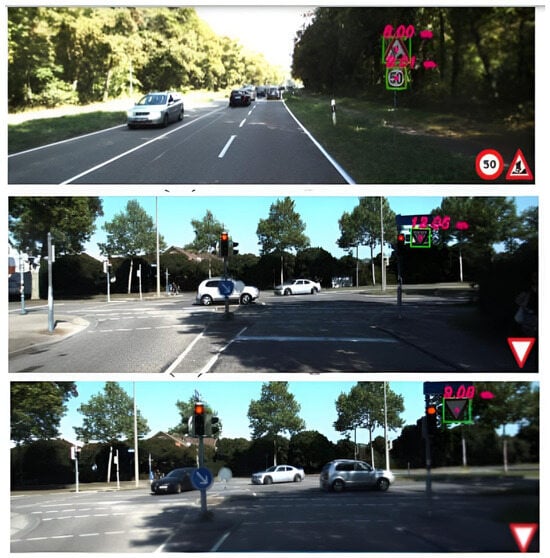
Figure 21.
Three-dimensional processing traffic sign distances.
In the proposed method, every potential traffic sign region is standardized to 32 × 32 pixels. This region is then subdivided into non-overlapping local regions of size 12 × 12. From each of these local regions, Histogram of Oriented Gradient (HOG) features are extracted. This process involves computing histograms of edge gradients with nine orientations from each of the 4 × 4 local cells. Each pixel’s gradient is discretized within one of the nine orientation bins. Ultimately, the primary aim of the HOG is to encode the detected traffic signs and generate the feature vector. This vector is subsequently utilized as input for a Support Vector Machine (SVM) classifier to determine the class of traffic signs.
N. Romdhane [124] performed tests with a sample of the images resized to 288 × 384 pixels and comparisons to the literature methods to prove the performance of the proposed detection method. Detection requires about 0.957 s per image, which demonstrates its applicability in real-time systems, demonstrated in Table 9. The HOG implementations were made on a GPU processor [125].
Table 9.
Treatment times.
The reported processing time of 0.957 s per image for traffic sign detection raises questions about its applicability in autonomous driving, where rapid and reliable decision-making is crucial. Although the authors optimized the method of resizing images to 288 × 384 pixels and implementing the HOG on a GPU, this processing speed may not meet the stringent real-time requirements of dynamic driving environments. While suitable for moderate computational scenarios, further improvements are necessary for high-speed applications.
To address this, incorporating lightweight models like MobileNet or YOLO-Tiny could help achieve faster processing times. Additionally, leveraging hardware accelerators such as FPGAs or TPUs could further enhance computational performance. Streamlining the current GPU implementation by reducing the complexity of feature extraction or introducing batch processing could also contribute to improved efficiency. Future research should evaluate this approach under more realistic and demanding conditions, including high-resolution images and diverse road scenarios. By refining these aspects, the method could better align with the performance expectations of autonomous driving systems, ensuring timely and accurate traffic sign recognition for safe navigation.
4.4. Centroids and Contours
C. Tsai [128] dedicated their efforts to crafting a vision-based Advanced Driver Assistance System (ADAS) centered around the Speed Limit Sign (SLS) algorithm. This algorithm is engineered to automatically detect and identify speed limit signs on the road in real time, leveraging captured images. To enhance the SLS’s recognition capability across various orientations and sizes of signs within the images, the study introduced a novel algorithm. It delineates the recognized road sign by leveraging the distances between centroids and CtC (Center-to-Contour) contours of the extracted sign content. Known as the CtC description method, it utilizes CtC distances as shape features to describe a binarized image of the sign content. Figure 14 depicts the block function diagram of the proposed sign content method, named DeepL, which comprises six processing steps. Denoting the input binary image as Ib (x,y), the initial step involves calculating moments (Equation (40)) of the image of order {0, 1, 2}:
where p, q = 0, 1, 2. Then, the centroid of the binary image can be calculated using Equation (41):
where and are the components of the centroid. On the basis of (42) and (43), three central moments of the second order, , and can be determined by Equation (15):
Then, the orientation of the binarized sign content is computed using the second-order central moments, such that (Equation (39))
where is the orientation angle of the panel.
Figure 22 depicts the concluding pair of principles associated with the CtC descriptor technique. Let us define () as a contour trajectory encompassing (n) contour points, extending from coordinates () to , where consecutive points and are neighbors for 1 ≤ i ≤ n − 1. If we consider that (N) distinct contour trajectories have been extracted from the input binary image, for instance, N = 4 in the context of Figure 23, then for the jème contour trajectory , with (j) ranging from 1 to (N), the computation involves determining the distance (Equation (44)) from the centroid of the image to each specific point along :
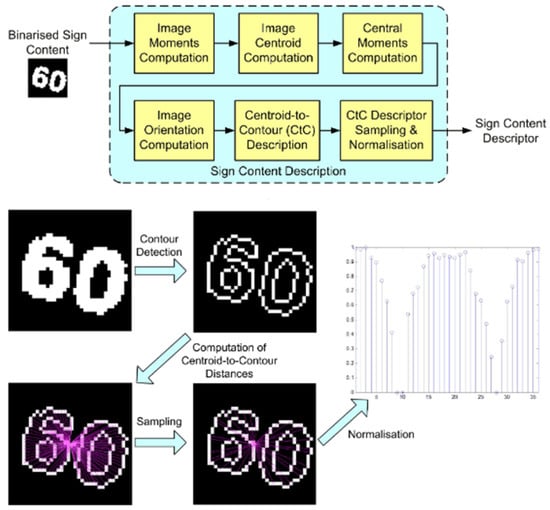
Figure 22.
Method of Description of the Form of Panels.
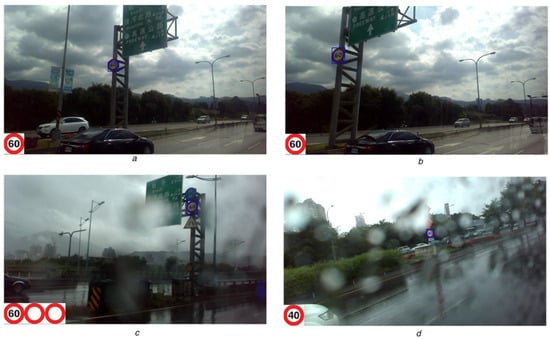
Figure 23.
SLS recognition with dynamic scale adaptation. Experimental results. (a,b) Overcast-day sequences with continuous translation and scale variation; (c,d) rainy-day sequences with varying rotation poses.
In this context, the coordinates for 1 ≤ i ≤ nj specify the position of a contour point on . The term nj represents the count of contour points on , and denotes CtC distance for each contour point on .
The study introduces the CtC descriptor, which demonstrates robustness against translational, rotational, and scale variations observed in Speed Limit Signs (SLS) within images, as illustrated in Figure 23. This robustness substantially improves the accuracy of a support vector classifier that has been trained on a comprehensive traffic sign database. Upon deployment, the SLS recognition method functions efficiently on two separate embedded platforms, both powered by a Quad-Core ARM processor and operating under Android 4.4. The experimental results corroborate the efficacy of the proposed method, evidencing high recognition rates coupled with the capability for real-time processing. Moreover, the method attains real-time performance, achieving up to 30 frames per second while processing video streams at a resolution of 1280 × 720 on a commercially available ARM-based smartphone, the Asus PF500KL (Figure 23).
4.5. Comparative Analysis of Traffic Signs and Road Lane Detection Methods
Each author proposes a unique method for detecting road signs, underscoring the diversity within the field. Our paper’s primary focus lies in developing an efficient detector capable of real-time operation. To ensure the reliability and practicality of approaches, we will conduct an in-depth comparison of the geometric methods previously discussed. This comparison will evaluate their suitability for real-time applications concerning both traffic signs and roadways. The findings of this analysis will be meticulously documented in Table 10. From our extensive study, we aim to discern the most effective strategy for constructing a robust detector capable of precisely identifying regions pertinent to road signs and road lines, including both right and left lanes, crucial for accurate lane detection. We hypothesize that a synergistic integration of color-based and geometric methods will prove to be the most efficacious approach in achieving conditions for realization vision system applicable for automotive.
Table 10.
Detection method based on shape.
4.6. Artificial Intelligence Methods
Learning methods, a category within machine learning techniques, have instigated a revolution across multiple industrial sectors, particularly within automotive embedded systems. Unlike traditional geometric and color-based approaches for object detection, learning methods offer substantial advancements. They mitigate challenges such as variations in brightness, temporal changes, scale adjustments, and object rotations. At the core of the effectiveness of learning methods lies the availability of extensive datasets and robust hardware infrastructure.
Detecting and recognizing traffic signs in the road environment poses a significant challenge. Gudigar [136] tackled this challenge by leveraging higher-order spectra (HOS) in conjunction utilizing characteristics based on texture to construct a structured traffic sign recognition (TSR) model, as depicted in Figure 24. These features offer a clear representation of both the form and content of road signs. Subsequently, a learning method employing K-NN architecture integrated with Linear Discriminant Analysis (LDA) graph subspaces within the linear discriminant analysis framework was employed to enhance discrimination power among various traffic symbols.
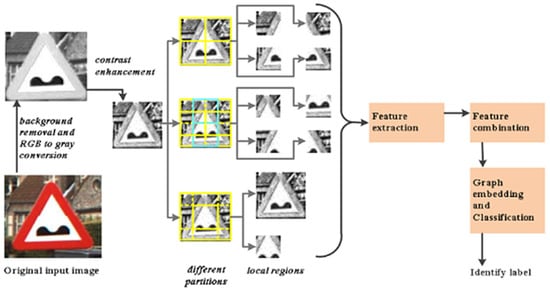
Figure 24.
The proposed TSR approach for localized texture of signs.
LDA applies covariance maximization between classes and minimizing covariance within a class. In practice, we have S training signs , with c classes, and the kth classes have Sk samples. The weight matrix for LDA can be described by incorporating the label information according to the following function (45):
In Table 11, the method presented in this study attained a peak recognition accuracy of 98.89%. This evaluation was conducted using two commonly accessible datasets: BTSC and GTSRB. However, there exists a notable absence of experimental results that sufficiently validate the effectiveness and reliability of the proposed method in achieving the specified recognition accuracy level.
Table 11.
Accuracy of the TSR approach.
On the other hand, the author G. Villalón-Sepúlveda [137] made an analysis of the detection rate as a function of the distance between the vehicle and the panel by proposing a statistical model detection approach (Figure 25).
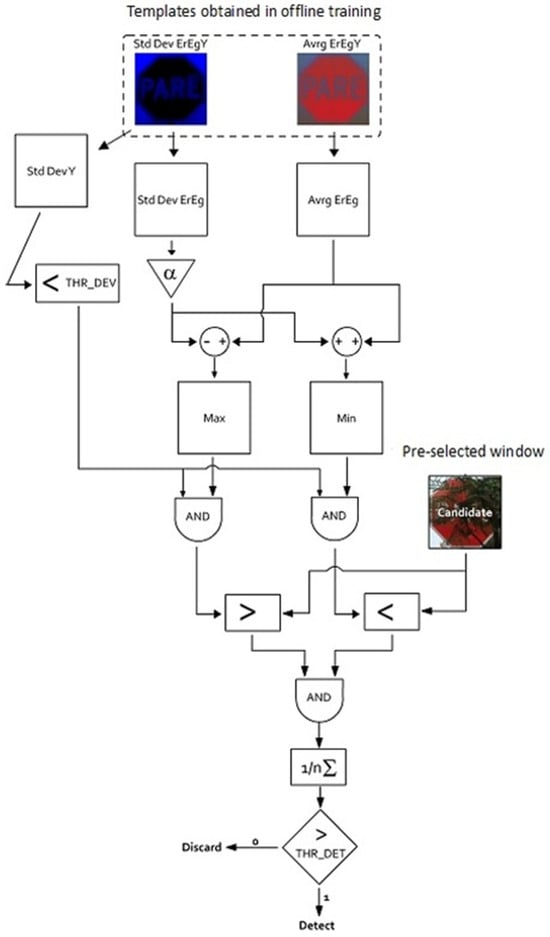
Figure 25.
Flow diagram depicting the recognition stage utilizing statistical models.
To validate the effectiveness of the current methodologies, tests were conducted using a training dataset consisting of 2567 images, among which 122 contained stop signs and 80 contained prohibitory signs. Additionally, a validation dataset was employed, comprising 273 stop signs and 447 no-passing signs. These datasets encompass a series of signs encountered at various intersections in Santiago, Chile, capturing real-world driving conditions marked by variable lighting and partial obstruction. The dataset has been made accessible to the Robotics and Automation Laboratory (RAL) at the School of Engineering, Pontificia Universidad Católica de Chile, to support further research and development in Advanced Driver Assistance Systems (ADASs).
The authors did not manage to detect signs for distances greater than 62 m or less than 20 m. Figure 26 shows that the Viola–Jones approach is very sensitive to possible changes in the signs searched.
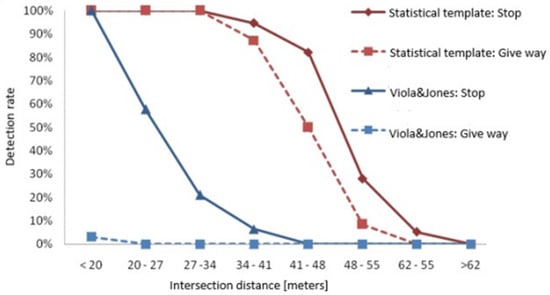
Figure 26.
Detection rate vs. distance comparison.
Ellahyani [138] showcased the efficacy of combining color and shape details for traffic sign recognition. Initially, the input image undergoes preprocessing using the mean shift clustering algorithm, which clusters relying on color information. Then, a Random Forest classifier segments the clustered image, as depicted in Figure 27. Notably, the mean shift clustering algorithm relies on two key parameters: spatial resolution (SR) and color resolution (CR).
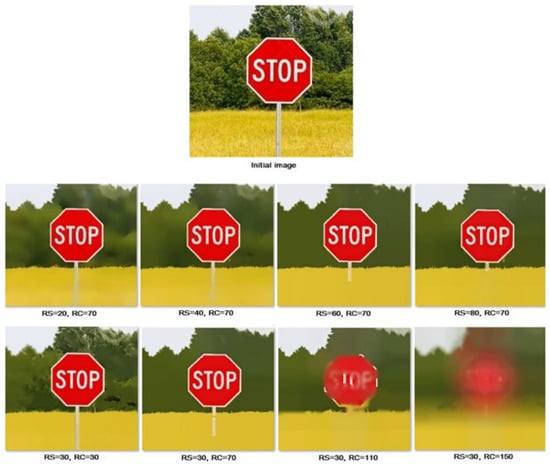
Figure 27.
The outcomes generated by utilizing SR and CR parameters.
SR = 30 and CR = 70 were chosen for their ability to ensure high accuracy, with over 297 true positives, while simultaneously maintaining minimal computation time, under 50 ms. The results of mean shift clustering as SR and CR vary are depicted in Figure 27.
Next, a log-polar transform is utilized for shape-based classification [139], coupled with the cross-correlation technique. This approach operates within polar coordinates, encompassing both the radial distance from the center and the angle. Log-polar coordinates are derived from the logarithm of the radial distance, allowing any point (x, y) to be expressed in polar coordinates (ρ, θ) as detailed in the equation below (46):
In this scenario, ρ represents the radial distance from the image’s center, while θ denotes the angle. The coordinates (xc, yc) signify the center of the window. Upon applying the conversion of polar coordinates into an image within the Cartesian domain, radial lines in the Cartesian domain are transposed into horizontal lines in the (ρ, θ) domain. As a result, rotations are transformed into cyclic translations along the θ-axis, whereas scaling is converted into translations along the ρ axis. Figure 17 serves as an illustration of a log-polar transformation. Notably, scaled and rotated patterns are transmuted into shifted patterns in log-polar space [140].
In this scenario, the variable ρ denotes the radial distance from the central point of the image, while θ represents the angular component. The coordinates (xc, yc) define the center of the window of interest. The transformation from polar to Cartesian coordinates within an image results in the conversion of radial lines in the Cartesian plane into horizontal lines within the (ρ, θ) domain. Consequently, rotational movements are expressed as cyclic translations along the θ-axis, and scaling variations manifest as translations along the ρ-axis. Figure 28 exemplifies a log-polar transformation, where it is observed that patterns subjected to scaling and rotation are effectively transformed into shifted patterns within the log-polar space, as referenced in [67].
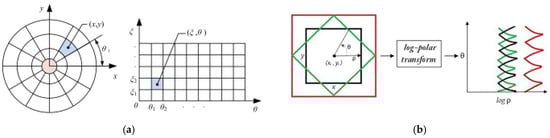
Figure 28.
Log polar transformation: (a) circular form and (b) quadrupole form.
Figure 29 exhibits the patches utilized in this study in comparison with the extracted regions of interest (ROIs) and their corresponding log-polar transformations. Cross-correlation is applied to assess the similarity between the log-polar transformations of the ROIs obtained through the segmentation step.
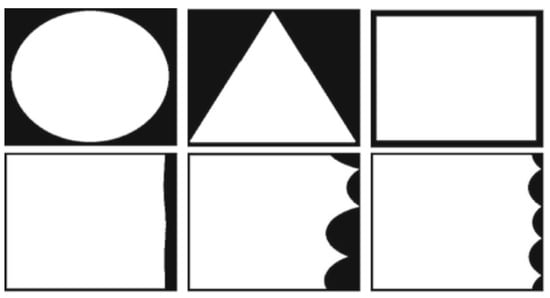
Figure 29.
Patches and log-polar transforms of panels.
The approach of detection proposed in this study underwent testing on both the GTSDB and STS datasets (Figure 30); the method achieves scores of 93.50% and 94.22% in terms of F-1 and AUC (Area Under the Curve) measurements, respectively, in Table 12. Precision and recall parameters [141] are calculated using Equations (47) and (48). FN, FP, TP, and TN are the false negative, false positive, true positive, and true negative samples, respectively. The Area Under the Receiver Operating Characteristic Curve (AUC) serves as a crucial metric for evaluating a computer vision model’s performance across different classification thresholds. This index holds significance as it provides a quantifiable measure of the model’s predictive capability. Essentially, the AUC reflects how well the model distinguishes between classes, making it an essential tool in assessing the overall effectiveness and discriminatory power of the computer vision system.
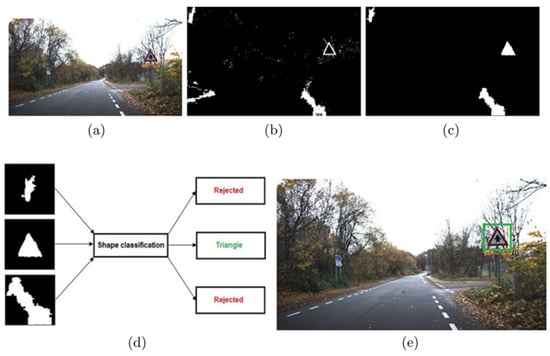
Figure 30.
Step used in the detection method. (a) Source image; (b) segmentation result; (c) segmentation adjusted for object size and aspect ratio; (d) shape categorization; (e) detected road signs.
Table 12.
The best values of the log-polar transformation method.
Accurate and robust lane recognition holds significant importance for the progress of autonomous vehicles in the foreseeable future. L. Kalms [142] introduced a robust algorithm utilizing the Viola–Jones method for lane recognition. The Viola–Jones method is deployed to detect traffic cones positioned off the “emergency case” road, as depicted in Figure 31. This paper [142] places particular emphasis on the setting of the steering wheel angle.
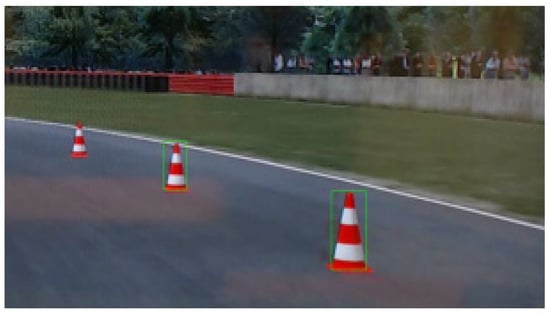
Figure 31.
Detection of cones in the road.
The arrangement of traffic cones is meticulously analyzed to construct an accurate road model, which facilitates the autonomous and secure maneuvering of vehicles in exigent circumstances. This methodology is implemented on a Raspberry Pi apparatus and its efficacy is evaluated through a driving simulation. In the context of high-definition imagery, with a resolution of 1920 × 1080 pixels, the temporal requirement for object detection is achieved in under 218 milliseconds, while maintaining a commendable detection accuracy. Furthermore, the computational demands for the formulation and actualization of autonomous vehicular control are remarkably minimal, necessitating merely 0.55 milliseconds
Therefore, according to the methods and strategies discussed above, we make a comparison of accuracy and time for detection and recognition, either for road signs or for road lanes, in Table 13 and Table 14.
Table 13.
Detection and recognition of road lanes.
Table 14.
Detection and recognition of traffic signs.
4.7. Recognition Methods
In this section, we will discuss one of the techniques that plays a key role in the development of intelligent transportation systems. Techniques that use manual methods to extract features from traffic signs, as well as voices from the road, are combined with an intelligent phase to recognize objects, such as deep learning to detect and recognize objects at the same time.
4.7.1. Learning Methods Based on Manually Extracted Features
S. Azimi [153] introduced an advancement in the form of wavelet-transform-augmented fully convolutional symmetric neural networks (FCNNs), specifically engineered for the autonomous segmentation of lane markings in aerial imagery via the discrete wavelet transform (DWT). The computation of the DWT for a signal x involves the application of a sequence of filters and subsequent subsampling across multiple scales, as depicted in Figure 32. To tackle the pronounced imbalance between the quantity of lane marking pixels and background pixels, a bespoke loss function was devised, complemented by an innovative data augmentation technique. This methodology has been demonstrated to achieve superior accuracy in the pixel-level identification of lane markings, outperforming contemporary methods, while independently operating without reliance on external data sources.
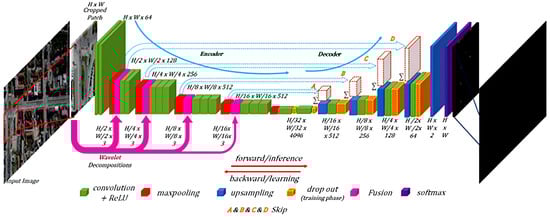
Figure 32.
The pathway-marking segmentation approach using FCNNs.
In the manuscript in question, the researchers delineate a robust and expedient segmentation algorithm tailored for diminutive entities, such as traffic lane demarcations in aerial imagery, achieving an impressive accuracy of 99.81% alongside substantial resilience. This is accomplished through the deployment of an Aerial LaneNet predicated on a fully convolutional neural network (FCNN) framework. The novel integration of Discrete wavelet transform (DWT) coefficients to augment FCNNs for pixel-wise semantic segmentation affords a comprehensive multispectral and multiresolution examination. This enhancement precipitates a marked augmentation in performance relative to the linear FCNN paradigms, as depicted in Figure 33.
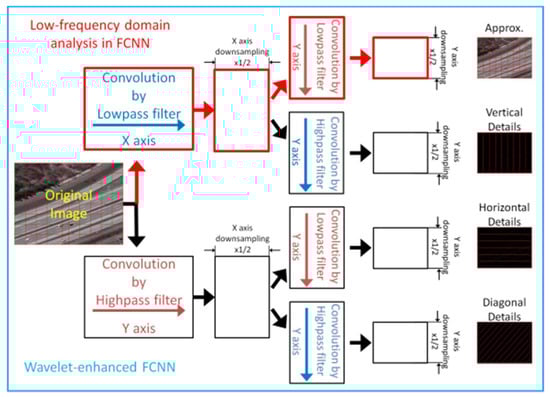
Figure 33.
The workflow for the initial-level DWT decomposition.
In their research, S. Aziz [154] proposed an innovative and efficient technique for traffic sign recognition by integrating complementary and discriminative feature sets. These features include the Histogram of Oriented Gradients (HOG), the Gabor feature, and the compound local binary pattern (CLBP), as depicted in Figure 34.
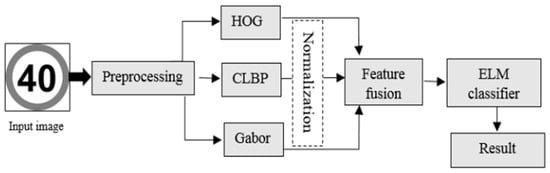
Figure 34.
A flowchart illustrating the proposed approach.
In the delineated methodology, referred to as compound local binary patterns (CLBPs), feature extraction is predicated on a refined variant of local binary patterns (LBPs). A 2-bit coding scheme is utilized to encapsulate the local textural attributes of an image. The initial bit is indicative of the signum function applied to the disparity between the center pixel’s value and that of its adjacent pixel. Concurrently, the second bit quantifies the magnitude of this difference, benchmarked against a threshold termed . This threshold is ascertained by computing the mean magnitude of the disparities between the central pixel and its neighbors within the immediate vicinity. Denoting a neighboring pixel as and the central pixel as , the threshold is derived as the average magnitude of the differences between and , in the local neighborhood (Figure 34). The binary code S(x) is then formulated according to the subsequent Equation (49):
The Extreme Learning Machine (ELM) algorithm is employed alongside the compound local binary pattern (CLBP) for classification (Figure 35). This innovative approach integrates complementary and informational features to enhance traffic sign recognition. The effectiveness of this method is evaluated using the German Traffic Sign Recognition Benchmark (GTSRB) and the Belgian Traffic Sign Classification (BTSC) datasets.
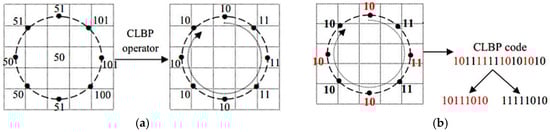
Figure 35.
Sub-CLBP generations steps. (a) Illustration of the operator CLBP. (b) Sub-CLBP generation.
The experimental results presented in Table 15 demonstrate that each feature individually achieves relatively high accuracy. However, the combination of three features (HOG + CLBP + Gabor) exhibits excellent complementarity, resulting in a rapid recognition rate of nearly 98%. This swift recognition rate renders it highly suitable for real-time applications. Z. Malik [155] presented an efficient technique to extract road signs from images. Detection involves segmenting based on color and subsequently utilizing the Hough transform to identify geometric shapes like circles, triangles, or rectangles. Recognition is achieved through three state-of-the-art feature matching techniques: Scale-Invariant Feature Transform (SIFT), Speeded-Up Robust Features (SURFs), and Binary Robust Invariant Scalable Key (BRISK) points.
Table 15.
Comparison of roads line recognition methods.
Illustrated in Figure 36 is the comparison of an exemplar road sign utilizing the three descriptors, while Table 16 presents a summary of the recognition rates. It is essential to highlight that recognition is performed under two distinct scenarios. The system was developed using Matlab, with an average processing time of 4.3 s on an Intel i3 machine equipped with 4 GB of RAM.
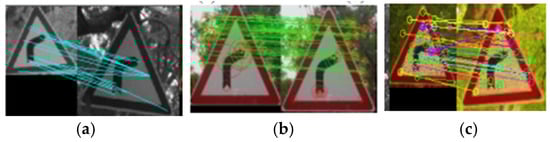
Figure 36.
The different descriptors for recognition of traffic signs: (a) SIFT, (b) SURF, and (c) BRISK.
Table 16.
Comparison of road sign recognition methods.
In the first scenario, the recognition performance is evaluated by comparing manually segmented road signs with those in the database. This approach assesses how accurately the system recognizes signs when provided with perfectly segmented images. In the second scenario, the detection system’s output, which may not perfectly segment road signs, is directly matched with signs in the database to identify real-world matches. This scenario evaluates the system’s ability to recognize signs in practical, imperfect conditions encountered in real-world settings.
The analyzed system, evaluated with a custom dataset, demonstrated favorable results in both detection and recognition tasks.
Upon comparative analysis of the three descriptors, it was found that the SIFT achieves the highest recognition rates, whereas the BRISK stands out as the most efficient in terms of computation time (refer to Figure 37). It is important to note that the system is specifically designed for processing daytime images. To enhance its functionality, future endeavors could focus on extending the system’s capability to detect and recognize traffic signs from images captured at night. While color-based segmentation provided acceptable detections, exploring more sophisticated techniques could offer valuable insights for further improving performance.
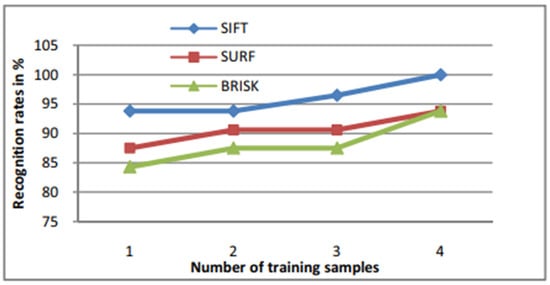
Figure 37.
Descriptor recognition rate as a function of the number of training samples.
P. Dhar [156] designed and developed a traffic sign recognition (TSR) system specifically tailored for Bangladesh signs. The system leverages color cues and employs a CNN as an extractor. The algorithm, depicted in Figure 38, follows these steps:
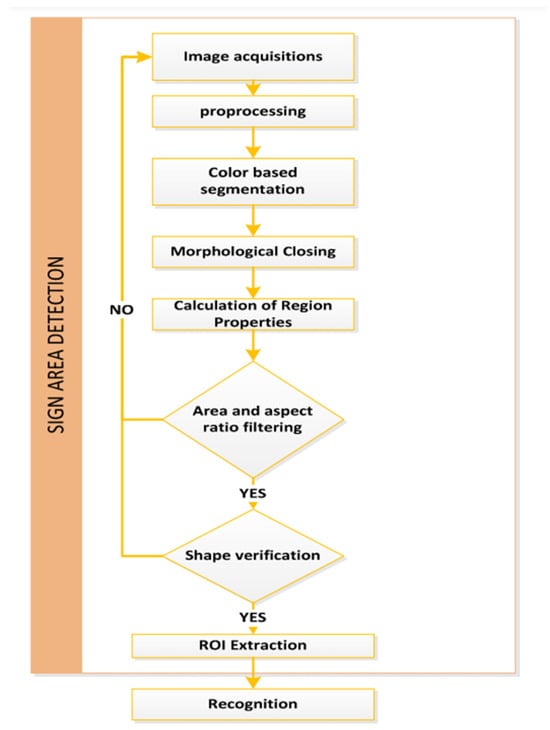
Figure 38.
The system’s algorithm.
- Acquisition: The input image is acquired.
- Pre-processing: Initial preprocessing tasks are performed.
- Segmentation: The image is segmented using color information from the HSV color model.
- Morphological Closure: Refinement of the segmented image occurs.
- Region Filtering: Filtering based on region properties and shape signature is applied.
- Region Cropping: The desired region (likely containing the traffic sign) is cropped.
- Classification: The extracted sign region undergoes classification using automatic feature extraction via the deep CNN.
This system aims to enhance traffic safety by accurately recognizing and classifying road signs.
The empirical findings underscore the commendable efficacy of the algorithm under scrutiny, as evidenced by its substantial recognition precision. Subsequent to feature extraction, the convolutional neural network (CNN) is subjected to a training regimen, which then enables it to categorize images based on the aforementioned features. The experimental setup was calibrated to a ceiling of 20 epochs, with an inaugural learning rate established at 0.0001. The computation of the mini-batch loss is executed via the cross-entropy function across K distinct classes, and the mini-batch accuracy metric reflects the ratio of accurately classified images within the current mini-batch by the trained network. The metric of accuracy is quantified as a percentage, derived from the ratio of the true positive rate to the aggregate count of images.
The proposed system achieves a significant classification accuracy of 97%, representing a noteworthy and competitive accomplishment. When evaluating the algorithm against alternative learning methods, the Speeded-Up Robust Feature (SURF) descriptor is utilized for feature creation. SURFs, a derivative of the SIFT, serve as both key point feature detectors and descriptors. Key points are identified based on the Hessian matrix with Gaussian differential (DoG), while descriptors are generated from Haar wavelet responses centered on these key points and their surrounding areas. Table 17 illustrates the classification accuracy achieved using SURFs across various classifiers. Upon thorough examination of the results, it is apparent that CNN outperforms other classifiers in terms of performance.
Table 17.
Accuracy of classification using SURF method.
4.7.2. Deep Learning Methods
Indeed, traffic sign detection systems are integral components of various real-world applications, including autonomous driving, safety systems, and driver assistance technologies. These systems play a crucial role in ensuring road safety, enhancing driver awareness, and facilitating efficient navigation on roads. By accurately detecting and interpreting traffic signs, these systems contribute significantly to improving overall road safety and enhancing the driving experience for individuals. Á. Arcos-García [157] evaluated various object detection systems, including SSD, the Faster R-CNN, YOLO V2, and the R-FCN, combined with various feature extractors, such as ResNet V1 50, ResNet V1 101, Inception V2, MobileNet V1, and DarkNet-19. This evaluation was conducted over time, as depicted in Figure 39.
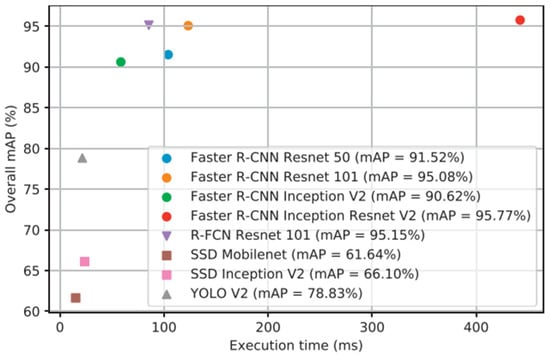
Figure 39.
Comparison of architectures based on their execution times.
The objective was to investigate the attributes of these object detection models, specifically adapted for the task of traffic sign detection. Transfer learning is primarily employed for this purpose. Specifically, to adopt object detection models pre-trained on the Microsoft COCO dataset for use with the GTSDB dataset, several adjustments are typically made. The mean Average Precision (mAP) calculation involves averaging the individual Average Precisions obtained for each class, as depicted in Figure 40.
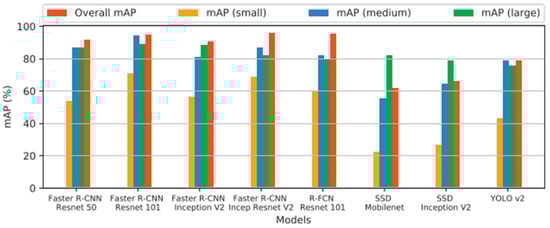
Figure 40.
Comparison of traffic sign detection accuracy across different detectors based on sign size.
The precision for a given recall point () is normalized by dividing it by the maximum precision achieved at any recall point greater than or equal to , as per Equation (2X). Here, p() represents the measured precision at recall . The cumulative precision, calculated at each point i where there is a change in recall, is multiplied by ∆, the corresponding change in recall, resulting in the overall sum [157].
Frames per second (FPS) is a measure that signifies the quantity of frames displayed on the screen. The higher the FPS, the more seamless the motion appears. In the context of this experiment, FPS is employed to classifier ability to achieve high mAP (Equations (50) and (51)).
The comparative analysis of these computational models is predicated upon a multitude of critical metrics, such as average memory allocation, floating-point operations count, precision (measured as mean Average Precision, mAP), shown in Table 18, parameter quantity, computational time, and the influence of the dimensions of traffic sign imagery. The findings reveal that R-CNN Inception, augmented with Faster ResNet V2, attains the apex in mAP. Concurrently, R-FCN ResNet 101 emerges as the paradigm of equilibrium between precision and computational expediency. Distinctively, YOLO V2 and SSD MobileNet are prominent; the antecedent secures commendable precision and is distinguished as the penultimate in detection rapidity, whereas the latter is celebrated as the preeminent model in terms of minimal memory requisites. Consequently, SSD MobileNet is deemed the quintessential candidate for integration within mobile and embedded apparatuses.
Table 18.
Properties of the models classified by average accuracy (mAP).
Álvaro Arcos-García [158] presented a novel deep learning approach tailored for traffic sign recognition systems. Through a series of classification experiments conducted on publicly available datasets of Belgian traffic signs, the proposed methodology leverages a DL NN architecture incorporating convolutional layers and spatial transformation networks, as depicted in Figure 41. Initially, the algorithm’s performance is evaluated using different optimizers, including SGD, RMSprop, and Adam, as illustrated in the following Figure 42. The convolutional neural network developed achieved an impressive recognition rate of 99.71% accuracy in tests.
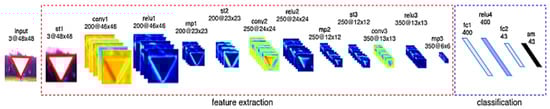
Figure 41.
CNN architecture for traffic sign recognition.
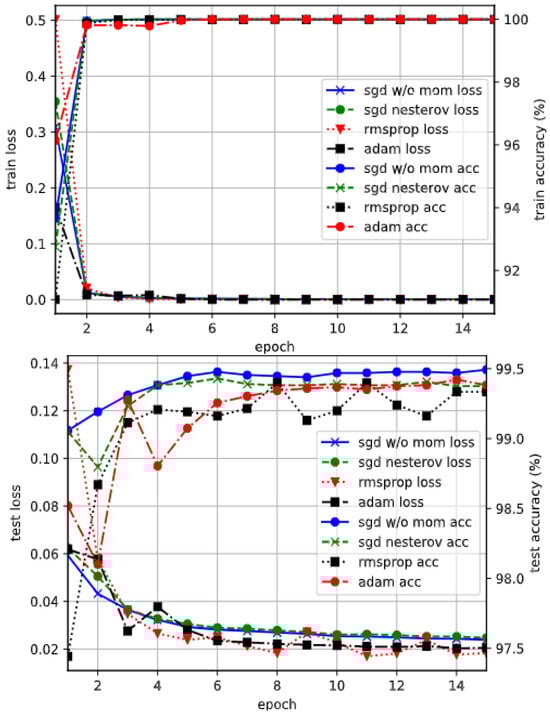
Figure 42.
Comparison of the function optimizers for CNN models.
The experiments are designed to evaluate the influence of different variables, aiming to develop a convolutional neural network that enhances the accuracy of traffic sign recognition, as detailed in Table 19.
Table 19.
Reported precision and recall for traffic sign recognition methods.
Hierarchical neural networks have demonstrated efficacy in learning features from images and classifying object classes. However, many existing networks focus solely on integrating low-to-medium-level cues for classification, overlooking spatial structures. In tasks such as scene understanding, the arrangement of visual cues within an image’s spatial distribution significantly impacts accurate analysis, especially in tasks like detecting roadway edges, as outlined in Table 20.
Table 20.
Detection and recognition of the lines of the road.
4.8. Impact of Lighting Conditions on Traffic Sign Detection: Methodological and Dataset Analysis
Variations in lighting, such as low light during nighttime, intense sunlight, and shifting shadows, present critical challenges for traffic sign detection and recognition systems. These environmental factors significantly affect detection accuracy, especially in dynamic real-world settings where lighting conditions constantly change. To overcome these limitations, it is essential to examine both the detection methods and the datasets used to train these models, ensuring their robustness and adaptability.
The following table, Table 21, provides a concise overview of this issue, summarizing key performance indicators for different detection methods and datasets. By analyzing detection accuracy, false positive rates, and the diversity of dataset conditions, these tables shed light on how lighting variability impacts the effectiveness of traffic sign and road lane recognition systems.
Table 21.
Diversity under lighting conditions.
The comparison of detection methods under various climatic and lighting conditions reveals notable performance differences. Advanced approaches, such as YOLO-based models, demonstrate a high detection accuracy of 92% with a low false positive rate of 6%, showcasing their reliability in challenging scenarios like shadows, glare, and low-light conditions. Similarly, the combined transfer learning and YOLO method achieves an accuracy of 91% and a false positive rate of 5%, reflecting its ability to generalize effectively across diverse datasets. In contrast, simpler techniques like adaptive image enhancement and color-based segmentation show lower accuracies of 85% and 80%, respectively, due to their sensitivity to extreme lighting changes. These findings highlight the advantage of deep learning-based techniques in maintaining precision and minimizing errors in real-world applications.
The analysis of datasets emphasizes the importance of diversity in enhancing detection performance (Table 22). For instance, the Mapillary Traffic Sign Dataset, with its wide range of lighting conditions, supports the development of robust detection models that perform well under diverse climatic scenarios. Conversely, datasets like GTSRB, primarily focused on daylight settings, offer limited adaptability to varying conditions. Cityscapes and KITTI datasets, designed for urban and highway environments, provide valuable annotations that enable algorithms to handle specific use cases effectively, such as lane detection and traffic sign recognition in challenging weather conditions. By utilizing datasets with broader coverage, like Mapillary, detection methods can achieve greater accuracy and resilience, ensuring reliability in dynamic and unpredictable real-world environments.
Table 22.
Comparison of datasets and their diversity in lighting conditions.
The ability of traffic sign detection models to generalize effectively is heavily influenced by the diversity of datasets used for training. Many widely used datasets, such as GTSRB, with over 51,000 images spanning 43 common sign categories, fall short when it comes to rare or region-specific traffic signs. Similarly, KITTI, containing 14,999 images focused on urban and highway environments, lacks sufficient coverage of less frequent signs. This imbalance in dataset representation limits the adaptability of models, reducing their effectiveness in recognizing uncommon traffic signs in diverse real-world conditions.
On the other hand, datasets like the Mapillary Traffic Sign Dataset offer broader coverage, featuring 100,000 images that include more than 200 unique traffic sign classes across varying lighting and geographic conditions. Such datasets enhance the robustness of detection systems by enabling them to learn from a richer variety of signs. Incorporating synthetic data generation and transfer learning techniques can further address the scarcity of rare sign examples, expanding dataset diversity. These approaches are vital to building models that achieve high accuracy and reliability across both common and rare traffic signs, ensuring they perform consistently in dynamic and complex environments.
4.9. Parameter Tuning and Its Impact on Model Performance
The effectiveness of traffic sign detection models is significantly influenced by their parameter tuning, which can directly affect convergence and accuracy. Fine-tuning parameters such as learning rate, batch size, and regularization factors is crucial for optimizing performance. However, improper tuning may lead to early convergence, limiting the ability of models to generalize in environments with complex variations. For instance, in YOLO-based models, an overly aggressive learning rate can result in suboptimal detection accuracy, especially under conditions involving shadow variations or occlusions [169]. Recent studies have proposed adaptive tuning strategies to address these challenges. For example, the Faster R-CNN model incorporates region proposal networks (RPNs), which dynamically adjust parameters based on feature extraction, achieving an accuracy of 92.0% even in challenging environments [170]. Similarly, SSD with an FPN leverages features pyramids for improved scale invariance, maintaining a detection accuracy of 93.8% while reducing false positives to 6.2% [171].
Hyperparameter tuning is crucial for optimizing machine learning models in traffic sign detection and other applications. By selecting the optimal combination of hyperparameters, these models can achieve superior performance while minimizing computational costs. Techniques such as Bayesian Optimization, Gradient Descent, and meta-learning have been employed to refine this process, leveraging mathematical frameworks for effective parameter selection. Bayesian Optimization has been widely utilized to streamline hyperparameter tuning by approximating the objective function f(x) through a surrogate model S(x), often a Gaussian process. The acquisition function A(x) is used to identify the next promising hyperparameter configuration (function (52)):
where D represents the dataset of previously evaluated configurations [172]
Gradient-based optimization, such as Stochastic Gradient Descent (SGD: Equation (53)), iteratively adjusts hyperparameters like weights and learning rates:
where η is the learning rate, and is the gradient of the loss function [173]
Additionally, regularization plays a pivotal role in reducing overfitting during tuning. The regularized loss function is expressed (54) as
where λ controls the strength of regularization [174]. The mathematical frameworks and strategies demonstrated in these articles highlight the pivotal role of hyperparameter tuning in optimizing traffic sign detection models. By employing Bayesian Optimization, Gradient Descent, and meta-learning, these studies illustrate the balance between performance and computational efficiency, addressing challenges in complex real-world applications.
Table 23 provides a detailed overview of various studies focusing on hyperparameter tuning in traffic sign detection models, highlighting the optimization methods employed, the number of iterations involved, their impact on accuracy, computational cost, and direct links to the respective articles for in-depth reading.
Table 23.
The hyperparameter tuning in traffic sign detection models.
The detailed analysis of hyperparameter tuning in traffic sign detection models offers valuable insights into optimization techniques, their impact on accuracy, and computational efficiency. Table 23 provides a structured comparison of various strategies, highlighting trends that inform the development of high-performing detection systems.
Bayesian Optimization stands out as a dominant technique, appearing in multiple studies with different configurations. For instance, the “Bayesian Angular Margin Loss” approach achieves an accuracy improvement of +5.2% while reducing computational cost by −12%, requiring approximately 1200 iterations. This balance of performance and optimization effort makes it well suited for systems with moderate computational resources. In contrast, optimization methods such as the Pelican Optimization Algorithm (POA) and Cuckoo Search Algorithm (CSA) show accuracy gains of +4.5% and cost reductions of −15% after 1000 iterations. These approaches offer a practical trade-off between efficiency and performance, particularly advantageous in resource-constrained environments. A standout technique is Crowdsourced Hyperparameter Tuning, which achieves the highest accuracy improvement of +6.0% and a significant cost reduction of −20%. By leveraging distributed optimization processes, this method demonstrates potential for large-scale applications where collaborative resources are available. The Reparametrized YOLOX-s model achieves a balance between performance and efficiency, with an accuracy improvement of +5.0% and a cost reduction of −16%, requiring 1100 iterations. This showcases the effectiveness of integrating lightweight architectures with precise tuning for real-time systems.
4.9.1. Comparison of Strategies
- High Iteration Techniques: Methods like Automated Hyperparameter Search (1500 iterations) and Meta-Learning Hyperparameter Tuning (1300 iterations) prioritize exhaustive exploration of parameter spaces, yielding accuracy improvements of +4.2% to +5.5%. These approaches are ideal for systems that require maximum precision and reliability.
- Moderate Iteration Techniques: Approaches such as ShuffleNet with YOLOv5 tuning (950 iterations) achieve accuracy gains of +4.8% and cost reductions of −18%, offering scalability for systems with moderate resource availability.
- Dynamic Iteration Techniques: Crowdsourced tuning strategies adapt to variable workloads, providing flexibility while maintaining strong performance.
- a.
- Recommendations for Optimization
To enhance model performance,
- Adopt Bayesian Optimization: This method consistently delivers reliable improvements, making it a strong choice for moderately constrained systems.
- Utilize Dynamic Tuning Approaches: Techniques such as crowdsourced optimization provide scalability for real-time or large-scale applications.
- Optimize Lightweight Architectures: Models like Reparametrized YOLOX-s demonstrate that combining lightweight designs with effective parameter tuning achieve high efficiency and accuracy.
4.9.2. Research Directions
Future efforts should focus on hybrid optimization techniques that combine Bayesian strategies with adaptive learning to improve flexibility and performance. Additionally, incorporating synthetic datasets during optimization can enhance model robustness while minimizing computational overhead. These advancements will ensure that traffic sign detection systems remain accurate and efficient in complex real-world scenarios.
4.10. Limitations in Traffic Sign and Road Marking Detection
Traffic sign and road marking detection systems face significant challenges in adapting to variations in design and standards across geographic regions. These variations include differences in shapes, colors, pictograms, and design structures, which significantly impact model performance when deployed in new regions. Addressing these discrepancies is crucial for ensuring reliable detection and recognition performance in diverse environments.
4.10.1. Geographic Variations in Traffic Signs
A study by Maletzky [185] demonstrated that models trained on German traffic sign pictograms exhibited a significant drop in accuracy when tested on Austrian pictograms. The accuracy decreased from 95% to 80%, highlighting the sensitivity of machine learning models to subtle design differences, such as contour thickness and pictogram details [185]. Similarly, variations in color standards between regions have been shown to reduce detection accuracy significantly. A study observed a decrease from 90% to 75% when models encountered signs with different hue and saturation levels [166].
4.10.2. Challenges with Road Markings
Road markings also pose challenges, particularly when models trained on North American datasets are tested on European Road markings. Differences in width, spacing, and painting materials led to a decline in detection accuracy from 92% to 70% [186]. These findings underscore the need for models to adapt to regional standards in road marking detection.
4.10.3. Dataset Limitations
A lack of diverse and representative datasets is a primary limitation for existing models. The German Traffic Sign Recognition Benchmark (GTSRB), for example, focuses exclusively on German signs. Cross-validation studies have shown that models trained on the GTSRB achieve an accuracy of 93% on German signs but only 79% on French signs [187]. Conversely, combining datasets like the GTSRB, LISA, and Mapillary improved average accuracy from 88% to 94%, emphasizing the importance of dataset diversity [188].
4.10.4. Enhanced Performance
To address these challenges, several strategies have been proposed. Incorporating traffic signs and road markings from multiple regions captures a broader range of features and improves overall model performance. Enriching datasets with traffic signs from Europe, Asia, and North America increased recognition accuracy by 7% [189]. Adopting pre-trained models to new regional contexts using transfer learning techniques has significantly improved accuracy, achieving 98% in some cases [190]. Domain Adaptation Techniques like Generative Adversarial Networks (GANs) align feature spaces between training and target regions, increasing accuracy by 15% [191].
4.11. Proposed Solutions in Traffic Sign and Road Marking Detection
Incorporating these emerging trends into a literature review would provide a more comprehensive and up-to-date perspective on embedded vision systems for detecting and recognizing traffic signs and lane markings. This would offer researchers and practitioners valuable insights into innovative approaches that can enhance road safety through more precise and adaptive detection systems.
4.11.1. Transformers Models
Embedded vision systems for detecting and recognizing traffic signs have traditionally relied on methods such as convolutional neural networks (CNNs). However, recent advancements in artificial intelligence have introduced transformer-based models, which demonstrate promising performance in this domain. For instance, the study [192] highlights how transformers outperform CNNs in highly complex environments due to their ability to process global dependencies. Furthermore, another article [193] explores the limitations of traditional approaches and introduces hybrid methodologies incorporating transformers for improved performance.
In [194], a lightweight model TSD-DETR (Traffic Sign Detection based on Real-Time Detection Transformer for Traffic Sign Detection) was proposed, shown in Figure 43. This model is applied to traffic sign detection in a complex environment successfully. The proposed model employs a structured feature extraction module that integrates various convolutional modules to capture multi-scale features at different levels, enhancing the overall feature extraction capability.
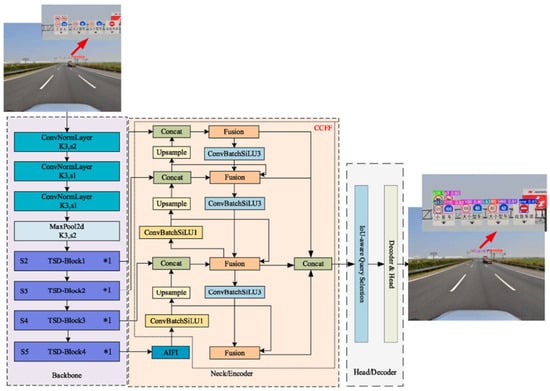
Figure 43.
Traffic Sign Detection Based on real-time Detection Transformer for Traffic Sign Detection.
To address the challenge of detecting small traffic signs, a specialized small object detection method was introduced. The model, TSD-DETR, achieved an impressive mean average precision (mAP) of 96.8% on the Tsinghua-Tencent 100K dataset (Figure 44).
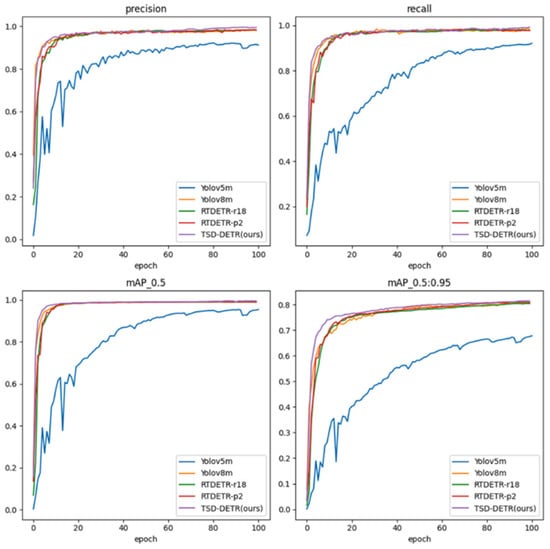
Figure 44.
The challenge of detecting small traffic signs.
The experimental results show that TSD-DETR can detect small objects in complex environments effectively (Figure 45). It can be used in many scenarios, such as real road traffic supervision, automatic driving, and driver assistance systems.
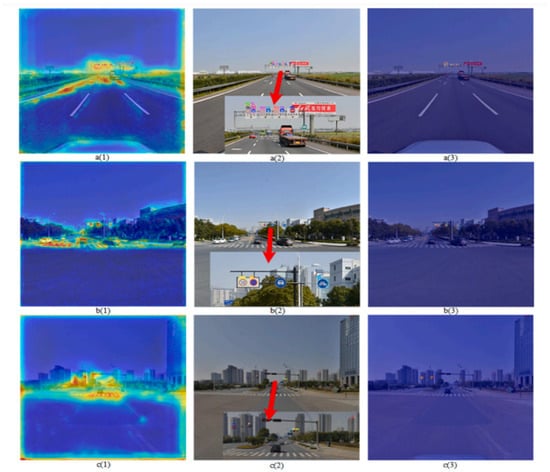
Figure 45.
Experimental results of TSD-DETR; (a1–a3) The original image. (b1–b3) The image detected by the model. (c1–c3) Result of the second detection.
Another paper proposed [195] the architecture below (in Figure 46), consisting of a backbone for feature extraction in a base transformer model.
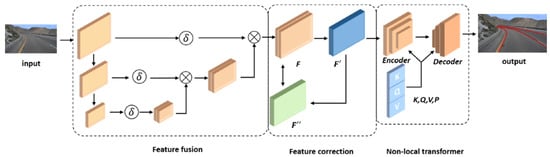
Figure 46.
Lane former model.
The authors highlighted the efficiency of their transformer model in detecting lane lines (Figure 46), showcasing its ability to accurately fit distant lanes, multi-lane curves, and high-curvature scenes (Table 24).
Table 24.
Accurate fit of different scenes.
Their approach outperformed the Lanenet CNN model (Figure 47), achieving greater precision without drifting in challenging road scenarios.
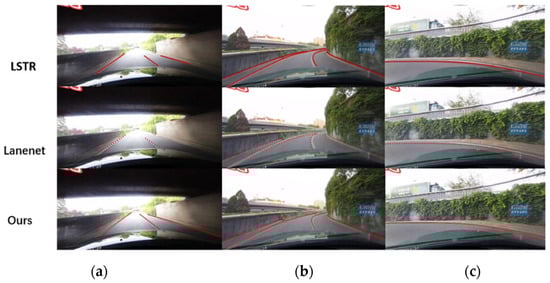
Figure 47.
Transformer models for detecting lane lines: (a–c) Model detections for three scenes: tunnel exit, curve, and sharp-curve case.
4.11.2. Modeling Spatial Hierarchies
In parallel, new deep learning architectures are emerging as alternatives to CNNs. One article [196] demonstrated that capsule networks can effectively model complex spatial relationships and reduce errors caused by variations in the orientation and perspective of signs. The contribution of this work is the application of capsule networks (Figure 48) to detect traffic signs [197]. This paper addresses the challenges of misinterpretation caused by the use of CNNs in traffic sign recognition, particularly the limitations introduced by max pooling.
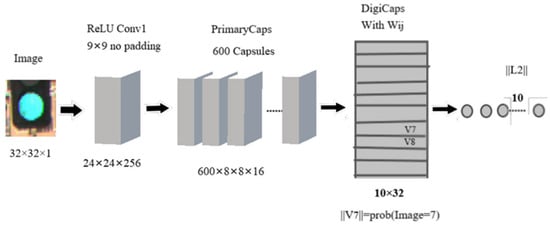
Figure 48.
Capsule networks (CapsNets) in traffic sign recognition.
This study aimed to explore the application of capsule networks (CapsNets) in traffic sign recognition, a cutting-edge approach in deep learning for analyzing traffic environments. By fine-tuning parameters and weights, this study demonstrated how CapsNets can effectively address the challenges of traffic sign recognition. Leveraging their dynamic routing mechanism, CapsNets showed great potential in overcoming the complexities of scene interpretation in traffic scenarios. The Capsule Network achieved an average accuracy of 98.72% and an F1-score of 99.27% (Figure 49).
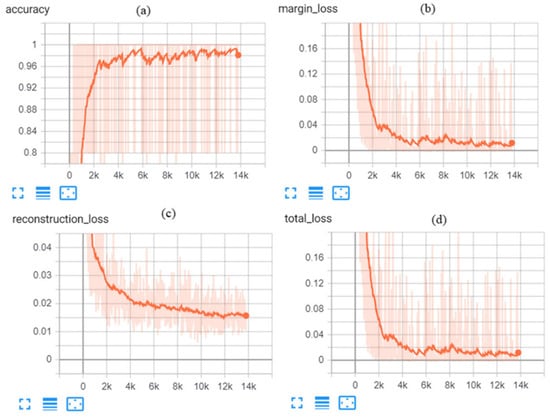
Figure 49.
Curves of capsule networks (CapsNets) in traffic sign recognition; (a) Accuracy, (b) Margin Loss, (c) Reconstruction Loss and (d) Total Loss.
The developed model effectively detected color variations and accurately categorized traffic sign classes. Figure 50 presents test images alongside their prediction outcomes, with bar charts displayed on the right of each image, illustrating the probabilities of 10 classes in which the sign was correctly identified using this approach.
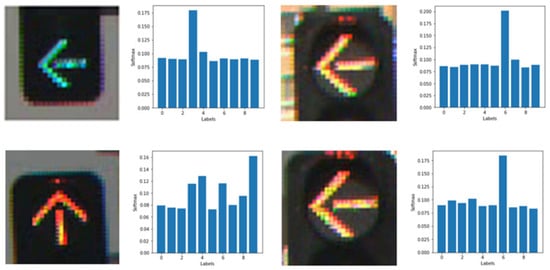
Figure 50.
Test images alongside.
Additionally, this paper aimed to tackle the challenges associated with thresholding-based techniques for extracting and classifying road markings [198], which often face reduced robustness and increased computational complexity when processing high-density 3D point clouds captured by MLS systems. These issues are primarily caused by varying point density, low-intensity contrast with adjacent pavements, and irregular data structures. To address these problems, the study proposed two novel capsule network architectures, tailored specifically for the efficient extraction and classification of road markings from dense and irregular MLS point cloud data.
Figure 51 presents a U-shaped capsule network architecture designed to capture both intensity variations from large datasets of labeled image patches and the spatial and shape-related features of road markings. The network incorporates a combination of traditional convolutional layers, primary capsule layers, convolutional capsule layers, and deconvolutional capsule layers, enabling a robust feature extraction process tailored for this task.
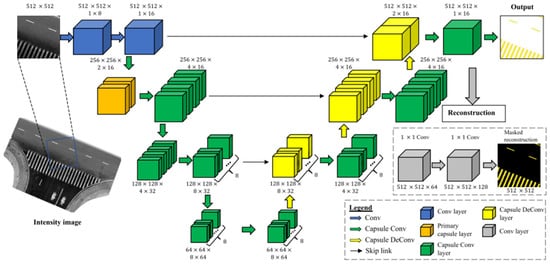
Figure 51.
U-shaped capsule network architecture.
Figure 52 and Figure 53 showcase the classification outcomes of road markings in urban and highway environments. In Figure 52, the model demonstrates a 2.16% misclassification rate, accurately identifying most markings but encountering errors with degraded lane lines, which were misclassified as dashed lines, and some zebra crossings or arrows mistakenly labeled as lane lines. Figure 53 highlights result from highway data, achieving a 4.87% misclassification rate, with similar challenges arising from broken lane lines resembling dashed lines or arrows. Despite these issues, the model performed well in classifying road markings across complex scenarios.
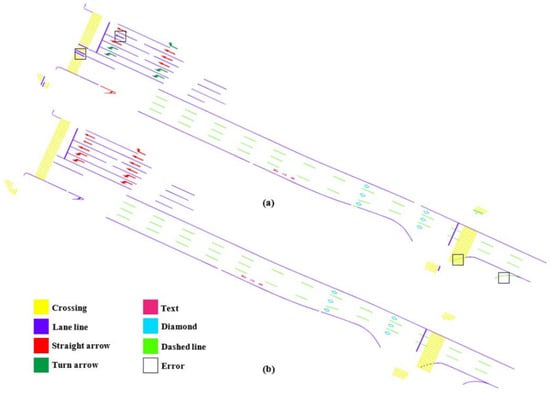
Figure 52.
Classification outcomes of road markings in urban environments (a) Classification results, and (b) manually labeled reference data.
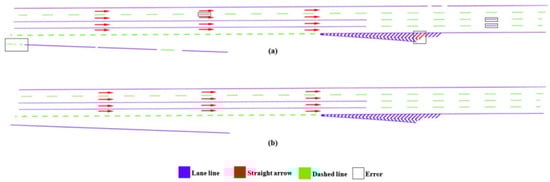
Figure 53.
Classification outcomes of road markings in highway environments (a) Classification results, and (b) manually labeled reference data.
Figure 54 illustrates the extraction and classification of road markings from low-quality data. The processing times for data preprocessing, road marking extraction, and classification were 36.47 s, 3.07 s, and 2.58 s, respectively, with preprocessing taking the largest share. Utilizing GPU parallel computing and multi-threading techniques could substantially improve the speed of 3D point cloud projections and optimize the performance of capsule-based networks.
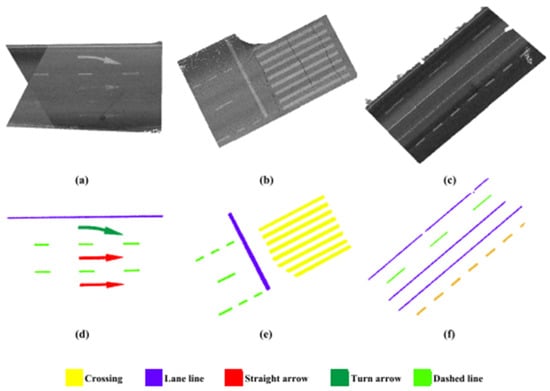
Figure 54.
Extraction and classification of road markings from low-quality data: (a) Example of weak contrast between markings and pavement; (b) produced intensity representation showing varied point density; (c) pavement with eroded and partial markings; (d–f) the associated detection and classification outputs.
4.11.3. Addressing Complex Backgrounds and Enhancing Model Performance
The accurate recognition of traffic signs in real-world environments is significantly hindered by complex backgrounds containing elements such as pedestrians, vehicles, and other objects. These challenges lead to an increased rate of false positives, which directly impacts the reliability of detection systems. For example, studies have reported that in dense urban environments, false positive rates can rise by 15–20% due to the interference of background elements [199]. This underscores the need for robust algorithms capable of effectively distinguishing traffic signs from surrounding distractions, especially in cluttered scenes. To illustrate the impact of complex backgrounds on detection performance, Table 25 compares key parameters across various models.
Table 25.
Comprehensive comparison of advanced traffic sign detection models in complex real-world environments.
Table 25 provides a comprehensive comparison of advanced traffic sign detection models in complex real-world environments, such as urban settings with pedestrians, vehicles, and other distractions. Among these models, YOLO-SG stands out with a detection accuracy of 95.3% and a low false positive rate of 4.7%, making it highly effective for real-time applications. Its processing time of just 25 milliseconds reinforces its suitability for systems requiring rapid decision-making. SSD with an FPN also demonstrates strong performance, achieving an accuracy of 93.8% and a false positive rate of 6.2%, showcasing its robustness in diverse scenarios.
In contrast, methods like ESSD (93.2% accuracy, 6.8% false positives) and the Faster R-CNN (92.0% accuracy, 7.0% false positives) exhibit slightly higher computational demands, with processing times of 30 milliseconds and 40 milliseconds, respectively. Simpler techniques, such as HOG-Based Detection and Color-Based Segmentation, lag behind with lower accuracy of 87.0% and 85.0%, and false positive rates of 12.0% and 15.0%, reflecting their limited adaptability to complex backgrounds. The MTSDet model, which utilizes multi-scale feature extraction, achieves a respectable accuracy of 91.2% and a false positive rate of 7.5%, highlighting its potential for applications requiring scalable and efficient detection solutions.
Enhancing detection systems could involve incorporating context-aware deep learning models capable of interpreting environmental details. Hybrid approaches combining convolutional neural networks (CNNs) with attention mechanisms or transformers can better capture contextual relationships in cluttered scenes. Additionally, augmenting training datasets with synthetic data can address the lack of diversity in real-world datasets, enabling models to handle rare and challenging scenarios effectively. To further improve performance, future research should prioritize lightweight model architectures optimized for edge devices, enabling real-time deployment. Investigating semi-supervised or unsupervised learning methods could reduce the dependency on extensive labeled datasets. Additionally, refining multi-scale feature fusion techniques could enhance detection accuracy for both small and large traffic signs. By pursuing these strategies, traffic sign detection systems can achieve higher efficiency, scalability, and reliability, supporting advancements in autonomous vehicles and intelligent transportation systems.
4.12. Advancing Intelligent Transportation Through Hybrid Methodologies
The combination of different methods into hybrid approaches is a promising area that remains insufficiently explored in this context. By blending the strengths of various techniques, hybrid methods can overcome the individual limitations of each approach, resulting in improved accuracy, resilience, and adaptability to challenging environmental conditions. For example, integrating AI-driven algorithms with geometric and color-based features can provide enhanced performance in situations with poor visibility or intricate surroundings. Adding a section to examine these hybrid approaches and their advantages would significantly enhance the paper by providing deeper insights into how such combinations can push forward advancements in vision-based systems for intelligent transportation. This inclusion would also underline the importance of synergistic strategies in improving both road safety and the reliability of these systems.
The Region of Interest (ROI)
The region-of-interest (ROI) approach plays a crucial role in image processing and computer vision by focusing analysis on specific parts of an image that are likely to contain relevant information, such as traffic signs. For traffic sign detection, ROIs are often determined using preprocessing methods like color segmentation or edge detection to isolate regions with features typical of traffic signs, such as red circular outlines or triangular shapes. For instance, thresholding techniques in color spaces such as HSV or RGB can be applied using (Equation (55)):
where I(x, y) is the pixel intensity at a given point (x, y), and Tmin and Tmax define the range of intensity values corresponding to traffic sign colors. After identifying the ROI, techniques like the Hough Transform (Equation (56)) can be used to detect circular shapes in the region, modeled by the following equation:
where (a, b) represents the circle’s center, and r is its radius. For triangular shapes, contour detection combined with polygonal approximation techniques is employed to refine the search.
In more advanced AI-driven systems, ROIs are dynamically generated by region proposal networks (RPNs), integrated into deep learning models such as the Faster R-CNN. RPNs predict bounding boxes for ROIs, parameterized as (x, y, w, h), where x, y, denote the center, and w, h, the width and height. The optimization of these bounding boxes is achieved through a loss function (57) like
where t and t* refer to the predicted and actual bounding box parameters, while smoothL1 ensures robustness against outliers. By leveraging ROI techniques, these systems not only improve detection accuracy but also reduce false positives.
The authors in [148] proposed (Figure 55) a hybrid technique designed for traffic sign detection, utilizing both color and shape characteristics unique to each sign category. By applying a region-of-interest (ROI) module to narrow the search area, the approach integrates color transformation to emphasize key features, template matching for shape identification, and postprocessing to refine the results, ensuring both speed and accuracy.
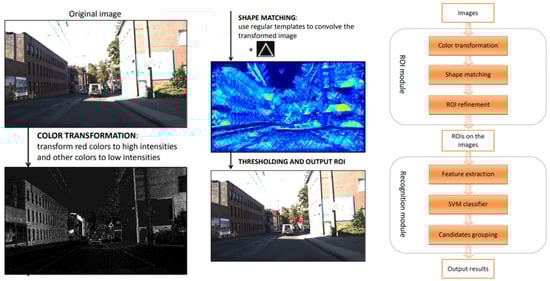
Figure 55.
Automated road sign detection and recognition using image processing and machine learning.
The authors designed a traffic sign recognition model leveraging a mix of HOG and color histogram features for precise classification. On the GTSDB benchmark, it achieved impressive AUC scores 100% for prohibitory signs and 98.85% for danger signs. With testing times ranging from 0.4 to 1.0 s per image, the model demonstrates strong potential for real-time applications, including autonomous driving systems (Figure 56).
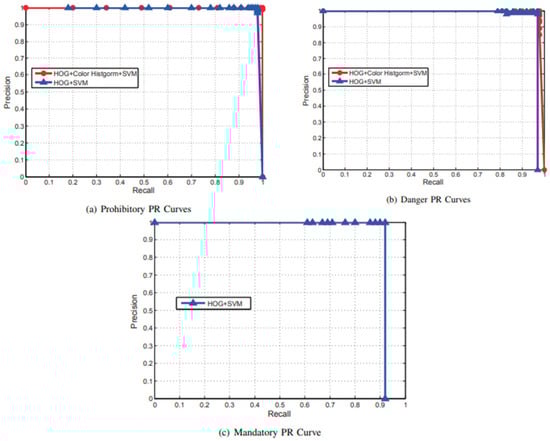
Figure 56.
Comparative precision–recall performance of traffic sign classifiers across multiple categories.
Table 26 illustrates the strategic application of region-of-interest (ROI) techniques to optimize the detection and recognition processes in traffic sign and road lane boundary datasets. Static ROIs are predominantly employed in controlled environments, such as the GTSRB and Belgium Road Code datasets, where they ensure a focused analysis on predefined areas containing traffic signs, leading to high recognition accuracy (98.33%) with minimal false positives. Conversely, dynamic ROIs adapt to varying road scenarios, proving effective in real-time applications like road lane detection and datasets with continuous environmental changes, such as KITTI and video-based road datasets. Combining ROIs with advanced methods like CNNs, YOLOv8, and the Hough Transform enhances computational efficiency by narrowing down the area of interest while maintaining high detection scores (up to 98%). This dual approach demonstrates ROIs’ versatility in addressing both structured and dynamic environments, making them indispensable for real-world implementations in autonomous navigation and intelligent transportation systems.
Traffic sign recognition systems often face challenges due to varying lighting conditions, such as low light at night, direct sunlight, and shadow variations, which can reduce detection accuracy. For instance, studies have shown that complex lighting conditions can lead to omissions and inaccurate positioning during traffic sign detection [182]. Additionally, images captured at night are often underexposed, lacking essential details for accurate detection [205].To mitigate these issues, various methods have been proposed. Adaptive image enhancement algorithms can improve image quality in challenging lighting conditions, facilitating more accurate detection of traffic signs [182].
Furthermore, the application of color-based segmentation techniques, even in low-light conditions, can effectively isolate traffic signs [206]. Photometric invariants have also been explored to improve road sign segmentation, particularly in the face of illumination changes [207]. Deep neural networks, such as YOLO-based models, have shown increased robustness in traffic sign detection under various lighting conditions. For example, models like TrafficSignNet, built on the YOLOv8 architecture, have been developed to enhance traffic sign recognition for autonomous vehicles, even in the presence of lighting variations [202]. Additionally, approaches combining transfer learning and YOLO models have been explored to improve road sign detection across diverse lighting conditions [208].
Future research must address these challenges in detail, integrating image enhancement techniques, employing advanced deep learning models, and creating more diverse datasets that reflect a wide range of lighting conditions. For instance, datasets like the Mapillary Traffic Sign Dataset, which covers a variety of scenes and lighting scenarios, can contribute to improving the accuracy and reliability of traffic sign detection and classification algorithms globally [209].
The qualitative analysis in Table 26 demonstrates that hybrid methods, combining ROI strategies with modern deep learning models like CNNs, YOLOv8, or color-based segmentation, tend to perform better in both detection accuracy (95–97%) and false positive reduction (as low as 1.8%). Notably, these approaches are implemented on embedded platforms such as Jetson Xavier NX and TX2, where they achieve frame rates suitable for real-time applications (often above 20 FPS). In contrast, traditional techniques often do not specify execution times or hardware constraints and typically show higher false positive rates. These observations suggest that hybrid architectures offer a more balanced trade-off between precision, speed, and hardware feasibility, making them more appropriate for intelligent and embedded road perception systems.
Table 26.
The strategic application of ROI techniques for detection and recognition processes in traffic signs and road lanes.
Table 26.
The strategic application of ROI techniques for detection and recognition processes in traffic signs and road lanes.
| Category | Technique Used | Detection Score (%) | Recognition Score (%) | Dataset | Execution Time (ms) | False Positive Rate (%) | Type of ROI | Reference | Method | Hardware Platform/Real-Time Specs | FPS (Frames per Second) |
|---|---|---|---|---|---|---|---|---|---|---|---|
| Traffic Signs | RANSAC, ROI, Triangular Shapes | 95 | No specified | Belgium Road Code | No specified | 2.5 | Static | M. Boumediene [210] | Traditional | Not specified | N/S |
| ROI, SVM, CNN | 94 | 98.33 | GTSRB | 20 | 3 | Static | N. Hasan [211] | Hybrid | GPU (unspecified), ~20 ms | 50 FPS approx. | |
| ROI, YOLOv8 | 96 | No specified | CCTSDB dataset | Real Tie | 1.8 | Dynamic | Y. Luo [212] | Hybrid | Jetson Xavier NX @21FPS, 15 W | 21 FPS | |
| ROI, CNN, Color Segmentation | 95 | 94 | TTSDCE dataset | 25 | 2.3 | Static | Y. Zhu [213] | Hybrid | GPU (assumed), ~25 ms | 40 FPS est. | |
| Road Lane Boundaries | ROI, Dynamic, Modified Hough Transform | 96 | N/A | Road videos | Real Time | No specified | Dynamic | Y. Shen [214] | Hybrid | PC-based, estimated RT | RT (est.) |
| ROI, Hough Transform | 98 | N/A | 640 × 480 pixel video | 5 | 1.2 | Static | M. H. Syed [215] | Traditional | Desktop CPU (5 ms) | 200 FPS est. | |
| ROI, Adaptive, Stereo Vision | 97 | N/A | Road dataset | No specified | No specified | Dynamic | Yingfo Chen [216] | Hybrid | Jetson TX2 | 15–20 FPS | |
| ROI, (CNN) | 97 | N/A | Several datasets | Real Time | No specified | Dynamic | A. Gudigar [217] | Hybrid | GPU or Jetson (N/S | 30–40 FPS est. | |
| ROI, Segmentation | 93 | N/A | KITI | 15 | 2.8 | Static | S. P. Narote [114] | Traditional | Not specified | N/S |
4.13. Analysis of Histogram Equalization and CLAHE Techniques for Traffic Sign and Lane Detection
Histogram Equalization (HE), mentioned in several articles and shown in Table 26, is a useful technique for globally enhancing image contrast by redistributing pixel intensity levels. However, its limitations include excessive noise amplification in low-light environments, which reduces its effectiveness in advanced applications. For example, in [218], HE alone achieved a 20% contrast improvement, but its impact on detection rates remained limited compared to CLAHE.
For Histogram Equalization, the transformation of pixel intensity levels is calculated by redistributing intensities cumulatively. The key Equation (58) used is
where
- is the new normalized intensity;
- is the original pixel intensity;
- L is the total number of intensity levels (typically 256 for an 8-bit image);
- is the probability of intensity rjr_jrj;
- N is the total number of pixels.
In paper [219], combining HE with CLAHE improved mAP metrics by 15%, confirming HE’s usefulness as a preliminary step, though its standalone performance is insufficient for complex systems. For CLAHE, this approach adapts contrast locally. CLAHE divides the image into small regions called “tiles,” applies histogram equalization to each tile, and limits contrast amplification by clipping intensities beyond a threshold (clip limit). The redistribution of levels is given by the following function (59):
where
- is the HE transformation applied locally;
- is the threshold controlling the maximum amplification
These equations enable the calculation of new pixel intensities to enhance image quality, making them more effective for use in advanced vision models. On the other hand, Contrast-Limited Adaptive Histogram Equalization (CLAHE) stands out for its ability to enhance local contrast while minimizing artifacts, making it a key solution for low-light environments. The articles in Table 27 confirm its superiority: in [220], CLAHE combined with ResNet achieved a 95.7% classification accuracy, and in article #8, integrating CLAHE with YOLOv5 reached a 95.2% detection rate. CLAHE also improves recognition and detection performance of traffic signs in complex nighttime environments, as demonstrated in [221], with a 12% increase in F1-score. These results highlight CLAHE as the preferred technique for advanced vision systems requiring high precision in challenging conditions.
Figure 57 demonstrates the effect of CLAHE on a low-light driving scene [222]. Compared to the original image, the CLAHE-enhanced version shows significantly improved local contrast, making lane markings and surrounding structures more visible. This enhancement facilitates better feature extraction and improves the reliability of detection algorithms under poor lighting conditions, highlighting CLAHE’s suitability for real-time vision systems in nighttime environments. The authors presented annotated images comparing the original state with the result after applying CLAHE, clearly illustrating visible improvements in brightness and contrast (with a mAP of 76.2%).
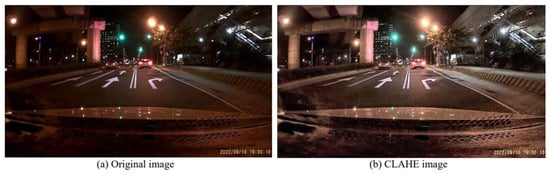
Figure 57.
Visual comparison of image enhancement: (a) original image and (b) after applying CLAHE [222].
Applying CLAHE (Figure 58) [223] as a preprocessing step significantly enhances image quality under low-light conditions. Compared to other enhancement methods such as Color Stretching and standard Histogram Equalization, CLAHE offers clearer contrast and preserves fine details without amplifying noise. This improvement makes critical features like road signs and lane markings more distinguishable, which in turn strengthens the performance of YOLO-based detection models. The resulting output and evaluation curves clearly reflect this benefit, highlighting CLAHE’s effectiveness in improving detection reliability in nighttime or poorly lit driving environments.
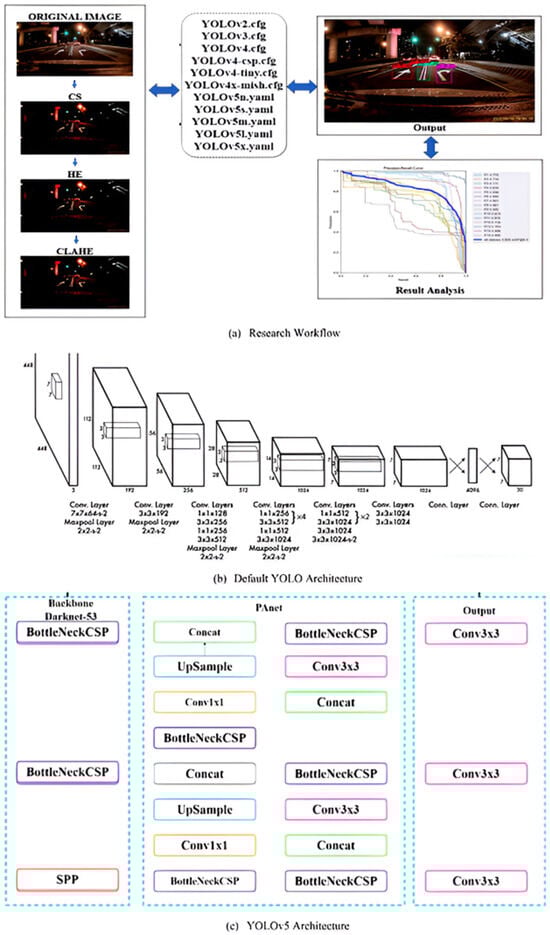
Figure 58.
System overview: (a) research workflow, (b) standard YOLO architecture, and (c) YOLOv5 structure [223].
Table 27.
Comparison of Histogram Equalization and CLAHE in Traffic Sign and Road Marking Recognition Studies.
Table 27.
Comparison of Histogram Equalization and CLAHE in Traffic Sign and Road Marking Recognition Studies.
| Authors | Year | Techniques Used | Histogram Equalization | CLAHE | Application | Results/Key Values |
|---|---|---|---|---|---|---|
| Utkarsh Dubey, Rahul Kumar Chaurasiya [220] | 2021 | CLAHE, CNN (ResNet) | Not Used | Used | Traffic sign recognition | Classification accuracy: 95.7% after CLAHE |
| Jiana Yao et al. [221] | 2023 | Histogram Equalization, CLAHE, Mask RCNN | Used | Used | Detection and recognition of traffic signs | 12% increase in F1-Score under low-light conditions |
| Chen [223] | 2024 | CLAHE, YOLO | Not Used | Used | Recognition of road markings | Detection rate improved to 91% under low-light conditions |
| Manongga [224] | 2024 | CLAHE, Fusion Linear Image Enhancement, YOLOv7 | Not Used | Used | Detection of markings | Detection rate: 89.6%; reduction in false positives by 15% |
| Yan [165] | 2023 | CLAHE, Lightweight Model | Not Used | Used | Traffic sign recognition | Accuracy improvement of 8% compared to non-enhanced images |
| Wang [225] | 2023 | Histogram Equalization, CLAHE | Used | Used | Detection of signs | Performance improvement to 93.2% in nighttime scenarios |
| Shuen Zhao et al. [226]. | 2024 | CLAHE, Correction Gamma, CNN | Not Used | Used | Signs and markings | Accuracy: 94.8%; reduction in inference time by 25% |
| Sun [227] | 2024 | CLAHE, YOLOv5 | Not Used | Used | Detection of signs | Detection rate: 95.2%; increase in detection speed by 20% |
| Prasanthi [219] | 2022 | Histogram Equalization, CLAHE, CNN | Used | Used | Lanes and signs | 15% improvement in mAP metrics under low-light conditions |
| Qin [218] | 2019 | Histogram Equalization | Used | Not Used | Improvement in sign image | 20% contrast improvement; reduction in detection errors |
4.14. Board Experimentation for Detection and Recognition
4.14.1. Traffic Signs
The results in Figure 59 in [228] for detection and recognition traffic signs reveal that the combination (SSD + MobileNetv1 FPN) on TPU emerged as the most effective. This configuration consistently outperformed others across all stages and nearly all metrics. Notably, it achieved a training speedup of 16.3 and maintained a minimal accuracy difference of 0.0363 between CPU and GPU setups (Figure 59).
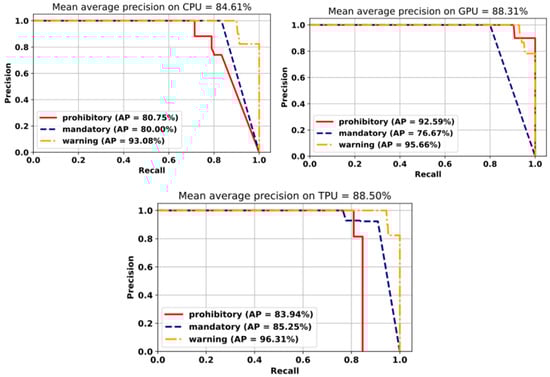
Figure 59.
Mean Average Precision on CPUs, GPUs, and TPUs of the proposed Systems.
The research presented in [229] introduced a k-means clustering function and demonstrated its application in traffic sign recognition, achieving significant speed improvements compared to software execution on an ARM CPU. The study reported impressive maximum speedups of eight times for k-means clustering and 9.6 times for traffic sign recognition. Notably, the implementation utilizing 16 IPPro cores exhibited remarkable power efficiency, being 57 times, 28 times, and 1.7 times more power-efficient (measured as frames per second per watt, fps/W), respectively, as illustrated in Table 28, than the ARM Cortex-A7 CPU, NVIDIA GeForce GTX980 GPU, and ARM Mali-T628 embedded GPUs.
Table 28.
Acceleration of color and morphology operations using IPPro on Zedboard.
4.14.2. Road Lines
A refined implementation [230] of the Hough Transform (HT) on FPGA was introduced for straight-lane line detection. The optimization involves filtering horizontal lines to simplify the mapping equation of HT. Additionally, filtering vertical lines and defining two regions of interest (ROIs) for edge gradient orientation further enable the HT to consumes less than 0.1% of the available FPGA memory [231,232]. Moreover, this architecture facilitates the inverse mapping operation from Hough Space to the image plane without incurring any additional hardware costs (Figure 60).
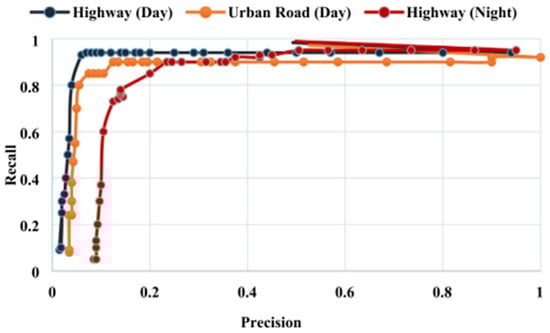
Figure 60.
The precision of FPGA of the proposed systems.
The model discussed in [233] achieved an accuracy of 93.53% on the TuSimple dataset, running at 348.34 frames per second (FPS) on the NVIDIA Tesla T4 GPU with an image size of 256 × 512. To optimize processing speed and minimize power consumption, a hardware accelerator was implemented on the Virtex-7VC707 FPGA [234]. Through optimization techniques such as data quantization and dual 8-bit multiplications on a single multiplier, the hardware accelerator achieved impressive performance, operating at 640 FPS at 250 MHz while consuming only 10.309 W. This resulted in outstanding system throughput and energy efficiency, measured at 345.6 GOPS and 33.52 GOPS/W, respectively (as illustrated in Figure 61).
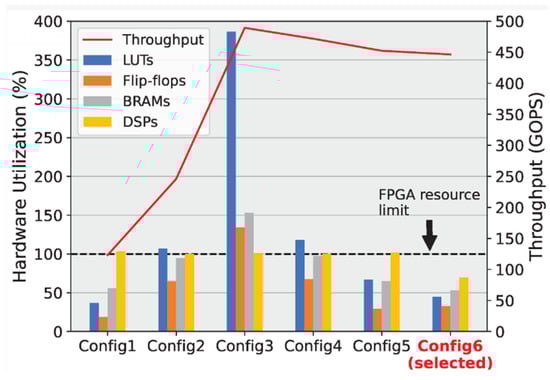
Figure 61.
Assessing Throughput in relation to hardware utilization across varied configurations.
The accompanying Table 29 provides a synthesis of research efforts focused on traffic sign and lane detection methods. Key considerations include the hardware platforms utilized, datasets employed, and the corresponding accuracy levels achieved in each study.
Table 29.
Reported precisions for traffic sign and lane detection using various hardware and datasets.
The hardware used by the authors includes Raspberry Pi, FPGA, and NVIDIA Jetson Nano. The datasets used include GTSRB, U.S. traffic signs, Tunisian road signs, Caltech datasets, KITTI dataset, Malaysian roads, and CuLane dataset. The accuracy achieved by the authors varies depending on the hardware, dataset, and method used.
The authors used a variety of methods to detect traffic signs and lanes. These methods include deep learning, machine learning, and computer vision. Deep learning methods are based on artificial neural networks that can learn to recognize patterns in data. Machine learning methods are based on statistical models that can be used to predict outcomes. Computer vision methods are based on algorithms that can be used to extract information from images.
The authors found that deep learning methods generally achieve the highest accuracy. However, deep learning approaches necessitate substantial amounts of data and computational resources. Machine learning methods are less accurate than deep learning methods, but they require less data and computational resources. Computer vision methods are the least accurate, but they require the least amount of data and computational resources.
The authors’ work is significant because it provides a comprehensive overview of traffic sign and lane detection methods. The authors’ work can be used to guide future research in this area.
5. Research Gaps and Challenges
While substantial advancements have been achieved in embedded vision systems for traffic sign and lane recognition, several critical challenges remain:
- Dataset Limitations
Most existing datasets lack sufficient diversity in lighting, weather, and road conditions. This undermines model generalizations and reliability in real-world deployments.
- Real-Time Performance on Embedded Platforms
Many deep learning models demonstrate excellent accuracy but fail to meet latency and memory constraints when deployed on low-power embedded hardware.
- Sensor Fusion Complexity
While combining data from LiDAR, radar, and cameras can improve robustness, there is limited work on efficient fusion strategies that maintain real-time performance in embedded systems.
- Explainability and Trustworthiness
The integration of explainable AI (XAI) is underexplored in this domain. Achieving interpretable yet performant systems remains a key challenge, particularly for safety-critical applications.
- Lack of Standard Benchmarks:
The absence of unified benchmarking protocols for embedded ADASs prevents consistent evaluation and comparison across models and datasets.
Addressing these research gaps is essential to ensure the scalability, transparency, and reliability of embedded vision systems in the evolving landscape of intelligent transportation.
6. Conclusions
This review has provided a structured and comprehensive synthesis of embedded vision systems for traffic sign and lane detection in the automotive sector. By categorizing and evaluating state-of-the-art approaches through a SALSA-based methodology, we highlighted both technological advances and unresolved challenges. The inclusion of real-time constraints, sensor limitations, and deep learning models offers a pragmatic view of current capabilities and future potential. Specifically, this study introduces a practical taxonomy of recognition methods, structured summary tables, and an extended set of research questions including the role of embedded processors, all aimed at clarifying the trade-offs between accuracy, computational cost, and real-time feasibility. We hope this work serves as a valuable reference for researchers and engineers working on safer and smarter transportation systems. This study’s implications extend beyond the automotive sector, offering insights into the broader field of embedded vision systems and their role in advancing intelligent transportation systems.
7. Future Research Directions
Although this review has provided a comprehensive overview of current traffic sign and lane marking recognition systems, several specific areas merit further investigation. One important direction involves the development of adaptive algorithms capable of maintaining high performance under extreme conditions, such as occlusion, glare, and low visibility. A relevant research question could be the following: how can Vision Transformer models be optimized for deployment on real-time edge computing platforms without compromising accuracy or latency? Another promising area is the fusion of multimodal sensory data. For instance, investigating fusion strategies that combine LiDAR and vision data—particularly under occlusion-heavy scenarios—could yield more robust detection pipelines. Comparative experiments could assess early versus late fusion architectures across varied environmental datasets. The integration of explainable AI (XAI) is also an essential research avenue. Identifying which XAI techniques provide the best balance between interpretability and inference speed in embedded contexts would support the development of safer and more transparent systems.
Finally, the lack of standardized benchmarking tools remains a barrier. Future work should prioritize the creation of evaluation protocols and datasets tailored to embedded vision systems, enabling reproducible and comparable assessments across architectures. These targeted directions are critical to advancing the scalability, reliability, and transparency of vision-based perception in autonomous driving technologies.
Author Contributions
Conceptualization, A.B.; Methodology, A.B. and M.B.; Validation, A.B. and M.B.; Formal analysis, A.B., M.B. and A.Z.; Investigation, A.B. and A.Z.; Writing—original draft, A.B.; Writing—review & editing, M.B. and A.Z.; Visualization, A.B.; Supervision, M.B. and A.Z. All authors have read and agreed to the published version of the manuscript.
Funding
This research received no external funding.
Conflicts of Interest
The authors declare no conflict of interest.
References
- Zheng, L.; Sayed, T.; Mannering, F. Modeling traffic conflicts for use in road safety analysis: A review of analytic methods and future directions. Anal. Methods Accid. Res. 2021, 29, 100142. [Google Scholar] [CrossRef]
- Hu, Y.; Ou, J.; Hu, L. A review of research on traffic conflicts based on intelligent vehicles perception technology. In Proceedings of the 2019 International Conference on Advances in Construction Machinery and Vehicle Engineering: ICACMVE 2019, Changsha, China, 14–16 May 2019; pp. 137–142. [Google Scholar] [CrossRef]
- Al-Turjman, F.; Lemayian, J.P. Intelligence, security, and vehicular sensor networks in internet of things (IoT)-enabled smart-cities: An overview. Comput. Electr. Eng. 2020, 87, 106776. [Google Scholar] [CrossRef]
- Barodi, A.; Zemmouri, A.; Bajit, A.; Benbrahim, M.; Tamtaoui, A. Intelligent Transportation System Based on Smart Soft-Sensors to Analyze Road Traffic and Assist Driver Behavior Applicable to Smart Cities. Microprocess. Microsyst. 2023, 100, 104830. [Google Scholar] [CrossRef]
- Macioszek, E.; Tumminello, M.L. Simulating Vehicle-to-Vehicle Communication at Roundabouts. Transp. Probl. 2024, 19, 45–57. [Google Scholar] [CrossRef]
- Ouerhani, Y.; Alfalou, A.; Desthieux, M.; Brosseau, C. Advanced driver assistance system: Road sign identification using VIAPIX system and a correlation technique. Opt. Lasers Eng. 2016, 89, 184–194. [Google Scholar] [CrossRef]
- Weber, M.; Weiss, T.; Gechter, F.; Kriesten, R. Approach for improved development of advanced driver assistance systems for future smart mobility concepts. Auton. Intell. Syst. 2023, 3, 2. [Google Scholar] [CrossRef]
- Waykole, S.; Shiwakoti, N.; Stasinopoulos, P. Review on lane detection and tracking algorithms of advanced driver assistance system. Sustainability 2021, 13, 11417. [Google Scholar] [CrossRef]
- Bao, Z.; Hossain, S.; Lang, H.; Lin, X. A review of high-definition map creation methods for autonomous driving. Eng. Appl. Artif. Intell. 2023, 122, 106125. [Google Scholar] [CrossRef]
- Belim, S.V.; Belim, S.Y.; Khiryanov, E.V. Hierarchical System for Recognition of Traffic Signs Based on Segmentation of Their Images. Information 2023, 14, 335. [Google Scholar] [CrossRef]
- Kim, T.Y.; Lee, S.H. Combustion and Emission Characteristics of Wood Pyrolysis Oil-Butanol Blended Fuels in a Di Diesel Engine. Int. J. Automot. Technol. 2015, 16, 903–912. [Google Scholar] [CrossRef]
- Barodi, A.; Bajit, A.; Benbrahim, M.; Tamtaoui, A. An Enhanced Approach in Detecting Object Applied to Automotive Traffic Roads Signs. In Proceedings of the 6th International Conference on Optimization and Applications, ICOA 2020, Beni Mellal, Morocco, 20–21 April 2020; pp. 1–6. [Google Scholar] [CrossRef]
- Barodi, A.; Bajit, A.; Benbrahim, M.; Tamtaoui, A. Applying Real-Time Object Shapes Detection to Automotive Traffic Roads Signs. In Proceedings of the 2020 International Symposium on Advanced Electrical and Communication Technologies, ISAECT 2020, Virtual, 25–27 November 2020. [Google Scholar] [CrossRef]
- Barodi, A.; Zemmouri, A.; Bajit, A.; Benbrahim, M.; Tamtaoui, A. An Explainable Model for Detection and Recognition of Traffic Road Signs. In Explainable Artificial Intelligence for Intelligent Transportation Systems; CRC Press: Boca Raton, FL, USA, 2023; pp. 171–206. [Google Scholar] [CrossRef]
- Barodi, M.; Soudane, M.A.; Lalaoui, S. The Organizational Change Conduct: A Lever for the Moroccan Public Digital Transformation. In International Conference on Advanced Technologies for Humanity; Springer: Cham, Switzerland, 2025; pp. 3–10. [Google Scholar] [CrossRef]
- Tian, J.; Liu, S.; Zhong, X.; Zeng, J. LSD-based adaptive lane detection and tracking for ADAS in structured road environment. Soft Comput. 2021, 25, 5709–5722. [Google Scholar] [CrossRef]
- Li, J.; Jiang, F.; Yang, J.; Kong, B.; Gogate, M.; Dashtipour, K.; Hussain, A. Lane-DeepLab: Lane semantic segmentation in automatic driving scenarios for high-definition maps. Neurocomputing 2021, 465, 15–25. [Google Scholar] [CrossRef]
- Chen, W.; Wang, W.; Wang, K.; Li, Z.; Li, H.; Liu, S. Lane departure warning systems and lane line detection methods based on image processing and semantic segmentation: A review. J. Traffic Transp. Eng. 2020, 7, 748–774. [Google Scholar] [CrossRef]
- Zhu, Y.; Zhang, C.; Zhou, D.; Wang, X.; Bai, X.; Liu, W. Traffic sign detection and recognition using fully convolutional network guided proposals. Neurocomputing 2016, 214, 758–766. [Google Scholar] [CrossRef]
- Ruta, A.; Li, Y.; Liu, X. Real-time traffic sign recognition from video by class-specific discriminative features. Pattern Recognit. 2010, 43, 416–430. [Google Scholar] [CrossRef]
- Megalingam, R.K.; Thanigundala, K.; Musani, S.R.; Nidamanuru, H.; Gadde, L. Indian traffic sign detection and recognition using deep learning. Int. J. Transp. Sci. Technol. 2023, 12, 683–699. [Google Scholar] [CrossRef]
- Barodi, A.; Bajit, A.; Benbrahim, M.; Tamtaoui, A. Improving the transfer learning performances in the classification of the automotive traffic roads signs. E3S Web Conf. 2021, 234, 64. [Google Scholar] [CrossRef]
- Barodi, M.; Lalaoui, S. Evaluation du Niveau d’ Ouverture des Acteurs Publiques Quant à la Nouvelle Réforme Publique Marocaine; Evaluation of the Level of Openness of Public Actors Regarding the New Moroccan Public Reform; Ibn Tofail University: Kénitra, Morocco, 2022. [Google Scholar]
- Parsa, A.; Farhadi, A. Measurement and control of nonlinear dynamic systems over the internet (IoT): Applications in remote control of autonomous vehicles. Automatica 2018, 95, 93–103. [Google Scholar] [CrossRef]
- Wang, W.; Lin, H.; Wang, J. CNN based lane detection with instance segmentation in edge-cloud computing. J. Cloud Comput. 2020, 9, 27. [Google Scholar] [CrossRef]
- Kortli, Y.; Gabsi, S.; Voon, L.F.C.L.Y.; Jridi, M.; Merzougui, M.; Atri, M. Deep embedded hybrid CNN–LSTM network for lane detection on NVIDIA Jetson Xavier NX. Knowl. Based Syst. 2022, 240, 107941. [Google Scholar] [CrossRef]
- Chowdhury, K.; Kapoor, R. Relevance of Smart Management of Road Traffic System Using Advanced Intelligence. In Optimized Computational Intelligence Driven Decision-Making; Wiley: Chichester, UK, 2024; pp. 131–150. [Google Scholar]
- Rezaee, K.; Khosravi, M.R.; Attar, H.; Menon, V.G.; Khan, M.A.; Issa, H.; Qi, L. IoMT-Assisted Medical Vehicle Routing Based on UAV-Borne Human Crowd Sensing and Deep Learning in Smart Cities. IEEE Internet Things J. 2023, 10, 18529–18536. [Google Scholar] [CrossRef]
- Bishop, R. Intelligent vehicle R&D: A review and contrast of programs worldwide and emerging trends. Ann. Des Télécommunications 2005, 60, 228–263. [Google Scholar] [CrossRef]
- Elmquist, A.; Negrut, D. Methods and Models for Simulating Autonomous Vehicle Sensors. IEEE Trans. Intell. Veh. 2020, 5, 684–692. [Google Scholar] [CrossRef]
- Barodi, A.; Bajit, A.; Zemmouri, A.; Benbrahim, M.; Tamtaoui, A. Improved Deep Learning Performance for Real-Time Traffic Sign Detection and Recognition Applicable to Intelligent Transportation Systems. Int. J. Adv. Comput. Sci. Appl. 2022, 13, 712–723. [Google Scholar] [CrossRef]
- Francis, S. ADAS: Features of Advanced Driver Assistance Systems. 2017, pp. 1–2. Available online: https://roboticsandautomationnews.com/2017/07/01/adas-features-of-advanced-driver-assistance-systems/13194/ (accessed on 1 June 2025).
- Zemmouri, A.; Elgouri, R.; Alareqi, M.; Dahou, H.; Benbrahim, M.; Hlou, L. A comparison analysis of PWM circuit with arduino and FPGA. ARPN J. Eng. Appl. Sci. 2017, 12, 4679–4683. [Google Scholar]
- Mohamed, B.; Siham, L. Moroccan Public Administration in the Era of Artificial Intelligence: What Challenges to Overcome? In Proceedings of the 2023 9th International Conference on Optimization and Applications (ICOA) 2023, Abu Dhabi, United Arab Emirates, 5–6 October 2023. [Google Scholar] [CrossRef]
- Ye, X.Y.; Hong, D.S.; Chen, H.H.; Hsiao, P.Y.; Fu, L.C. A two-stage real-time YOLOv2-based road marking detector with lightweight spatial transformation-invariant classification. Image Vis. Comput. 2020, 102, 103978. [Google Scholar] [CrossRef]
- De Paula, M.B.; Jung, C.R. Real-time detection and classification of road lane markings. In Proceedings of the 2013 XXVI Conference on Graphics, Patterns and Images, Arequipa, Peru, 5–8 August 2013; pp. 83–90. [Google Scholar] [CrossRef]
- Taamneh, M. Investigating the role of socio-economic factors in comprehension of traf fi c signs using decision tree algorithm. J. Safety Res. 2018, 66, 121–129. [Google Scholar] [CrossRef]
- Taamneh, M.; Alkheder, S. Traffic sign perception among Jordanian drivers: An evaluation study. Transp. Policy 2018, 66, 17–29. [Google Scholar] [CrossRef]
- Serna, C.G.; Ruichek, Y. Classification of Traffic Signs: The European Dataset. IEEE Access 2018, 6, 78136–78148. [Google Scholar] [CrossRef]
- Barodi, A.; Bajit, A.; Tamtaoui, A.; Benbrahim, M. An Enhanced Artificial Intelligence-Based Approach Applied to Vehicular Traffic Signs Detection and Road Safety Enhancement. Adv. Sci. Technol. Eng. Syst. J. 2021, 6, 672–683. [Google Scholar] [CrossRef]
- Obayd, M.; Zemmouri, A.; Barodi, A.; Benbrahim, M. Advanced Diagnostic Techniques for Automotive Systems: Innovations and AI-Driven Approaches. In International Conference on Advanced Sustainability Engineering and Technology; Springer: Cham, Switzerland, 2025; pp. 485–496. [Google Scholar] [CrossRef]
- Nikolić, Z. Embedded vision in advanced driver assistance systems. Adv. Comput. Vis. Pattern Recognit. 2014, 68, 45–69. [Google Scholar] [CrossRef]
- Duong, T.T.; Seo, J.H.; Tran, T.D.; Young, B.J.; Jeon, J.W. Evaluation of embedded systems for automotive image processing. In Proceedings of the 2018 19th IEEE/ACIS International Conference on Software Engineering, Artificial Intelligence, Networking and Parallel/Distributed Computing (SNPD), Busan, Republic of Korea, 27–29 June 2018; pp. 123–128. [Google Scholar] [CrossRef]
- Udendhran, R.; Balamurugan, M.; Suresh, A.; Varatharajan, R. Enhancing image processing architecture using deep learning for embedded vision systems. Microprocess. Microsyst. 2020, 76, 103094. [Google Scholar] [CrossRef]
- Zemmouri, A.; Barodi, A.; Elgouri, R.; Benbrahim, M. Proposal automatic water purging system for machinery in high humidity environments controlled by an ECU. Comput. Electr. Eng. 2024, 120, 109775. [Google Scholar] [CrossRef]
- Nahata, D.; Othman, K. Exploring the challenges and opportunities of image processing and sensor fusion in autonomous vehicles: A comprehensive review. AIMS Electron. Electr. Eng. 2023, 7, 271–321. [Google Scholar] [CrossRef]
- Mueller, C.; Mezhuyev, V. AI Models and Methods in Automotive Manufacturing: A Systematic Literature Review. In Recent Innovations in Artificial Intelligence and Smart Applications; Springer: Cham, Switzerland, 2022; pp. 1–25. [Google Scholar]
- Bodenhausen, U. Quick Start with AI for Automotive Development: Five Process Changes and One New Process. In Internationales Stuttgarter Symposium: Automobil-und Motorentechnik; Springer: Cham, Switzerland, 2021; pp. 247–262. [Google Scholar]
- Barodi, M.; Lalaoui, S. Civil servants’ readiness for AI adoption: The role of change management in Morocco’s public sector. Probl. Perspect. Manag. 2025, 23, 63–75. [Google Scholar] [CrossRef]
- Barodi, M.; Lalaoui, S. The Readiness of Civil Servants to Join the Era of Artificial Intelligence: A Case Study of Moroccan Public Administration. Chang. Manag. An Int. J. 2025, 25, 1–21. [Google Scholar] [CrossRef]
- da Silva Neto, V.J.; Chiarini, T. The Platformization of Science: Towards a Scientific Digital Platform Taxonomy. Minerva 2023, 61, 1–29. [Google Scholar] [CrossRef]
- Barodi, M.; Lalaoui, S. Le management du changement: Un levier de la réforme publique au Maroc. Change management: A lever for the public reform in Morocco. Introduction. Rev. Int. du Cherch. 2022, 5, 1–18. [Google Scholar]
- Espina-Romero, L.; Guerrero-Alcedo, J. Fields Touched by Digitalization: Analysis of Scientific Activity in Scopus. Sustainability 2022, 14, 14425. [Google Scholar] [CrossRef]
- He, S. An endogenous intelligent architecture for wireless communication networks. Wirel. Networks 2024, 30, 1069–1084. [Google Scholar] [CrossRef]
- Barodi, M.; Yassine, H.; Hicham, E.G.; Abdellatif, R.; Khalid, R. Siham Lalaoui Assessing the Relevance of Change Management Strategy in Moroccan Public Sector Reform. J. IUS Kaji. Huk. dan Keadilan 2024, 12, 447–471. [Google Scholar] [CrossRef]
- Reinhardt, D.; Jesorsky, O.; Traub, M.; Denis, J.; Notton, P. Electronic Components and Systems for Automotive Applications; Langheim, J., Ed.; Lecture Notes in Mobility; Springer: Cham, Switzerland, 2019; ISBN 978-3-030-14155-4. [Google Scholar]
- Garikapati, D.; Shetiya, S.S. Autonomous Vehicles: Evolution of Artificial Intelligence and Learning Algorithms. arXiv 2024, arXiv:2402.17690. [Google Scholar] [CrossRef]
- Zhang, X.; Liao, X.P.; Tu, J.C. A Study of Bibliometric Trends in Automotive Human–Machine Interfaces. Sustainability 2022, 14, 9262. [Google Scholar] [CrossRef]
- Nagy, M.; Lăzăroiu, G. Computer Vision Algorithms, Remote Sensing Data Fusion Techniques, and Mapping and Navigation Tools in the Industry 4.0-Based Slovak Automotive Sector. Mathematics 2022, 10, 3543. [Google Scholar] [CrossRef]
- Pavel, M.I.; Tan, S.Y.; Abdullah, A. Vision-Based Autonomous Vehicle Systems Based on Deep Learning: A Systematic Literature Review. Appl. Sci. 2022, 12, 6831. [Google Scholar] [CrossRef]
- Schlicht, P. AI in the Automotive Industry. In Work and AI 2030; Springer Fachmedien Wiesbaden: Wiesbaden, Germany, 2023; pp. 257–265. [Google Scholar]
- Vermesan, O.; John, R.; Pype, P.; Daalderop, G.; Kriegel, K.; Mitic, G.; Lorentz, V.; Bahr, R.; Sand, H.E.; Bockrath, S.; et al. Automotive Intelligence Embedded in Electric Connected Autonomous and Shared Vehicles Technology for Sustainable Green Mobility. Front. Futur. Transp. 2021, 2, 688482. [Google Scholar] [CrossRef]
- Zhang, Y.; Dhua, A.S.; Kiselewich, S.J.; Bauson, W.A. Challenges of Embedded Computer Vision in Automotive Safety Systems. In Embedded Computer Vision; Springer: London, UK, 2009; pp. 257–279. [Google Scholar]
- Mehta, S.; Rastegari, M. Mobilevit: Light-Weight, General-Purpose, and Mobile-Friendly Vision Transformer. arXiv 2022, arXiv:2110.02178. [Google Scholar]
- Xu, G.; Hao, Z.; Luo, Y.; Hu, H.; An, J. DeViT: Decomposing Vision Transformers for Collaborative Inference in Edge Devices. IEEE Trans. Mob. Comput. 2023, 23, 5917–5932. [Google Scholar] [CrossRef]
- Setyawan, N.; Kurniawan, G.W.; Sun, C.-C.; Kuo, W.-K.; Hsieh, J.-W. Fast-COS: A Fast One-Stage Object Detector Based on Reparameterized Attention Vision Transformer for Autonomous Driving. arXiv 2025, arXiv:2502.07417. [Google Scholar]
- Lai-Dang, Q.-V. A Survey of Vision Transformers in Autonomous Driving: Current Trends and Future Directions. arXiv 2024, arXiv:2403.07542. [Google Scholar] [CrossRef]
- Zemmouri, A.; Barodi, A.; Dahou, H.; Alareqi, M.; Elgouri, R.; Hlou, L.; Benbrahim, M. A microsystem design for controlling a DC motor by pulse width modulation using MicroBlaze soft-core. Int. J. Electr. Comput. Eng. 2023, 13, 1437. [Google Scholar] [CrossRef]
- Rinosha, S.M.J. Gethsiyal Augasta M Review of recent advances in visual tracking techniques. Multimed. Tools Appl. 2021, 80, 24185–24203. [Google Scholar] [CrossRef]
- Juan, O.; Keriven, R.; Postelnicu, G. Stochastic Motion and the Level Set Method in Computer Vision: Stochastic Active Contours. Int. J. Comput. Vis. 2006, 69, 7–25. [Google Scholar] [CrossRef]
- Preusser, T.; Kirby, R.M.; Pätz, T. Image Processing and Computer Vision with Stochastic Images. In Stochastic Partial Differential Equations for Computer Vision with Uncertain Data; Springer: Cham, Switzerland, 2017; pp. 81–116. [Google Scholar]
- Panagakis, Y.; Kossaifi, J.; Chrysos, G.G.; Oldfield, J.; Nicolaou, M.A.; Anandkumar, A.; Zafeiriou, S. Tensor Methods in Computer Vision and Deep Learning. Proc. IEEE 2021, 109, 863–890. [Google Scholar] [CrossRef]
- Guo, M.-H.; Xu, T.-X.; Liu, J.-J.; Liu, Z.-N.; Jiang, P.-T.; Mu, T.-J.; Zhang, S.-H.; Martin, R.R.; Cheng, M.-M.; Hu, S.-M. Attention mechanisms in computer vision: A survey. Comput. Vis. Media 2022, 8, 331–368. [Google Scholar] [CrossRef]
- Chang, C.-H.; Hung, J.C.; Chang, J.-W. Exploring the Potential of Webcam-Based Eye-Tracking for Traditional Eye-Tracking Analysis. In International Conference on Frontier Computing; Springer: Singapore, 2024; pp. 313–316. [Google Scholar]
- Zarindast, A.; Sharma, A. Opportunities and Challenges in Vehicle Tracking: A Computer Vision-Based Vehicle Tracking System. Data Sci. Transp. 2023, 5, 3. [Google Scholar] [CrossRef]
- Vongkulbhisal, J.; De la Torre, F.; Costeira, J.P. Discriminative Optimization: Theory and Applications to Computer Vision. IEEE Trans. Pattern Anal. Mach. Intell. 2019, 41, 829–843. [Google Scholar] [CrossRef]
- Chen, Z.; Du, Y.; Deng, J.; Zhuang, J.; Liu, P. Adaptive Hyper-Feature Fusion for Visual Tracking. IEEE Access 2020, 8, 68711–68724. [Google Scholar] [CrossRef]
- Walia, G.S.; Ahuja, H.; Kumar, A.; Bansal, N.; Sharma, K. Unified Graph-Based Multicue Feature Fusion for Robust Visual Tracking. IEEE Trans. Cybern. 2020, 50, 2357–2368. [Google Scholar] [CrossRef]
- Cao, J.; Pang, J.; Kitani, K. Multi-Object Tracking by Hierarchical Visual Representations. In Proceedings of the 2024 IEEE International Conference on Robotics and Automation (ICRA), Yokohama, Japan, 13–17 May 2024. [Google Scholar]
- Wahid, A.; Yahya, M.; Breslin, J.G.; Intizar, M.A. Self-Attention Transformer-Based Architecture for Remaining Useful Life Estimation of Complex Machines. Procedia Comput. Sci. 2023, 217, 456–464. [Google Scholar] [CrossRef]
- Li, F.; Zhang, S.; Yang, J.; Feng, Z.; Chen, Z. Rail-PillarNet: A 3D Detection Network for Railway Foreign Object Based on LiDAR. Comput. Mater. Contin. 2024, 80, 3819–3833. [Google Scholar] [CrossRef]
- Chen, Z.; Yang, J.; Chen, L.; Li, F.; Feng, Z.; Jia, L.; Li, P. RailVoxelDet: An Lightweight 3D Object Detection Method for Railway Transportation Driven by on-Board LiDAR Data. IEEE Internet Things J. 2025, 12, 37175–37189. [Google Scholar] [CrossRef]
- Li, Z.; Wang, W.; Li, H.; Xie, E.; Sima, C.; Lu, T.; Yu, Q.; Dai, J. BEVFormer: Learning Bird’s-Eye-View Representation From LiDAR-Camera via Spatiotemporal Transformers. IEEE Trans. Pattern Anal. Mach. Intell. 2025, 47, 2020–2036. [Google Scholar] [CrossRef]
- Yu, Z.; Li, J.; Wei, Y.; Lyu, Y.; Tan, X. Combining Camera–LiDAR Fusion and Motion Planning Using Bird’s-Eye View Representation for End-to-End Autonomous Driving. Drones 2025, 9, 281. [Google Scholar] [CrossRef]
- Qi, C.R.; Liu, W.; Wu, C.; Su, H.; Guibas, L.J. Frustum PointNets for 3D Object Detection from RGB-D Data. In Proceedings of the 2018 IEEE/CVF Conference on Computer Vision and Pattern Recognition, Salt Lake City, UT, USA, 18–22 June 2018; pp. 918–927. [Google Scholar]
- Keshun, Y.; Puzhou, W.; Yingkui, G. Toward Efficient and Interpretative Rolling Bearing Fault Diagnosis via Quadratic Neural Network With Bi-LSTM. IEEE Internet Things J. 2024, 11, 23002–23019. [Google Scholar] [CrossRef]
- Houben, S.; Stallkamp, J.; Salmen, J.; Schlipsing, M.; Igel, C. Detection of traffic signs in real-world images: The German traffic sign detection benchmark. In Proceedings of the 2013 International Joint Conference on Neural Networks (IJCNN), Dallas, TX, USA, 4–9 August 2013. [Google Scholar] [CrossRef]
- Maldonado-Bascon, S.; Lafuente-Arroyo, S.; Gil-Jimenez, P.; Gomez-Moreno, H.; Lopez-Ferreras, F. Road-Sign Detection and Recognition Based on Support Vector Machines. IEEE Trans. Intell. Transp. Syst. 2007, 8, 264–278. [Google Scholar] [CrossRef]
- Cordts, M.; Omran, M.; Ramos, S.; Rehfeld, T.; Enzweiler, M.; Benenson, R.; Franke, U.; Roth, S.; Schiele, B. The Cityscapes Dataset for Semantic Urban Scene Understanding. In Proceedings of the 2016 IEEE Conference on Computer Vision and Pattern Recognition (CVPR), Las Vegas, NV, USA, 27–30 June 2016; pp. 3213–3223. [Google Scholar]
- Neven, D.; Brabandere, B.D.; Georgoulis, S.; Proesmans, M.; Gool, L. Van Towards End-to-End Lane Detection: An Instance Segmentation Approach. In Proceedings of the 2018 IEEE Intelligent Vehicles Symposium (IV), Rio de Janeiro, Brazil, 8–13 July 2018; pp. 286–291. [Google Scholar]
- Pan, X.; Shi, J.; Luo, P.; Wang, X.; Tang, X. Spatial as Deep: Spatial CNN for Traffic Scene Understanding. Proc. AAAI Conf. Artif. Intell. 2018, 32, 7276–7283. [Google Scholar] [CrossRef]
- Stallkamp, J.; Schlipsing, M.; Salmen, J.; Igel, C. Man vs. computer: Benchmarking machine learning algorithms for traffic sign recognition. Neural Netw. 2012, 32, 323–332. [Google Scholar] [CrossRef]
- Haque, W.A.; Arefin, S.; Shihavuddin, A.S.M.; Hasan, M.A. DeepThin: A novel lightweight CNN architecture for traffic sign recognition without GPU requirements. Expert Syst. Appl. 2021, 168, 114481. [Google Scholar] [CrossRef]
- Dollar, P.; Wojek, C.; Schiele, B.; Perona, P. Pedestrian Detection: An Evaluation of the State of the Art. IEEE Trans. Pattern Anal. Mach. Intell. 2012, 34, 743–761. [Google Scholar] [CrossRef] [PubMed]
- Geiger, A.; Lenz, P.; Stiller, C.; Urtasun, R. Vision meets robotics: The KITTI dataset. Int. J. Rob. Res. 2013, 32, 1231–1237. [Google Scholar] [CrossRef]
- Jiang, S.; Huang, Z.; Qian, K.; Luo, Z.; Zhu, T.; Zhong, Y.; Tang, Y.; Kong, M.; Wang, Y.; Jiao, S.; et al. A Survey on Vision-Language-Action Models for Autonomous Driving. arXiv 2025, arXiv:2506.24044. [Google Scholar]
- Madam, A.; Yusof, R. Malaysian traffic sign dataset for traffic sign detection and recognition systems. J. Telecommun. Electron. Comput. Eng. 2016, 8, 137–143. [Google Scholar]
- Larsson, F.; Felsberg, M. Using Fourier Descriptors and Spatial Models for Traffic Sign Recognition. In Scandinavian Conference on Image Analysis; Springer: Berlin/Heidelberg, Germany, 2011; pp. 238–249. [Google Scholar]
- Mathias, M.; Timofte, R.; Benenson, R.; Van Gool, L. Traffic sign recognition—How far are we from the solution? In Proceedings of the 2013 International Joint Conference on Neural Networks (IJCNN 2013-Dallas), Dallas, TX, USA, 4–9 August 2013. [Google Scholar] [CrossRef]
- Youssef, A.; Albani, D.; Nardi, D.; Bloisi, D.D. Fast Traffic Sign Recognition Using Color Segmentation and Deep Convolutional Networks. In International Conference on Advanced Concepts for Intelligent Vision Systems; Springer: Cham, Switzerland, 2016; pp. 205–216. [Google Scholar] [CrossRef]
- Zhang, X.; He, L.; Chen, J.; Wang, B.; Wang, Y.; Zhou, Y. Multiattention Mechanism 3D Object Detection Algorithm Based on RGB and LiDAR Fusion for Intelligent Driving. Sensors 2023, 23, 8732. [Google Scholar] [CrossRef]
- Yasas Mahima, K.T.; Perera, A.G.; Anavatti, S.; Garratt, M. Toward Robust 3D Perception for Autonomous Vehicles: A Review of Adversarial Attacks and Countermeasures. IEEE Trans. Intell. Transp. Syst. 2024, 25, 19176–19202. [Google Scholar] [CrossRef]
- Lillo-Castellano, J.M.; Mora-Jiménez, I.; Figuera-Pozuelo, C.; Rojo-Álvarez, J.L. Traffic sign segmentation and classification using statistical learning methods. Neurocomputing 2015, 153, 286–299. [Google Scholar] [CrossRef]
- Chen, Z.; Yang, J.; Kong, B. A Robust Traffic Sign Recognition System for Intelligent Vehicles. In Proceedings of the 2011 Sixth International Conference on Image and Graphics, Hefei, China, 12–15 August 2011; pp. 975–980. [Google Scholar] [CrossRef]
- Saravanan, G.; Yamuna, G.; Nandhini, S. Real time implementation of RGB to HSV/HSI/HSL and its reverse color space models. In Proceedings of the 2016 International Conference on Communication and Signal Processing (ICCSP), Melmaruvathur, India, 6–8 April 2016; pp. 462–466. [Google Scholar] [CrossRef]
- Zakir, U.; Leonce, A.N.J.; Edirisinghe, E.A. Road sign segmentation based on colour spaces: A comparative study. In Proceedings of the Computer Graphics and Imaging, Innsbruck, Austria, 17–19 February 2010; pp. 72–79. [Google Scholar] [CrossRef]
- Farhat, W.; Sghaier, S.; Faiedh, H.; Souani, C. Design of efficient embedded system for road sign recognition. J. Ambient Intell. Humaniz. Comput. 2019, 10, 491–507. [Google Scholar] [CrossRef]
- Liu, C.; Li, S.; Chang, F.; Wang, Y. Machine Vision Based Traffic Sign Detection Methods: Review, Analyses and Perspectives. IEEE Access 2019, 7, 86578–86596. [Google Scholar] [CrossRef]
- Gomez-Moreno, H.; Maldonado-Bascon, S.; Gil-Jimenez, P.; Lafuente-Arroyo, S. Goal evaluation of segmentation algorithms for traffic sign recognition. IEEE Trans. Intell. Transp. Syst. 2010, 11, 917–930. [Google Scholar] [CrossRef]
- Venetsanopoulos, A.N.; Plataniotis, K.N. Color Image Processing and Applications; Springer: Cham, Switzerland, 2013; ISBN 9783540669531. [Google Scholar]
- De La Escalera, A.; Armingol, J.M.; Pastor, J.M.; Rodríguez, F.J. Visual sign information extraction and identification by deformable models for intelligent vehicles. IEEE Trans. Intell. Transp. Syst. 2004, 5, 57–68. [Google Scholar] [CrossRef]
- Song, L.; Liu, Z.; Duan, H.; Liu, N. A Color-Based Image Segmentation Approach for Traffic Scene Understanding. In Proceedings of the 2017 13th International Conference on Semantics, Knowledge and Grids (SKG), Beijing, China, 13–14 August 2017; pp. 33–37. [Google Scholar] [CrossRef]
- Manjunatha, H.T.; Danti, A.; ArunKumar, K.L. A Novel Approach for Detection and Recognition of Traffic Signs for Automatic Driver Assistance System Under Cluttered Background; Springer: Singapore, 2019; Volume 1035, ISBN 9789811391804. [Google Scholar]
- Narote, S.P.; Bhujbal, P.N.; Narote, A.S.; Dhane, D.M. A review of recent advances in lane detection and departure warning system. Pattern Recognit. 2018, 73, 216–234. [Google Scholar] [CrossRef]
- Yang, T.; Long, X.; Sangaiah, A.K.; Zheng, Z.; Tong, C. Deep detection network for real-life traffic sign in vehicular networks. Comput. Networks 2018, 136, 95–104. [Google Scholar] [CrossRef]
- Chahid, M.; Zemmouri, A.; Barodi, A.; Kartita, M.; Benbrahim, M. Classification of Multiple Eye Diseases, Parallel Feature Extraction with Transfer Learning. In International Conference on Advanced Sustainability Engineering and Technology; Springer: Cham, Switzerland, 2025; pp. 56–64. [Google Scholar]
- Wei, X.; Zhang, Z.; Chai, Z.; Feng, W. Research on Lane Detection and Tracking Algorithm Based on Improved Hough Transform. In Proceedings of the 2018 IEEE International Conference of Intelligent Robotic and Control Engineering (IRCE), Lanzhou, China, 24–27 August 2018; pp. 263–269. [Google Scholar] [CrossRef]
- Farag, W.; Saleh, Z. Road lane-lines detection in real-time for advanced driving assistance systems. In Proceedings of the 2018 International Conference on Innovation and Intelligence for Informatics, Computing, and Technologies (3ICT), Sakhier, Bahrain, 18–20 November 2018; pp. 1–8. [Google Scholar] [CrossRef]
- Xu, S.; Wang, J.; Wu, P.; Shou, W.; Wang, X.; Chen, M. Vision-based pavement marking detection and condition assessment-a case study. Appl. Sci. 2021, 11, 3152. [Google Scholar] [CrossRef]
- Bente, T.F.; Szeghalmy, S.; Fazekas, A. Detection of lanes and traffic signs painted on road using on-board camera. In Proceedings of the 2018 IEEE International Conference on Future IoT Technologies (Future IoT), Eger, Hungary, 18–19 January 2018; pp. 1–7. [Google Scholar] [CrossRef]
- García-Garrido, M.Á.; Sotelo, M.Á.; Martín-Gorostiza, E. Fast traffic sign detection and recognition under changing lighting conditions. In Proceedings of the 2006 IEEE Intelligent Transportation Systems Conference, Toronto, ON, Canada, 17–20 September 2006; pp. 811–816. [Google Scholar] [CrossRef]
- Loy, G.; Zelinsky, A. A fast radial symmetry transform for detecting points of interest. Lect. Notes Comput. Sci. 2002, 2350, 358–368. [Google Scholar] [CrossRef]
- González, Á.; García-garrido, M.Á.; Llorca, D.F.; Gavilán, M.; Fernández, J.P.; Alcantarilla, P.F.; Parra, I.; Herranz, F.; Bergasa, L.M.; Sotelo, M.Á.; et al. System Using Computer Vision. Transportation 2011, 12, 485–499. [Google Scholar]
- Romdhane, N.B.; Mliki, H.; El Beji, R.; Hammami, M. Combined 2d/3d traffic signs recognition and distance estimation. In Proceedings of the 2016 IEEE Intelligent Vehicles Symposium (IV), Gothenburg, Sweden, 19–22 June 2016; pp. 355–360. [Google Scholar] [CrossRef]
- Kartita, M.; Zemmouri, A.; Barodi, A.; Chahid, M.; Benbrahim, M. Evaluating OpenCL, OpenMP, MPI and CUDA for Embedded Systems. In International Conference on Advanced Sustainability Engineering and Technology; Springer: Cham, Switzerland, 2025; pp. 65–79. [Google Scholar]
- Greenhalgh, J.; Mirmehdi, M. Real-time detection and recognition of road traffic signs. IEEE Trans. Intell. Transp. Syst. 2012, 13, 1498–1506. [Google Scholar] [CrossRef]
- Chen, L.; Li, Q.; Li, M.; Mao, Q. Traffic sign detection and recognition for intelligent vehicle. In Proceedings of the 2011 IEEE Intelligent Vehicles Symposium (IV), Baden-Baden, Germany, 5–9 June 2011; pp. 908–913. [Google Scholar] [CrossRef]
- Tsai, C.Y.; Liao, H.C.; Hsu, K.J. Real-time embedded implementation of robust speed-limit sign recognition using a novel centroid-to-contour description method. IET Comput. Vis. 2017, 11, 407–414. [Google Scholar] [CrossRef]
- Zaklouta, F.; Stanciulescu, B. Real-time traffic sign recognition in three stages. Rob. Auton. Syst. 2014, 62, 16–24. [Google Scholar] [CrossRef]
- García-garrido, M.Á.; Sotelo, M.Á.; Martín-gorostiza, E. Fast Road Sign Detection Using Hough Transform for Assisted Driving of Road Vehicles. In International Conference on Computer Aided Systems Theory; Springer: Berlin/Heidelberg, Germany, 2005; pp. 543–548. [Google Scholar]
- Borrego-carazo, J.; Castells-rufas, D.; Biempica, E.; Carrabina, J. Resource-Constrained Machine Learning for ADAS: A Systematic Review. IEEE Access 2020, 8, 40573–40598. [Google Scholar] [CrossRef]
- Procedures, V. Real-Time Straight-Line Detection for XGA-Size Videos by Hough Transform with Parallelized Voting Procedures. Sensors 2017, 17, 270. [Google Scholar] [CrossRef]
- Gupta, A.; Choudhary, A. A Framework for Camera based Real-Time Lane and Road Surface Marking Detection and Recognition. IEEE Trans. Intell. Veh. 2018, 3, 476–485. [Google Scholar] [CrossRef]
- Park, M.W.; Park, J.P.; Korea, S.; Jung, S.K. Real-time Vehicle Detection using Equi-Height Mosaicking Image. In Proceedings of the 2013 Research in Adaptive and Convergent Systems, Montreal, QC, Canada, 1–4 October 2013; pp. 171–176. [Google Scholar]
- Huang, D.Y.; Chen, C.H.; Chen, T.Y.; Hu, W.C.; Feng, K.W. Vehicle detection and inter-vehicle distance estimation using single-lens video camera on urban/suburb roads. J. Vis. Commun. Image Represent. 2017, 46, 250–259. [Google Scholar] [CrossRef]
- Gudigar, A.; Chokkadi, S.; Raghavendra, U.; Acharya, U.R. Local texture patterns for traffic sign recognition using higher order spectra. Pattern Recognit. Lett. 2017, 94, 202–210. [Google Scholar] [CrossRef]
- Villalón-Sepúlveda, G.; Torres-Torriti, M.; Flores-Calero, M. Traffic sign detection system for locating road intersections and roundabouts: The chilean case. Sensors 2017, 17, 1207. [Google Scholar] [CrossRef]
- Ellahyani, A.; Ansari, M. El Mean shift and log-polar transform for road sign detection. Multimed. Tools Appl. 2017, 76, 24495–24513. [Google Scholar] [CrossRef]
- Lee, J.; Seo, Y.W.; Zhang, W.; Wettergreen, D. Kernel-based traffic sign tracking to improve highway workzone recognition for reliable autonomous driving. In Proceedings of the 16th International IEEE Conference on Intelligent Transportation Systems (ITSC 2013), The Hague, The Netherlands, 6–9 October 2013; pp. 1131–1136. [Google Scholar] [CrossRef]
- Hao, Q.; Tao, Y.; Cao, J.; Tang, M.; Cheng, Y.; Zhou, D.; Ning, Y.; Bao, C.; Cui, H. Retina-like imaging and its applications: A brief review. Appl. Sci. 2021, 11, 7058. [Google Scholar] [CrossRef]
- Cheng, J.C.P.; Wang, M. Automated detection of sewer pipe defects in closed-circuit television images using deep learning techniques. Autom. Constr. 2018, 95, 155–171. [Google Scholar] [CrossRef]
- Kalms, L.; Rettkowski, J.; Hamme, M.; Gohringer, D. Robust lane recognition for autonomous driving. In Proceedings of the 2017 Conference on Design and Architectures for Signal and Image Processing (DASIP), Dresden, Germany, 27–29 September 2017; pp. 1–6. [Google Scholar] [CrossRef]
- Kumtepe, Ö.; Akar, G.B.; Yüncü, E. On Vehicle Aggressive Driving Behavior Detection Using Visual Information. In Proceedings of the 2015 23nd Signal Processing and Communications Applications Conference (SIU), Malatya, Turkey, 16–19 May 2015; pp. 1–4. [Google Scholar] [CrossRef]
- Anderson, R. Feasibility Study on the Utilization of Microsoft HoloLens to Increase Driving Conditions Awareness. In Proceedings of the 2019 SoutheastCon, Huntsville, AL, USA, 11–14 April 2019; pp. 1–8. [Google Scholar]
- Song, W.; Yang, Y.; Fu, M.; Li, Y.; Wang, M. Lane Detection and Classification for Forward Collision Warning System Based on Stereo Vision. IEEE Sens. J. 2018, 18, 5151–5163. [Google Scholar] [CrossRef]
- Zhang, J.; Huang, Q.; Wu, H.; Liu, Y. A shallow network with combined pooling for fast traffic sign recognition. Information 2017, 8, 45. [Google Scholar] [CrossRef]
- Huang, Z.; Yu, Y.; Gu, J.; Liu, H. An Efficient Method for Traffic Sign Recognition Based on Extreme Learning Machine. IEEE Trans. Cybern. 2017, 47, 920–933. [Google Scholar] [CrossRef]
- Liang, M.; Yuan, M.; Hu, X.; Li, J.; Liu, H. Traffic sign detection by ROI extraction and histogram features-based recognition. In Proceedings of the 2013 International Joint Conference on Neural Networks (IJCNN), Dallas, TX, USA, 4–9 August 2013. [Google Scholar] [CrossRef]
- Abdi, L.; Meddeb, A. Spatially Enhanced Bags of Visual Words Representation to Improve Traffic Signs Recognition. J. Signal Process Syst. 2018, 90, 1729–1741. [Google Scholar] [CrossRef]
- Jose, A.; Thodupunoori, H.; Nair, B.B. Combining Viola—Jones Framework and Deep Learning; Springer: Singapore, 2019; ISBN 9789811336003. [Google Scholar]
- Gudigar, A.; Chokkadi, S.; Raghavendra, U.; Acharya, U.R. Multiple thresholding and subspace based approach for detection and recognition of traffic sign. Multimed. Tools Appl. 2017, 76, 6973–6991. [Google Scholar] [CrossRef]
- Ellahyani, A.; El Ansari, M.; Lahmyed, R.; Trémeau, A. Traffic sign recognition method for intelligent vehicles. J. Opt. Soc. Am. A 2018, 35, 1907. [Google Scholar] [CrossRef]
- Azimi, S.M.; Fischer, P.; Korner, M.; Reinartz, P. Aerial LaneNet: Lane-Marking Semantic Segmentation in Aerial Imagery Using Wavelet-Enhanced Cost-Sensitive Symmetric Fully Convolutional Neural Networks. IEEE Trans. Geosci. Remote Sens. 2019, 57, 2920–2938. [Google Scholar] [CrossRef]
- Aziz, S.; Mohamed, E.A.; Youssef, F. Traffic sign recognition based on multi-feature fusion and ELM classifier. Procedia Comput. Sci. 2018, 127, 146–153. [Google Scholar] [CrossRef]
- Malik, Z.; Siddiqi, I. Detection and Recognition of Traffic Signs from Road Scene Images. In Proceedings of the 2014 12th International Conference on Frontiers of Information Technology, Islamabad, Pakistan, 17–19 December 2014; pp. 330–335. [Google Scholar] [CrossRef]
- Dhar, P.; Abedin, M.Z.; Biswas, T.; Datta, A. Traffic sign detection—A new approach and recognition using convolution neural network. In Proceedings of the 2017 IEEE Region 10 Humanitarian Technology Conference (R10-HTC), Dhaka, Bangladesh, 21–23 December 2017; pp. 416–419. [Google Scholar] [CrossRef]
- Arcos-García, Á.; Álvarez-García, J.A.; Soria-Morillo, L.M. Evaluation of deep neural networks for traffic sign detection systems. Neurocomputing 2018, 316, 332–344. [Google Scholar] [CrossRef]
- Arcos-García, Á.; Álvarez-García, J.A.; Soria-Morillo, L.M. Deep neural network for traffic sign recognition systems: An analysis of spatial transformers and stochastic optimisation methods. Neural Netw. 2018, 99, 158–165. [Google Scholar] [CrossRef]
- Haghighat, A.K.; Ravichandra-Mouli, V.; Chakraborty, P.; Esfandiari, Y.; Arabi, S.; Sharma, A. Applications of Deep Learning in Intelligent Transportation Systems; Springer: Singapore, 2020; Volume 2, ISBN 0123456789. [Google Scholar]
- Bangquan, X.; Xiong, W.X. Real-time embedded traffic sign recognition using efficient convolutional neural network. IEEE Access 2019, 7, 53330–53346. [Google Scholar] [CrossRef]
- Ma, L.; Stückler, J.; Wu, T.; Cremers, D. Detailed Dense Inference with Convolutional Neural Networks via Discrete Wavelet Transform. arXiv 2018, arXiv:1808.01834. [Google Scholar] [CrossRef]
- Abdi, L. Deep Learning Traffic Sign Detection, Recognition and Augmentation. In Proceedings of the Symposium on Applied Computing, Marrakech, Morocco, 3–7 April 2017; pp. 131–136. [Google Scholar]
- Qin, Z.; Wang, H.; Li, X. Ultra Fast Structure-Aware Deep Lane Detection. In Proceedings of the 16th European Conference, Glasgow, UK, 23–28 August 2020; Proceedings, Part XXIV; Lecture Notes in Computer Science; Springer: Cham, Switzerland, 2020; Volume 12369, pp. 276–291. [Google Scholar] [CrossRef]
- Zou, Q.; Jiang, H.; Dai, Q.; Yue, Y.; Chen, L.; Wang, Q. Robust lane detection from continuous driving scenes using deep neural networks. IEEE Trans. Veh. Technol. 2020, 69, 41–54. [Google Scholar] [CrossRef]
- Yan, Y.; Deng, C.; Ma, J.; Wang, Y.; Li, Y. A Traffic Sign Recognition Method Under Complex Illumination Conditions. IEEE Access 2023, 11, 39185–39196. [Google Scholar] [CrossRef]
- Lim, X.R.; Lee, C.P.; Lim, K.M.; Ong, T.S.; Alqahtani, A.; Ali, M. Recent Advances in Traffic Sign Recognition: Approaches and Datasets. Sensors 2023, 23, 4674. [Google Scholar] [CrossRef]
- Kaleybar, J.M.; Khaloo, H.; Naghipour, A. Efficient Vision Transformer for Accurate Traffic Sign Detection. In Proceedings of the 2023 13th International Conference on Computer and Knowledge Engineering (ICCKE) Mashhad, Iran, Islamic Republic, 1–2 November 2023; pp. 36–41. [Google Scholar] [CrossRef]
- Toshniwal, D.; Loya, S.; Khot, A.; Marda, Y. Optimized Detection and Classification on GTRSB: Advancing Traffic Sign Recognition with Convolutional Neural Networks. arXiv 2024, arXiv:2403.08283. [Google Scholar] [CrossRef]
- Redmon, J.; Divvala, S.; Girshick, R.; Farhadi, A. You only look once: Unified, real-time object detection. In Proceedings of the 2016 IEEE Conference on Computer Vision and Pattern Recognition (CVPR), Las Vegas, NV, USA, 27–30 June 2016; pp. 779–788. [Google Scholar] [CrossRef]
- Ren, S.; He, K.; Girshick, R.; Sun, J. Faster R-CNN: Towards Real-Time Object Detection with Region Proposal Networks. IEEE Trans. Pattern Anal. Mach. Intell. 2017, 39, 1137–1149. [Google Scholar] [CrossRef] [PubMed]
- Lin, T.Y.; Goyal, P.; Girshick, R.; He, K.; Dollar, P. Focal Loss for Dense Object Detection. IEEE Trans. Pattern Anal. Mach. Intell. 2020, 42, 318–327. [Google Scholar] [CrossRef]
- Onorato, G. Bayesian Optimization for Hyperparameters Tuning in Neural Networks. arXiv 2024, arXiv:2410.21886. [Google Scholar] [CrossRef]
- Shi, B. On the Hyperparameters in Stochastic Gradient Descent with Momentum. J. Mach. Learn. Res. 2024, 25, 1–40. [Google Scholar]
- Victoria, A.H.; Maragatham, G. Automatic tuning of hyperparameters using Bayesian optimization. Evol. Syst. 2021, 12, 217–223. [Google Scholar] [CrossRef]
- Kumaravel, T.; Shanmugaveni, V.; Natesan, P.; Shruthi, V.K.; Kowsalya, M.; Malarkodi, M.S. Optimizing Hyperparameters in Deep Learning Algorithms for Self-Driving Vehicles in Traffic Sign Recognition. In Proceedings of the 2024 International Conference on Science Technology Engineering and Management (ICSTEM), Coimbatore, India, 26–27 April 2024; pp. 1–7. [Google Scholar]
- Kim, T.; Park, S.; Lee, K. Traffic Sign Recognition Based on Bayesian Angular Margin Loss for an Autonomous Vehicle. Electronics 2023, 12, 3073. [Google Scholar] [CrossRef]
- Jaiswal, A.; Deepali; Sachdeva, N. Bayesian Optimized Traffic Sign Recognition on Social Media Data Using Deep Learning. In International Conference on Data Science and Applications; Springer: Singapore, 2024; pp. 499–513. [Google Scholar]
- Liu, L.; Wang, L.; Ma, Z. Improved lightweight YOLOv5 based on ShuffleNet and its application on traffic signs detection. PLoS ONE 2024, 19, e0310269. [Google Scholar] [CrossRef]
- Huang, M.; Wan, Y.; Gao, Z.; Wang, J. Real-time traffic sign detection model based on multi-branch convolutional reparameterization. J. Real-Time Image Process. 2023, 20, 57. [Google Scholar] [CrossRef]
- Fridman, L.; Terwilliger, J.; Jenik, B. DeepTraffic: Crowdsourced Hyperparameter Tuning of Deep Reinforcement Learning Systems for Multi-Agent Dense Traffic Navigation. arXiv 2018, arXiv:1801.02805. [Google Scholar]
- Yi, H.; Bui, K.-H.N. An Automated Hyperparameter Search-Based Deep Learning Model for Highway Traffic Prediction. IEEE Trans. Intell. Transp. Syst. 2021, 22, 5486–5495. [Google Scholar] [CrossRef]
- Yalamanchili, S.; Kodepogu, K.; Manjeti, V.B.; Mareedu, D.; Madireddy, A.; Mannem, J.; Kancharla, P.K. Optimizing Traffic Sign Detection and Recognition by Using Deep Learning. Int. J. Transp. Dev. Integr. 2024, 8, 131–139. [Google Scholar] [CrossRef]
- Bui, K.-H.N.; Yi, H. Optimal Hyperparameter Tuning using Meta-Learning for Big Traffic Datasets. In Proceedings of the 2020 IEEE International Conference on Big Data and Smart Computing (BigComp), Busan, Republic of Korea, 19–22 February 2020; pp. 48–54. [Google Scholar]
- Rubio, A.; Demoor, G.; Chalmé, S.; Sutton-Charani, N.; Magnier, B. Sensitivity Analysis of Traffic Sign Recognition to Image Alteration and Training Data Size. Information 2024, 15, 621. [Google Scholar] [CrossRef]
- Maletzky, A.; Thumfart, S.; Wruß, C. Comparing the Machine Readability of Traffic Sign Pictograms in Austria and Germany. arXiv 2021, arXiv:2109.02362. [Google Scholar] [CrossRef]
- Alom, M.R.; Opi, T.A.; Palok, H.I.; Shakib, M.N.; Hossain, M.P.; Rahaman, M.A. Enhanced Road Lane Marking Detection System: A CNN-Based Approach for Safe Driving. In Proceedings of the 2023 5th International Conference on Sustainable Technologies for Industry 5.0 (STI), Dhaka, Bangladesh, 9–10 December 2023; pp. 1–6. [Google Scholar]
- Hosseini, S.H.; Ghaderi, F.; Moshiri, B.; Norouzi, M. Road Sign Classification Using Transfer Learning and Pre-trained CNN Models. In Proceedings of the International Conference on Artificial Intelligence and Smart Vehicles, Tehran, Iran, 24–25 May 2023; Springer: Cham, Switzerland, 2023; pp. 39–52. [Google Scholar]
- Yang, Z.; Zhao, C.; Maeda, H.; Sekimoto, Y. Development of a Large-Scale Roadside Facility Detection Model Based on the Mapillary Dataset. Sensors 2022, 22, 9992. [Google Scholar] [CrossRef]
- Jurisic, F.; Filkovic, I.; Kalafatic, Z. Multiple-dataset traffic sign classification with OneCNN. In Proceedings of the 2015 3rd IAPR Asian Conference on Pattern Recognition (ACPR), Kuala Lumpur, Malaysia, 3–6 November 2015; pp. 614–618. [Google Scholar]
- Bayoudh, K.; Hamdaoui, F.; Mtibaa, A. Transfer learning based hybrid 2D-3D CNN for traffic sign recognition and semantic road detection applied in advanced driver assistance systems. Appl. Intell. 2021, 51, 124–142. [Google Scholar] [CrossRef]
- Ma, X.; Zhang, T.; Xu, C. Gcan: Graph convolutional adversarial network for unsupervised domain adaptation. In Proceedings of the 2019 IEEE/CVF Conference on Computer Vision and Pattern Recognition (CVPR), Long Beach, CA, USA, 15–20 June 2019; pp. 8258–8268. [Google Scholar] [CrossRef]
- Chen, S.; Zhang, Z.; Zhang, L.; He, R.; Li, Z.; Xu, M.; Ma, H. A Semi-Supervised Learning Framework Combining CNN and Multiscale Transformer for Traffic Sign Detection and Recognition. IEEE Internet Things J. 2024, 11, 19500–19519. [Google Scholar] [CrossRef]
- Zhu, Y.; Yan, W.Q. Traffic sign recognition based on deep learning. Multimed. Tools Appl. 2022, 81, 17779–17791. [Google Scholar] [CrossRef]
- Zhang, L.; Yang, K.; Han, Y.; Li, J.; Wei, W.; Tan, H.; Yu, P.; Zhang, K.; Yang, X. TSD-DETR: A lightweight real-time detection transformer of traffic sign detection for long-range perception of autonomous driving. Eng. Appl. Artif. Intell. 2025, 139, 109536. [Google Scholar] [CrossRef]
- Yang, Y.; Peng, H.; Li, C.; Zhang, W.; Yang, K. LaneFormer: Real-Time Lane Exaction and Detection via Transformer. Appl. Sci. 2022, 12, 9722. [Google Scholar] [CrossRef]
- Kumar, A.D. Novel Deep Learning Model for Traffic Sign Detection Using Capsule Networks. arXiv 2018, arXiv:1805.04424. [Google Scholar] [CrossRef]
- Liu, X.; Yan, W.Q. Traffic-light sign recognition using capsule network. Multimed. Tools Appl. 2021, 80, 15161–15171. [Google Scholar] [CrossRef]
- Ma, L.; Li, Y.; Li, J.; Yu, Y.; Junior, J.M.; Goncalves, W.N.; Chapman, M.A. Capsule-Based Networks for Road Marking Extraction and Classification From Mobile LiDAR Point Clouds. IEEE Trans. Intell. Transp. Syst. 2021, 22, 1981–1995. [Google Scholar] [CrossRef]
- Wang, J.; Chen, Y.; Dong, Z.; Gao, M. Improved YOLOv5 network for real-time multi-scale traffic sign detection. Neural Comput. Appl. 2023, 35, 7853–7865. [Google Scholar] [CrossRef]
- Han, Y.; Wang, F.; Wang, W.; Li, X.; Zhang, J. YOLO-SG: Small traffic signs detection method in complex scene. J. Supercomput. 2024, 80, 2025–2046. [Google Scholar] [CrossRef]
- Sun, C.; Wen, M.; Zhang, K.; Meng, P.; Cui, R. Traffic sign detection algorithm based on feature expression enhancement. Multimed. Tools Appl. 2021, 80, 33593–33614. [Google Scholar] [CrossRef]
- Kandasamy, K.; Natarajan, Y.; Sri Preethaa, K.R.; Ali, A.A.Y. A Robust TrafficSignNet Algorithm for Enhanced Traffic Sign Recognition in Autonomous Vehicles Under Varying Light Conditions. Neural Process. Lett. 2024, 56, 241. [Google Scholar] [CrossRef]
- Saadna, Y.; Behloul, A. An overview of traffic sign detection and classification methods. Int. J. Multimed. Inf. Retr. 2017, 6, 193–210. [Google Scholar] [CrossRef]
- Wei, H.; Zhang, Q.; Qian, Y.; Xu, Z.; Han, J. MTSDet: Multi-scale traffic sign detection with attention and path aggregation. Appl. Intell. 2023, 53, 238–250. [Google Scholar] [CrossRef]
- Zhou, S.; Wang, H.; Nie, C.; Zhang, H.; Sun, Z. Design and Experimental Evaluation of Nighttime Traffic-Sign Detection and Classification Based on Low-Light Enhancement. In Proceedings of the 2022 6th CAA International Conference on Vehicular Control and Intelligence (CVCI), Nanjing, China, 28–30 October 2022; pp. 1–6. [Google Scholar]
- Fleyeh, H. Traffic signs color detection and segmentation in poor light conditions. In Proceedings of the MVA2005 IAPR Conference on Machine VIsion Applications, Tsukuba Science City, Japan, 16–18 May 2005; pp. 306–309. [Google Scholar]
- Ayaou, T.; Beghdadi, A.; Karim, A.; Amghar, A. Enhancing Road Signs Segmentation Using Photometric Invariants. arXiv 2020, arXiv:2010.13844. [Google Scholar] [CrossRef]
- Papagianni, S.; Iliopoulou, C.; Kepaptsoglou, K.; Stathopoulos, A. Decision-Making Framework to Allocate Real-Time Passenger Information Signs at Bus Stops: Model Application in Athens, Greece. Transp. Res. Rec. 2017, 2647, 61–70. [Google Scholar] [CrossRef]
- Ertler, C.; Mislej, J.; Ollmann, T.; Porzi, L.; Neuhold, G.; Kuang, Y. The Mapillary Traffic Sign Dataset for Detection and Classification on a Global Scale. In Proceedings of the 16th European Conference, 2020, Proceedings, Part XXIII, Glasgow, UK, 23–28 August 2020; Lecture Notes in Computer Science; Springer: Cham, Switzerland, 2020; Volume 12368, pp. 68–84. [Google Scholar] [CrossRef]
- Boumediene, M.; Cudel, C.; Basset, M.; Ouamri, A. Triangular traffic signs detection based on RSLD algorithm. Mach. Vis. Appl. 2013, 24, 1721–1732. [Google Scholar] [CrossRef]
- Hasan, N.; Anzum, T.; Jahan, N. Traffic sign recognition system (tsrs): Svm and convolutional neural network. Lect. Notes Networks Syst. 2021, 145, 69–79. [Google Scholar] [CrossRef]
- Luo, Y.; Ci, Y.; Jiang, S.; Wei, X. A novel lightweight real-time traffic sign detection method based on an embedded device and YOLOv8. J. Real-Time Image Process. 2024, 21, 24. [Google Scholar] [CrossRef]
- Zhu, Y.; Liao, M.; Yang, M.; Liu, W. Cascaded Segmentation-Detection Networks for Text-Based Traffic Sign Detection. IEEE Trans. Intell. Transp. Syst. 2018, 19, 209–219. [Google Scholar] [CrossRef]
- Shen, Y.; Bi, Y.; Yang, Z.; Liu, D.; Liu, K.; Du, Y. Lane line detection and recognition based on dynamic ROI and modified firefly algorithm. Int. J. Intell. Robot. Appl. 2021, 5, 143–155. [Google Scholar] [CrossRef]
- Syed, M.H.; Kumar, S. Road Lane Line Detection Based on ROI Using Hough Transform Algorithm. Lect. Notes Networks Syst. 2023, 421, 567–580. [Google Scholar] [CrossRef]
- Chen, Y.; Wong, P.K.; Yang, Z.-X. A New Adaptive Region of Interest Extraction Method for Two-Lane Detection. Int. J. Automot. Technol. 2021, 22, 1631–1649. [Google Scholar] [CrossRef]
- Zakaria, N.J.; Shapiai, M.I.; Ghani, R.A.; Yassin, M.N.M.; Ibrahim, M.Z.; Wahid, N. Lane Detection in Autonomous Vehicles: A Systematic Review. IEEE Access 2023, 11, 3729–3765. [Google Scholar] [CrossRef]
- Qin, Y.Y.; Cui, W.; Li, Q.; Zhu, W.; Li, X.G. Traffic Sign Image Enhancement in Low Light Environment. Procedia Comput. Sci. 2019, 154, 596–602. [Google Scholar] [CrossRef]
- Prasanthi, B.; Kantheti, K.R. Lane Detection and Traffic Sign Recognition using OpenCV and Deep Learning for Autonomous Vehicles. Int. Res. J. Eng. Technol. (IRJET) 2022, 9, 478–480. [Google Scholar]
- Dubey, U.; Chaurasiya, R.K. Efficient Traffic Sign Recognition Using CLAHE-Based Image Enhancement and ResNet CNN Architectures. Int. J. Cogn. Informatics Nat. Intell. 2022, 15, 295811. [Google Scholar] [CrossRef]
- Yao, J.; Huang, B.; Yang, S.; Xiang, X.; Lu, Z. Traffic sign detection and recognition under low illumination. Mach. Vis. Appl. 2023, 34, 75. [Google Scholar] [CrossRef]
- Dewi, C.; Chernovita, H.P.; Philemon, S.A.; Ananta, C.A.; Dai, G.; Chen, A.P.S. Integration of YOLOv9 and Contrast Limited Adaptive Histogram Equalization for Nighttime Traffic Sign Detection. Math. Model. Eng. Probl. 2025, 12, 37–45. [Google Scholar] [CrossRef]
- Chen, R.-C.; Dewi, C.; Zhuang, Y.-C.; Chen, J.-K. Contrast Limited Adaptive Histogram Equalization for Recognizing Road Marking at Night Based on Yolo Models. IEEE Access 2023, 11, 92926–92942. [Google Scholar] [CrossRef]
- Manongga, W.E.; Chen, R.; Jiang, X.; Chen, R. Enhancing road marking sign detection in low-light conditions with YOLOv7 and contrast enhancement techniques. Int. J. Appl. Sci. Eng. 2023, 21, 1–10. [Google Scholar] [CrossRef]
- Wang, T.; Qu, H.; Liu, C.; Zheng, T.; Lyu, Z. LLE-STD: Traffic Sign Detection Method Based on Low-Light Image Enhancement and Small Target Detection. Mathematics 2024, 12, 3125. [Google Scholar] [CrossRef]
- Zhao, S.; Gong, Z.; Zhao, D. Traffic signs and markings recognition based on lightweight convolutional neural network. Vis. Comput. 2024, 40, 559–570. [Google Scholar] [CrossRef]
- Sun, X.; Liu, K.; Chen, L.; Cai, Y.; Wang, H. LLTH-YOLOv5: A Real-Time Traffic Sign Detection Algorithm for Low-Light Scenes. Automot. Innov. 2024, 7, 121–137. [Google Scholar] [CrossRef]
- Lopez-Montiel, M.; Orozco-Rosas, U.; Sanchez-Adame, M.; Picos, K.; Ross, O.H.M. Evaluation Method of Deep Learning-Based Embedded Systems for Traffic Sign Detection. IEEE Access 2021, 9, 101217–101238. [Google Scholar] [CrossRef]
- Siddiqui, F.; Amiri, S.; Minhas, U.I.; Deng, T.; Woods, R.; Rafferty, K.; Crookes, D. FPGA-based processor acceleration for image processing applications. J. Imaging 2019, 5, 16. [Google Scholar] [CrossRef] [PubMed]
- El Hajjouji, I.; Mars, S.; Asrih, Z.; El Mourabit, A. A novel FPGA implementation of Hough Transform for straight lane detection. Eng. Sci. Technol. Int. J. 2020, 23, 274–280. [Google Scholar] [CrossRef]
- Zemmouri, A.; Alareqi, M.; Elgouri, R.; Benbrahim, M.; Hlou, L. Integration and implimentation system-on-aprogrammable-chip (SOPC) in FPGA. J. Theor. Appl. Inf. Technol. 2015, 76, 127–133. [Google Scholar]
- Zemmouri, A.; Barodi, A.; Alareqi, M.; Elgouri, R.; Hlou, L.; Benbrahim, M. Proposal of a reliable embedded circuit to control a stepper motor using microblaze soft-core processor. Int. J. Reconfigurable Embed. Syst. 2022, 11, 215. [Google Scholar] [CrossRef]
- Lam, D.K.; Du, C.V.; Pham, H.L. QuantLaneNet: A 640-FPS and 34-GOPS/W FPGA-Based CNN Accelerator for Lane Detection. Sensors 2023, 23, 6661. [Google Scholar] [CrossRef]
- Zemmouri, A.; Elgouri, R.; Alareqi, M.; Benbrahim, M.; Hlou, L. Design and implementation of pulse width modulation using hardware/software microblaze soft-core. Int. J. Power Electron. Drive Syst. 2017, 8, 167–175. [Google Scholar] [CrossRef]
- Isa, I.S.B.M.; Yeong, C.J.; Shaari Azyze, N.L.A. bin M. Real-time traffic sign detection and recognition using Raspberry Pi. Int. J. Electr. Comput. Eng. 2022, 12, 331–338. [Google Scholar] [CrossRef]
- Triki, N.; Karray, M.; Ksantini, M. A Real-Time Traffic Sign Recognition Method Using a New Attention-Based Deep Convolutional Neural Network for Smart Vehicles. Appl. Sci. 2023, 13, 4739. [Google Scholar] [CrossRef]
- Han, Y.; Virupakshappa, K.; Pinto, E.V.S.; Oruklu, E. Hardware/software co-design of a traffic sign recognition system using zynq FPGas. Electronics 2015, 4, 1062–1089. [Google Scholar] [CrossRef]
- Farhat, W.; Faiedh, H.; Souani, C.; Besbes, K. Real-time embedded system for traffic sign recognition based on ZedBoard. J. Real-Time Image Process. 2019, 16, 1813–1823. [Google Scholar] [CrossRef]
- Hmida, R.; Ben Abdelali, A.; Mtibaa, A. Hardware implementation and validation of a traffic road sign detection and identification system. J. Real-Time Image Process. 2018, 15, 13–30. [Google Scholar] [CrossRef]
- Malmir, S.; Shalchian, M. Design and FPGA implementation of dual-stage lane detection, based on Hough transform and localized stripe features. Microprocess. Microsyst. 2019, 64, 12–22. [Google Scholar] [CrossRef]
- Teo, T.Y.; Sutopo, R.; Lim, J.M.Y.; Wong, K.S. Innovative lane detection method to increase the accuracy of lane departure warning system. Multimed. Tools Appl. 2021, 80, 2063–2080. [Google Scholar] [CrossRef]
- Gajjar, H.; Sanyal, S.; Shah, M. A comprehensive study on lane detecting autonomous car using computer vision. Expert Syst. Appl. 2023, 233, 120929. [Google Scholar] [CrossRef]
- Suder, J.; Podbucki, K.; Marciniak, T.; Dabrowski, A. Low complexity lane detection methods for light photometry system. Electronics 2021, 10, 1665. [Google Scholar] [CrossRef]
- Guo, Y.; Zhou, J.; Dong, Q.; Bian, Y.; Li, Z.; Xiao, J. A lane-level localization method via the lateral displacement estimation model on expressway. Expert Syst. Appl. 2024, 243, 122848. [Google Scholar] [CrossRef]


Disclaimer/Publisher’s Note: The statements, opinions and data contained in all publications are solely those of the individual author(s) and contributor(s) and not of MDPI and/or the editor(s). MDPI and/or the editor(s) disclaim responsibility for any injury to people or property resulting from any ideas, methods, instructions or products referred to in the content. |
© 2025 by the authors. Licensee MDPI, Basel, Switzerland. This article is an open access article distributed under the terms and conditions of the Creative Commons Attribution (CC BY) license (https://creativecommons.org/licenses/by/4.0/).