Abstract
In the world of motorsports engineering, improving brake performance is a crucial goal. One significant factor that affects this performance is the increase in brake disc temperature due to reduced cooling airflow, a phenomenon called “blanking”. This temperature increase also impacts the rim and the air inside the tire, causing changes in tire temperature and pressure, which affects the vehicle’s performance. Properly adjusting the brake blanking can be essential to keep the tire running at the right temperature, resulting in maximization of the performance on track. To address this complex problem, this study describes the problem of cooling brake discs, and this problem is then used as an opportunity to introduce a new variable in order to optimize the performance of the vehicle. By changing the thermal evolution of the brake disc, through the blanking, it can change a large percentage of heat that heats the tire. When combining an existing brake model in the literature with a tire thermal model in a co-platform simulation, it was seen that it is possible to work these two models together with the aim of being able to obtain the prediction of the optimal blanking value to be adopted before proceeding on track, thus saving time and costs.
1. Introduction
In the automotive field, particularly within the fiercely competitive domain of motorsport, where the difference between victory and defeat narrows to a mere 0.01 s, and the pursuit of vehicular perfection is unending, the quest for optimizing tire grip reigns supreme. Since the inception of organized motorsport championships, researchers and engineers from diverse disciplines have astutely recognized that the primary driver of grip variability resides in the intricate interplay between tire temperature and pressure [1]. This temperature nexus is intricately influenced by several factors, including road conduction, internal air convection, external air convection, frictional forces, SEL (Strain Energy Loss), the viscoelastic properties of the tire’s rubber [2] and the thermal profile of the braking system [3].
Notably, the frictional forces generated during the interaction between the brake disc and pads yield a substantial quantity of heat. This heat follows a double path, with a portion dissipating into the ambient air through strategically designed intakes, thereby averting the risk of thermal fatigue fractures. Simultaneously, this thermal energy very much affects the temperature of the rim of the tire which heats the internal air of the wheel, thus affecting the pressure, and subsequently also affects the temperature of the layer-defined inner liner in direct contact with the air inside the tire [4,5,6]. The inherent variability among race tracks, dictated by distinct characteristics such as velocity profiles, turn geometries, and energy dissipation levels, renders the task of maintaining tires within their ideal thermal operating range a complex undertaking.
Obviously, for what concerns the brake, the disc must be cooled in an appropriate manner, otherwise its temperatures rise significantly, reaching values that involve incorrect operation of the brakes and, consequently, the impossibility of slowing the car. The cooling of the brakes therefore becomes a new parameter to modify with the objective to increase the performance by varying the air flow needed to cool the braking system. This technique is widely recognized as “blanking” [7,8].
To systematically determine the optimal occlusion percentage for each circuit while concurrently reducing the costs and time associated with empirical testing, it was decided to incorporate a thermal model for the brakes housed inside the wheel rim, to be associated with a tire thermal model named “thermoRIDE” (an iteration of the Thermo Racing Tire model, developed at the University of Naples Federico II). ThermoRIDE, a physical–analytical model based on Fourier’s law and operating within a Lagrangian reference system, faithfully replicates the thermal dynamics of the tires. It provides a granular and localized distribution of temperatures across the tire’s inner rubber layers. While the model attributes immobility to the tire, it is important to note that the boundary conditions, inherently linked to thermal interactions with the external environment, dynamically evolve during the simulation. A comprehensive review of the existing literature allowed us the selection of an already established thermal brake model to complement the “thermoRIDE.”
This was implemented to enhance the understanding of the thermal effects that brakes and braking have on tire temperatures under operational conditions. Further exploration of this prototype model could lead to additional insights into brake performance management and the improvement of vehicle dynamics in the motorsport sector.
Furthermore, the incorporation of a prototype thermal model described in this paper, capable of simulating brake temperatures, could offer significant advantages for manufacturers of brake discs and braking systems in a not too distant future. Such simulation could aid in the refinement of component designs, encompassing cooling systems and material selections. By emulating the complexities of the braking process and examining the resulting forces, this approach aims to determine the actual operating temperatures. This analysis methodology could translate into substantial time and cost savings compared to conventional on-track testing protocols.
The sections in this paper cover the following topics: In Section 2, we discuss previous research related to estimating brake temperatures with considerations for blanking, evaluating tire temperatures while taking into account brake heat, and simulation platforms designed to improve air intake configurations. Section 4 offers a detailed explanation of the models developed and the co-simulation framework. Section 5 introduces a comprehensive set of tests, considering different vehicle speeds, brake blanking levels, and the sensor setup used for different vehicles. In Section 6, we discuss the simulation results and validate them through real-world experiments with a racing reference vehicle. Lastly, in Section 7, we conclude this scholarly presentation with final remarks and a plan for future research.
2. Braking System
Brakes are a critical component in the automotive industry, serving the fundamental role of slowing down or stopping the motion of vehicles and equipment. Their significance lies in enhancing safety and control, preventing accidents, and allowing for smooth deceleration [9]. The fundamental concept behind a braking system revolves around the idea of decelerating or halting a vehicle by transforming its kinetic energy into heat through frictional contact between the brake pad and the disc [10]. The braking system consists of three main components:
- The brake disc (or rotor);
- The brake pad;
- The brake caliper.
The brake disc is generally a flat, rotating metal component attached to the wheel. It is usually made of cast iron or ceramic composites including carbon, kevlar, and silica that are connected to the wheels and axles with the goal of stopping the wheels [11]. The brake pad, on the other hand, is a frictional material whose role is to generate a frictional force during braking conditions, contributing to the slowing down or stopping of the vehicle (depending on the amount of pressure applied to the brake pedal). Indeed, during the braking phase, the brake pads come into contact with the brake disc’s surface, generating friction useful for the braking procedure. The brake pad constituent materials are binder, reinforcement, filler, friction modifier and abrasive [12]. The brake disc and pads are represented in Figure 1.

Figure 1.
Brake disc and pads.
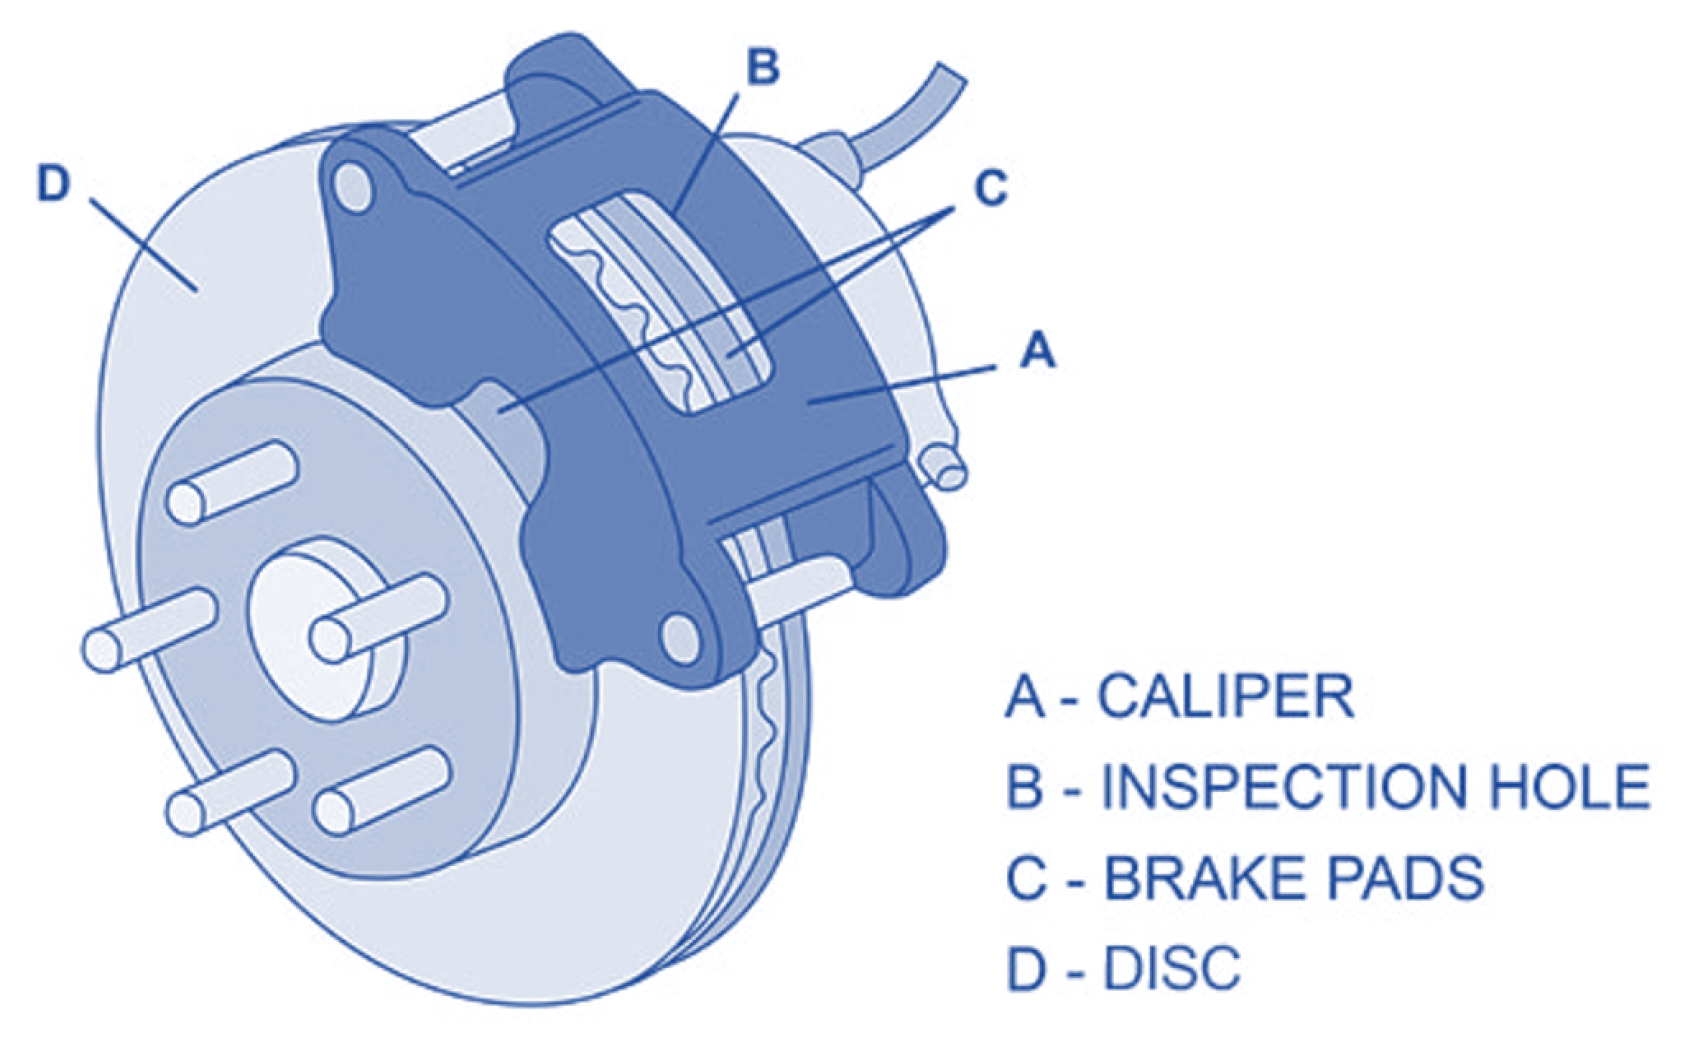
Finally, the caliper is the component that houses the brake pads and applies pressure to the rotating disc when the driver activates the brakes. Key considerations for a caliper are achieving a balance between low weight and high stiffness. High stiffness, coupled with evenly distributed pressure on the brake pads, is essential for optimizing braking performance. The significance of stiffness is due to the necessity that the caliper remains robust and unwavering under the forces applied during braking. At the same time, an even pressure distribution helps ensure uniform heat distribution, which is crucial for minimizing wear and preventing noise caused by temperature variations in the brake disc. These characteristics are influenced by factors such as material selection, manufacturing precision, and caliper design [13].
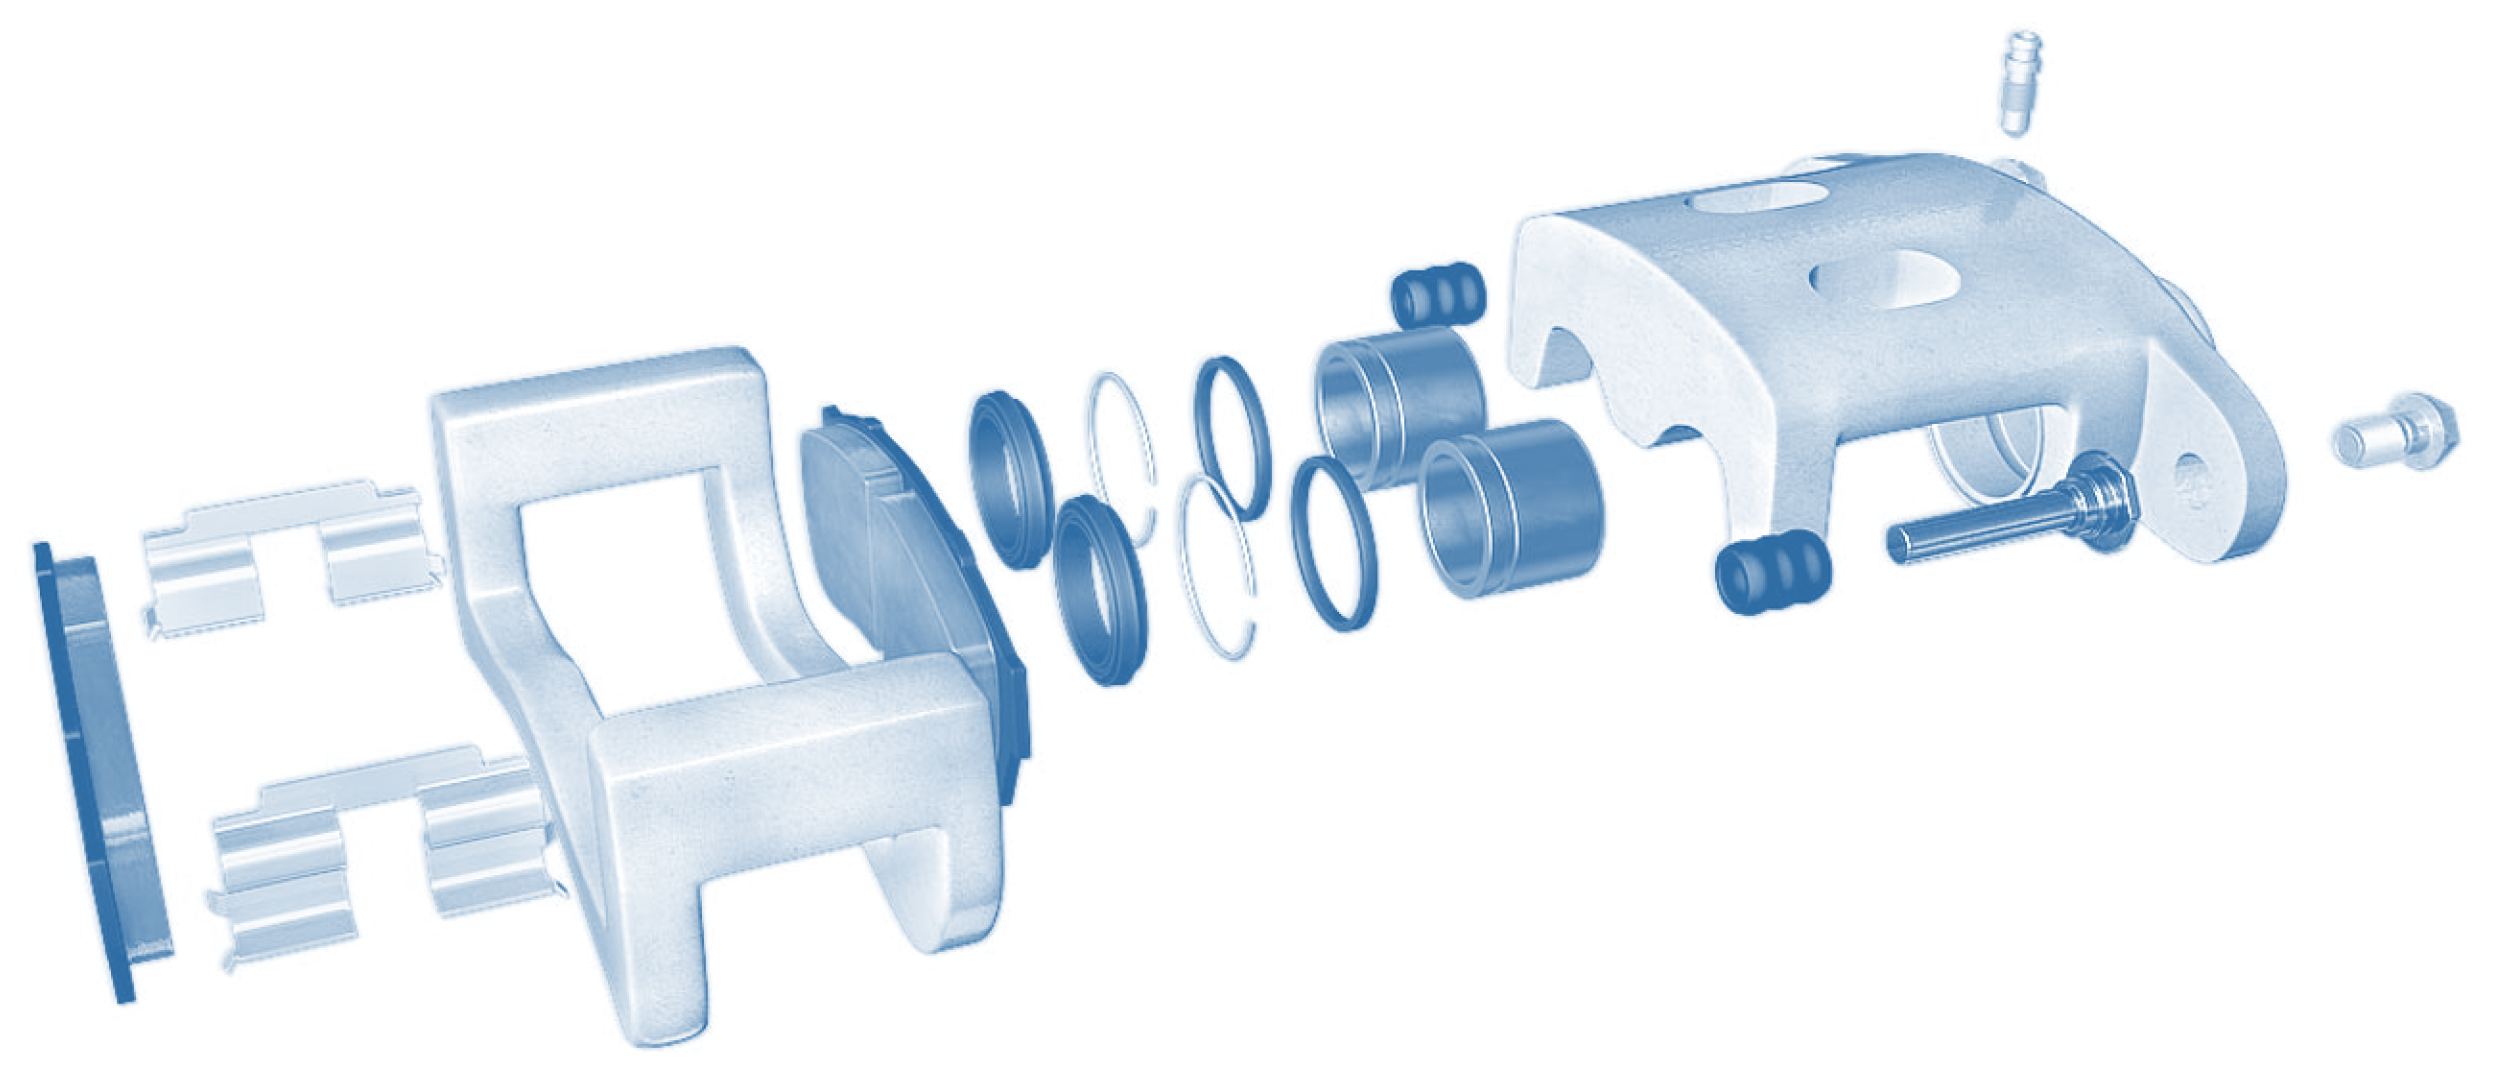
An exploded view of a brake caliper is shown in Figure 2.

Figure 2.
Brake caliper.
From what has been said, it is clear that brakes are not just a convenience but a vital safety feature in any vehicle or machinery due to their ability to control speed to ensure the safety of passengers, operators, and the surrounding environment. The synergy between the brake disc, brake pad, and brake caliper is essential for the efficient conversion of kinetic energy into heat, making brakes an indispensable component in the modern world of transportation and machinery. Regular maintenance and replacement of brake pads are essential to ensure optimal braking performance and overall safety.
3. Brake Modeling
Disc brakes are a critical safety component in vehicles, and their performance is affected by a variety of factors, including the geometry, material properties, and operating conditions. Modeling can be used to understand the behavior of disc brakes and to predict their performance under different conditions.
Finite element analysis (FEA) is a common approach to modeling disc brakes. FEA models can be used to predict the stress, strain, and temperature distribution in the brake under different loading conditions. Chengal Reddy, Gunasekhar Reddy, and Gowd present a case study on the modeling and analysis of a disc brake for an FSAE car [14]. The authors use FEA to model the brake and to predict its performance under a variety of conditions. The authors find that the FEA model is able to accurately predict the stress, strain, and temperature distribution in the brake. FEA models are typically more accurate than analytical models, but they can be more computationally expensive.
Numerical models are typically simpler than FEA models, but they can still provide useful insights into the behavior of disc brakes. Analytical models are often based on simplifying assumptions, such as assuming that the brake is a thin plate or that the material is homogeneous. Lee presents a numerical model for predicting the temperature rise of brake fluid during braking and heat soaking [15]. The author uses CFD to model the flow of the brake fluid through the brake system. The author finds that the model is able to accurately predict the temperature rise of the brake fluid under a variety of conditions.
Aerodynamic and thermal modeling is also important to consider. The aerodynamic drag of the brake can contribute to heat dissipation, while the thermal expansion of the brake can affect its performance. Vdovin and Le Gigan provide an overview of the challenges and limitations of aerodynamic and thermal modeling of disc brakes [16]. The authors identify a number of challenges, including the complex interaction between the brake and the airflow, the need to consider the effects of thermal expansion, and the need to account for the effects of heat soaking.
This same subject is dealt with more broadly by Sheridan, Kutchey, and Samie, who discuss different approaches to thermal modeling of disc brakes. The authors review a number of different approaches, including analytical models, FEA models, and computational fluid dynamics (CFD) models. The authors conclude that there is no single best approach to thermal modeling of disc brakes, and that the best approach depends on a specific application.
Modeling is a valuable tool for understanding the behavior of disc brakes. By using models, engineers can improve the design, performance, and safety of disc brakes.
With regard to the objective of this work, namely to find a brake model to complement the existing thermal tire model, it is decided to continue on the path taken by Lee in his work. In this case, the goal is to extend the knowledge on the thermal influences that affect the internal air and the various rubber layers of the tire during normal operation by extending knowledge due to the addition of the thermal brake model. Knowledge of these values is essential to improve vehicle performance by choosing the right parameters. To perform faster simulations, it is therefore necessary to choose numerical models, faster than the FEM one. The computational speed is crucial to then introduce this platform of co-simulation in driving simulators in real time to provide the driver with feedback, as realistic as possible.
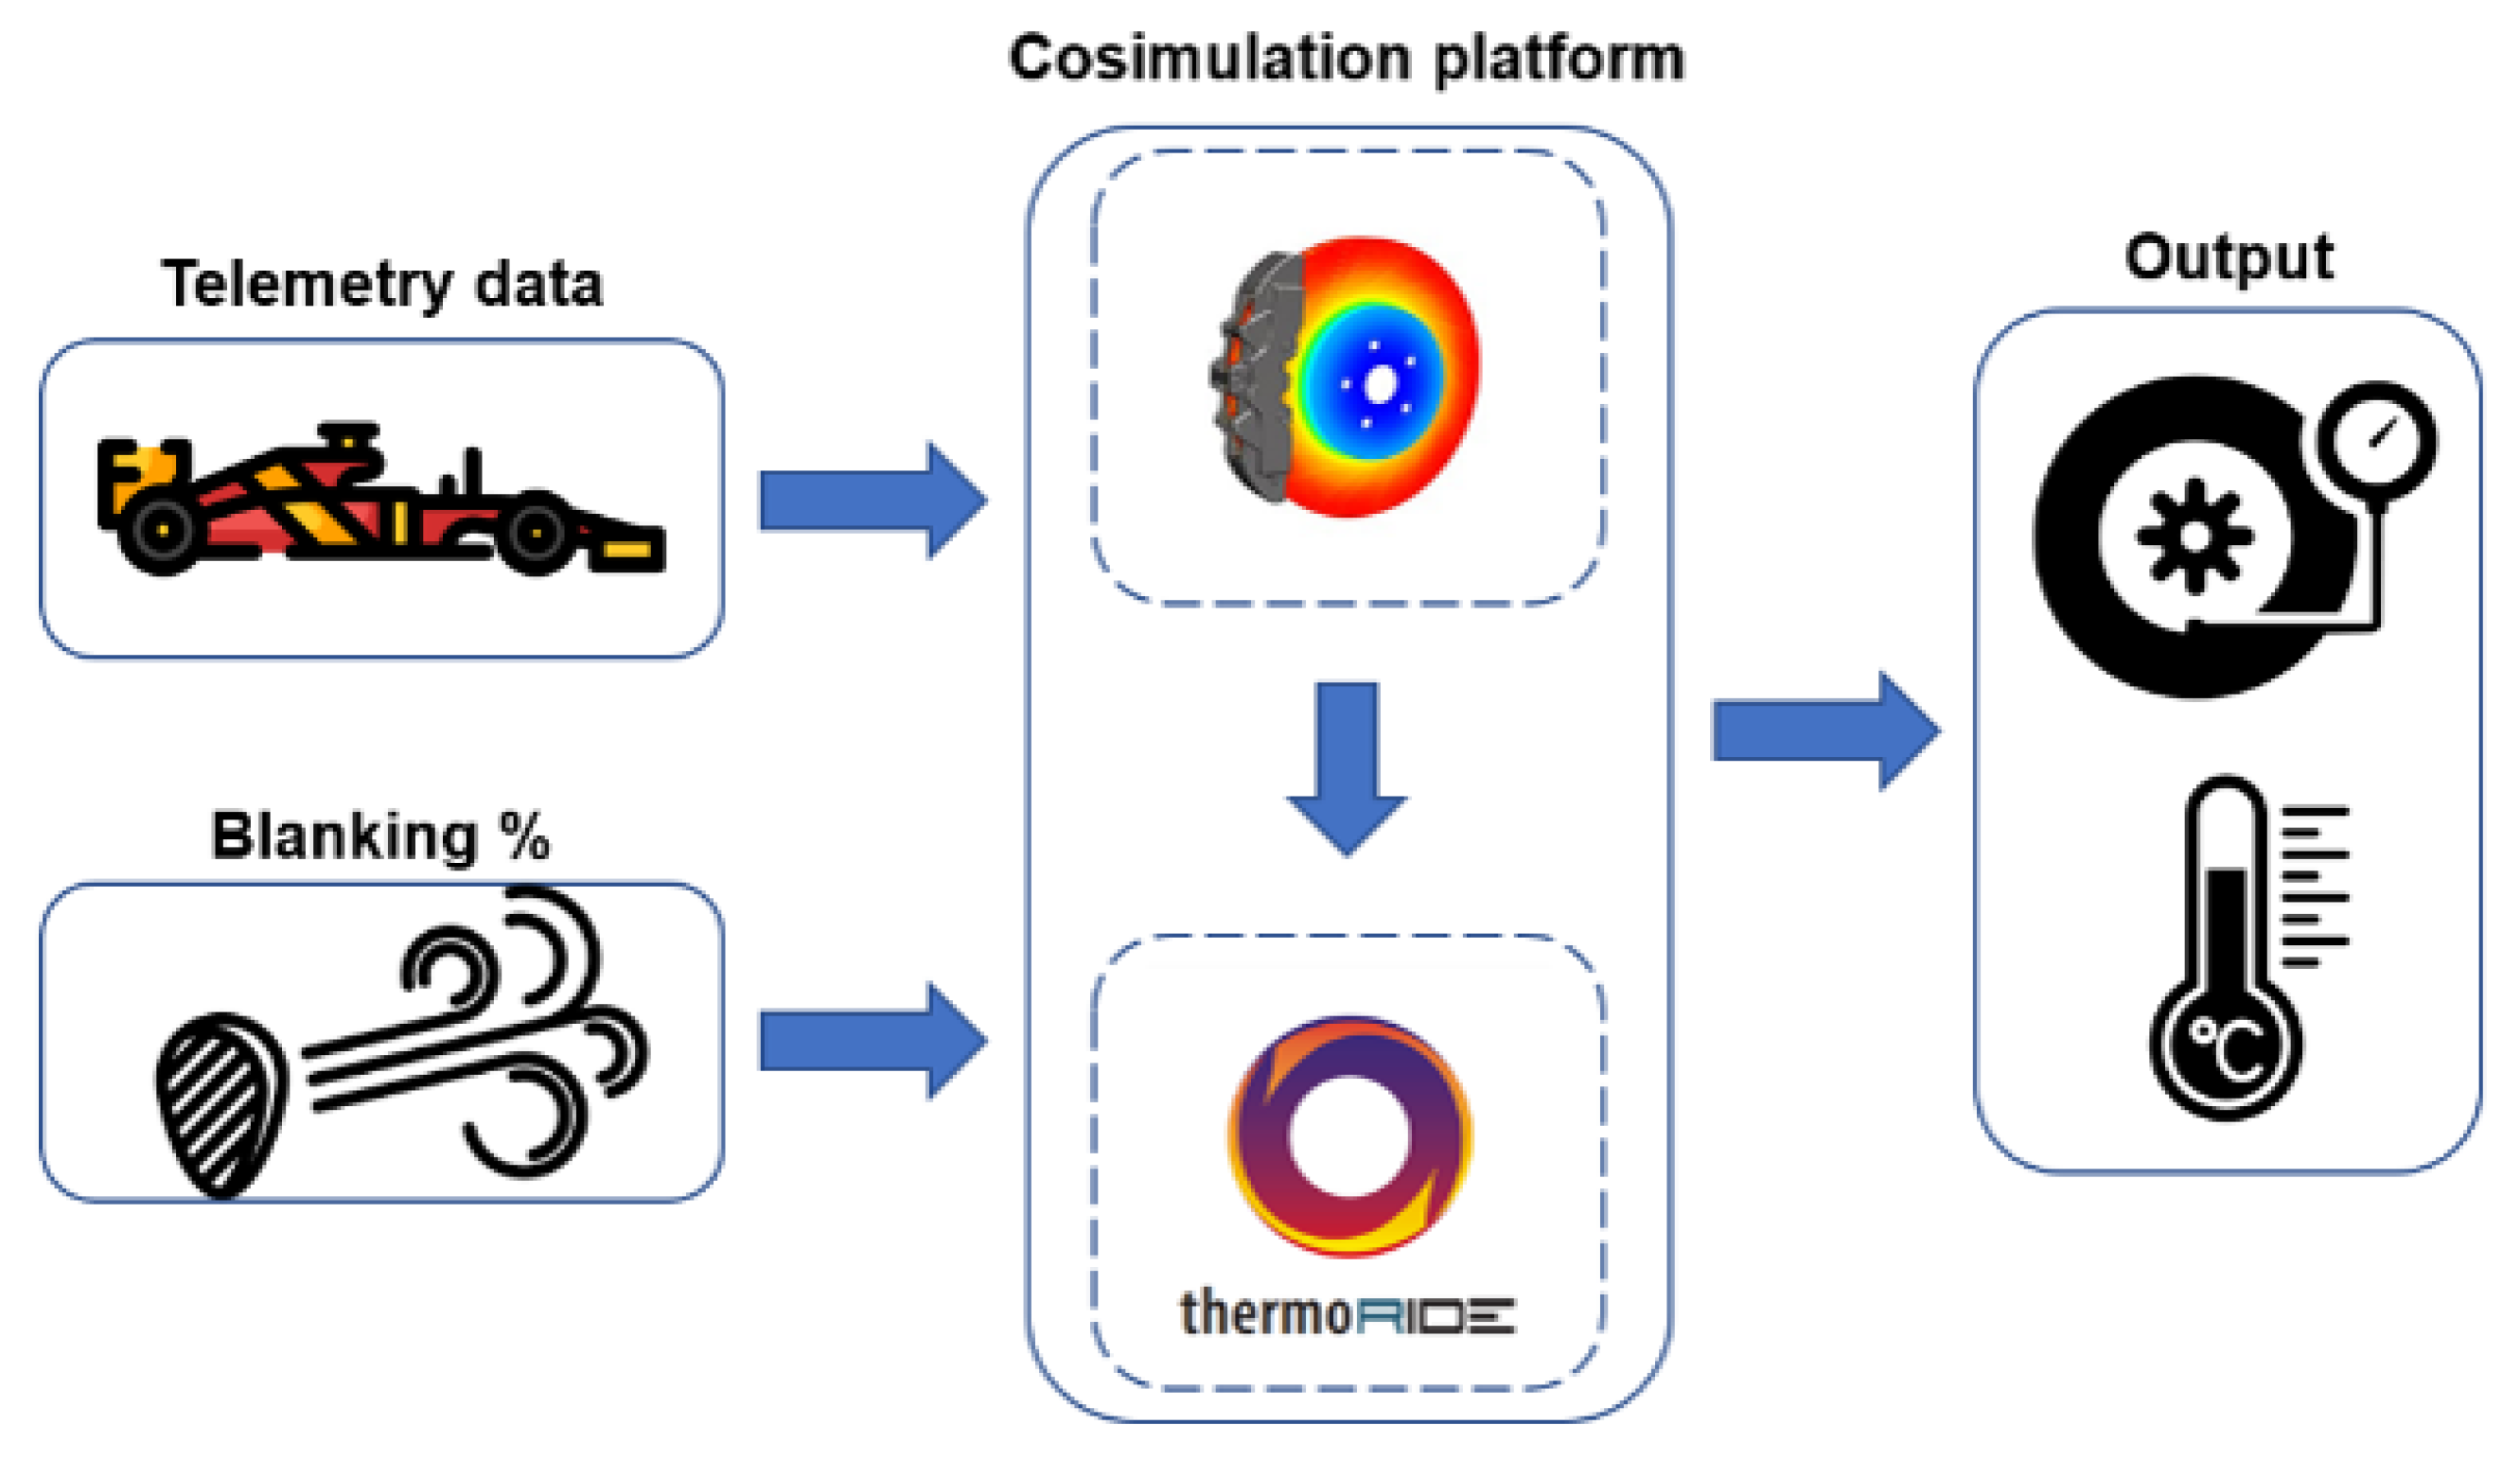
4. Co-Simulation Platform
The University of Naples research group worked on the development of a co-simulation platform representing a possible improvement in the domain of brake blanking testing, validation, and prediction. This platform leverages the integration of two models: the brake thermal model (presented in paragraph Section 3) and the tire thermal model. To comprehensively grasp the intricacies of this cutting-edge system, it is useful to delve into Figure 3, a visual representation of the co-simulation platform overarching architecture.
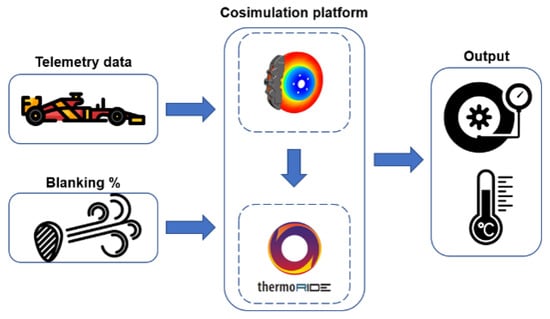
Figure 3.
Co-simulation platform.
Starting from the leftmost part of the diagram, there are input channels sourced from several placed sensors, useful for obtaining the data that drives the subsequent stages of analysis. The initial phase of this analysis is the kinematic and load estimator, a computational powerhouse that processes the incoming sensor data. In particular, it calculates the state of the vehicle, spanning from its basic kinematics to the intricate load dynamics manifesting at the wheel hubs. The data extracted through this estimation process serve as input to the tire model, an indispensable component of the co-simulation platform. At the heart of this model lies the evaluation of the vehicle’s state at the tire–road interface. Here, a confluence of factors comes into play, including the blanking percentage, tire pressure, and the complex thermal phenomena unfolding within this critical juncture. The tire model’s ability to dissect and assimilate these multifaceted variables renders it a cornerstone of the platform’s predictive capabilities.
One of the central objectives driving the research endeavors is the reduction in both cost and time associated with traditional brake blanking test sessions. Historically, such tests have been labor-intensive, resource-demanding, and time-consuming affairs. Through the deployment and improvement of this co-simulation platform, it could be possible to usher in a new era of efficiency and efficacy in brake blanking testing and prediction. By merging the power of advanced computational models with real-world sensor data, the aim is to streamline the testing, validation, and prediction processes.
Therefore, with its fusion of cutting-edge technology and academic rigor, this platform holds the possibility of improving the ways in which brake blanking testing is conducted and optimized. The amalgamation of the brake thermal model and the tire thermal model represents a synergy to enhance the understanding of brake blanking phenomena and, in turn, augments the overall safety and performance of vehicle braking systems.
4.1. Brake Thermal Model
The developed brake thermal model [17] takes into account four factors affecting temperatures:
- The brakes generate heat through friction;
- Heating/Cooling of the brake due to the convection with the surrounding air;
- Heating/Cooling of the brake due to the brake radiation from the wheel;
- Heating/Cooling due to the conduction phenomena between the wheel and the brake.
To correctly simulate the listed heat exchanges, it is essential to find correct analytical formulations for the heat exchange mechanisms. In this way, it is possible to describe the thermal dynamics concerning the brake.
In regard to the brake friction power, it can be evaluated as follows:
where
- is the brake friction power;
- is the brake torque;
- is the wheel speed.
The brake torque , in turn, can be computed as
Equation (2) includes the following variables in order to evaluate the brake torque: that is the brake pressure, that is the coefficient of friction of the brakes, that is the sum of the piston area on the inboard and outboard side of a single front caliper and , which is the effective radius of the brake discs.
The rate of convective heating from the air on the brakes can be computed as follows:
where
- is the convective heating power;
- is the output of the kConvective lookup table;
- is the area of the disc brakes, which includes friction surface and side surface of the disc;
- is the air temperature;
- is the brake disc temperature.
This heat exchange mechanism is strongly affected by the brake blanking. Using the data acquired during the different track test sessions at several brake blanking configurations, it has been possible to correctly populate the lookup table. For what concerns the heat transfer due to the thermal radiation from the wheel, it is crucial to introduce, from the very beginning, the geometry factor c that is given by
In this formula, represents brake emissivity, is wheel area, is wheel emissivity, is the view factor from the wheel to the brake. Once geometry factor c is computed, the heat transfer rate is given by the following equation [18]:
where
- is the Boltzmann constant;
- is the wheel temperature.
Finally, the brake conductive heating can be evaluated, introducing the thermal conductivity between the brake and the wheel, , as presented in Equation (6):
The brake model used in this work (presented in paragraph Section 3) is based on the equations just described. However, the presented formulas contain coefficients and quantities that depend on the type of brake, materials, and geometries of the brake components. For this reason, a testing campaign was conducted, with some of our partners, on various brake systems, including different types of calipers (floating and fixed), and vented and non-vented discs to better understand the ways in which that could affect the variability of the parameters present in the various equation. In addition, the aim of the campaign was to analyze the thermal behavior of the brake system when subjected to different operating conditions and configurations.
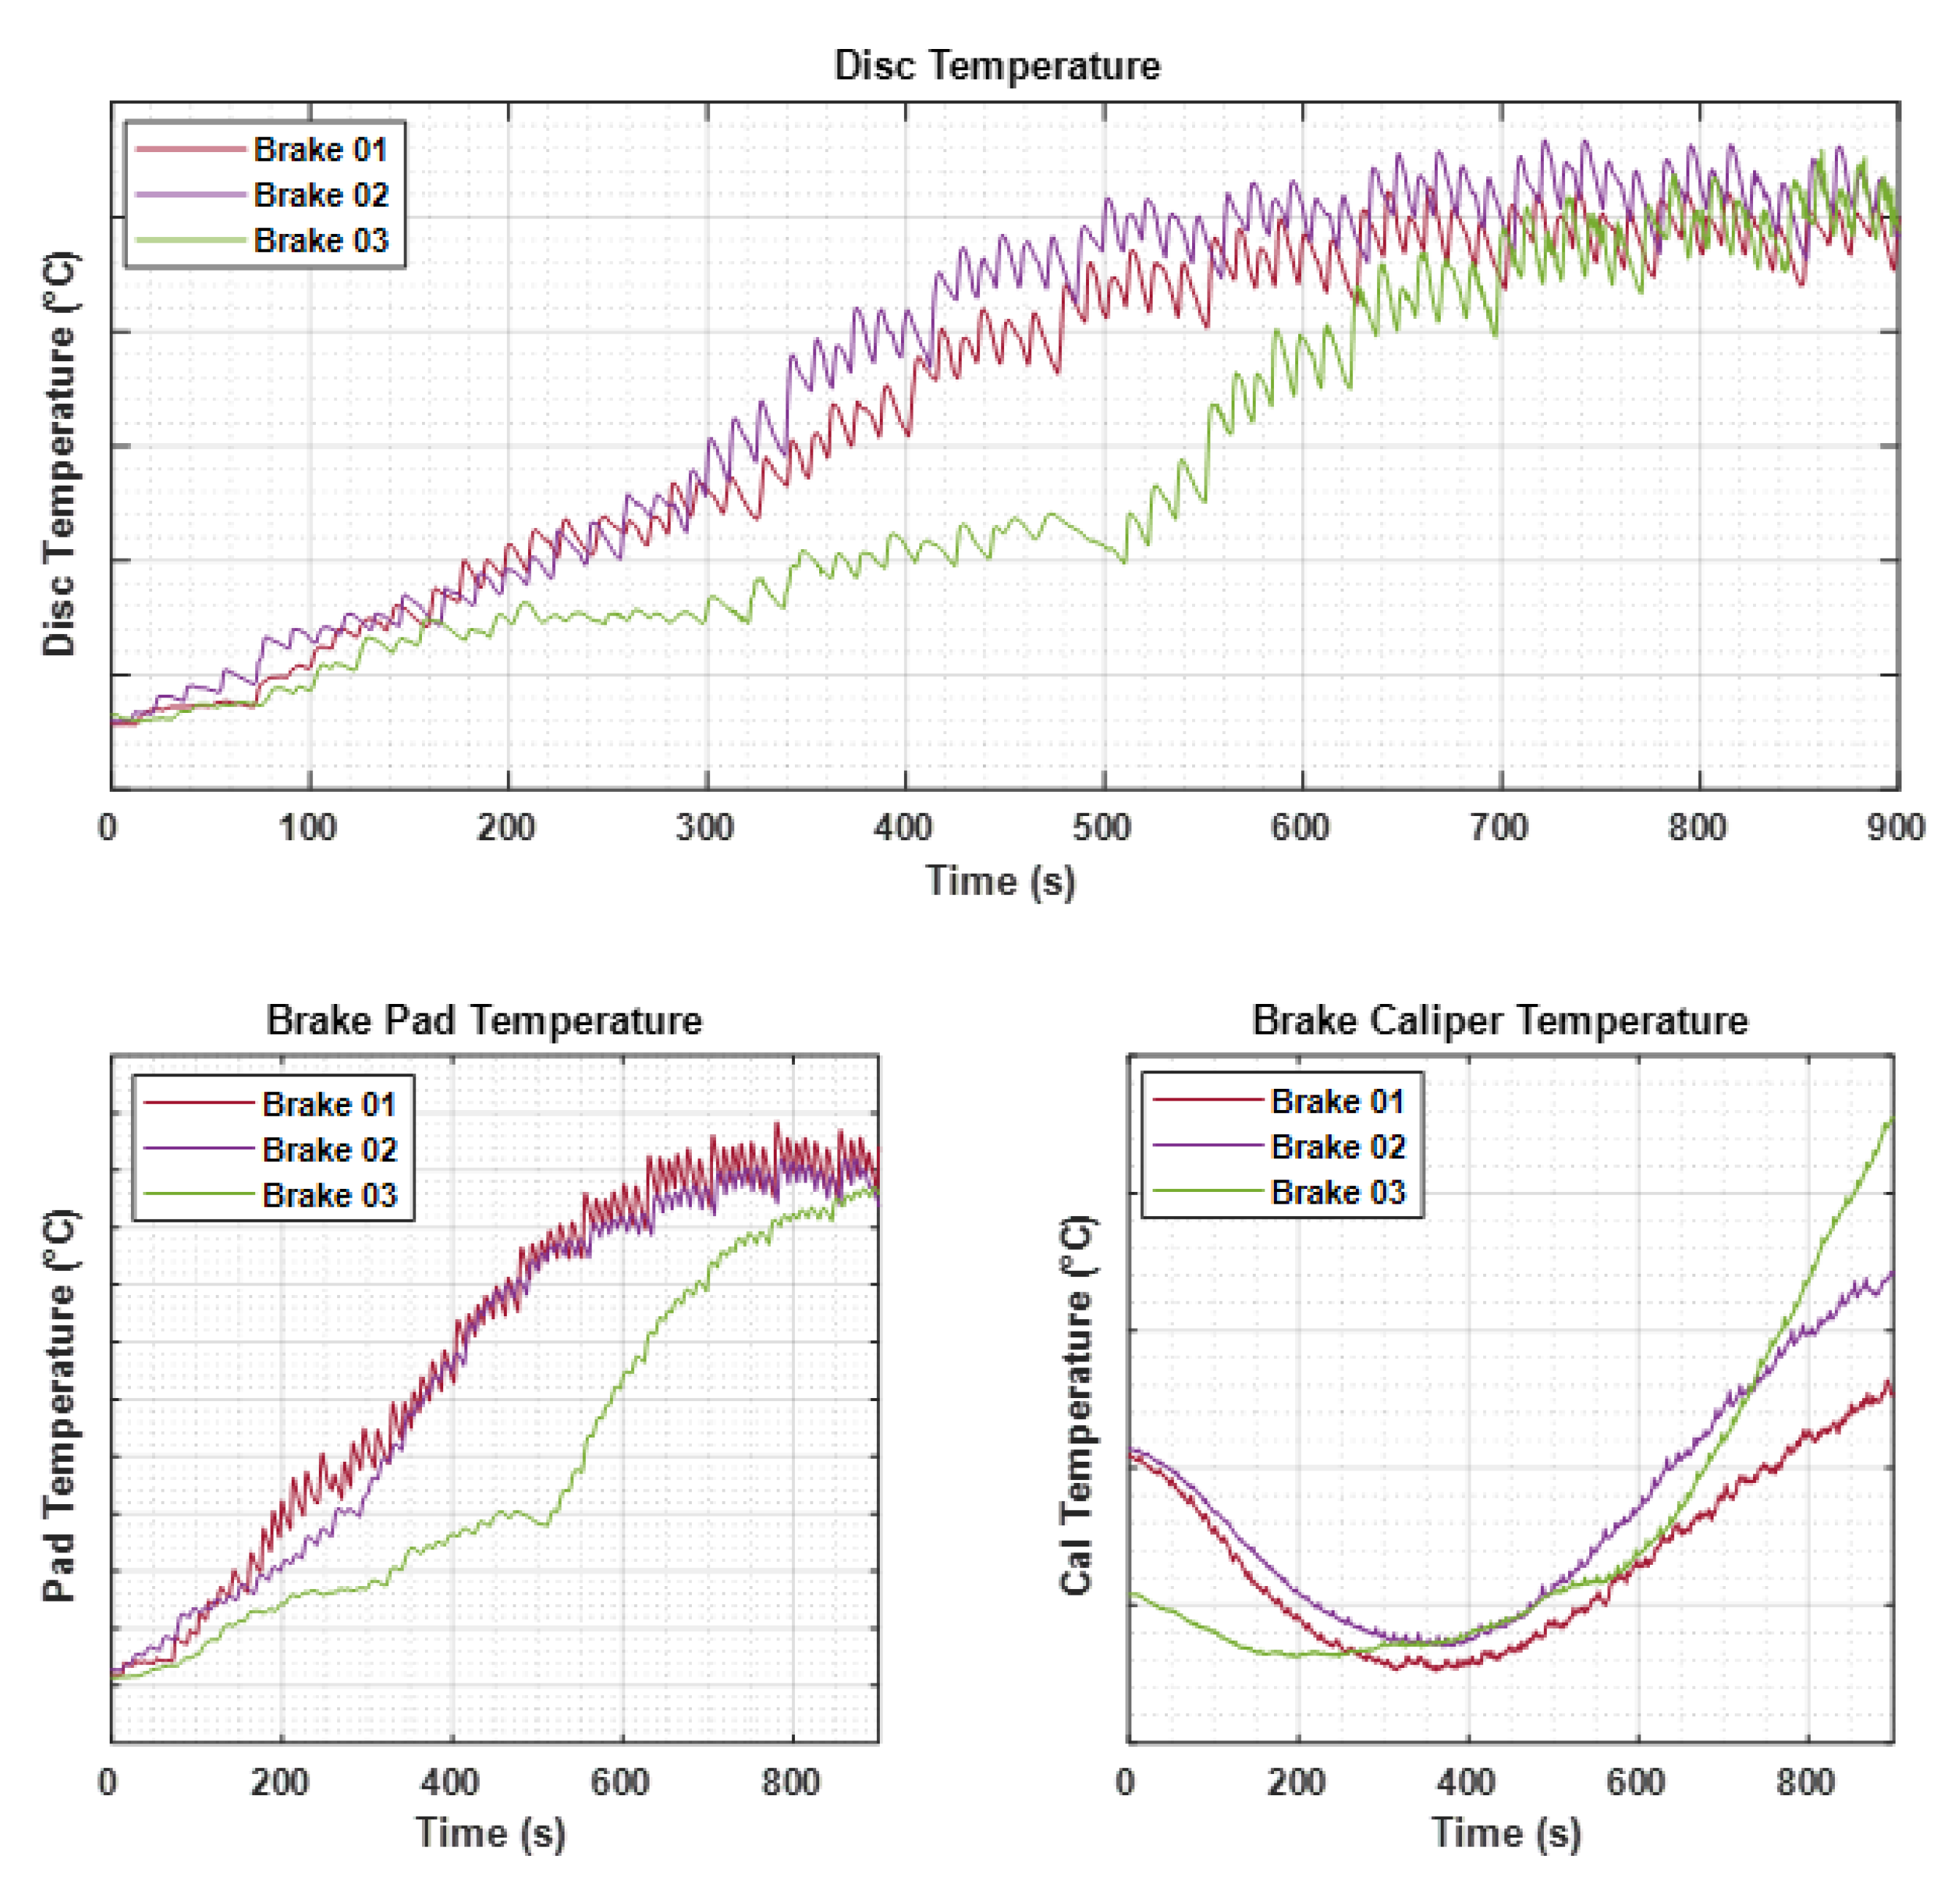
In Figure 4, the disc, brake pad, and caliber temperatures for three typologies of brake systems are shown.
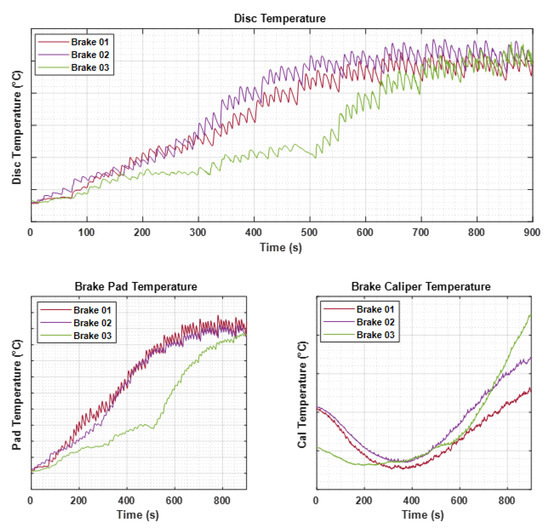
Figure 4.
Temperatures acquired for disc, brake pad and brake caliper.
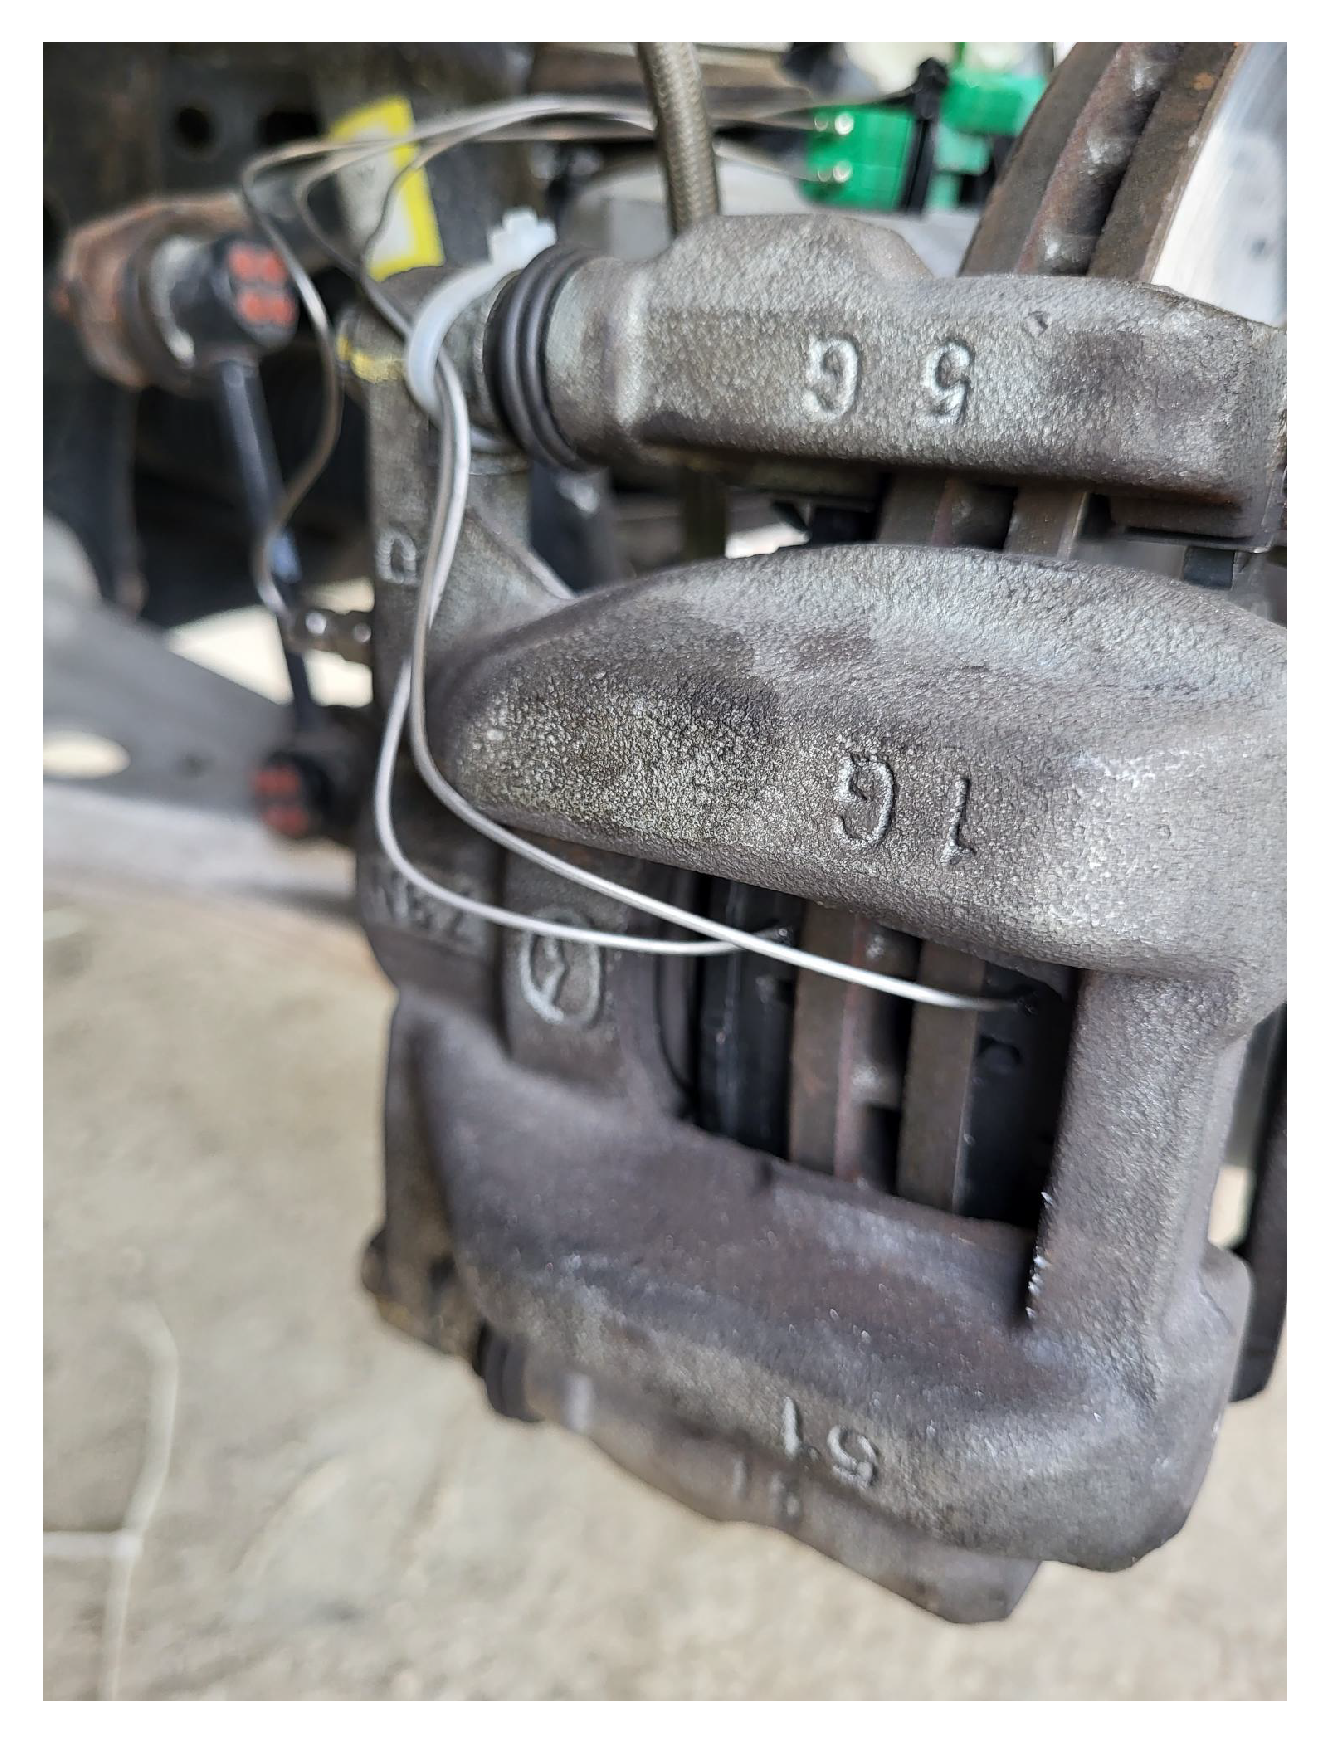
Furthermore, it was necessary to install surface-mounted thermocouples on the discs and into the brake pads through dedicated holes (Figure 5) to obtain the data.
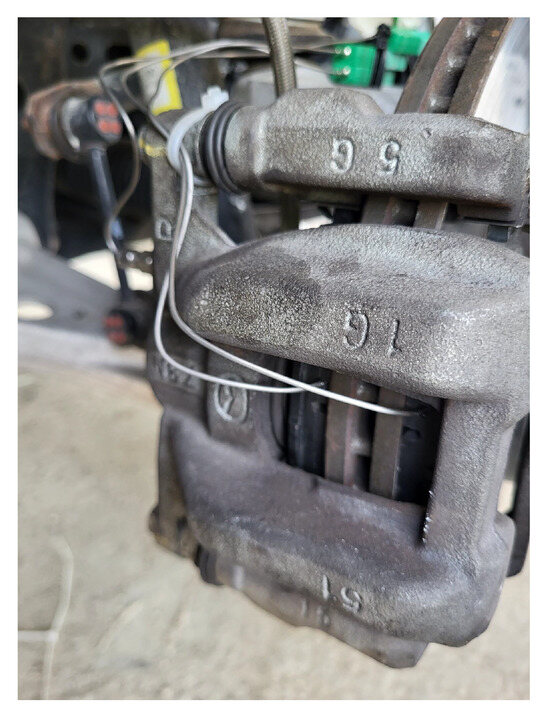
Figure 5.
Thermocouples installed to acquire temperatures of disc and brake pad.
The test scenarios encompass several variables, such as vehicle speeds, rotor designs, brake pad materials, and environmental conditions. The primary objective was to analyze the impact of these factors on brake temperature and to understand whether the implemented equations were suitable for all these different situations.
The tests revealed distinct temperature patterns and variations in gradients following modifications to the brake material. These findings can be useful for improving the model’s adaptability and practicality. While the primary objective was to enhance vehicle performance during high-performance racing scenarios, the adaptability of this model could also represent a useful tool for brake manufacturers seeking to gain comprehensive insights into the ways in which diverse brake configurations impact temperature dynamics. By elucidating the intricate interplay between various brake system components and their thermal behavior, this model could enable manufacturers to make informed decisions regarding the safety and quality of their brake systems.
Table 1 presents a summary of the maximum temperatures recorded across the three distinct braking systems employed in the outdoor testing sessions. The notable disparities in maximum temperatures among these various system configurations serve as compelling evidence of the model’s sensitivity to even subtle changes in setup. This underscores the model’s possible potential as a diagnostic instrument for brake system evaluation and design enhancement, offering manufacturers data to inform their engineering decisions and product development strategies.

Table 1.
Maximum temperatures reached by the braking systems.
4.2. Tire Thermal Model
Racing teams that are in competition strive to maximize the performance of their vehicles. The fundamental need to ensure drivability and secure excellent grip across a wide spectrum of riding conditions necessitates that vehicle tires function within an optimal temperature range [19,20]. This temperature window is essential for attaining the highest possible interaction force between the tire and the road surface, a parameter that profoundly influences the vehicle’s stability and handling characteristics [21]. However, accurately measuring and controlling the internal temperature of a tire presents a formidable challenge. Despite these difficulties, it remains abundantly clear that tire temperature profoundly impacts the performance and the handling on the track. To address this critical challenge, a physical–analytical model, known as thermoRIDE [22], can be used. This model has proven its mettle by faithfully replicating the thermal dynamics of tires across diverse operational conditions. Notably, it empowers us with a granular and comprehensive temperature distribution map within the tire’s inner rubber layers. The ability to predict the tire local temperature field and to link it to the grip of the tire is fundamental in terms of the vehicle handling improvement and of the asset optimization according to highly variable outdoor testing conditions. Due to the availability of the tire local temperature field, it is possible to obtain much more correlations from which optimal tire thermal windows can be identified. In addition, this model makes it possible to evaluate the inflation pressure trend and to understand the heat transfer mechanisms affecting the tire.
In greater detail, the thermoRIDE takes into account the physical mechanism of heat exchange and heat generation [18].
- Heat generation within the tire structure due to
- –
- tire/road tangential interaction, known as FP (Friction Power) that is related to the sliding velocity and the tangential force in the contact patch [23];
- –
- effect of tire cyclic deformation during the tire rolling, known as SEL (Strain Energy Loss) that depends on the wheel rotation frequency, the vertical force acting on the tire, the camber angle, and the inflation pressure.
- Heat exchange with the external environment due to
- –
- thermal conduction between the tire tread and the road pavement;
- –
- forced convection of the tread surface with the external air modeled by Newton’s law of cooling formulation;
- –
- natural/forced convection of the inner liner surface with the inner air modeled again referring to Newton’s law of cooling.
- Heat conduction between the tire layers due to the temperature gradient.
To find the right trade-off between result accuracy and computational burden, the model is based on the following assumptions:
- a road is schematized as a geometric plane without irregularities, isotropic and homogeneous in all its characteristics, expressed by its pavement temperature Tr and diffusivity characteristics and ;
- the tire system’s heat exchange with the external environment can be described by convective and conductive terms, with negligible radiation phenomena;
- quantities representing the tire/road interaction within the contact patch extension are considered global, expressed by average values of slip velocities and generalized force components;
- tire tread is modeled as slick, so without grooves, where inhomogeneities of thermodynamic and geometric characteristics concern only the radial direction;
- pressure is evaluated using the ideal gas formula starting from the internal air temperature;
- the humidity effect is not taken into account;
- rim and brake temperatures can be considered as inputs for the model.
Concerning the mathematical tire model, it is based on the use of the diffusion law of Fourier applied to a three-dimensional domain:
The tire is analyzed by considering its curvature and the presence of the shoulder and sidewall. The tire is made up of seven layers along the radial direction, including a compound layer (divided into three sub-layers), cushion, carcass, and inner liner. Along the lateral direction, the nodes are grouped into ribs (usually three for cars and up to fifteen for motorcycles) to consider the position of the contact patch due to steering and camber changes. To determine the temperatures of the different layers and the inner pressure, the thermoRIDE model requires proper telemetry that includes several channels used to calculate the heat exchanges. Table 2 lists the essential channels required for the model to function, with the signals listed with reference to the left front corner. Certain channels are essential for acquiring the accurate data needed in the investigation of forces and thermodynamics. For instance, the vehicle’s longitudinal velocity can also be estimated utilizing neural network methods, employing a collection of recorded data points associated with signals typically accessible within the vehicle. These signals encompass longitudinal and lateral acceleration, steering angle, yaw rate, and linear wheel speed [24].
Table 2.
ThermoRIDE Model Inputs.
5. Experimental Tests
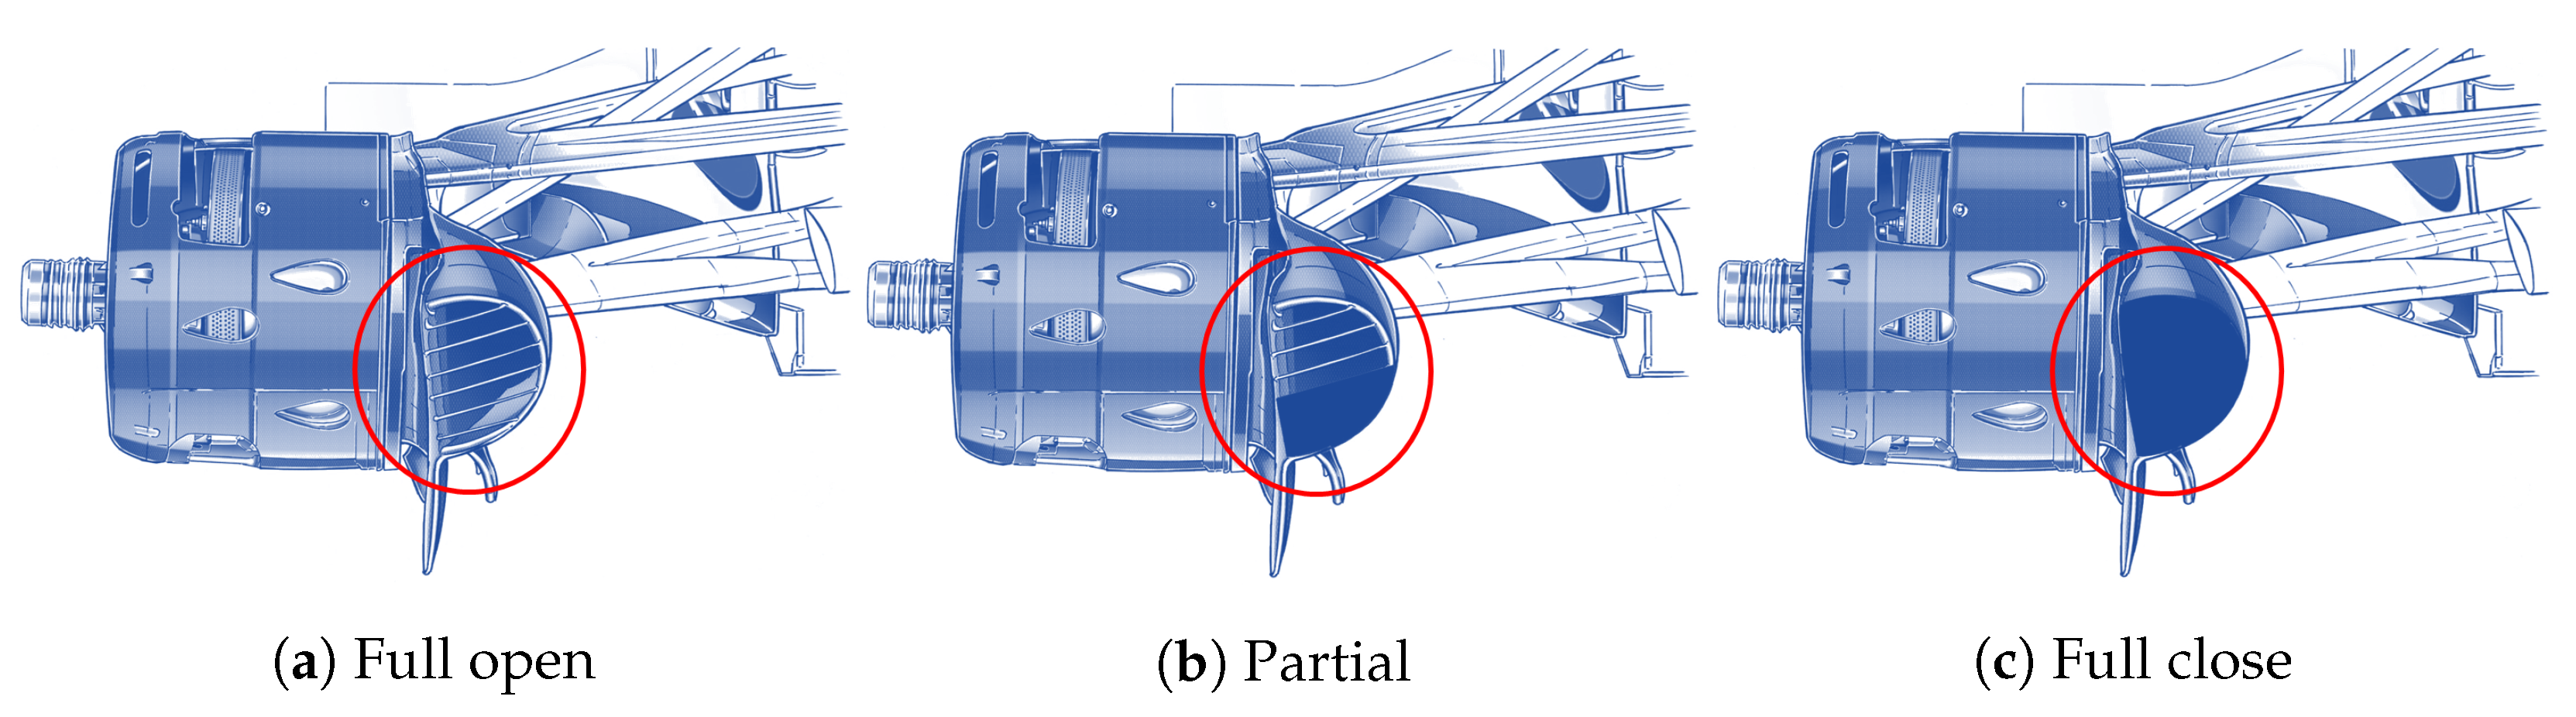
In order to calibrate both the brake model and the thermal model together, a systematic run plan was implemented. The primary objective of this plan was to explore a broad spectrum of disc temperatures across various operational conditions. This approach was undertaken to ensure a calibration to align the inner liner and inner air temperatures within our models and the real-world temperatures as recorded by sensors during all phases of operation. In Figure 6, it is possible to see an example of the way in which the blanking was performed. The air flow was partialized horizontally from the bottom up to completely cover the air flow. Figure 6a presents the case with no inlet blanking, so all the air flow entering in the duct is directed towards the disc in order to cool it. Figure 6b shows the way in which the duct is partialized, through insulating adhesive tape; the portion of the area of the duct in contact with air is reduced. Finally, in Figure 6c, it is possible to see the extreme case of full close inlet blanking; in this case, there is no air flow entering in the duct.
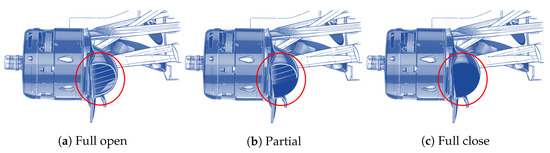
Figure 6.
Examples of the ways in which the air flow is partialized.
To achieve this calibration, a series of test runs were executed, each designed to cover a specific range of operational parameters and scenarios. These runs encompassed a diverse set of conditions, including variations in braking intensity, speed, and environmental factors. The goal was to capture the thermal responses exhibited by the braking system under the following circumstances:
- Run 1: Full closed brake inlet;
- Run 2: Inlet partially closed;
- Run 3: Inlet partially closed (a smaller tape for inlet blanking was used than the one used in Run 2);
- Run 4: No inlet blanking (full open inlet).
Through this comprehensive array of runs, it was possible to gather an extensive dataset of temperature measurements, which served as the reference benchmarks for our simulations. The key focus was on achieving a high degree of concurrence between our modeled predictions and the empirical data acquired from the sensors.
For all the listed runs, the following test procedure was followed:
- The first two laps of each run were considered warm-up laps to bring the tires up to temperature.
- Two laps had the brake balance at 60%, in which the driver ran the main straights of the circuit at a constant speed of 90 kph.
- One lap had the brake balance at 60%, in which the driver ran the main straights of the circuit at a constant speed of 130 kph.
- One lap had the brake balance at 65%, in which the driver ran the main straights of the circuit at a constant speed of 130 kph.
- One lap had the brake balance at 55%, in which the driver ran the main straights of the circuit at a constant speed of 130 kph.
- Two laps had the brake balance at 60%, in which the driver ran the main straights of the circuit at a constant speed of 170 kph.
6. Simulation Results and Validation
To calibrate the brake model to predict blanking and work together on the tire thermal model, simulations were conducted to compare some of interest parameters. These parameters include:
- The pressure of the air inside the wheel;
- The temperature profiles of the inner air inside the wheel;
- The temperature of the inner liner, i.e., the innermost side of pneumatic rubber layers in direct contact with the air inside the tire;
- The temperature of the disc.
In regard to the value of pressure and temperature for the inner air, they were measured with the TPMS sensor. This sensor was installed on the side of the rim and contained the flywheel to effect the inflation of the tire (Figure 7).
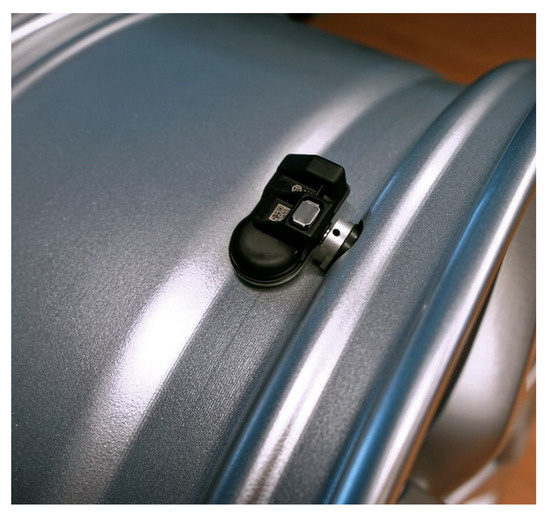
Figure 7.
TPMS sensor.
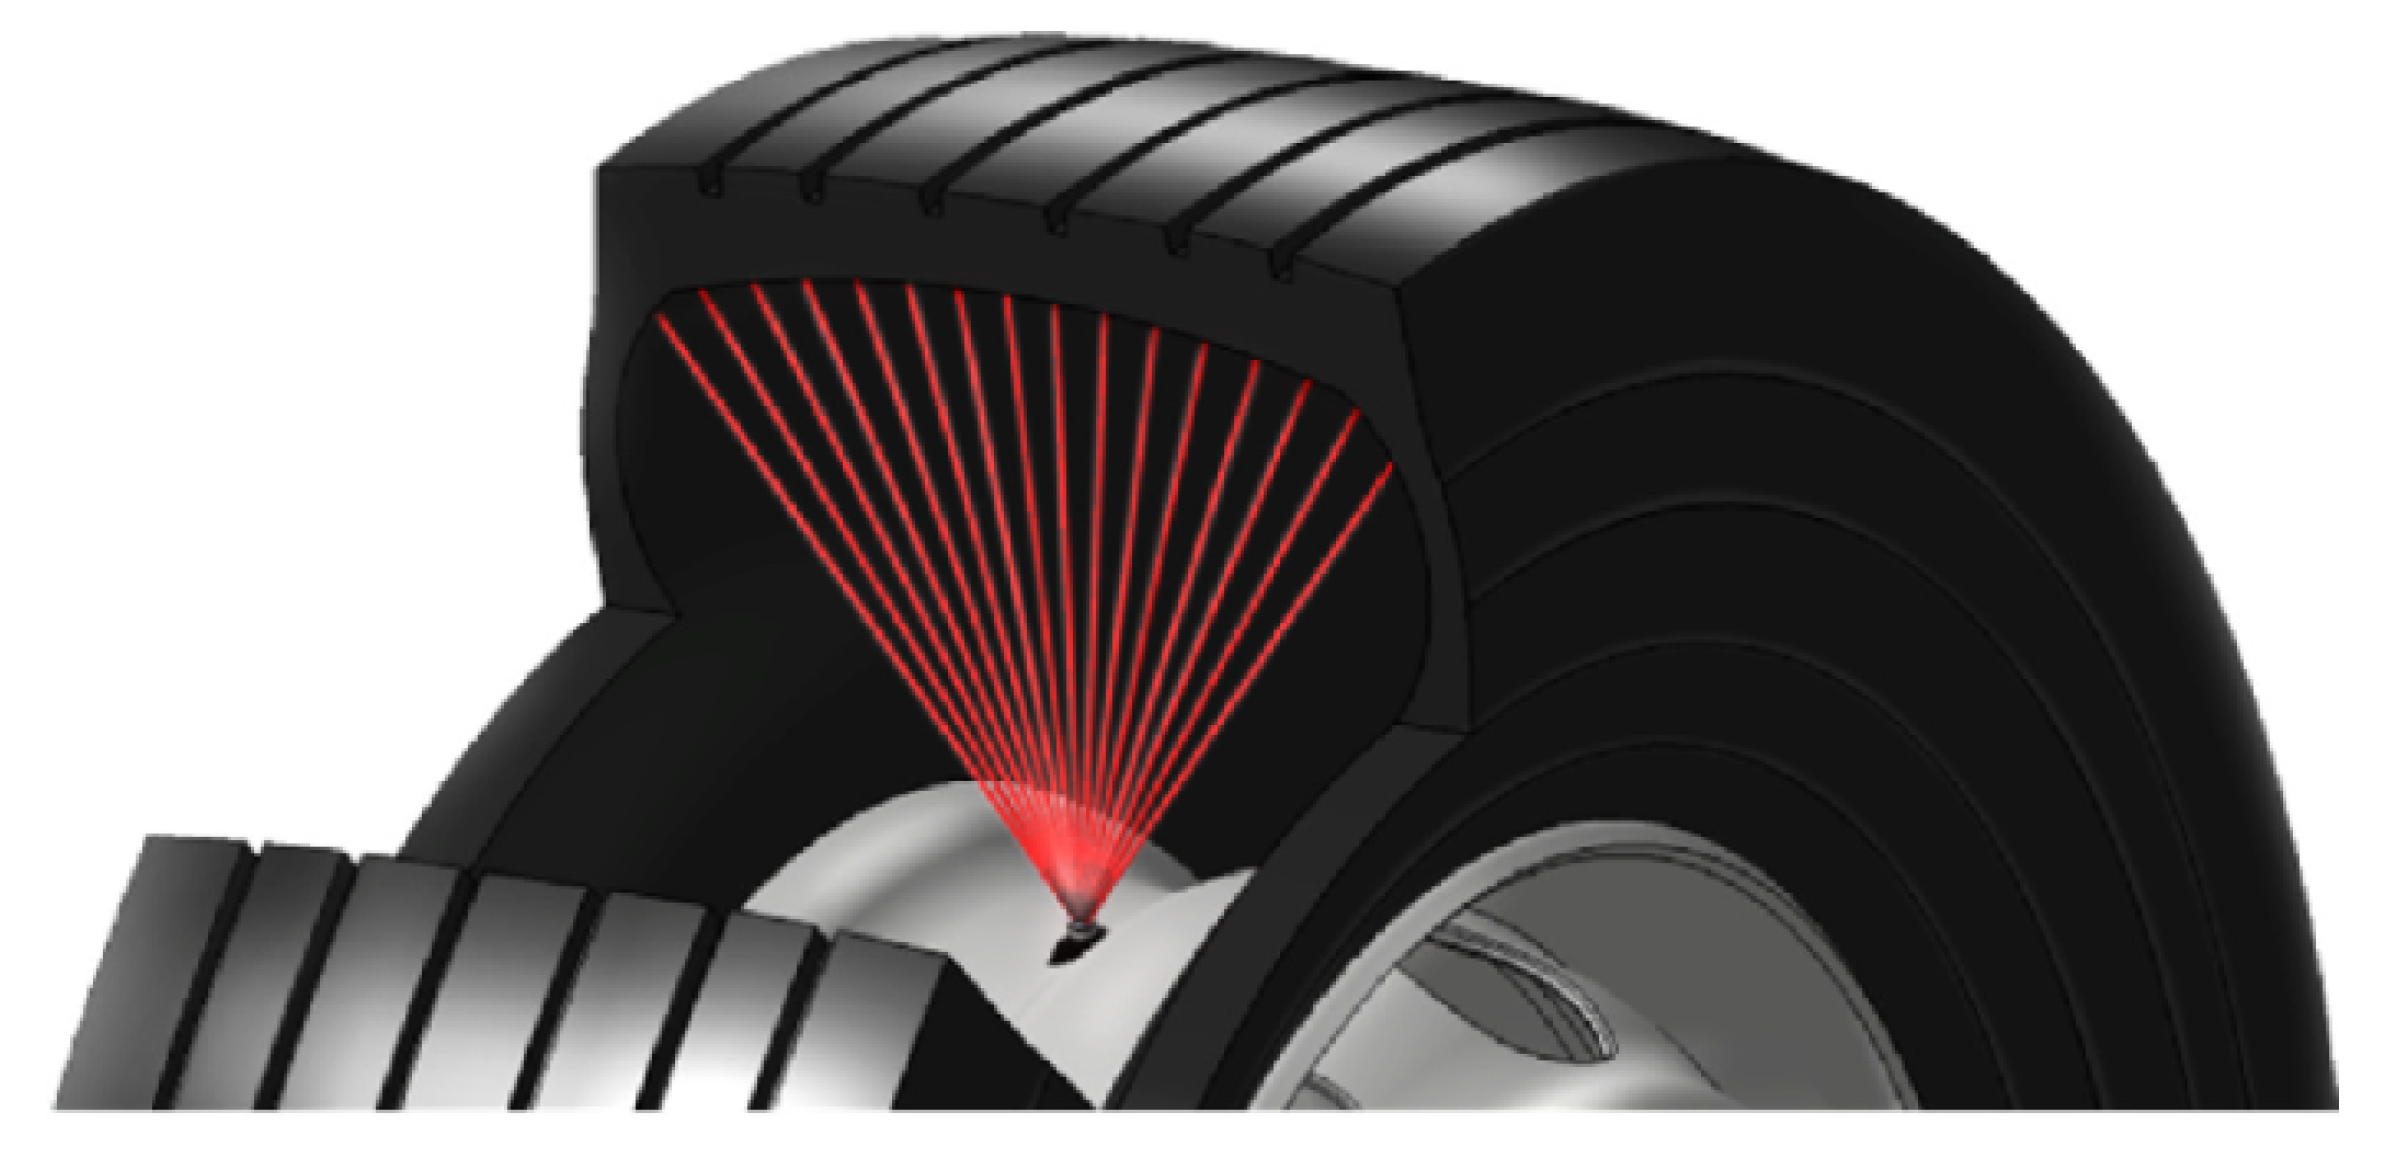
For the measurement of the internal temperature of the coating, an IR sensor that measures various ribs of the inner liner can be used, as can be seen in the Figure 8. This remote monitoring tool offers real-time, multi-point data collection.
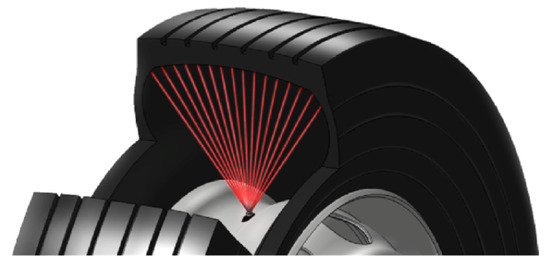
Figure 8.
IR sensor.
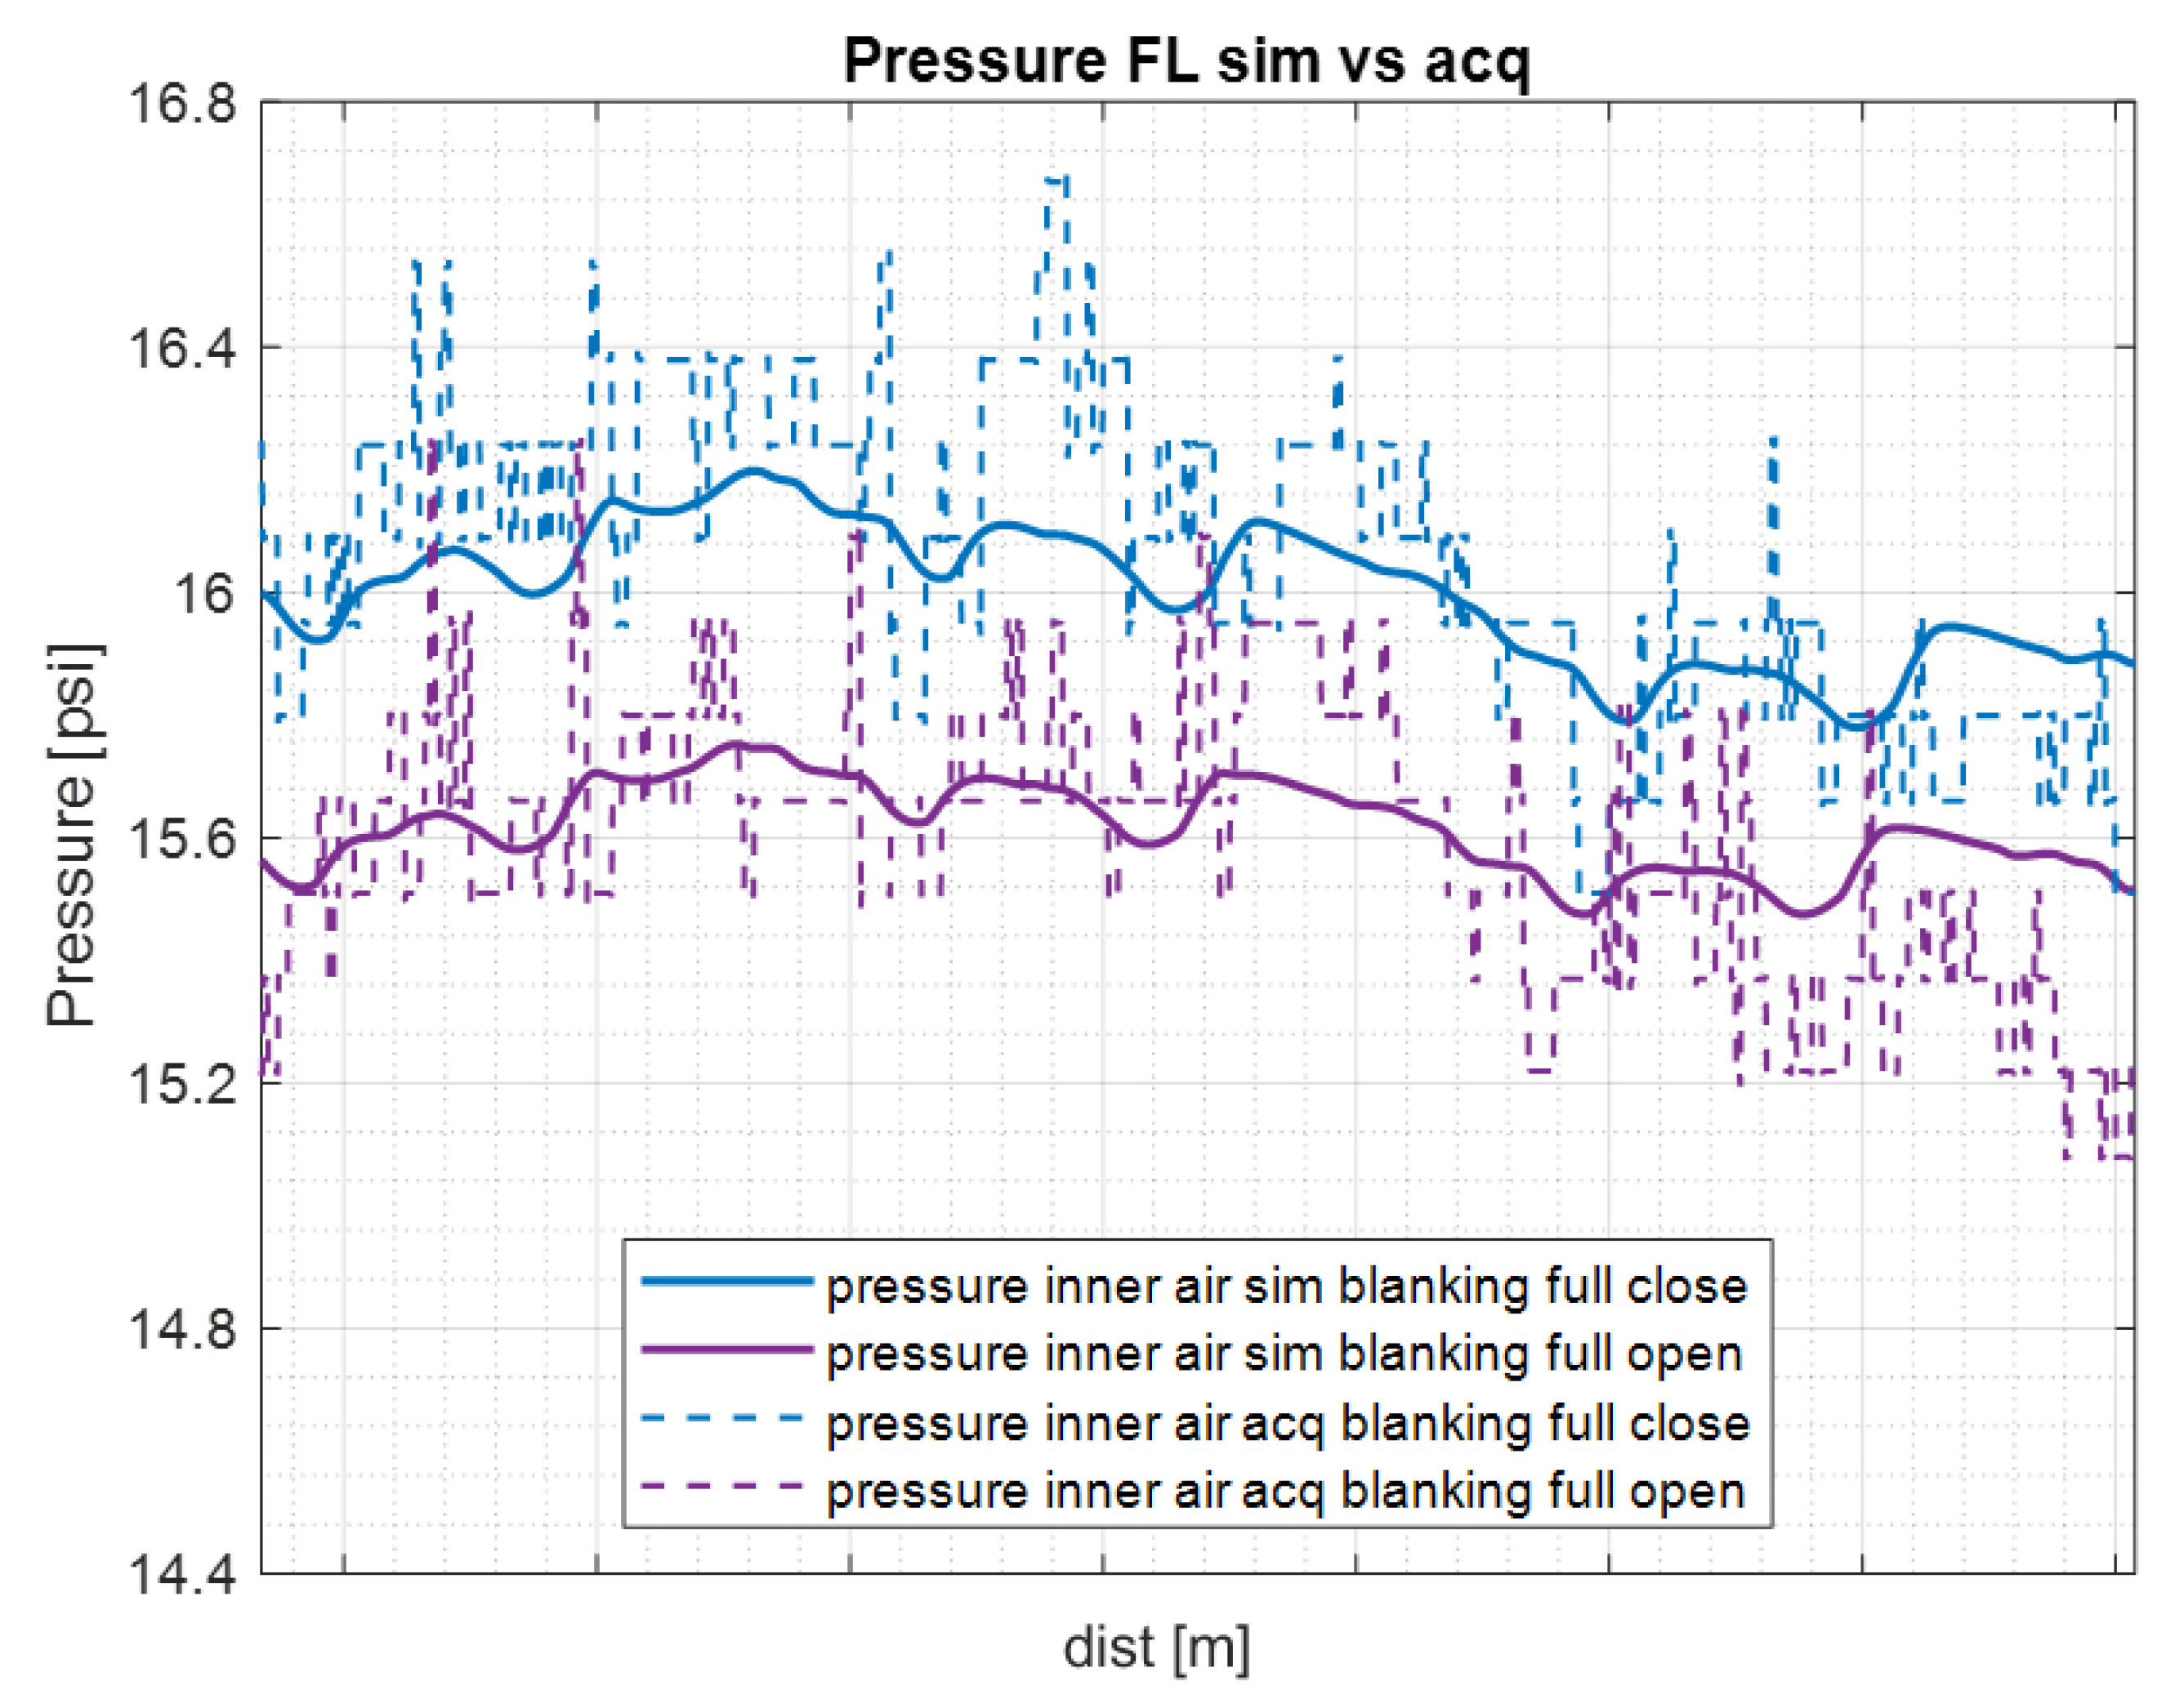
The analysis reported here was performed for a straight section of the circuit where the driver proceeded at a constant speed of 130 km/h. Figure 9 presents the results of the simulated pressure of the inner air (solid lines) compared to the acquisition values (dashed lines) for the two extreme cases: full open blanking (blue line) and full close blanking (purple line). It is evident that the pressure varied significantly between these two cases, indicating the influence of the blanking position on the airflow within the system. The initial conditions were the same, and it can be seen that the run with full close blanking had higher pressure values than in the case of fully open blanking. The reason for this may lie in the fact that with a 100% blanking, it happens that the brake discs are more difficult to cool down, leading to higher temperatures. Radiation and convection heat the rim which is in direct contact with the air inside the tire, which increases the temperature and therefore also increases pressure. The simulation results obtained for both cases demonstrate that the used model tried to follow the progress of the experimentally acquired model. Obviously, the experimental model introduces quite high frequencies of update, while the simulated one has a more smooth course.
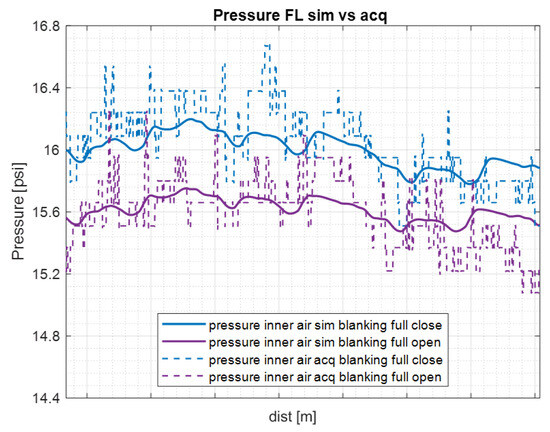
Figure 9.
Comparison between simulated and acquired pressure for the two extreme blanking levels.
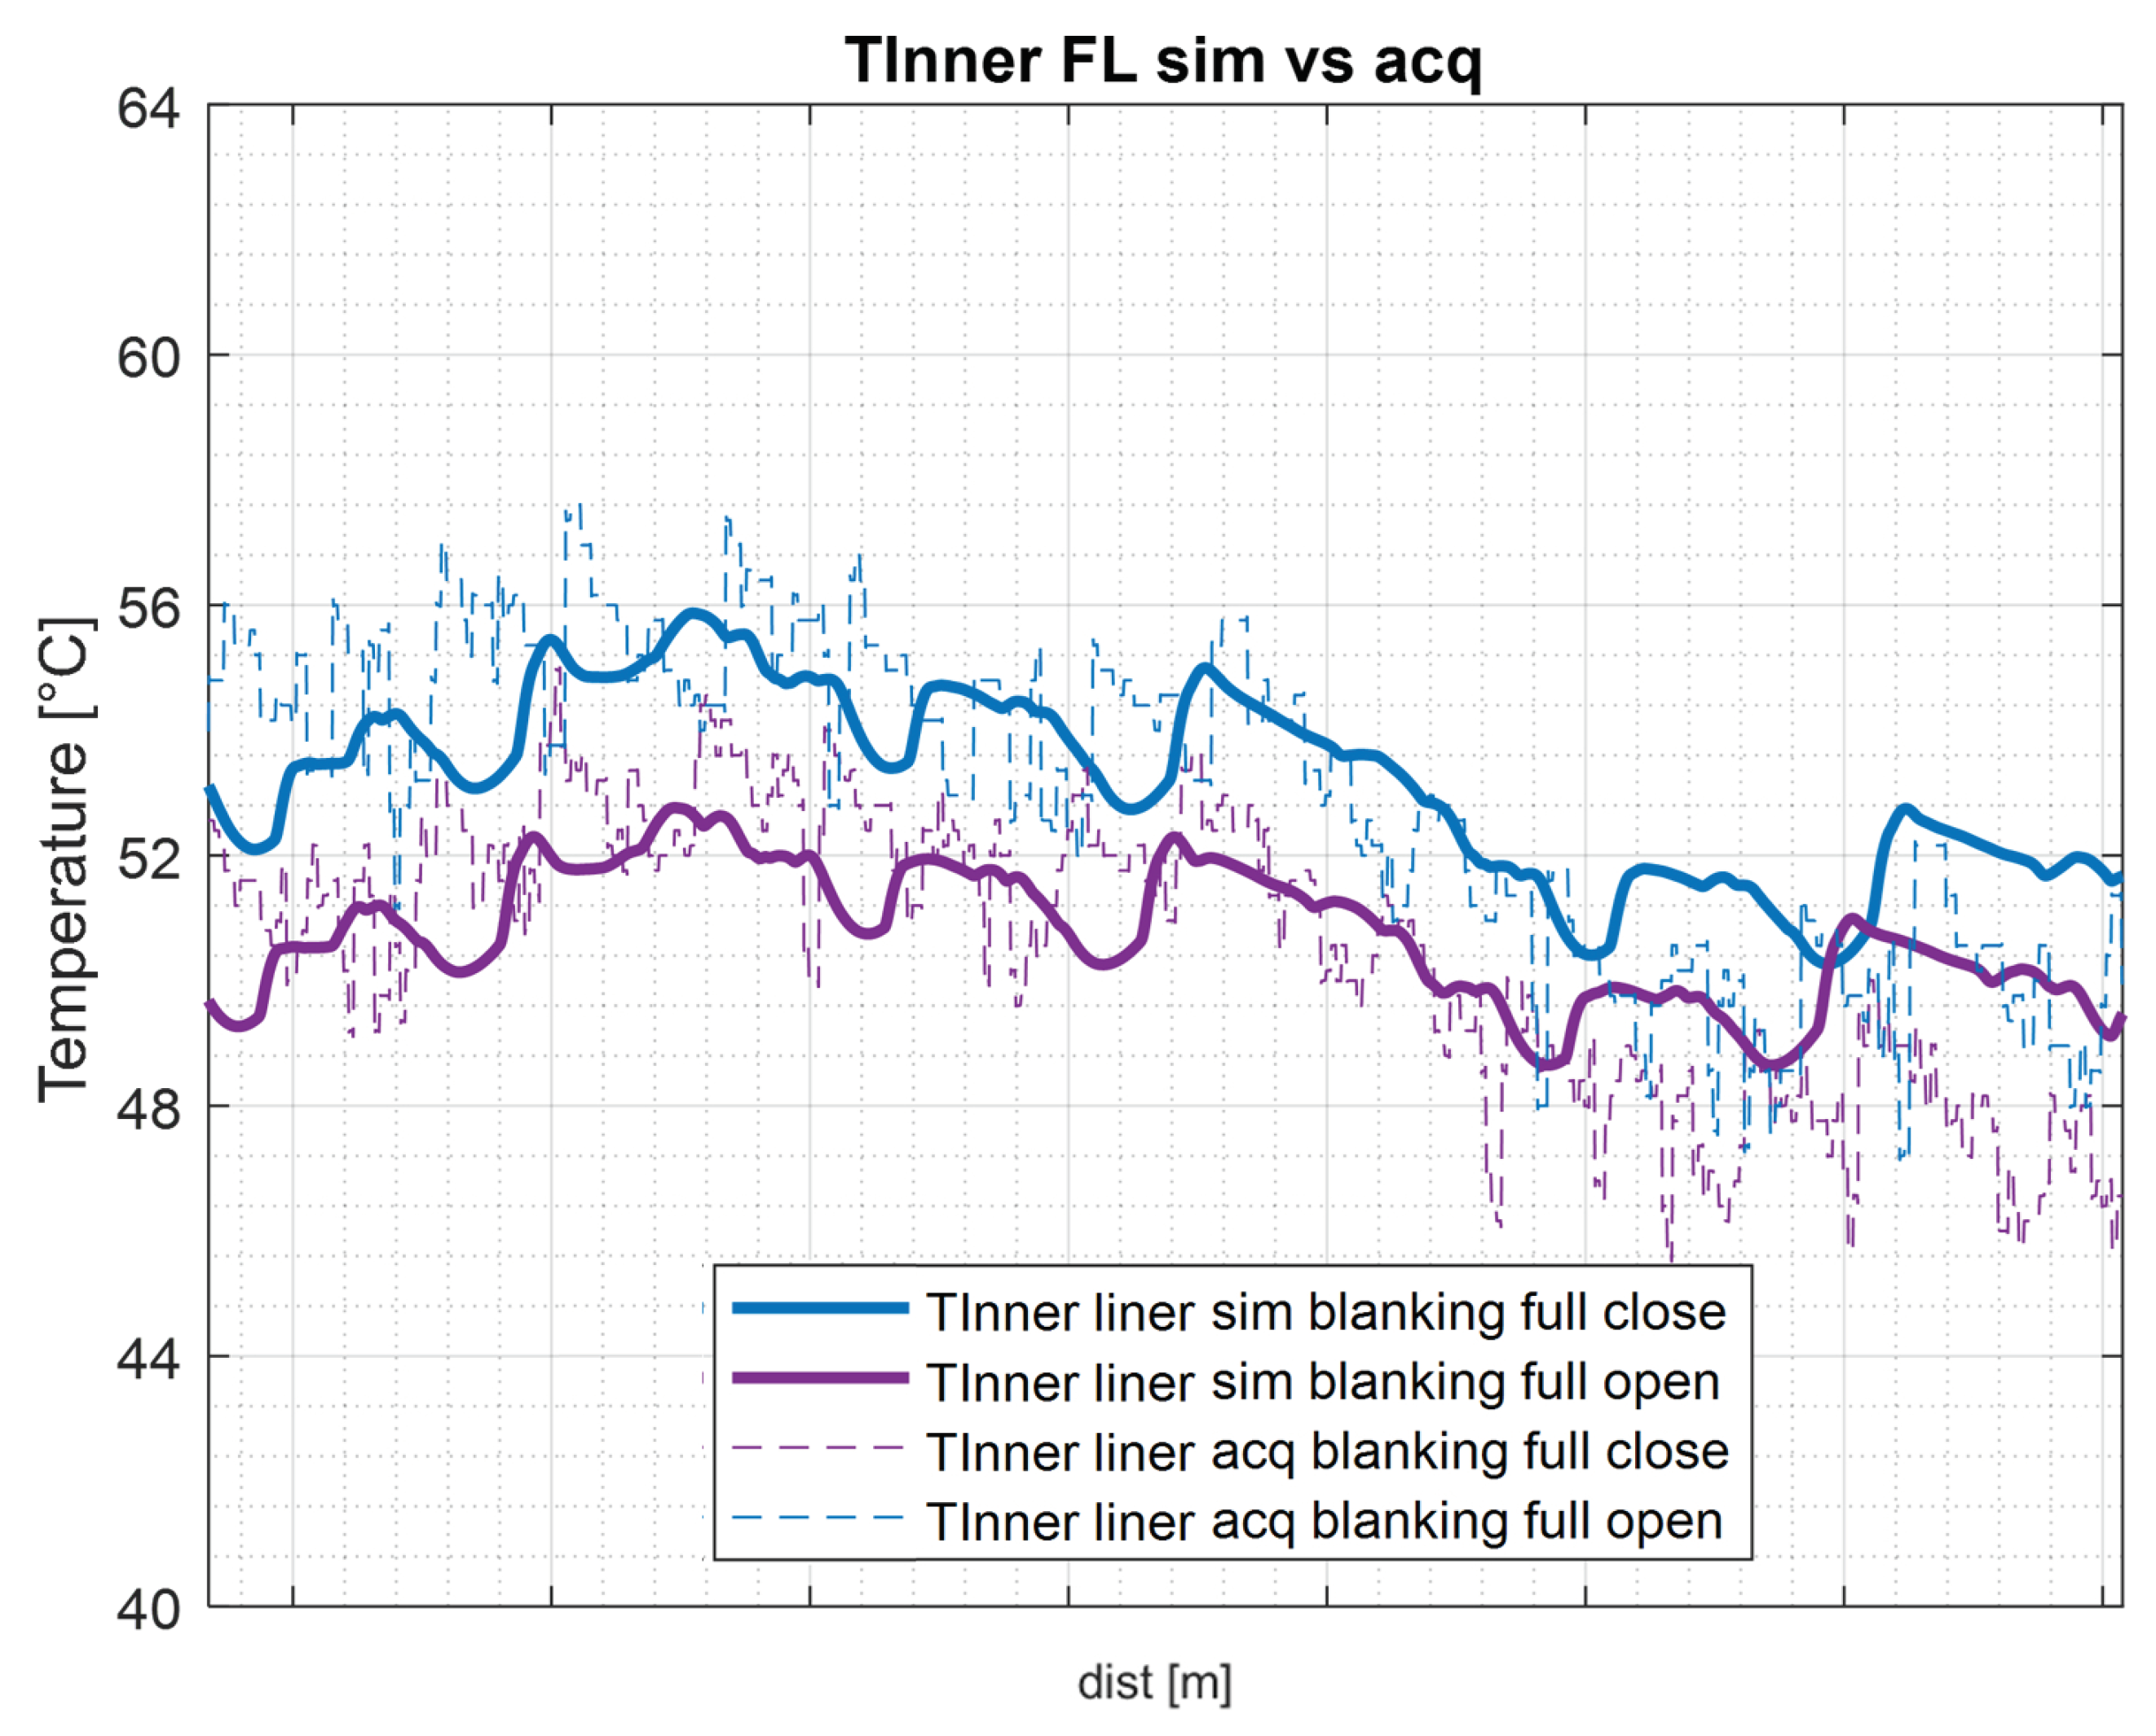
Similarly, Figure 10 illustrates the simulation results for the inner liner temperature, showcasing pronounced variations between the full open and full closed blanking scenarios. In this case, almost at the end of the straight line, before the braking phase, the simulated and the acquired models tend to diverge. This seems to be due to the fact that at high speeds, the phenomena of fluid flows is not yet well analyzed by the model that is in a first phase of development. However, it is a fairly promising first basis from which to develop and interpret well all the phenomena.
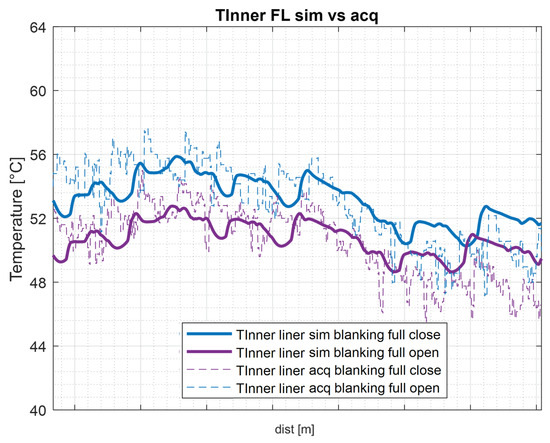
Figure 10.
Comparison between the temperatures of the inner liner simulated and the acquired models for the two extreme blanking levels.
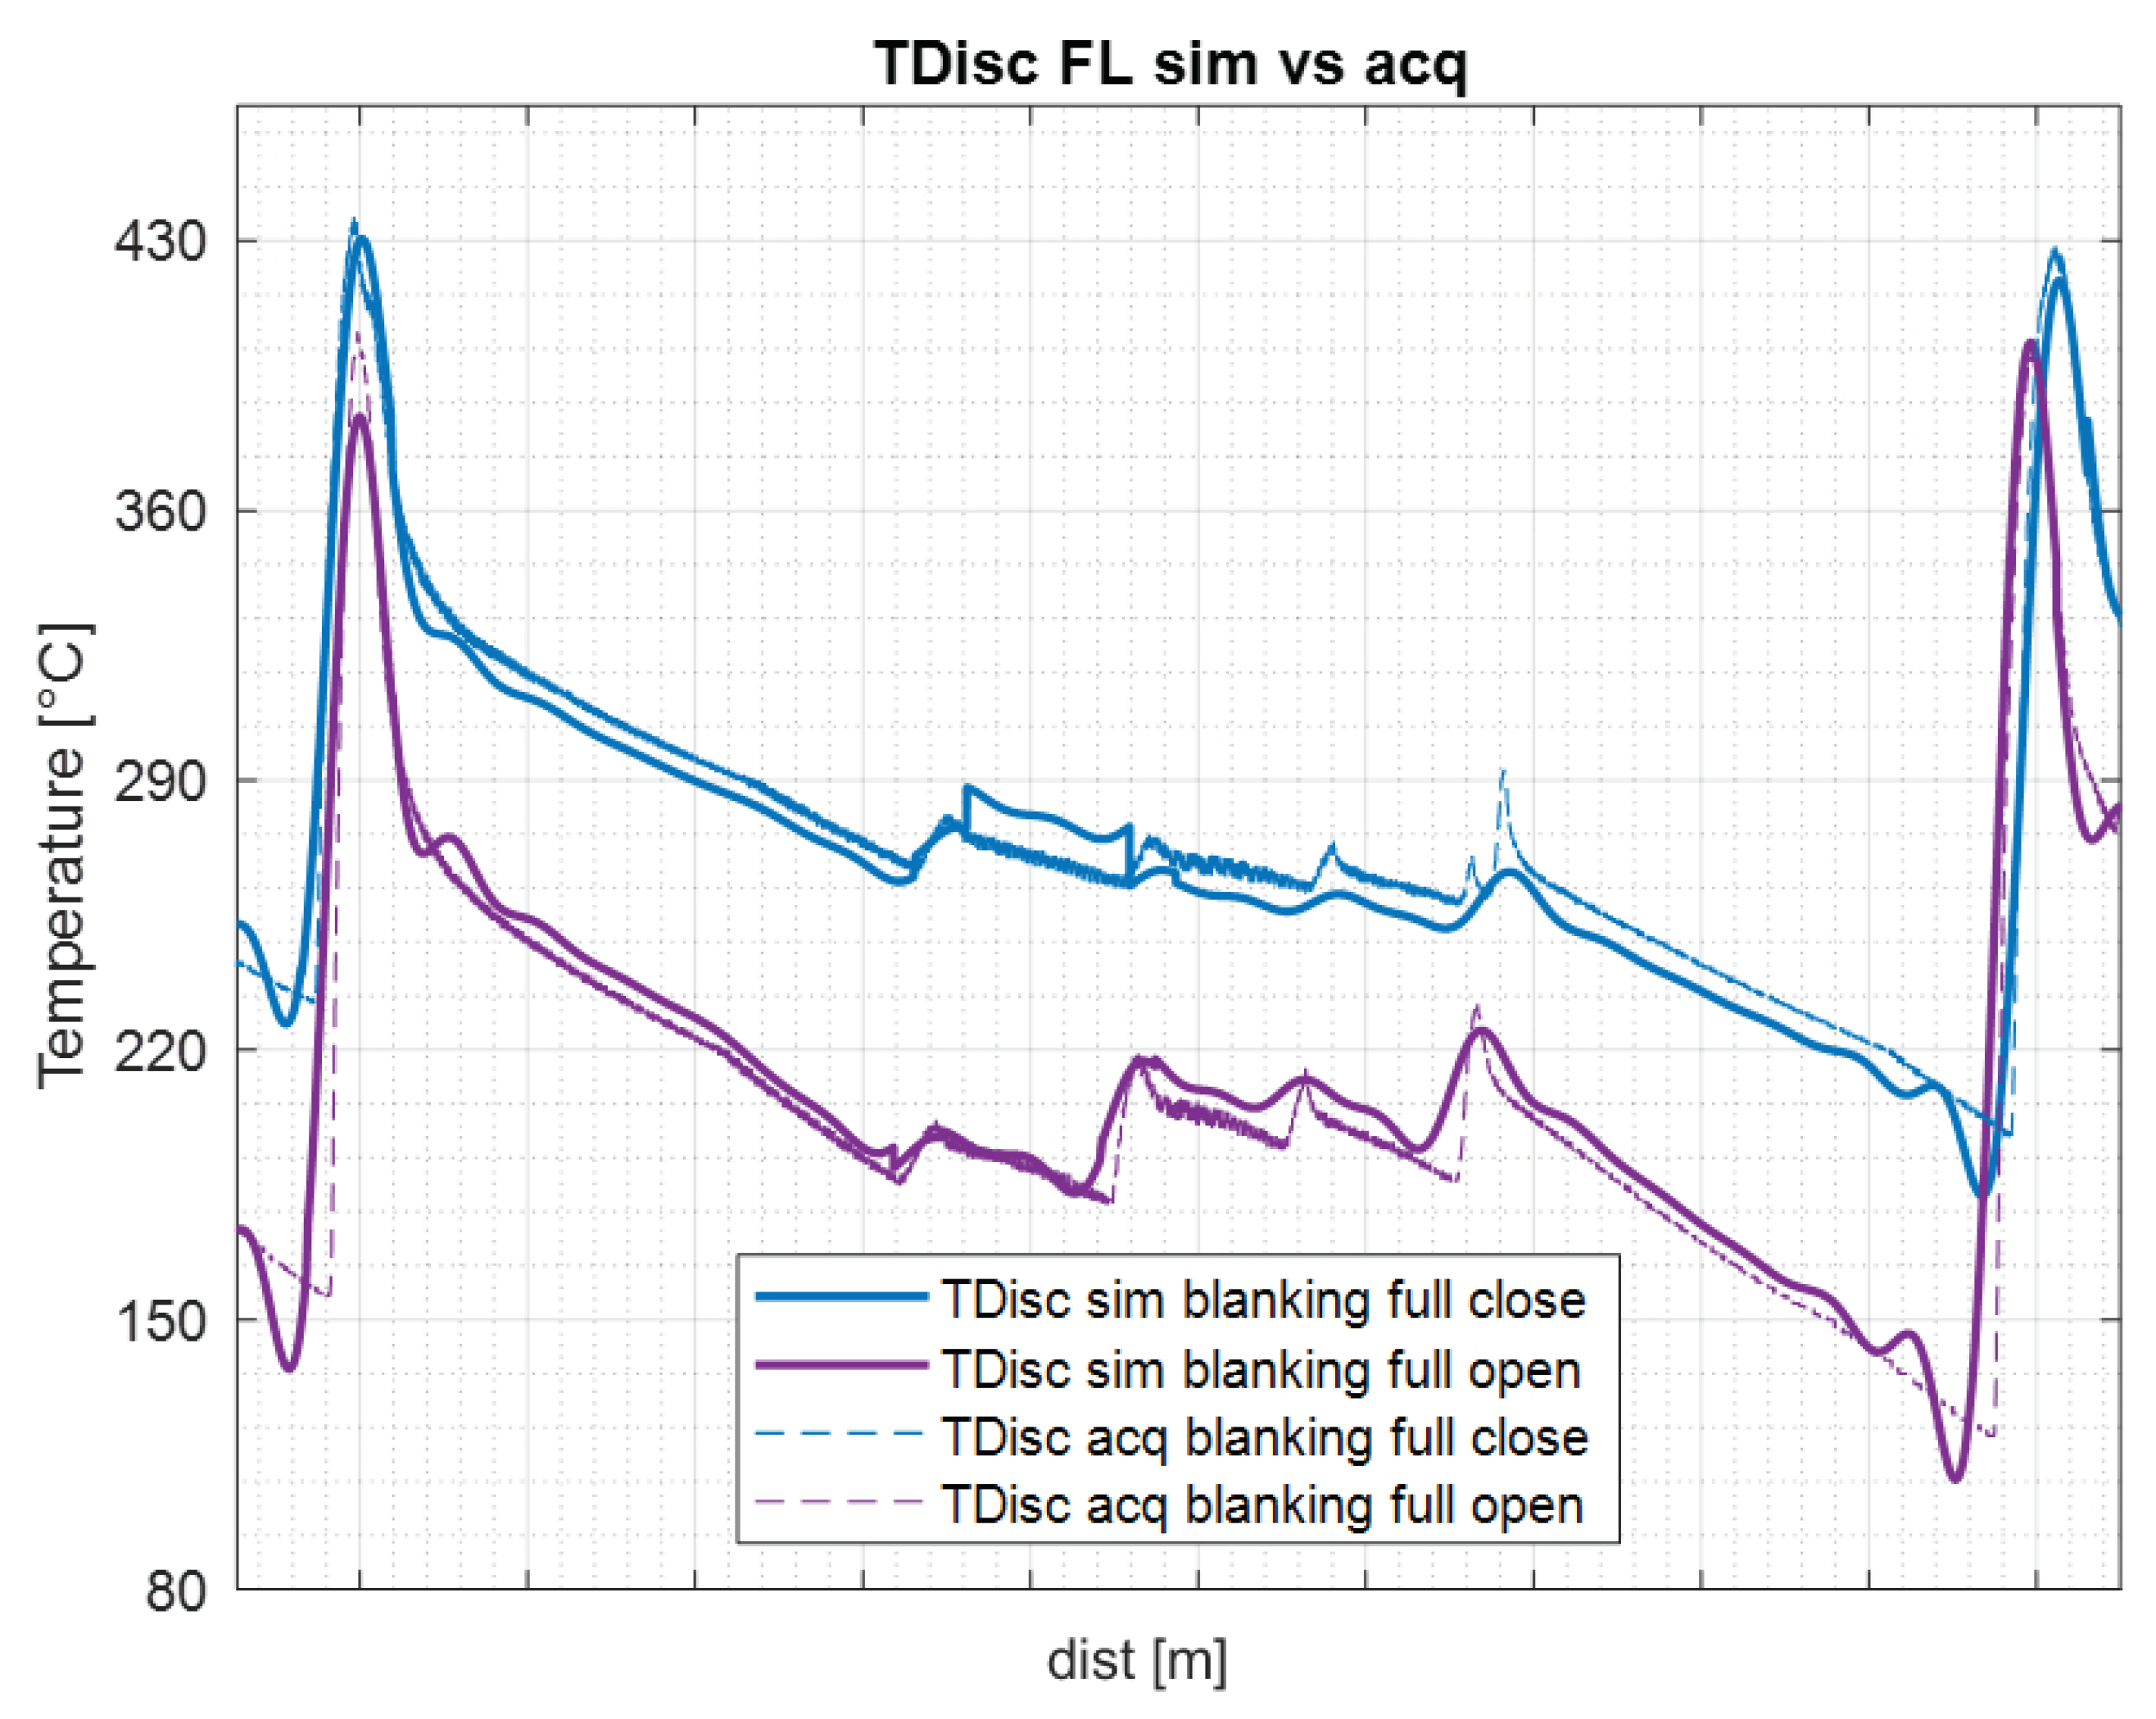
Additionally, Figure 11 demonstrates the simulated temperature of the FL disc for both blanking configurations, further highlighting the substantial influence that blanking exerts on the thermal behavior of the components. Through the thermal model of the brake disc used, it is quite possible to follow the trend of the thermal evolution of the disc. The thermal level increases and decreases due to braking and acceleration.
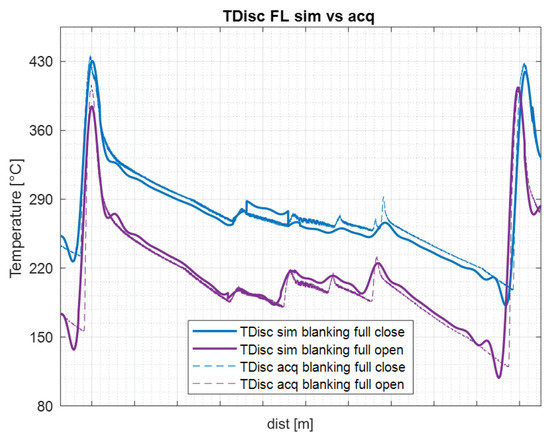
Figure 11.
Comparison between the temperatures of simulated and acquired discs for the two extreme blanking levels.
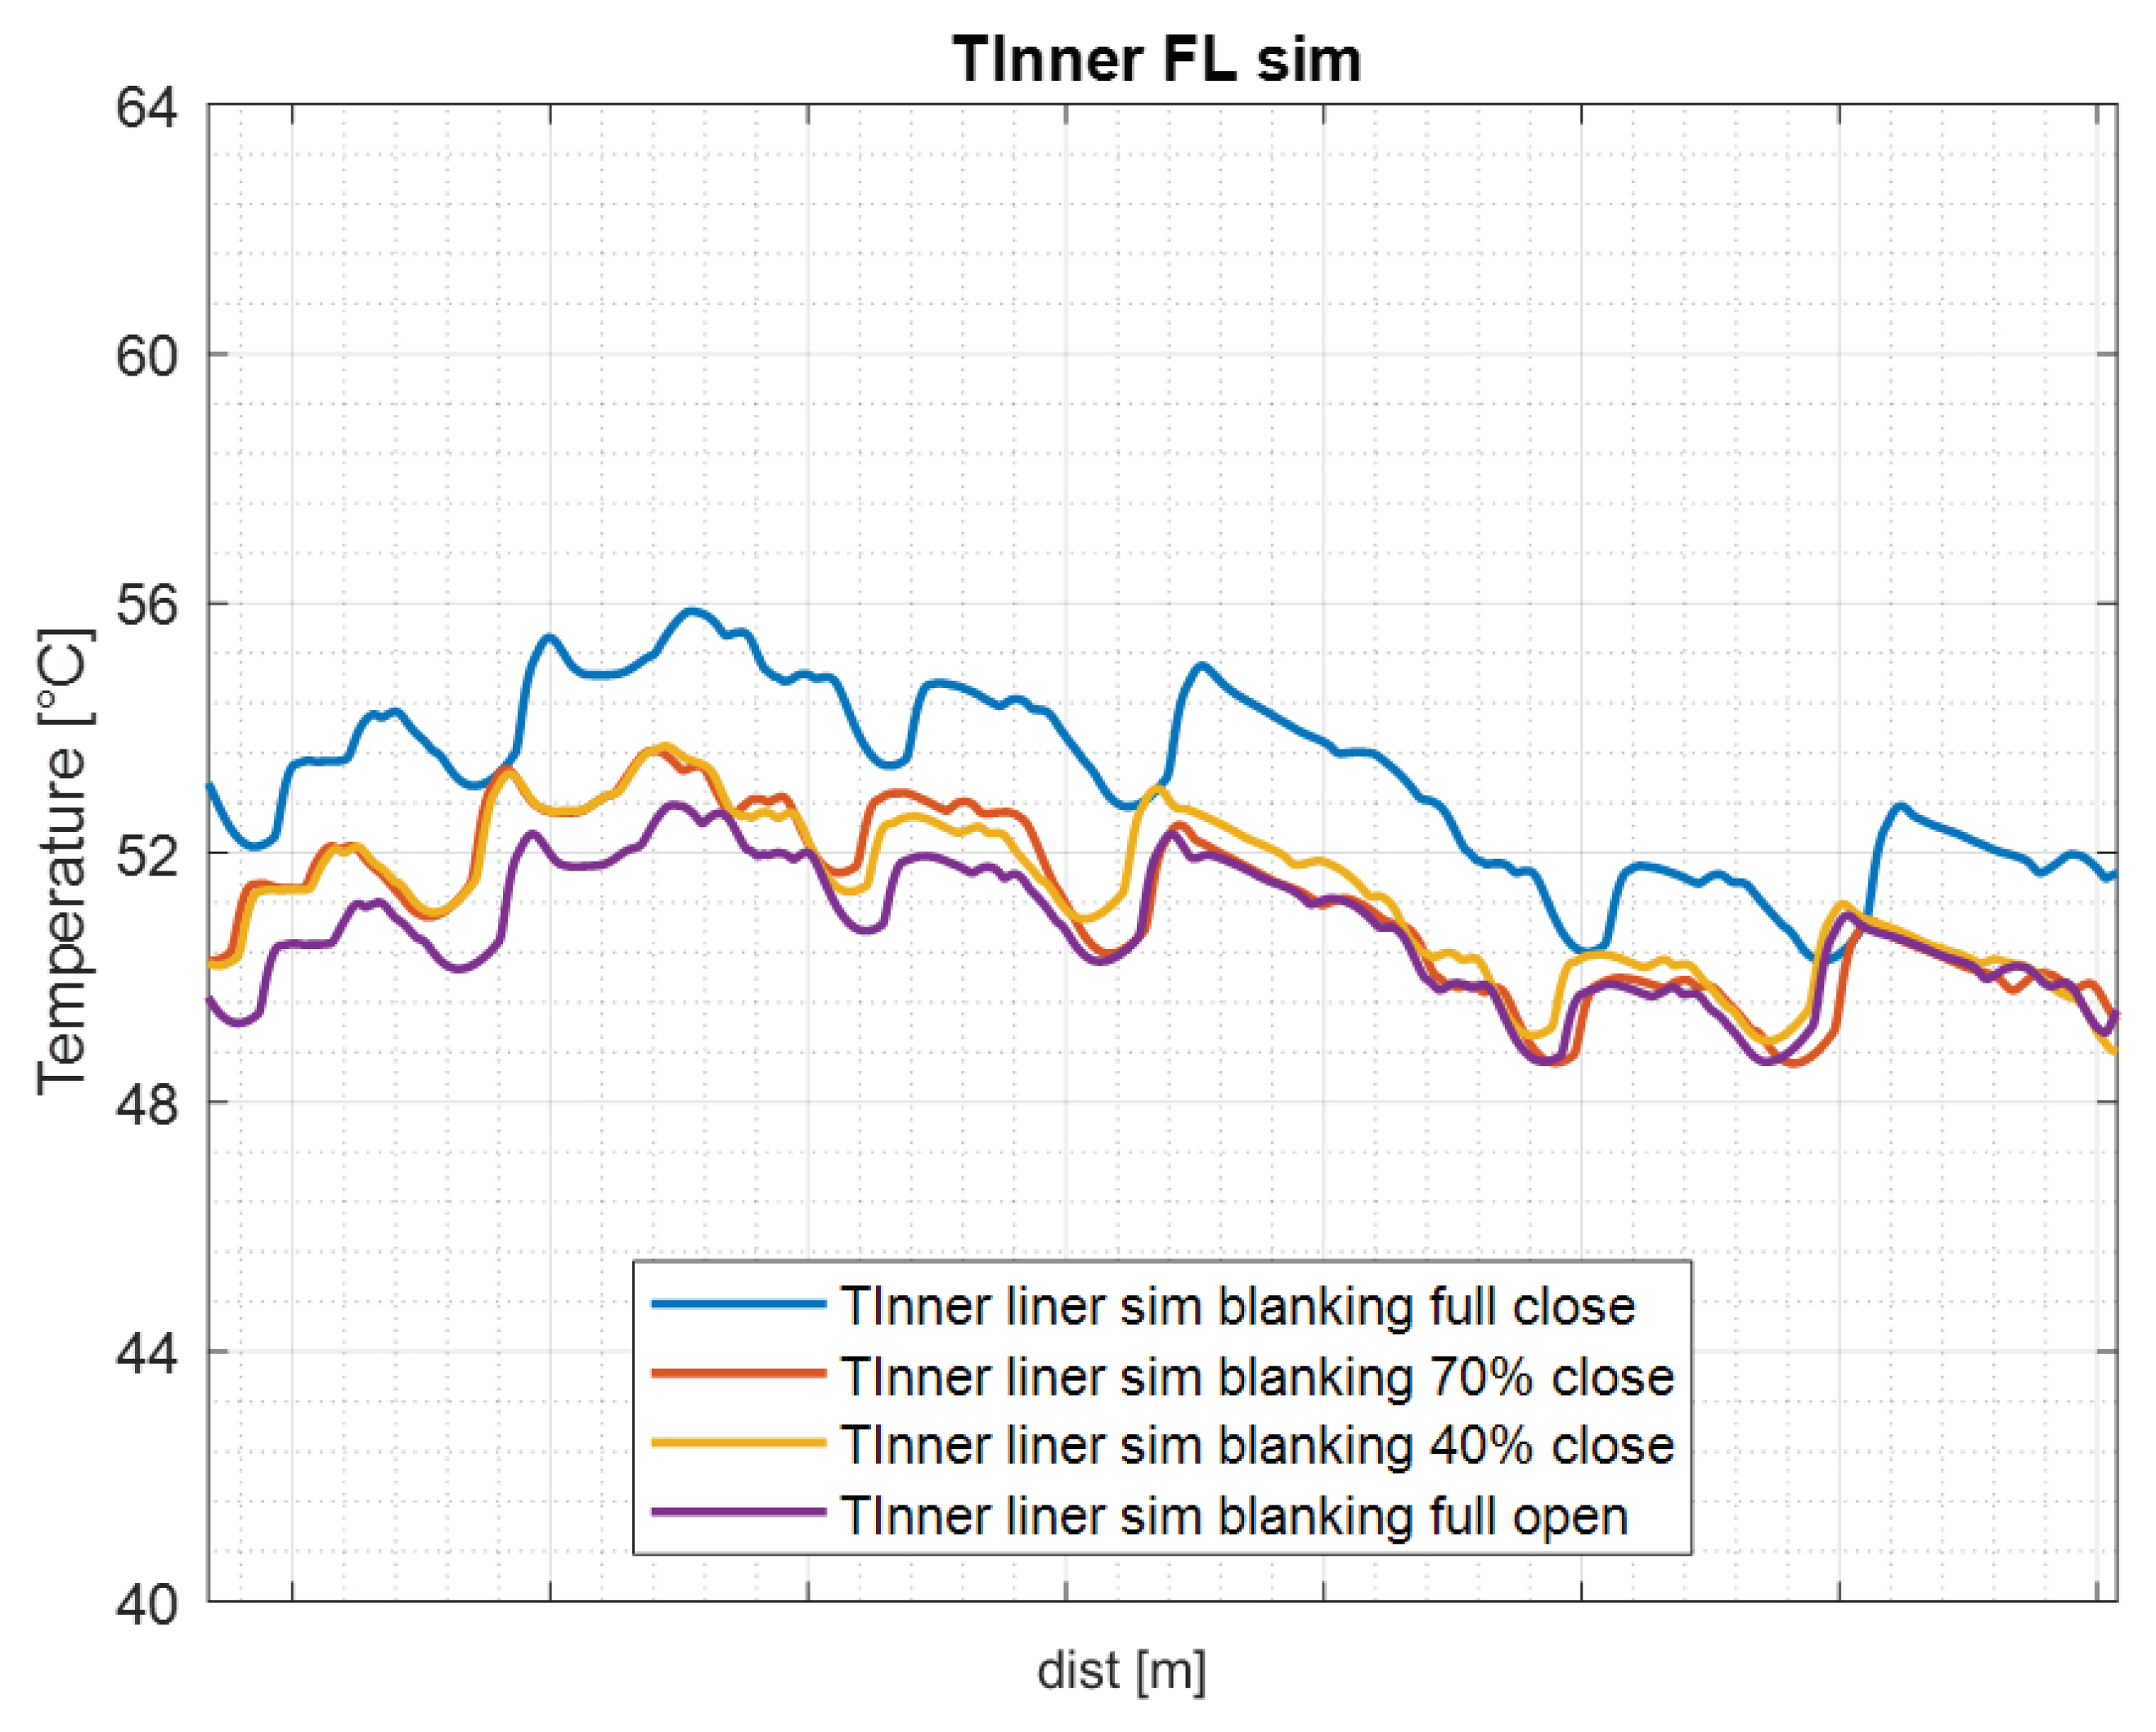
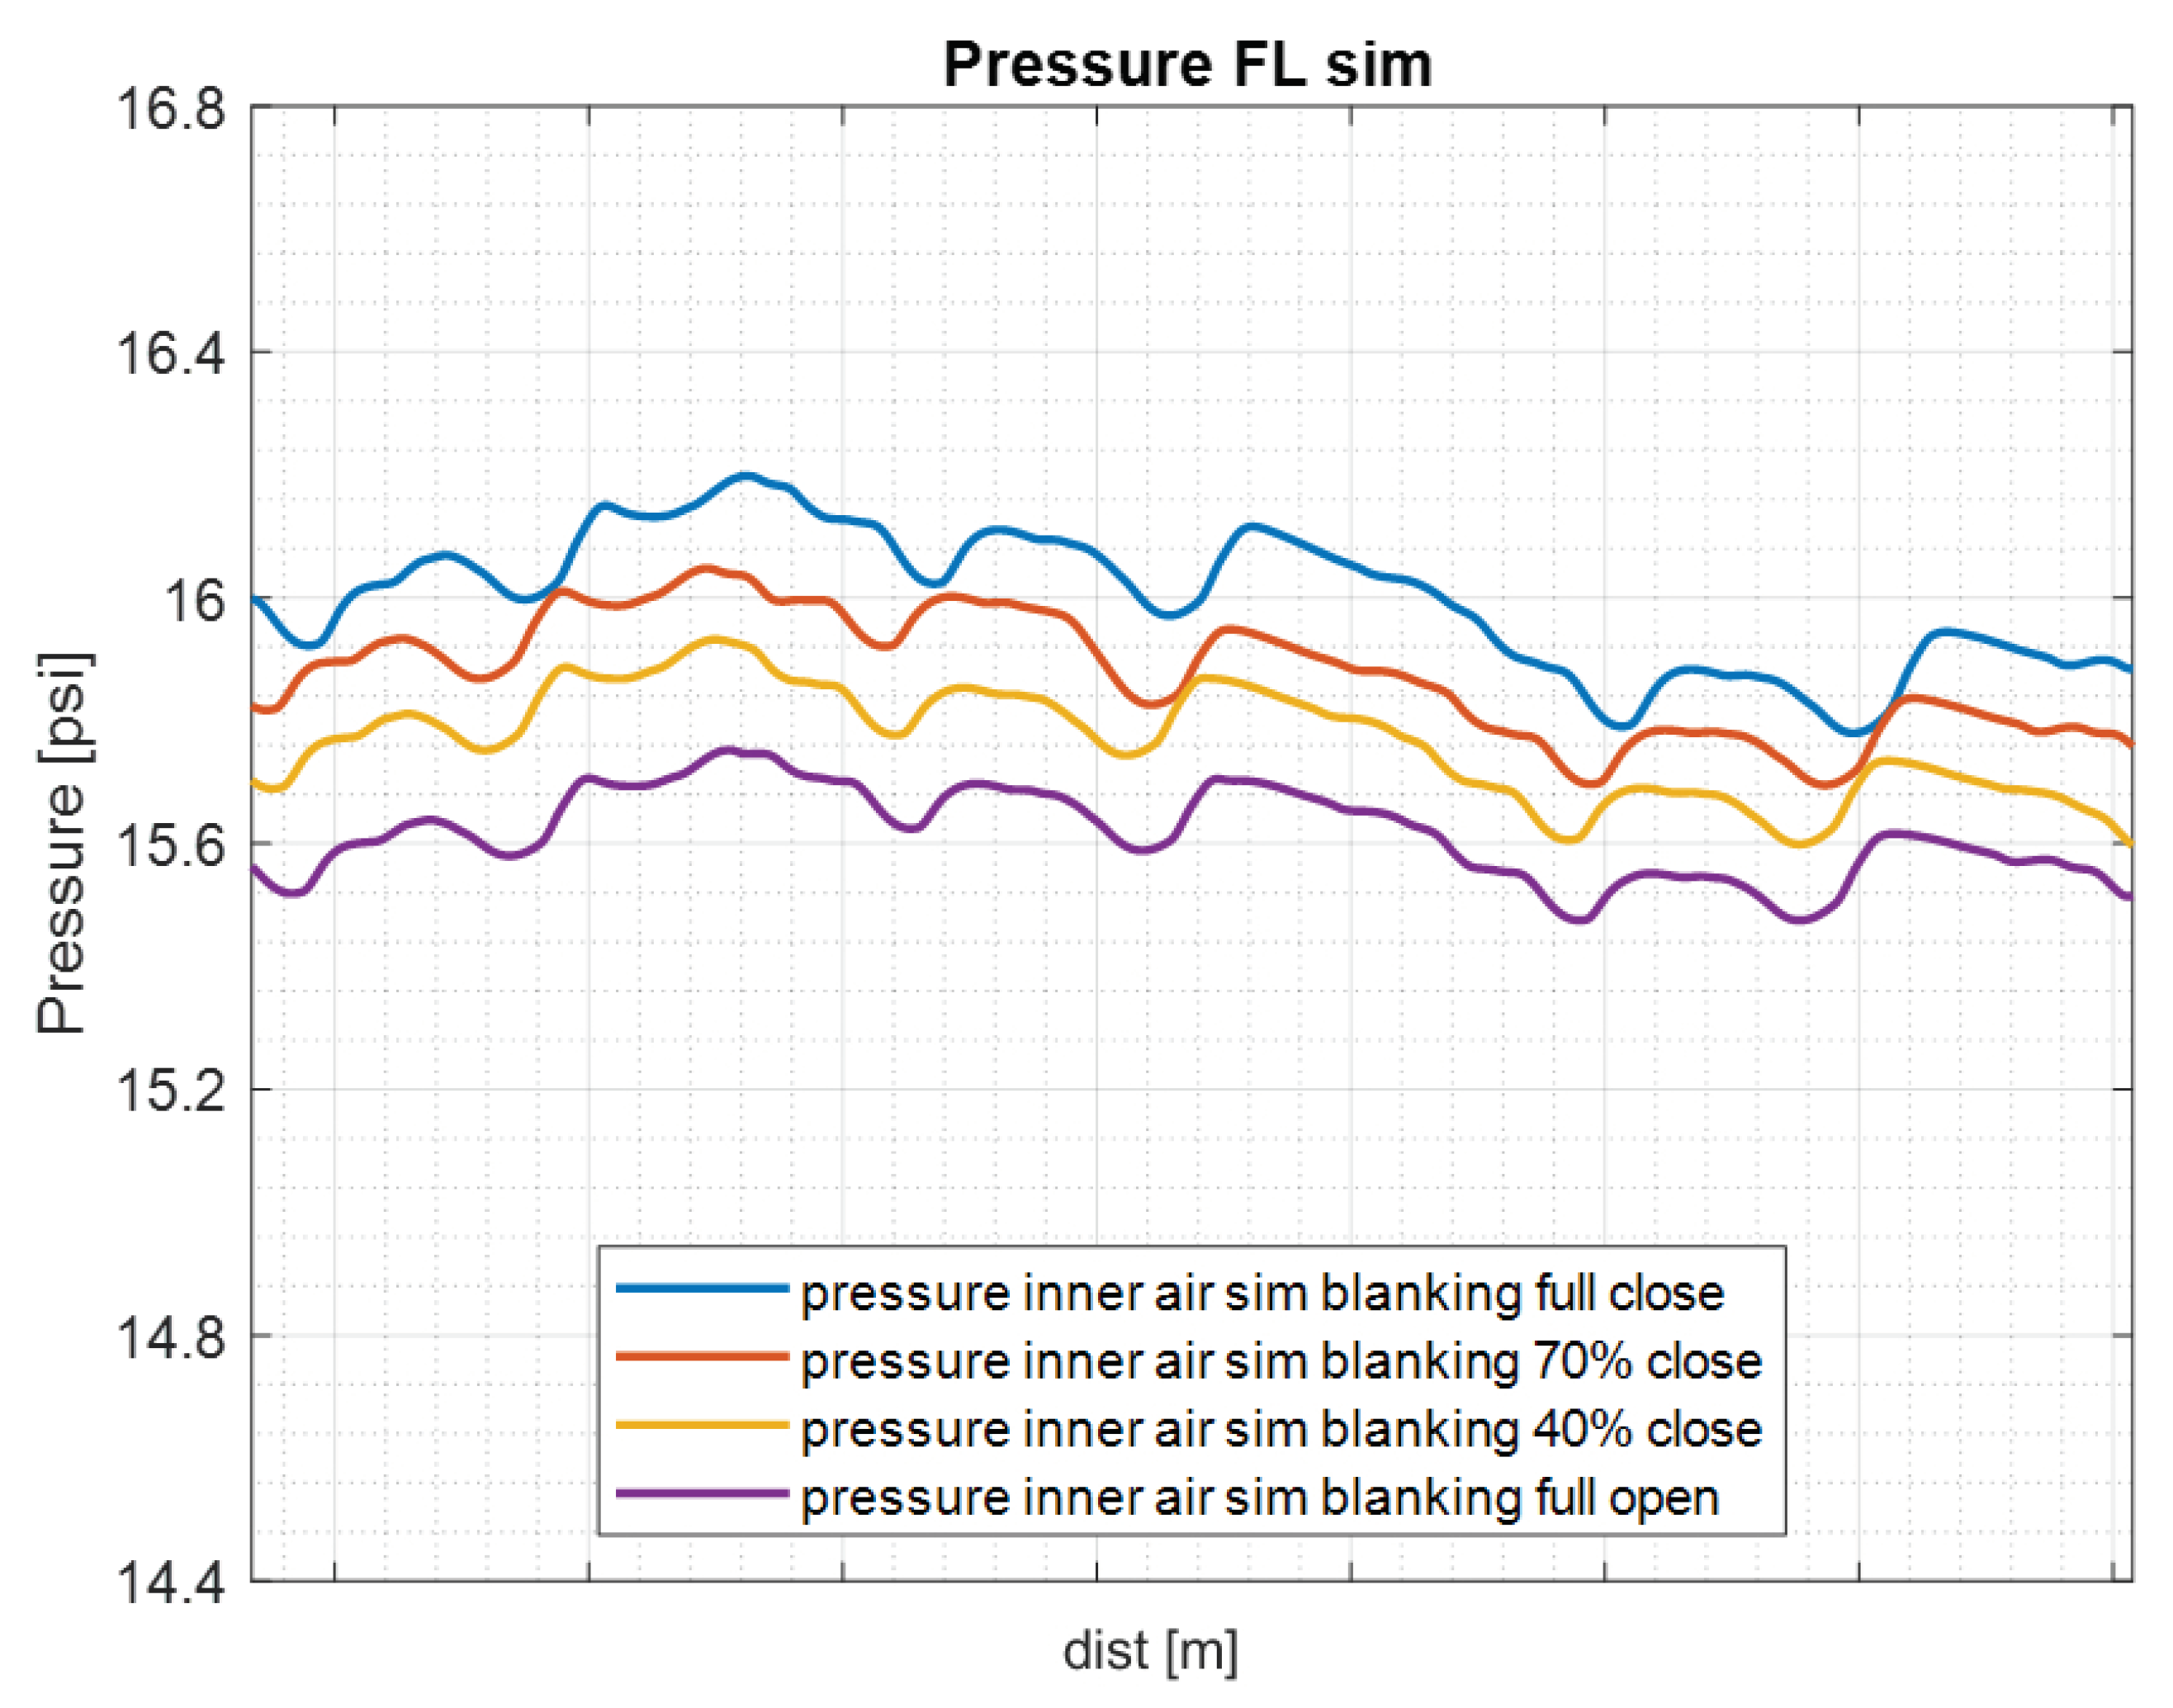
To provide a comprehensive analysis, Figure 12, Figure 13 and Figure 14 display the simulated temperature profiles of the inner liner, the pressure of the inner air and the temperature of the rim, respectively, for all the studied blanking cases. These trends allow for a deeper understanding of the phenomenon and enable the study and approximation of the model.
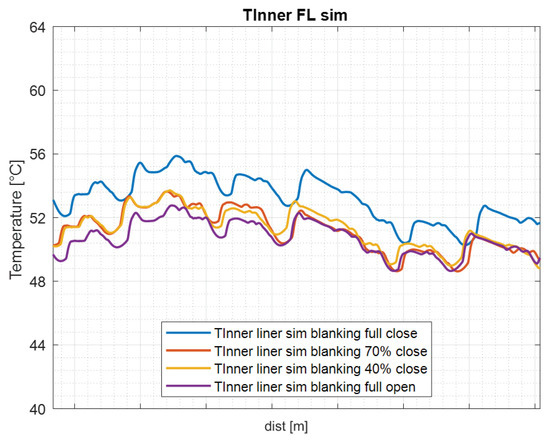
Figure 12.
Comparison of inner liner temperatures simulated in different blanking levels.
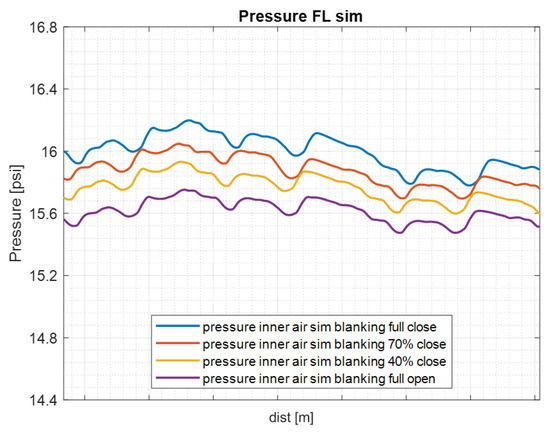
Figure 13.
Comparison of inner air pressures simulated in different blanking levels.

Figure 14.
Comparison of rim temperatures simulated in different blanking levels.
From the simulation data, it is evident that particularly when observing the trends of the inner liner temperature and rim temperature, the run performed with fully open-air intakes (purple line) exhibited a very similar pattern of values compared to the run conducted with partially close air intakes (yellow line). This observation may be explained by the fact that within a certain opening interval of the brake air intake, the thermal behavior of the tested components and their simulation in the model remained relatively unchanged, perhaps because there were the phenomena of air flows that were generated at high speeds, therefore suggesting a model threshold value for the opening of the air intake that ensures a constant dynamic of the thermal evolution of the quantities indicated. It can be observed that the temperature of the inner liner and the disc was significantly lower in the case of full open blanking compared to that of the full close blanking. This is because the airflow through the brake system is greater with the blanking valves fully open, which helps to dissipate the heat more effectively.
7. Conclusions
The simulation results presented in this study provide a comprehensive insight into the efficacy of the proposed brake model in accurately replicating the behavior of the brake system across a range of blanking conditions. Through this analysis, the model, using a co-simulation platform, establishes the foundation for predicting pressure and temperature profiles of key components, such as the air inside the tire, the inner liner, the disc, and the rim. Acquiring these values offers a significant advantage in the world of motorsport, as it enables fine-tuning and optimization of both the design and operation of the brake system, thereby ensuring safe and efficient braking performance in various contexts. The central focus of this paper is the addition of information related to the brake discs to the existing tire model. This addition allows for the prediction of the optimal blanking percentage required to execute the warm-up procedure effectively on a racing field, aligning with the tire’s thermal windows while considering the thermal working range of the disc.
The calibration of these models is conducted using experimental data collected from a racing vehicle equipped with all the previously mentioned sensors. As depicted in the figures and evident from the simulation outputs, the proposed model can accurately simulate pressure and temperature profiles within the inner air, inner liner, and disc under various blanking configurations. For brake manufacturers, this method proves valuable as it enables meticulous design of brake system components and the selection of materials tailored to specific brake applications, both in motorsport and passenger vehicles. The thorough exploration of various blanking cases contributed to a robust calibration process, allowing the model adaptation to the experimental data obtained. These simulation results also lay the foundations for further model development by addressing phenomena that occur at high speeds, aiming to replicate the complex thermal behavior inherent in the blanking process.
Consequently, this study provides a substantial basis for advancing the design and operation of brake systems, with implications extending to a wide spectrum of automotive applications. For example, this model can be applied to passenger cars for checking the state of brakes and predicting wear, facilitating predictive maintenance. It can also assist brake manufacturers in the design phase, helping describe the most suitable shape and choose materials that best match the performance requirements of the vehicle.
Author Contributions
Conceptualization, F.T. and F.R.; methodology, M.R. and G.F.; validation, F.R.; formal analysis, S.A.; resources, S.A. and G.F.; data curation, R.S.; writing—original draft preparation, S.A. and R.S; writing—review and editing, F.R. and M.R.; visualization, G.F.; supervision, F.T.; project administration, F.T. and F.R. All authors have read and agreed to the published version of the manuscript.
Funding
This research received no external funding.
Data Availability Statement
Data sharing is not applicable to this article.
Conflicts of Interest
The authors declare no conflict of interest.
References
- Ramazani, S.; Morshed, M.; Ghane, M. Effect of service temperature on structure and mechanical properties of polyamide 6 & 66 tyre cords. J. Polym. Res. 2011, 18, 781–792. [Google Scholar]
- Genovese, A.; Farroni, F.; Sakhnevych, A. Fractional Calculus Approach to Reproduce Material Viscoelastic Behavior, including the Time–Temperature Superposition Phenomenon. Polymers 2022, 14, 4412. [Google Scholar] [CrossRef] [PubMed]
- Farroni, F.; Timpone, F.; Sakhnevych, A. An Evolved Version of Thermo Racing Tyre for Real Time Applications. In Proceedings of the World Congress on Engineering 2015, London, UK, 1–3 July 2015. [Google Scholar]
- Jafari, R.; Akyüz, R. Optimization and thermal analysis of radial ventilated brake disc to enhance the cooling performance. Case Stud. Therm. Eng. 2022, 30, 101731. [Google Scholar] [CrossRef]
- Zhang, S.; Zhu, S.; Xu, N. Multi-objective optimization of disc brake structure based on heat transfer performance. Vibroeng. Procedia 2022, 41, 191–197. [Google Scholar] [CrossRef]
- Belhocine, A.; Bouchetara, M. Investigation of temperature and thermal stress in ventilated disc brake based on 3D thermomechanical coupling model. Ain Shams Eng. J. 2013, 4, 475–483. [Google Scholar] [CrossRef]
- Wang, C.; Wang, S.; Jin, H.; Huo, H.; Xu, H.; Chen, Z. Thermal-mechanical coupling analysis and optimization of mine hoist brake disc. Adv. Mech. Eng. 2022, 14, 16878132221106297. [Google Scholar] [CrossRef]
- Dreyer, M.; Radespiel, R.; Körner, M.; Decker, F. Experimental and Numerical Simulation of the Flow around the Brake Disk of a Scaled-Down VW Phaeton Model. SAE Trans. 2007, 116, 2127–2140. [Google Scholar]
- Sakhnevych, A.; Arricale, V.M.; Bruschetta, M.; Censi, A.; Mion, E.; Picotti, E.; Frazzoli, E. Investigation on the Model-Based Control Performance in Vehicle Safety Critical Scenarios with Varying Tyre Limits. Sensors 2021, 21, 5372. [Google Scholar] [CrossRef] [PubMed]
- Bashir, M.; Qayoum, A.; Saleem, S. Analysis of frictional heating and thermal expansion in a disc brake using COMSOL. In Proceedings of the 2nd International Conference on New Frontiers in Engineering, Science & Technology (NFEST), Kurukshetra, India, 18–22 February 2019. [Google Scholar]
- Jaenudin, J.; Jamari, J.; Tauviqirrahman, M. Thermal analysis of disc brakes using finite element method. AIP Conf. Proc. 2017, 1788, 030028. [Google Scholar]
- Jadhav, S.; Sawant, S. A review paper: Development of novel friction material for vehicle brake pad application to minimize environmental and health issues. Mater. Today Proc. 2019, 19, 209–212. [Google Scholar] [CrossRef]
- Ingale, S.; Kothawade, S.; Patankar, A.; Kulkarni, R. Design and analysis of a brake caliper. Int. J. Mech. Eng. Technol. (IJMET) 2016, 7, 227–233. [Google Scholar]
- Reddy, V.C.; Reddy, M.G.; Gowd, G.H. Modeling and analysis of FSAE car disc brake using FEM. Int. J. Emerg. Technol. Adv. Eng. 2013, 3, 383–389. [Google Scholar]
- Lee, K. Numerical Prediction of Brake Fluid Temperature Rise during Braking and Heat Soaking; SAE Technical Paper 1999-01-0483; SAE International: Warrendale, PA, USA, 1999. [Google Scholar] [CrossRef]
- Vdovin, A.; Le Gigan, G. Aerodynamic and Thermal Modelling of Disc Brakes—Challenges and limitations. Energies 2020, 13, 203. [Google Scholar] [CrossRef]
- Kreith, F.; Manglik, R.M.; Bohn, M.S. Principles of Heat Transfer: Part 1; RPK Editorial Services, Inc.: New Windsor, NY, USA, 2011. [Google Scholar]
- Minkowycz, W.J.; Sparrow, E.M.; Murthy, J.Y. Handbook of Numerical Heat Transfer; John Wiley & Sons Inc.: Hoboken, NJ, USA, 2000. [Google Scholar]
- Farroni, F.; Sakhnevych, A. Tire multiphysical modeling for the analysis of thermal and wear sensitivity on vehicle objective dynamics and racing performances. Simul. Model. Pract. Theory 2022, 117, 102517. [Google Scholar] [CrossRef]
- Sakhnevych, A. Multiphysical MF-based tyre modelling and parametrisation for vehicle setup and control strategies optimisation. Veh. Syst. Dyn. 2022, 60, 3462–3483. [Google Scholar] [CrossRef]
- Guiggiani, M. The Science of Vehicle Dynamics; Springer: Cham, Switzerland, 2023. [Google Scholar]
- Farroni, F.; Russo, M.; Sakhnevych, A.; Timpone, F. TRT EVO: Advances in real-time thermodynamic tire modeling for vehicle dynamics simulations. J. Automob. Eng. 2018, 233, 121–135. [Google Scholar] [CrossRef]
- Mavros, G. A thermo-frictional tyre model including the effect of flash temperature. Veh. Syst. Dyn. 2019, 57, 721–751. [Google Scholar] [CrossRef]
- Napolitano Dell’Annunziata, G.; Arricale, V.M.; Farroni, F.; Genovese, A.; Pasquino, N.; Tranquillo, G. Estimation of Vehicle Longitudinal Velocity with Artificial Neural Network. Sensors 2022, 22, 9516. [Google Scholar] [CrossRef] [PubMed]

Disclaimer/Publisher’s Note: The statements, opinions and data contained in all publications are solely those of the individual author(s) and contributor(s) and not of MDPI and/or the editor(s). MDPI and/or the editor(s) disclaim responsibility for any injury to people or property resulting from any ideas, methods, instructions or products referred to in the content. |
© 2023 by the authors. Licensee MDPI, Basel, Switzerland. This article is an open access article distributed under the terms and conditions of the Creative Commons Attribution (CC BY) license (https://creativecommons.org/licenses/by/4.0/).