1. Introduction
The world population shows an upward urbanization trend and as reported by the United Nations in 2019, 55% of the world population lived in urban areas in 2018 [
1]. This trend seems that it will further continue in the next years and is estimated that the relevant percentage will increase up to 68% by 2050 [
1]. So, given that and the increasing number of transportation and commuting needs both for people and products, nowadays transport system are becoming more and more complex. As a result, the associated risks and threats are numerous and diverse in nature, so cutting-edge solutions and technologies should be engaged in order to increase the safety of transport networks. More specifically, according to the World Health Organization (WHO), in 2016 about 1.35 million people lost their lives in car crashes worldwide [
2]. Moreover, the International Traffic Safety Data and Analysis Group (IRTAD) reported in 2019, that according to the most recent road safety data and up-to-date information, approximately 80,000 road deaths occurred in 2017 across the 33 countries which provided validated data [
3]. Hence, the research for safety enhancement in road networks is of utmost importance and mainly focuses on the data utilization, as well as the development of smart systems, which are able to predict dangerous patterns and conditions related to driving behavior.
The analysis of driving behavior in order to make driving safer is not a simple process. The vast volume of data generated by vehicle sensors as well as the rapid paces needed for gathering and storage pinpoint the necessity to utilize modern technologies such as big data and machine learning analytics in order to handle them in an intelligent and of course, efficient way. The aim is to analyze the streamed and gathered data so to achieve useful insights on anomalies in driving behavior, as well as to ensure that the considered vehicle is driven in accordance with applied traffic law and safety regulations and recommendations. The accumulation of vehicle data is carried out through peripheral sensors that are installed on the vehicles and collected through an On-Board Unit (OBU) in order to be transmitted to a central hybrid platform for further analysis. The efficient combination of data provided and of the deployment of advanced computer algorithms and state-of-the-art systems aims to detect and indicate outliers or anomalies in driving behavior.
In this light, this paper proposes and presents a hybrid platform which employs big data technologies so as to gather, store, and process data originating from different vehicles. In addition to the platform introduction, authors present a novel approach for detecting anomalies in the aforementioned data using machine learning algorithms. The identification of anomalies in data coming from vehicles consists a starting step which can be combined with other forms of analysis in order to offer enhanced situational awareness regarding driving behavior. Thus, this study focuses mainly on anomaly detection by engaging different methods for univariate and multivariate outlier detection which, in future approaches, can be combined with further analysis steps and additional methods so as to enable a holistic approach of driving behavior assessment. In this study, the aim is to detect anomalies in the collected vehicular data so to indicate possible dangerous driving behavior.
The remainder of this paper is structured as follows:
Section 2 features an overview of the outliers theory alongside with a literature review;
Section 3 presents the architecture of the hybrid platform which hosts the analysis module for outlier;
Section 4 demonstrates the dataset and the algorithms employed for outlier detection, while
Section 5 presents the evaluation results; and
Section 6 concludes the paper and points to future work and extensions of the current study.
2. Outlier Detection Theory and Related Work
Outliers, in general, are defined as observations or data samples that are significantly distanced from the main body of the examined data [
4]. These distanced values often indicate an anomaly or a measurement error depending on the examined dataset. Moreover, those samples could also refer to data or measurements which are met under rare circumstances or possibly could indicate data samples of a different population [
5]. The categorization and the characterization of outliers depend always on the domain and the provided data as well as to the data analyst expert or to the consensus process engaged in order to decide if a data sample is abnormal. Due to the fact that in many cases outliers are directly linked with abnormal behavior, they are also referred as deviants, anomalies, discordants, or abnormalities in the literature of statistics and data analysis [
4].
The interpretability of data is directly associated with the outliers detection [
4]. Thus, it is essential to achieve an as high as possible interpretability level in order to properly select the best outlier analysis method from a wide range of relevant algorithms. Some primary such methods according to [
4,
6] include: (i) Probabilistic Modelling; (ii) Linear Regression Models; (iii) Z-Score Analysis; (iv) Proximity Based Models; and (v) High Dimensional Outlier Detection Methods such as Mahalanobis Distance [
7] for multivariate statistical outlier detection.
Outliers can be divided into two major categories depending on the examined data given as input, namely, the multivariate and the univariate ones. The multivariate outliers refer to multi-dimensional data spaces and are detected by calculating the scores of combinations of different variables which are very distant or uncommon compared to the vast majority of scores in the same dataset. On the other hand, the univariate outliers are spotted in single-dimensional spaces of data. Univariate outliers are recognized as extreme or very distant values or points in a dataset [
8]. Univariate outliers are easy to be detected even by conventional tools and methods but multivariate outliers pose a challenge because of their nature and the difficulty to analyze and reveal patterns in multi-dimensional spaces. Thus, the engagement of state-of-the-art techniques and algorithms as well as the efficient training of machine learning algorithms are necessary.
In addition to the two basic types of outliers previously discussed, i.e., the multivariate and univariate, there are some further categories depending on the examined data distribution. More specifically, outliers can belong to one of the follow categories: point (or global) outliers, contextual (or conditional) outliers, and collective outliers [
9,
10]. As indicated by their name, point outliers are single data points which are located distantly from the rest of the given dataset. Similarly, contextual outliers are data points with values quite different from the other data points of a given distribution. The noise in data such as background noise in speech recognition applications or symbols in text analysis is often considered as contextual outlier. Last but not least, the collective outliers are groups of data samples which have very different/distant values compared to the rest of the datapoints in the same dataset. Thus, these groups of datapoints may be found in different areas and be quite distant from the rest of the distribution. These values sometimes refer to new subsets of dataset which may characterize a new pattern or a new phenomenon [
10]. Due to their characteristics and the different categories of outliers mentioned above, they can provide useful information and insights from many different categories and real-life applications such as (i) intrusion detection systems (IDSs), where outliers can indicate malicious activity, e.g., related to a computer network; (ii) sensor monitoring, where outliers could indicate a malfunction; (iii) medical diagnosis where outliers can indicate a possible disease; (iv) fraud or criminal activities where outliers can reveal hidden patterns and trends which can lead to the recognition of malicious or criminal activities; (v) prediction of harsh environmental phenomena such earthquakes, tsunami, floods, etc.; and (vi) traffic and driving behavior monitoring where outliers could indicate possible dangerous conditions and accidents alarm.
The process of outlier and anomaly detection, nowadays, employs state-of-the-art methods and machine learning algorithms with very promising results. There are several different categories of machine learning algorithms that can be used for outlier detection in different domains and applications including neural networks, deep learning algorithms, distance-based algorithms, linear models, and vector-based and ensembled models. All the aforementioned categories belong to two main sets, namely, the supervised and unsupervised learning algorithms. For purposes of outlier detection, it is possible to have both supervised and unsupervised learning techniques depending on the domain and the data examined.
Neural networks are commonly used artificial intelligence models which try to imitate the human brain’s function and learning process. Neural networks consist of neurons and nodes. Nodes of a neural network are interconnected through neurons. Neurons have a numerical value which is commonly denoted as a weight (w
ij). Every neural network receives a set of inputs and, through its training process, adjusts the weight values so as to produce the desired output(s) [
11,
12]. Neural networks are directly affected by outliers which could potentially be responsible for an accountable decrease in their efficiency and accuracy [
11]. The dependance of the neural networks’ performance by outliers in many cases can be utilized for outlier detection purposes. Deep learning can be considered as an evolution to conventional machine learning algorithms which brought upon breakthroughs in several tasks and applications such as speech and text recognition, image and video analysis, outliers detection, and more [
13]. A very interesting study about driving behavior and outliers detection was performed by Kieu et al. [
14]. In this study, the authors proposed a framework for outlier detection in time series which can be used for dangerous driving and hazardous road conditions. Moreover, they engaged autoencoders to process the time series and reduce its dimension. The autoencoder is a special type of neural network which consists of multiple layers and is used in order to execute a dimensionality reduction of the input dataset. Autoencoders can also support the outlier detection process due to the fact that the reconstruction of outlying values is far more difficult than the normal ones and so they can easily spot such values [
15].
Distance-based algorithms, as suggested by their name, identify a data sample as an outlier if its locality is sparsely populated or if it is located very distantly from the rest of the distribution [
16]. The calculation of the distance of each data sample can be carried out using several different methods, one of which is the K-Nearest Neighbor (KNN). The K-Nearest Neighbor (KNN) algorithm is a very well documented and studied algorithm in the domain of outlier detection. KNN performs a clustering procedure so as to discover similar data samples which belong in the same cluster. Given the formulated clusters, KNN calculates the distance of each point in order to decide whether it belongs to a cluster or it is an outlier [
17]. In addition to the KNN algorithm, the Local Outlier Factor (LOF) is another prominent algorithm in the category of the distance-based algorithms. LOF is an outlier or anomaly detection method which calculates the local density deviation of a data point from its neighbor samples [
18]. Moreover, LOF computes the Local Reachability Density (LRD) value, which is almost equal to 1 for data samples considered as normal or inliers while the value of the same parameter is higher for anomaly points or outliers. The LOF algorithm performs better when the given distribution features different density among data neighborhoods [
18,
19]. The LOF algorithm can be applied both for supervised univariate analysis and unsupervised multivariate analysis [
19]. Another well-known algorithm for outlier detection for multivariate data is the Density-Based Spatial Clustering of Applications with Noise (DBSCAN) algorithm. DBSCAN is used for outlier detection by calculating two major parameters, i.e., the epsilon and MinPts values and through these parameters it groups together datapoints, that are close to each other, and classifies as outliers, datapoints which are very distant to the groups created or in low-density areas [
20].
Linear models, on the other hand, attempt to detect linear correlations between the data. For linear models, the least squares fit is often used to define the best linear hyperplane so as to calculate the distance of data samples from this considered hyperplane and detect the outliers [
21]. Two very well-known algorithms that belong to the linear models’ category are the Principal Components Analysis (PCA) and the Minimum Covariance Determinant (MCD) methods. The PCA method is a commonly used technique for both dimensionality reduction and outlier detection. Thus, PCA offers a reduced dimensionality space which features the least reconstruction error for normal data while the relevant outliers’ reconstruction error is quite large. For this reason, PCA proves to be a useful tool for outlier samples detection [
22]. MCD is another linear algorithm which can be used for outlier detection introduced by Rousseeuw in 1984 [
23]. MCD is suitable for multivariate datasets because it provides an estimation of the multivariate mean and covariance values by examining the subset of data points in a dataset with the minimum determinant of the covariance matrix [
24]. In addition to the MCD algorithm, the Elliptic Envelope algorithm fits a robust covariance estimate to the data objects by fitting an ellipse to the central data points. Given the covariance estimate and the center of the distribution this method draws an ellipse and classifies each data point as inlier if it is placed inside the envelope or as outlier if it is placed outside the envelope [
25].
In addition to neural networks, distance-based and linear models mentioned above, vector-based algorithms such as the Support Vector Machine (SVM), a very famous and efficient algorithm based on supervised learning, are, also, deployed. The SVM algorithm constructs the most suitable hyperplane in n-dimensions (depending on the dimensionality of the problem) so as to classify the given data to the right category. The SVM algorithm is very useful for binary problems where there is the need to decide whether a data sample belongs to one category or another [
26]. Binary or one class problems is a special category of problems dealt by SVM algorithms since they can decide whether a data sample belongs to the normal category or not. Thus, if a data sample does not belong to the normal category then SVM characterizes it as an anomaly or an outlier [
27]. Moreover, the isolation-forest algorithm or i-Forest, as widely known, belongs to the ensembled methods category for outlier detection. The score of each data point indicates the depth required to isolate a point in a single node of the tree. The i-Forest algorithm isolates outlier points while it does not profile the normal ones. The outliers are detected as the points which feature shorter average path lengths to iTrees [
28].
Outlier detection in driving behavior data is an open research topic with several relevant studies found in the literature. Except for the study mentioned above by Kieu et al. [
14], Vasconcelos et al. [
29] proposed a framework which utilizes a smartphone to monitor data from vehicle sensors in order to detect outlier values. Vasconcelos et al. [
30], also, utilized off-the-shelf smartphones to monitor data coming from the vehicle such as turns, acceleration and deceleration. Authors of [
30], adapted the Z-Score algorithm so as to perform online outlier detection as a data stream processing model, receiving the smartphone and in-vehicle sensors data as input. Moreover, Zheng et al. [
31] engaged smartphones in vehicles to assess driving behavior and detect outliers via unsupervised learning. Another interesting study conducted by Zhang et al. [
32] proposed SafeDrive, an online and status-aware approach, which does not require labeled data. This framework creates a state graph from historical data and then, splits the online data stream into segments so to compare each segment with the state graph. As soon as a segment significantly deviates from the state graph, SafeDrive considers it as an outlier. It is remarkable that the performance of SafeDrive was evaluated on Internet of Vehicles cloud platform with over 29,000 connected vehicles [
32].
In addition to driving behavior, there are also studies on outliers in other traffic-related data such as trajectories and routes monitoring data. Dang et al. [
33] performed a study which focuses on outlier detection in large-scale traffic data based on the KNN algorithm. The data used in [
33] were collected in video format and then, by using PCA, they were transformed in a two dimensional dataspace. Another study which utilized the KNN algorithm was conducted by Djenouri et al. [
34] who described a method to detect outliers in spatio-temporal traffic flows in order to populate Flow Distribution Probability databases with inlier only values. A combination of driver behavior modelling and trajectory outlier detection method was described by Wu et al. in [
35], where the authors propose a vehicle outlier detection approach namely the Driving Behavior-based Trajectory Outlier Detection (DB-TOD) method which is based on probabilistic modelling via modeling the driving behavior/preferences from the set of historical trajectories. In [
35], authors presented a model which calculates the probabilities of the distribution of trajectory data in order to return the trajectories which have low probability as candidate outliers.
3. Hybrid Data Management and Analysis Platform
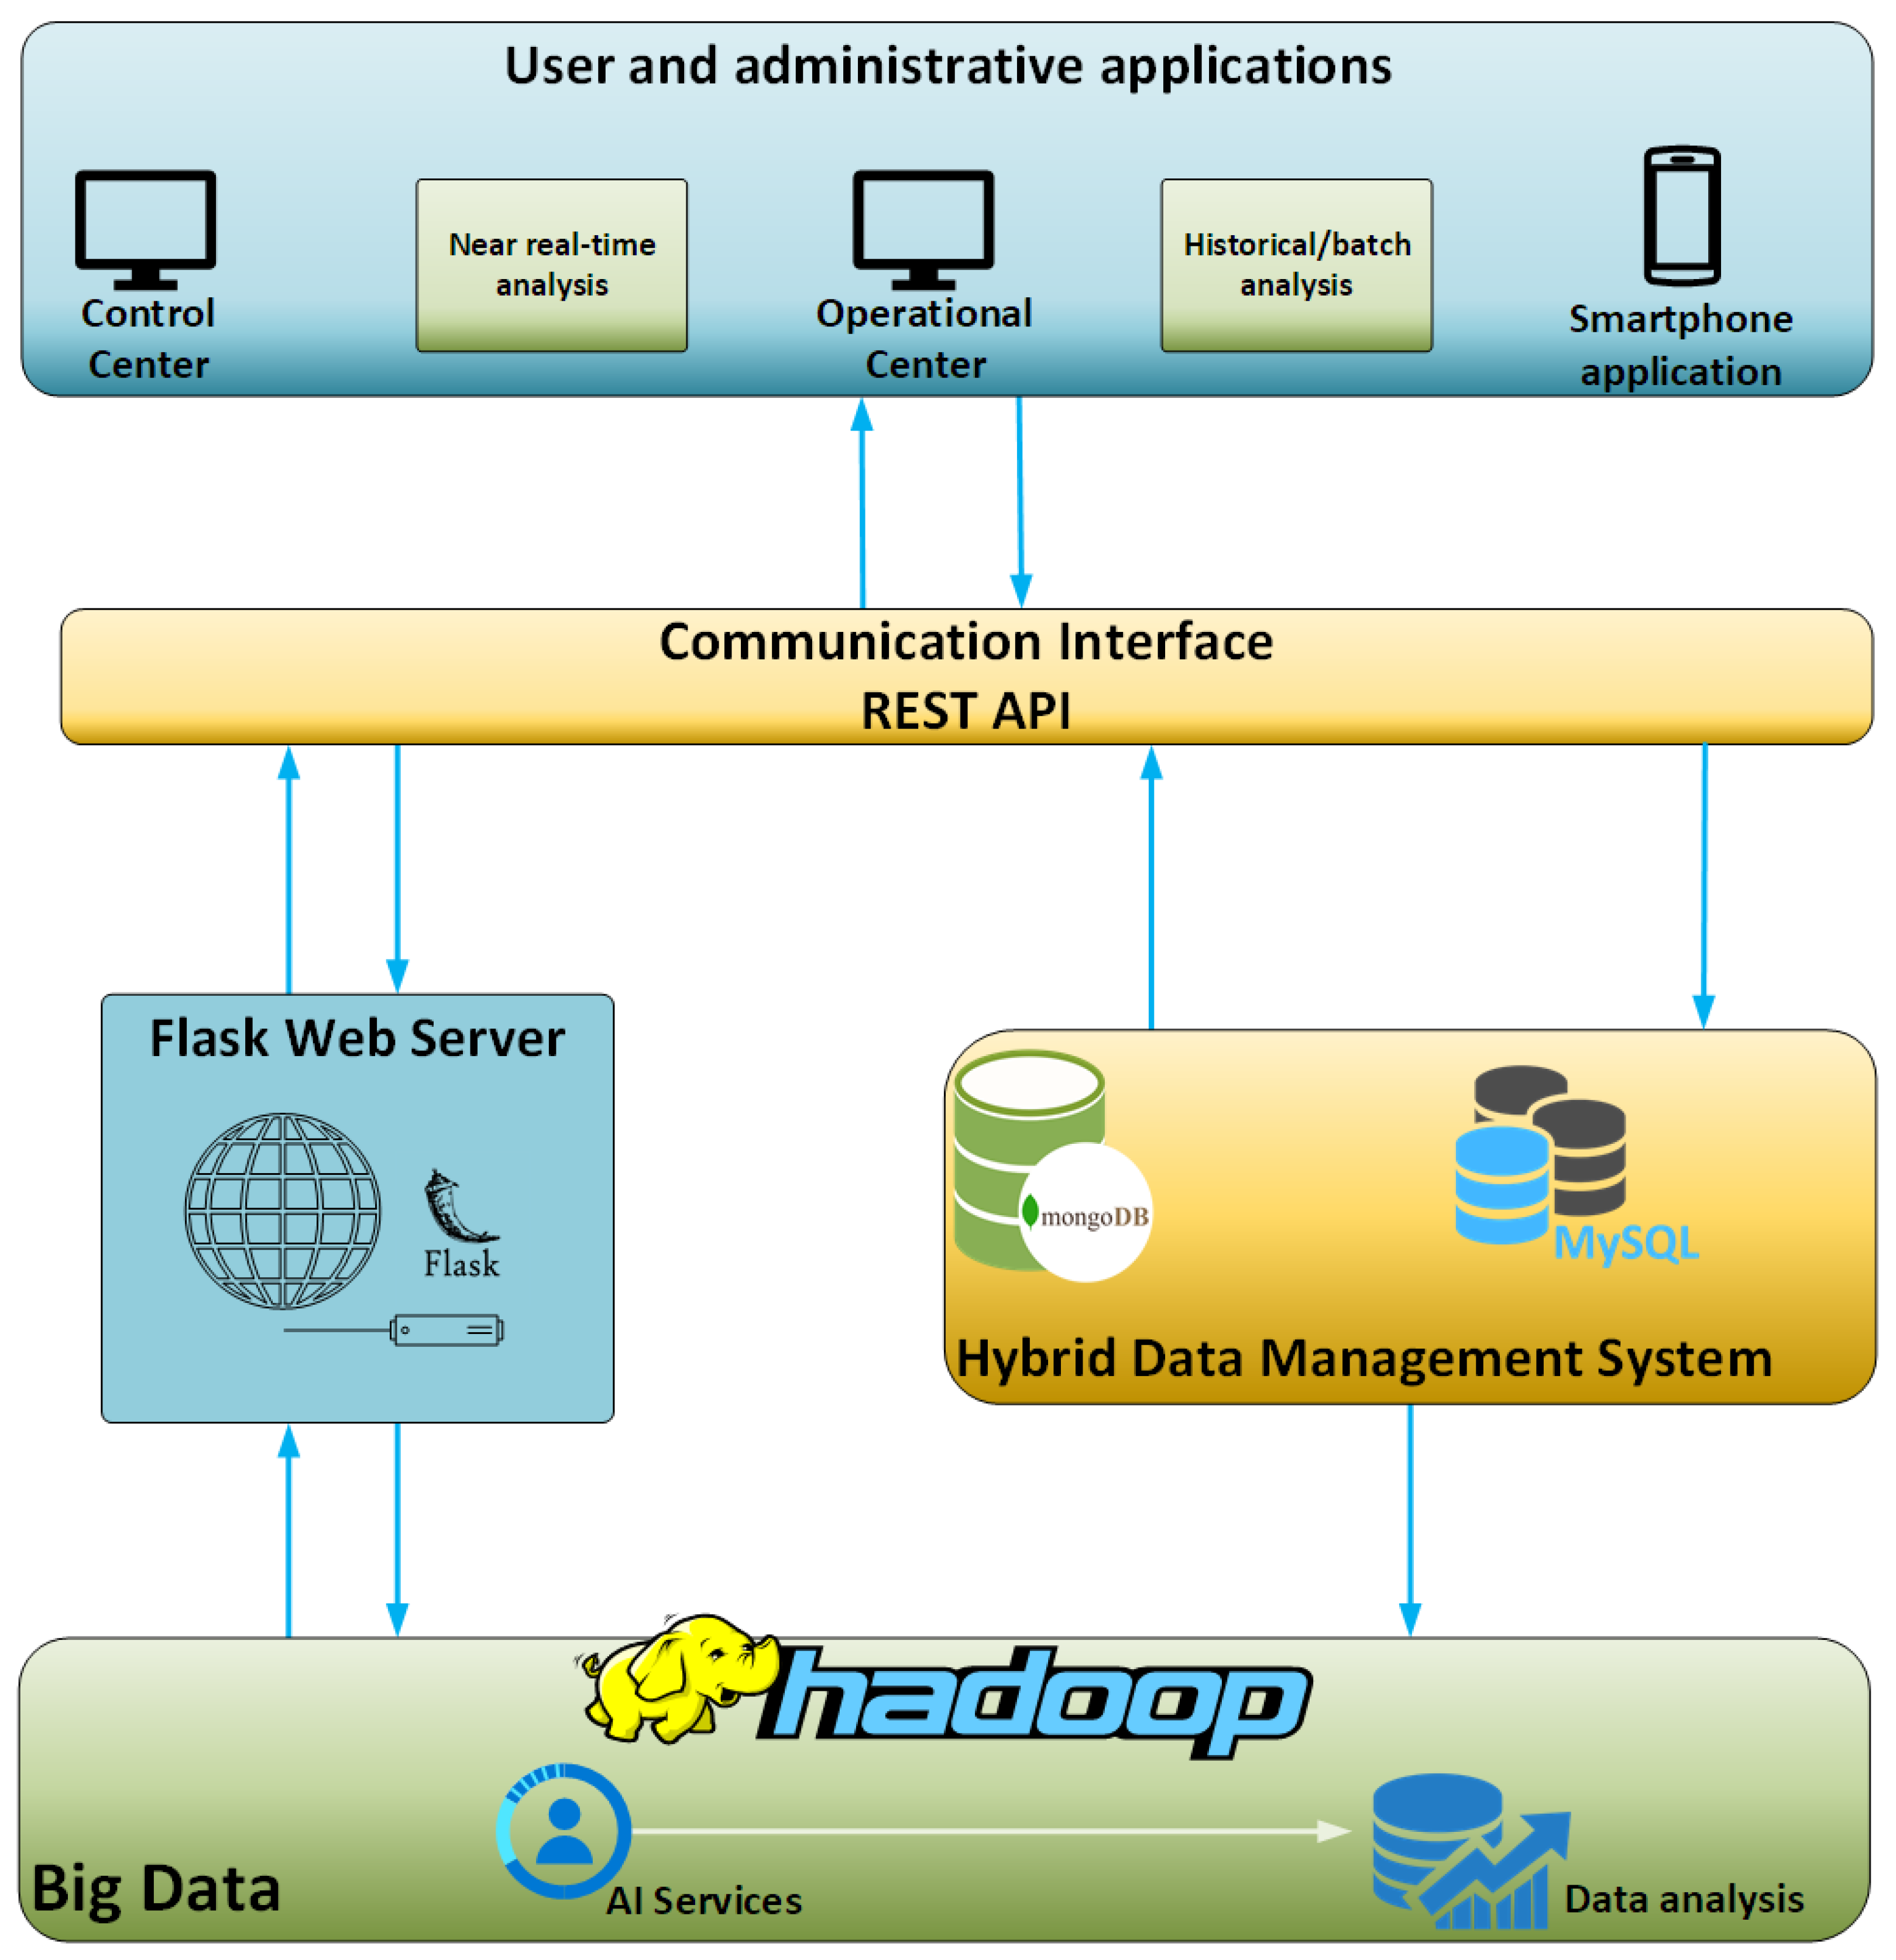
For the purposes of the present study, a hybrid big data platform was designed and implemented. This hybrid big data platform hosts the data streaming from vehicles and is designed in such a way so as to facilitate the basic requirements of a big data platform and its users. First of all, the discussed platform is designed to be high-reliable, being able to operate smoothly without any external intervention. This means that the platform is capable to handle unexpected situations without downtimes. For example, when the platform faces an unexpected error in software terms then it is capable to auto-restart its services and the same time logs the error so to inform the IT personnel to identify the cause and try to minimize the possibility of future occurrence. Moreover, the framework configuration and the resources allocated for this very platform can be distributed in different machines so to achieve redundancy and minimize the downtime. What is more, the modular design and development of this very platform enables it to be expandable and suitable for many diverse applications and requirements in different domains other than ITS. The platform is consisted of many different widely used software components such as Hadoop, spark, MongoDB, and more which are described below. Those components enable to stream, store, and analyze data in a way that is agnostic to the sources data come from. So, this very platform can host data from different domains and not only vehicular data that are used for the purposes of this study. Last, but not least, the platform is user-friendly as it is designed as a black box for the users, requiring nothing else than just a “one-click” initialization. The design principles followed for the development of this platform took into consideration the main properties of the big data definition as they mentioned by Andrew McAfee and Erik Brynjolfsson, namely Volume, Velocity, and Variety [
36]. An illustration of the concept and the interconnections of the different modules of this hybrid platform is depicted below in
Figure 1.
The platform, as above mentioned, is modular and consists of multiple components which interact with each other and provide an integrated solution. The platform is actually implemented into an open-source environment alongside with the usage of Flask [
37], a Pythonic microweb framework which renders the process of web application design and deployment much easier. The client-server architecture is essential for the platform implementation and to this end the Flask enables the initialization of the server side. The server enables data transfer between client(s) and the server as well as the implementation of essential back-end operations.
In addition to the Flask server, the hybrid data management module consists of two databases: an SQL and a NoSQL database. The MySQL [
38] is used as a relational database in order to provide near real-time analysis and visualization of the data. On the other hand, the MongoDB [
39] is chosen so as to handle historical and batch analysis as well as management of the gathered data. The development of this hybrid data management scheme is suitable for big data management, manipulation, and analysis operations.
In order to facilitate communication of the hybrid platform with the “outside world”, i.e., sensors and applications in a stable and simple way, a communication interface was properly developed and established. This communication interface hosts multiple different interfaces which operate as REST APIs regarding the data or message streaming between different applications and components. The choice of the REST architecture was performed primarily due to the capability of REST APIs to execute basic communication operations with various types of systems. REST API interfaces receive and send data and/or messages in a two-way communication scheme from and to the hybrid’s data management system databases as well as to vehicles and external applications [
40].
Another basic component for the discussed hybrid data management platform is the big data operational framework. This framework is responsible for the processing and manipulation of the data structures coming from the connected data sources. Hadoop [
41] is the most well-known and widely used framework for big data operations and was the one selected for the purposes of the developed solution. The integration of the Hadoop Ecosystem in the platform offers an interface necessary for the connection and the function of the NoSQL Database as well as for any big data operation required.
Last, but not least, alongside the Hadoop module, the data analysis component is in charge for the analysis of the streamed data. One of its operations is to detect outliers and anomalies among the streaming data so as to indicate possible dangerous or threatening driving behavior. The methods, tools, and algorithms used for this analysis as well as the acquired results are explained in more details in the next sections of this paper.
As already presented above, the hybrid big data platform consists of several different components. These components are all open-source and this ensures that there will not be technological restrictions in terms of availability and updates. Moreover, the use of open-source tools enables the usage of this very platform in different applications and for different scopes and goals. On the other hand, there are some inevitable risks and costs that come with the advantages offered by this architecture. First of all, the higher availability required for the platform together with the minimization of downtimes requires increased hardware resources and thus induces higher operational and maintenance costs. Moreover, the more complex an application the more time consuming the analysis of the data will be. Given that the hardware resources are limited the training and evaluation of machine learning models which have as input complex data will be very time-consuming and in many cases with a high risk of hardware failure. Another risk that should be taken into account considering the data analysis is that the streaming of data many times fails because of faulty streaming equipment or due to network problems and thus this could lead to wrong analysis outcomes and predictions. The network problems can be considered as the main risk for the platform usage. Furthermore, this always-online characteristic of this architecture creates the need for high-level cybersecurity techniques which require continuous and everyday updates and maintenance in order to avoid cyber threats and attacks. The more sensitive the stored data are the more costly the needs for cybersecurity.
4. Dataset and Outlier Detection Methods
The data for this study were collected from four different vehicles, moving in shifts every day, which belong to a major highway operator in Greece. One million data samples from different time periods and without any zero values, so to isolate the moments each vehicle was idle, were randomly selected from each test vehicle. In this way, the entire dataset from the four testing vehicles is comprised from four million values from different time periods. The data for every vehicle are collected and sent to the hybrid platform that was described in
Section 3, every five seconds. Thus, the platform stored over 20 million data points stored in the MongoDB and a sample of four million data entries was extracted for the evaluation purposes, as already mentioned. The structure of the data collected by every vehicle is depicted in
Table 1.
Table 1 depicts the variety of data streamed and gathered from vehicles. Due to the heterogeneity of data and the lack of labels the outlier detection in the collected data will be carried out through a multivariate analysis as an unsupervised problem. In addition to the multivariate analysis, a univariate analysis for outlier detection will also be carried out, focused on the speed values that were acquired through the OBD sensor installed on the vehicle. So, in order to increase the computational efficiency for this specific task of univariate outlier detection, the data samples for “timestamp”, “lat”, “lon”, “vinNumber”, “pendingTrouble”, and “carPlate” were omitted. Thus, the final data structure concerning the univariate outlier detection task contains the data which are presented in
Table 2.
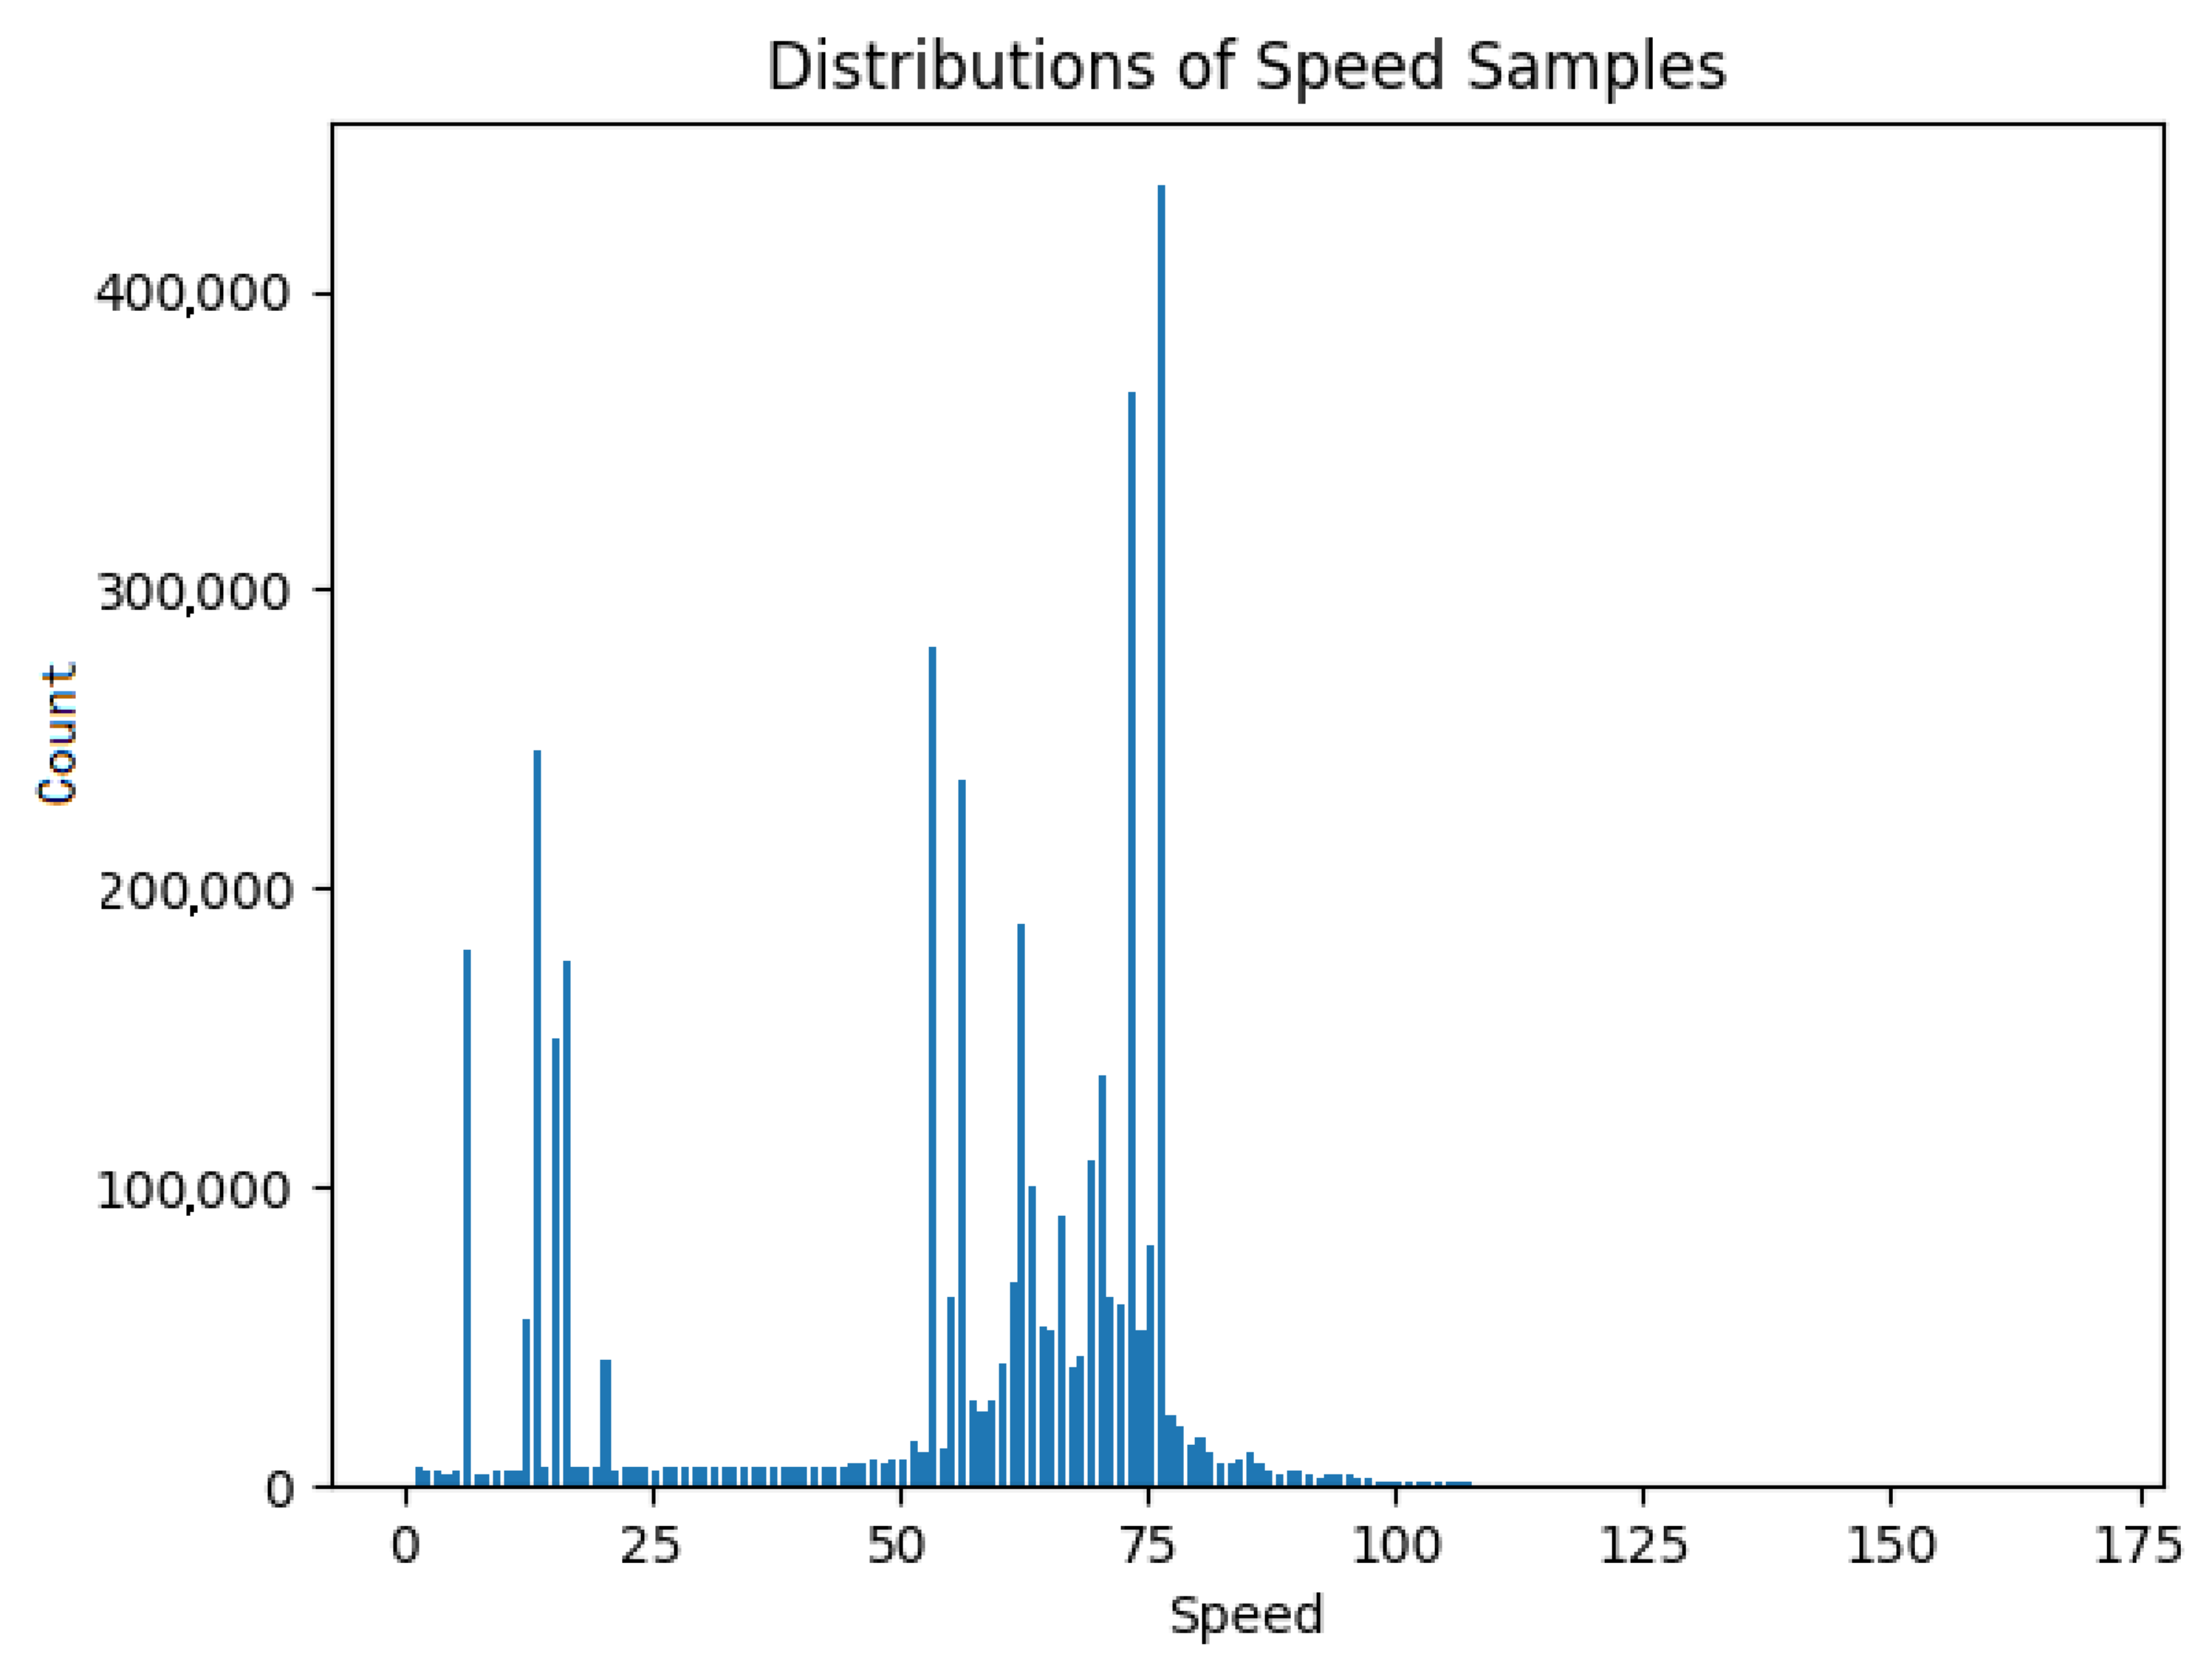
The univariate outlier detection focused mainly on the “speedOBD” metric which is the value of the speed as the latter is calculated by the tachometer of the vehicle. The four million data records for the speed measurement are distributed as presented in
Figure 2.
As can be seen from
Figure 2, most values are located between 50 and 80 km/h. This fact is absolutely reasonable since the four considered vehicles are, most of the time, moving on a highway with a maximum speed limit of 120 km/h. Moreover, these vehicles, as already mentioned, belong to the highway operator so most of the time they are on the move they inspect the highway for maintenance and emergency reasons. A summary of the studied dataset is included in
Table 3.
The gathered data were analyzed through selected outlier detection algorithms running in the same hardware specifications. The algorithms selected as suitable for the purposes of univariate analysis are: (i) Kernel SVM; (ii) i-Forest; (iii) MCD; (iv) KNN; (v) LOF, and (vi) Z-score. Moreover, for the multivariate analysis, the algorithms selected follow both statistical and machine learning approaches. The Mahalanobis Distance method was chosen for the statistical approach of the multivariate analysis while for the machine learning approach the algorithms tested are i-Forest, LOF, DBSCAN, and Elliptic Envelope. All of the aforementioned algorithms, as mentioned in
Section 2, are widely used for outlier and anomaly detection purposes. The analysis for each and every algorithm deployed was performed by the data analysis component of the hybrid platform presented in
Section 3. The data acquired from the vehicles were transmitted through the REST API and were then stored in the MongoDB which interfaces with the component featuring the Hadoop framework and also the data analysis functionality.
As far as the univariate outlier detection is concerned, it is worth mentioning that because of the fact that the data is unlabeled and the aim of this study is to test and evaluate different machine learning algorithms so as to identify which one is the best for this specific dataset a rule-based method is engaged in order to label the dataset. In this way, by labelling the data, the unsupervised learning problem is transformed to a supervised one. In order to define the predicted anomalies residing in the dataset under the speed weight variable, extra data need to be analyzed following the addition of scores and anomaly columns. Consequently, a rule was issued to every algorithm introducing the fact that data points with speed values under 15 km/h and over 130 km/h should be considered as outliers. According to this rule, there are 13.471% outliers in the given dataset. Given that the above rule was defined according to experts’ opinion and taking into account that the vehicles move in a highway with speed limit up to 120 km/h, the values that are labelled as outliers in the given dataset match the actual outliers in terms of speed, and thus every datapoint is labelled as normal or outlier. This procedure transformed the problem from unsupervised to supervised and the new labelled dataset will be used for benchmarking purposes of the tested univariate outlier detection algorithms. This procedure was applied only for the univariate analysis of outliers presented in
Section 5 with the labelling of data aiming to aid the selection of the appropriate machine learning algorithm for the considered dataset in order to be trained and used for future real-time analysis of new datapoints. The evaluation procedure and the metrics for the univariate outlier detection in terms of speed are discussed in detail in
Section 5.
In addition to univariate analysis and considering that the vehicular data streaming from the vehicles to the hybrid platform, presented in
Section 3, contain measurements of several different parameters, as shown in
Table 1, a multivariate analysis using statistical and unsupervised machine learning algorithms was carried out. This analysis is suitable for outlier detection in timeseries data such the ones used for the purposes of this study. The multivariate analysis is suitable for the type of problem considered in this study but due to its specific characteristics the metrics applied differ from the ones used for the univariate analysis since the dataset does not contain any labels and there is not a concrete method or a rule to add labels to the dataset similar to the speed rule applied for the univariate analysis. In the next section, the results acquired from the application of each aforementioned algorithms are presented in detail.
6. Conclusions
The aim of this study was to research and present a proof-of-concept approach for outlier detection in vast data streams of vehicular data by testing and evaluating different related methods. To this end, this paper presented a study of several outlier detection methods (commonly known as anomaly detection methods) and algorithms using advanced machine learning techniques. In the context of this study, various machine learning algorithms were presented, implemented, applied, and evaluated in order to decide which is the best approach for outlier detection analysis in the context of driver behavior analysis. The MCD algorithm demonstrated remarkable results regarding the metrics of accuracy, F1-score, MAE as well as the required execution time for the univariate outlier detection approach. The exhaustive testing processes performed in the context of this study for the univariate analysis, as well as the tools developed for the hybrid platform presented in
Section 3, underpin the conclusion that through the proper choice of the deployed algorithm, the outlier detection process could achieve high levels of accuracy and could be conducted in real-time given that a properly pre-trained model is engaged. As far as the multivariate analysis is concerned, the machine learning algorithms featured similar results, with the exception of the LOF algorithm, in terms of the percentage of outliers as well as the required execution time.
Moreover, the outlier detection empowers administration and operational centers as well as enhances drivers’ situation awareness for possible emergency or dangerous situations. Furthermore, this outlier detection process alongside with the other modules of the platform utilizing state-of-the-art technologies such as big data and machine learning analytics set the base for an innovative ITS platform which could expand the boundaries of current systems.
In the future, the authors of the present study plan to continue the validation of the employed models by expanding the current dataset with additional measurements. All tools presented in this study focus on vehicle data and outlier detection but, through further development and study of semantic analysis algorithms as well as specific use cases, these tools can be expanded to other domains as well. Moreover, a future direction for the outlier detection process is to engage pre-trained machine learning models, so as to enable real-time outlier detection. In addition, it would be very helpful for the road network operators as well as for the drivers to incorporate different types of analysis alongside outlier detection, so as to gain broader insights into the driver behavior and the road network condition and events. In this direction, driver profiling methods as well as Complex Event Processing (CEP) techniques would offer advanced analysis capabilities to end-users and would assist them in gaining detailed insights on ongoing emergencies on the road network as well as prevailing dangerous conditions. The indication of emergencies and dangerous conditions might also be improved by combining results of analysis on expanded data, such as environmental data, emergency call data, and other related information.


