Analysis of the Deviation Factors between the Actual and Test Fuel Economy
Abstract
1. Introduction
- Urban (Low, up to 56.5 km/h);
- Suburban (Medium, up to 76.6 km/h);
- Rural (High, up to 97.4 km/h);
- Highway (Extra-high, up to 131.3 km/h).
2. Materials and Methods
- Car model (fixed effect);
- Car model + regional characteristics (average temperature and average travel speed);
- Car model + regional characteristics + drivers (random effect).
- (1)
- E-NENPI
- No prefecture/zip code listed;
- No description of mileage or 0;
- Refueling amount exceeds 97-L;
- The mileage is 60 km or less.
- (2)
- Japan Meteorological Agency
- (3)
- NAVITIME (https://www.navitime.co.jp/ (accessed on 21 April 2021))
3. Results
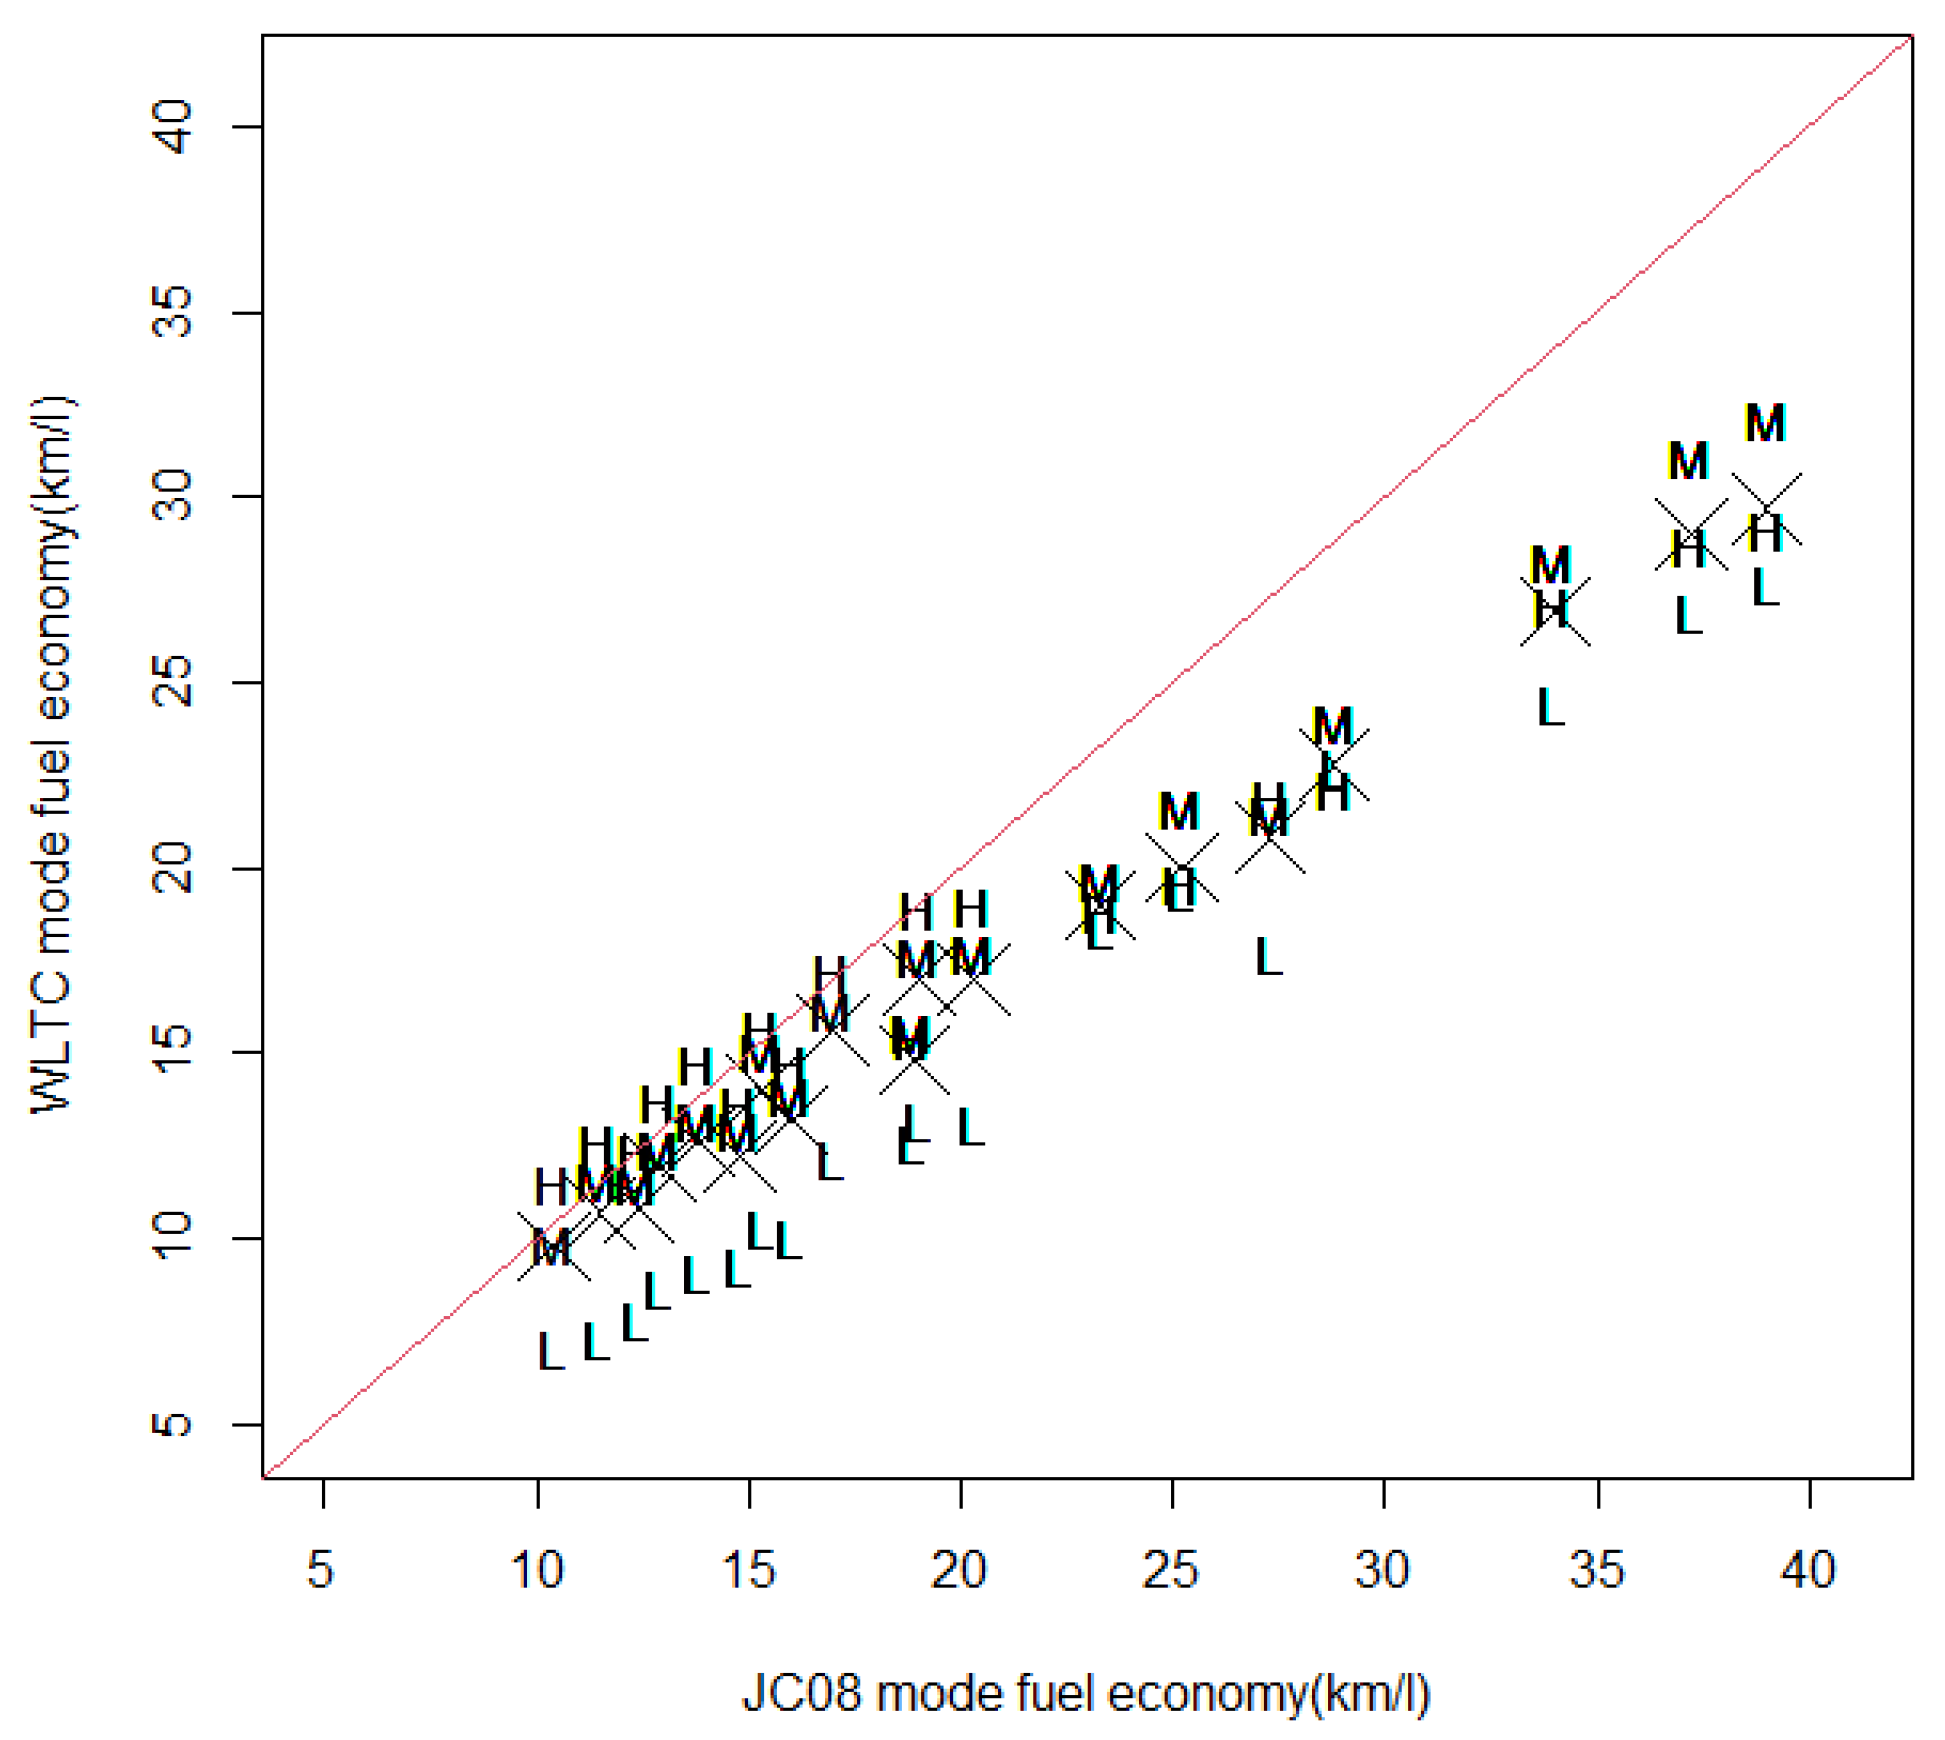
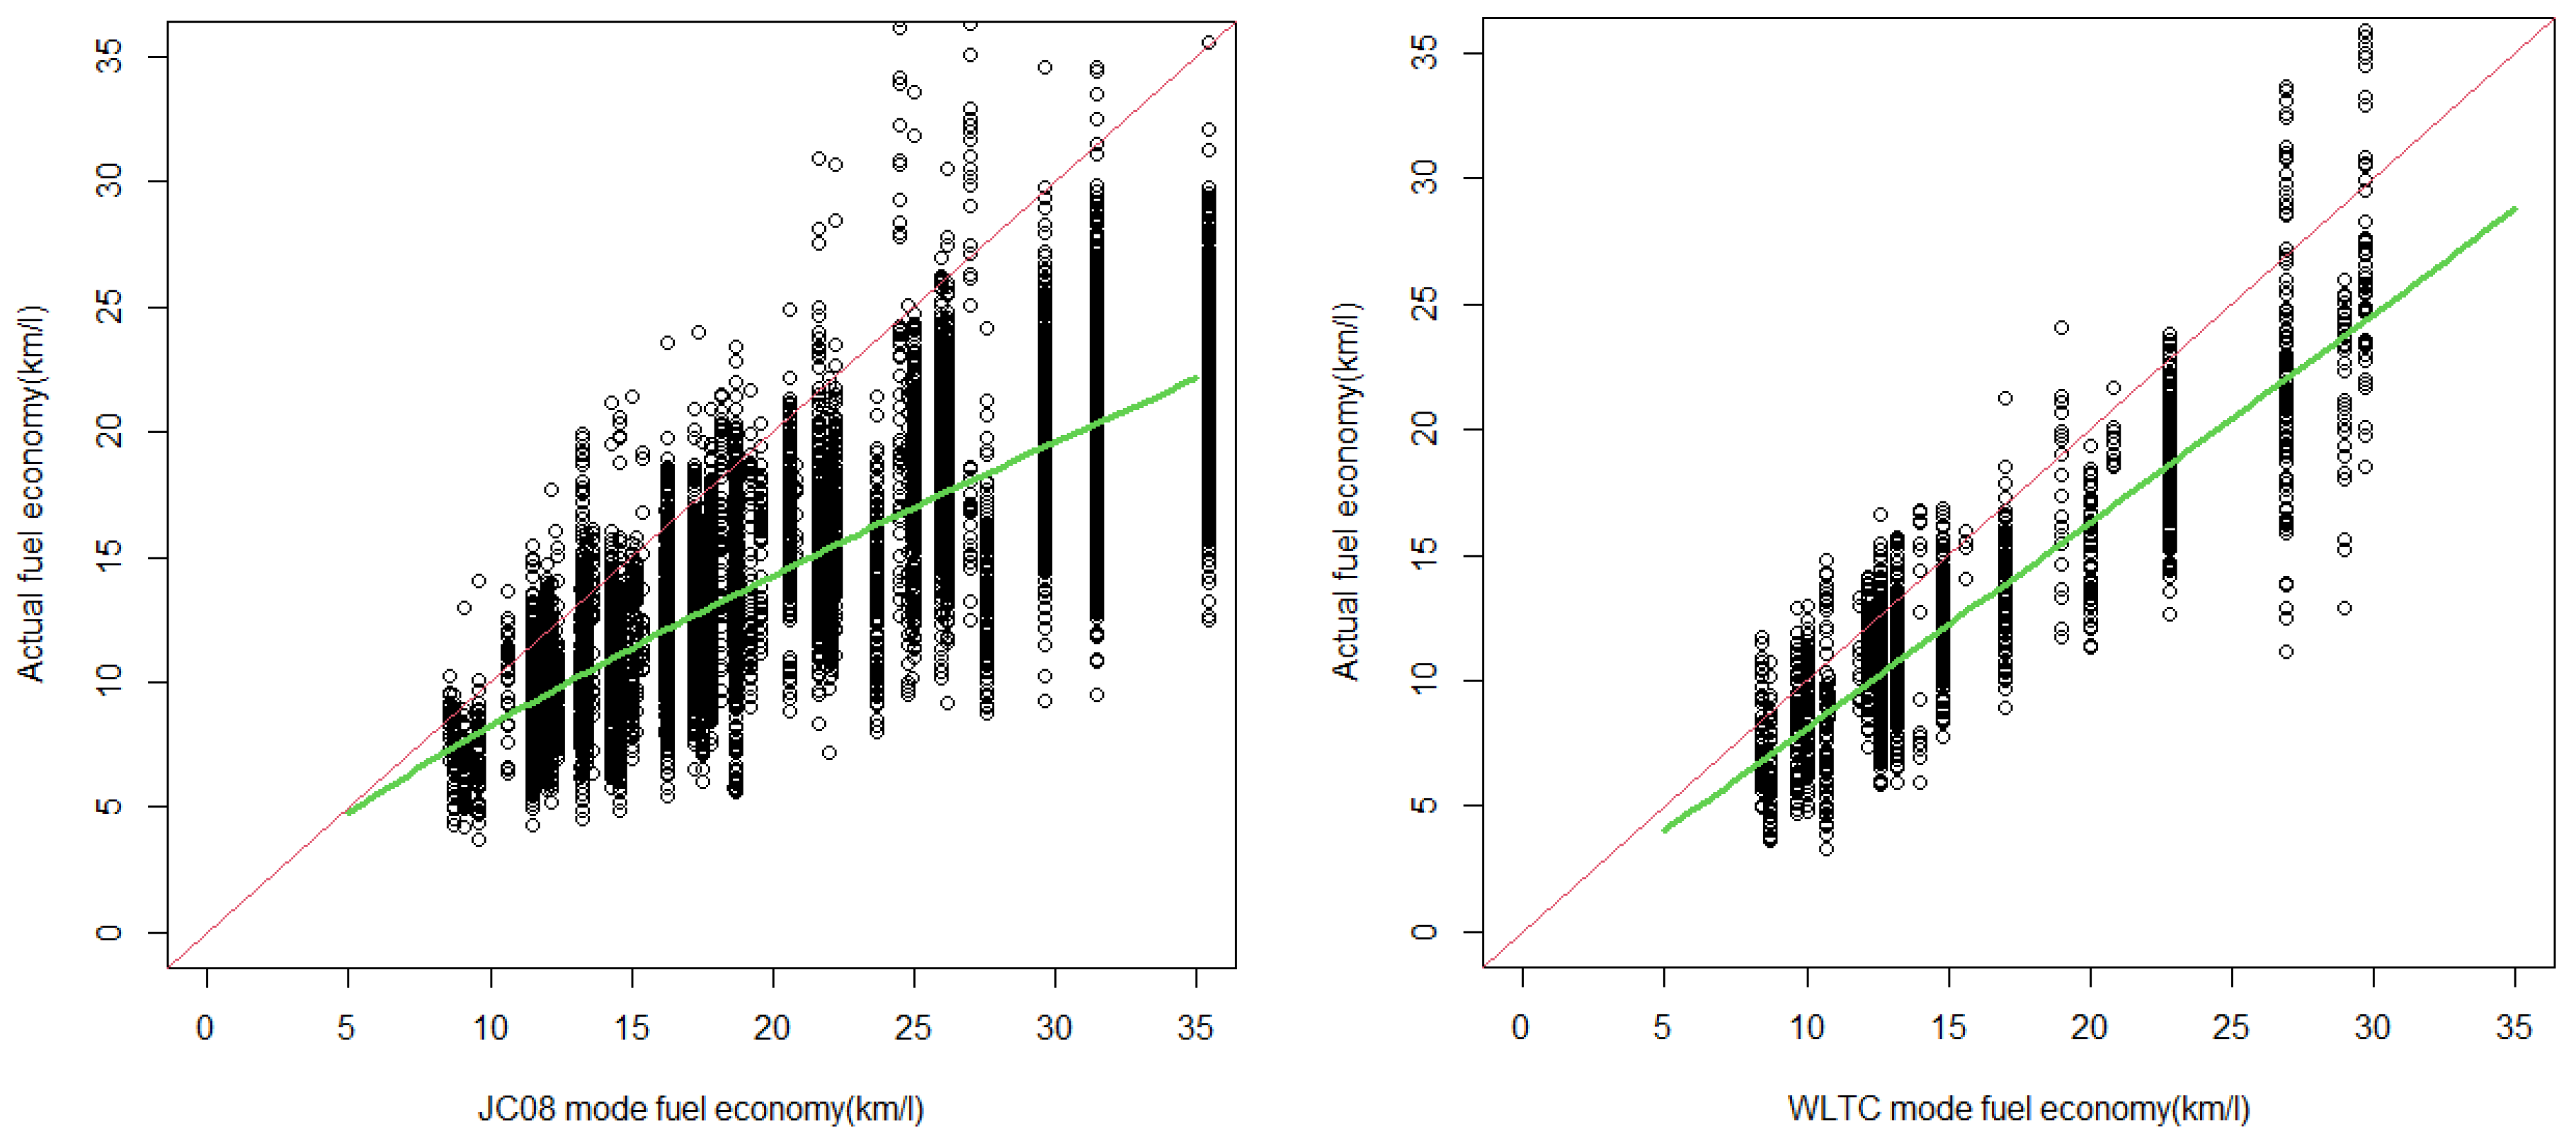
3.1. Comparison of Actual and Test Fuel Economy
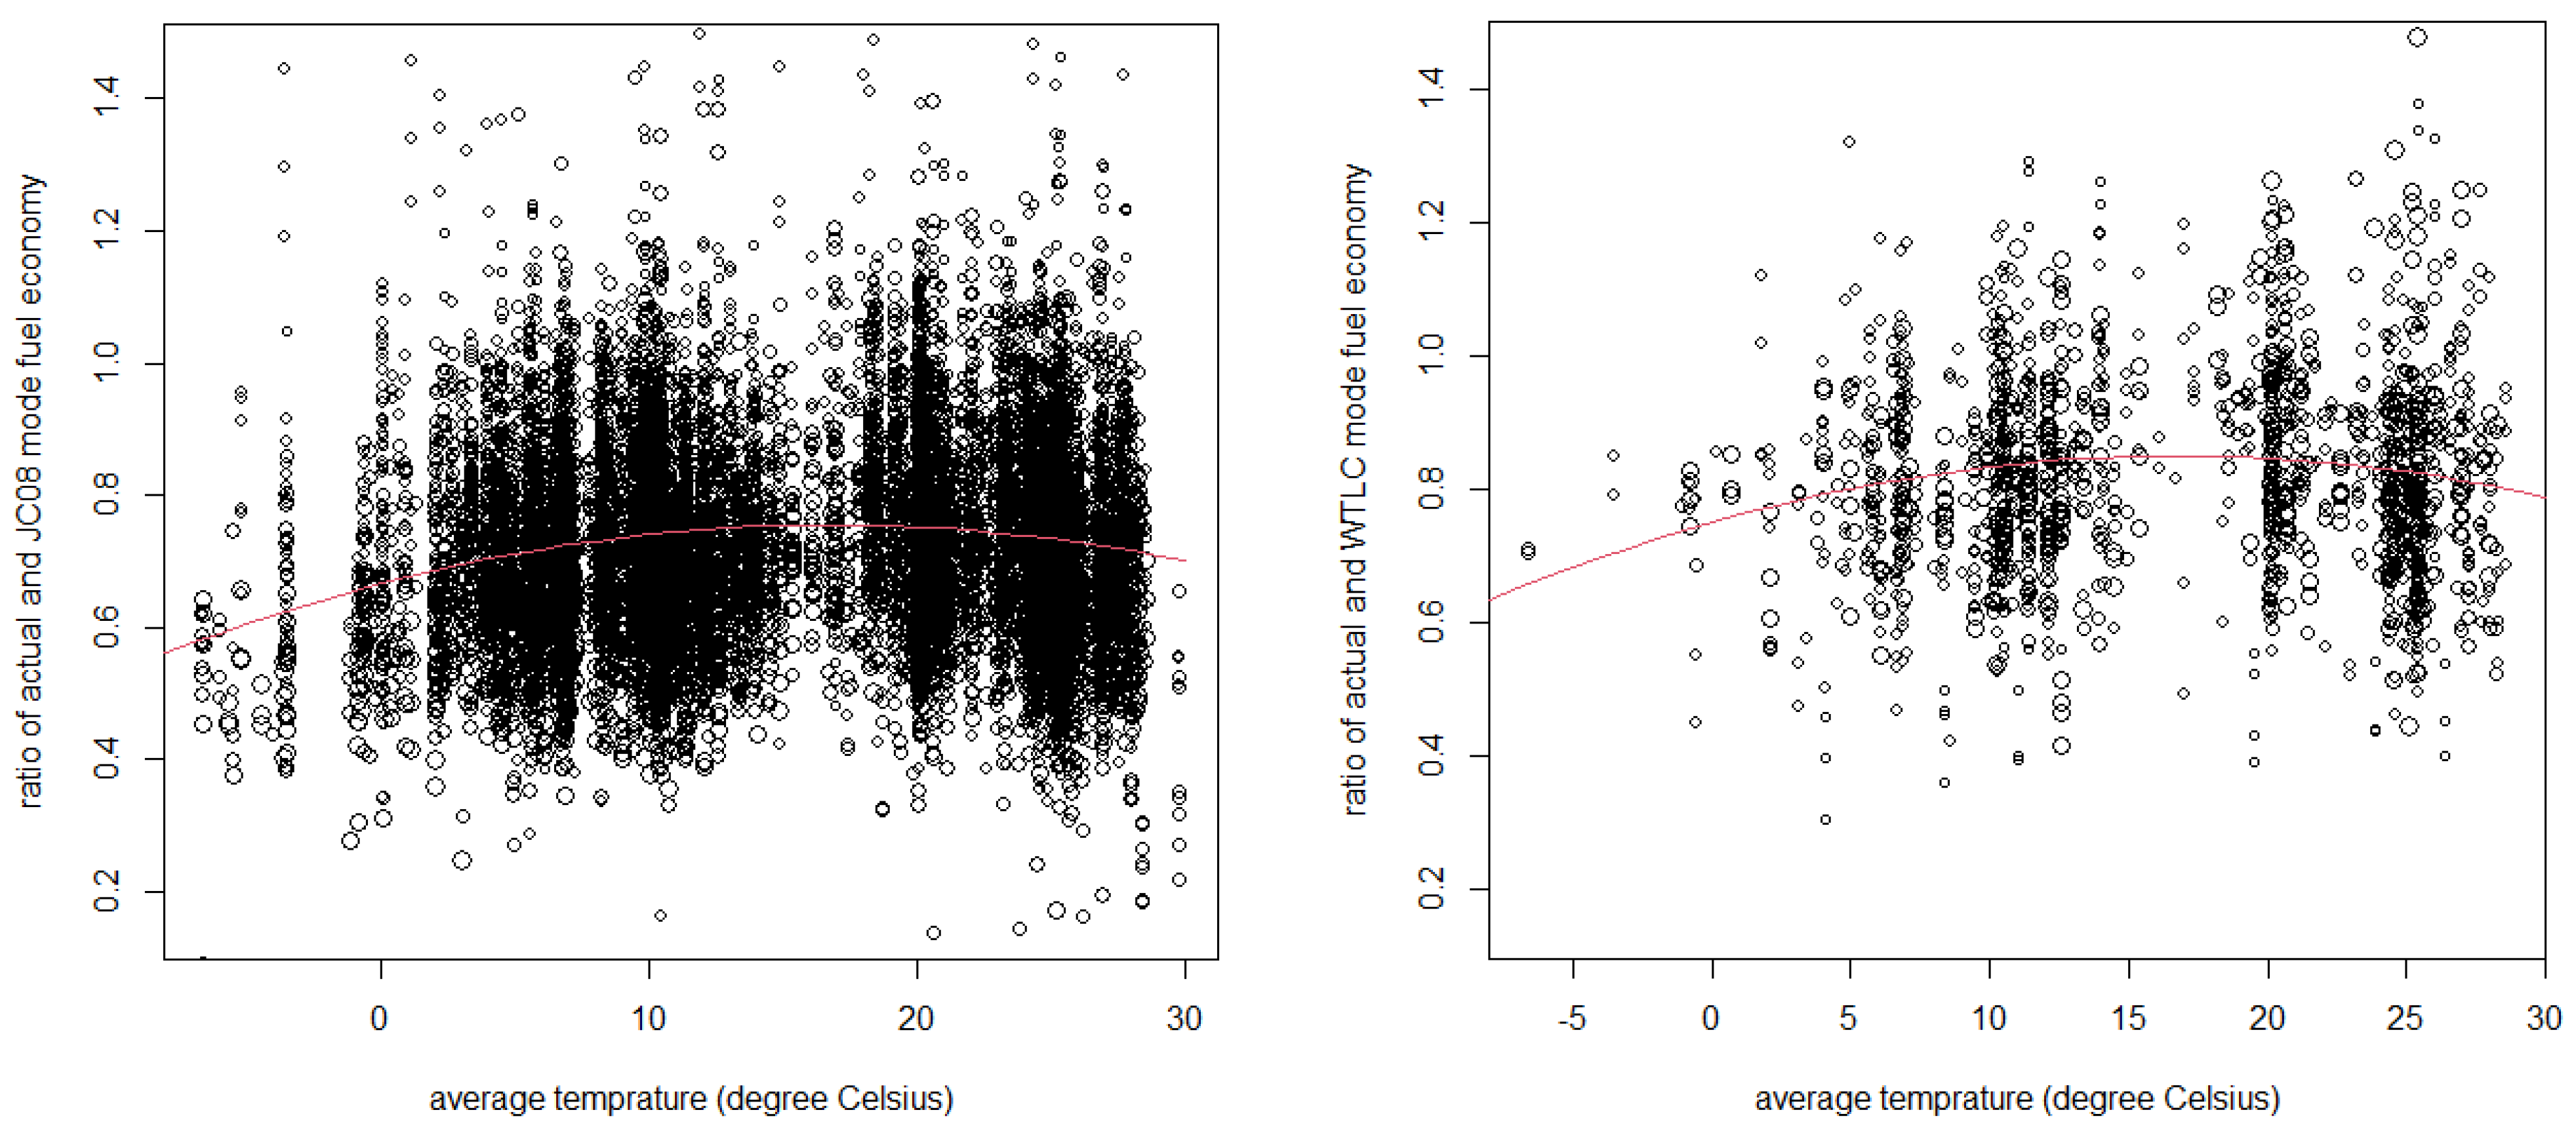
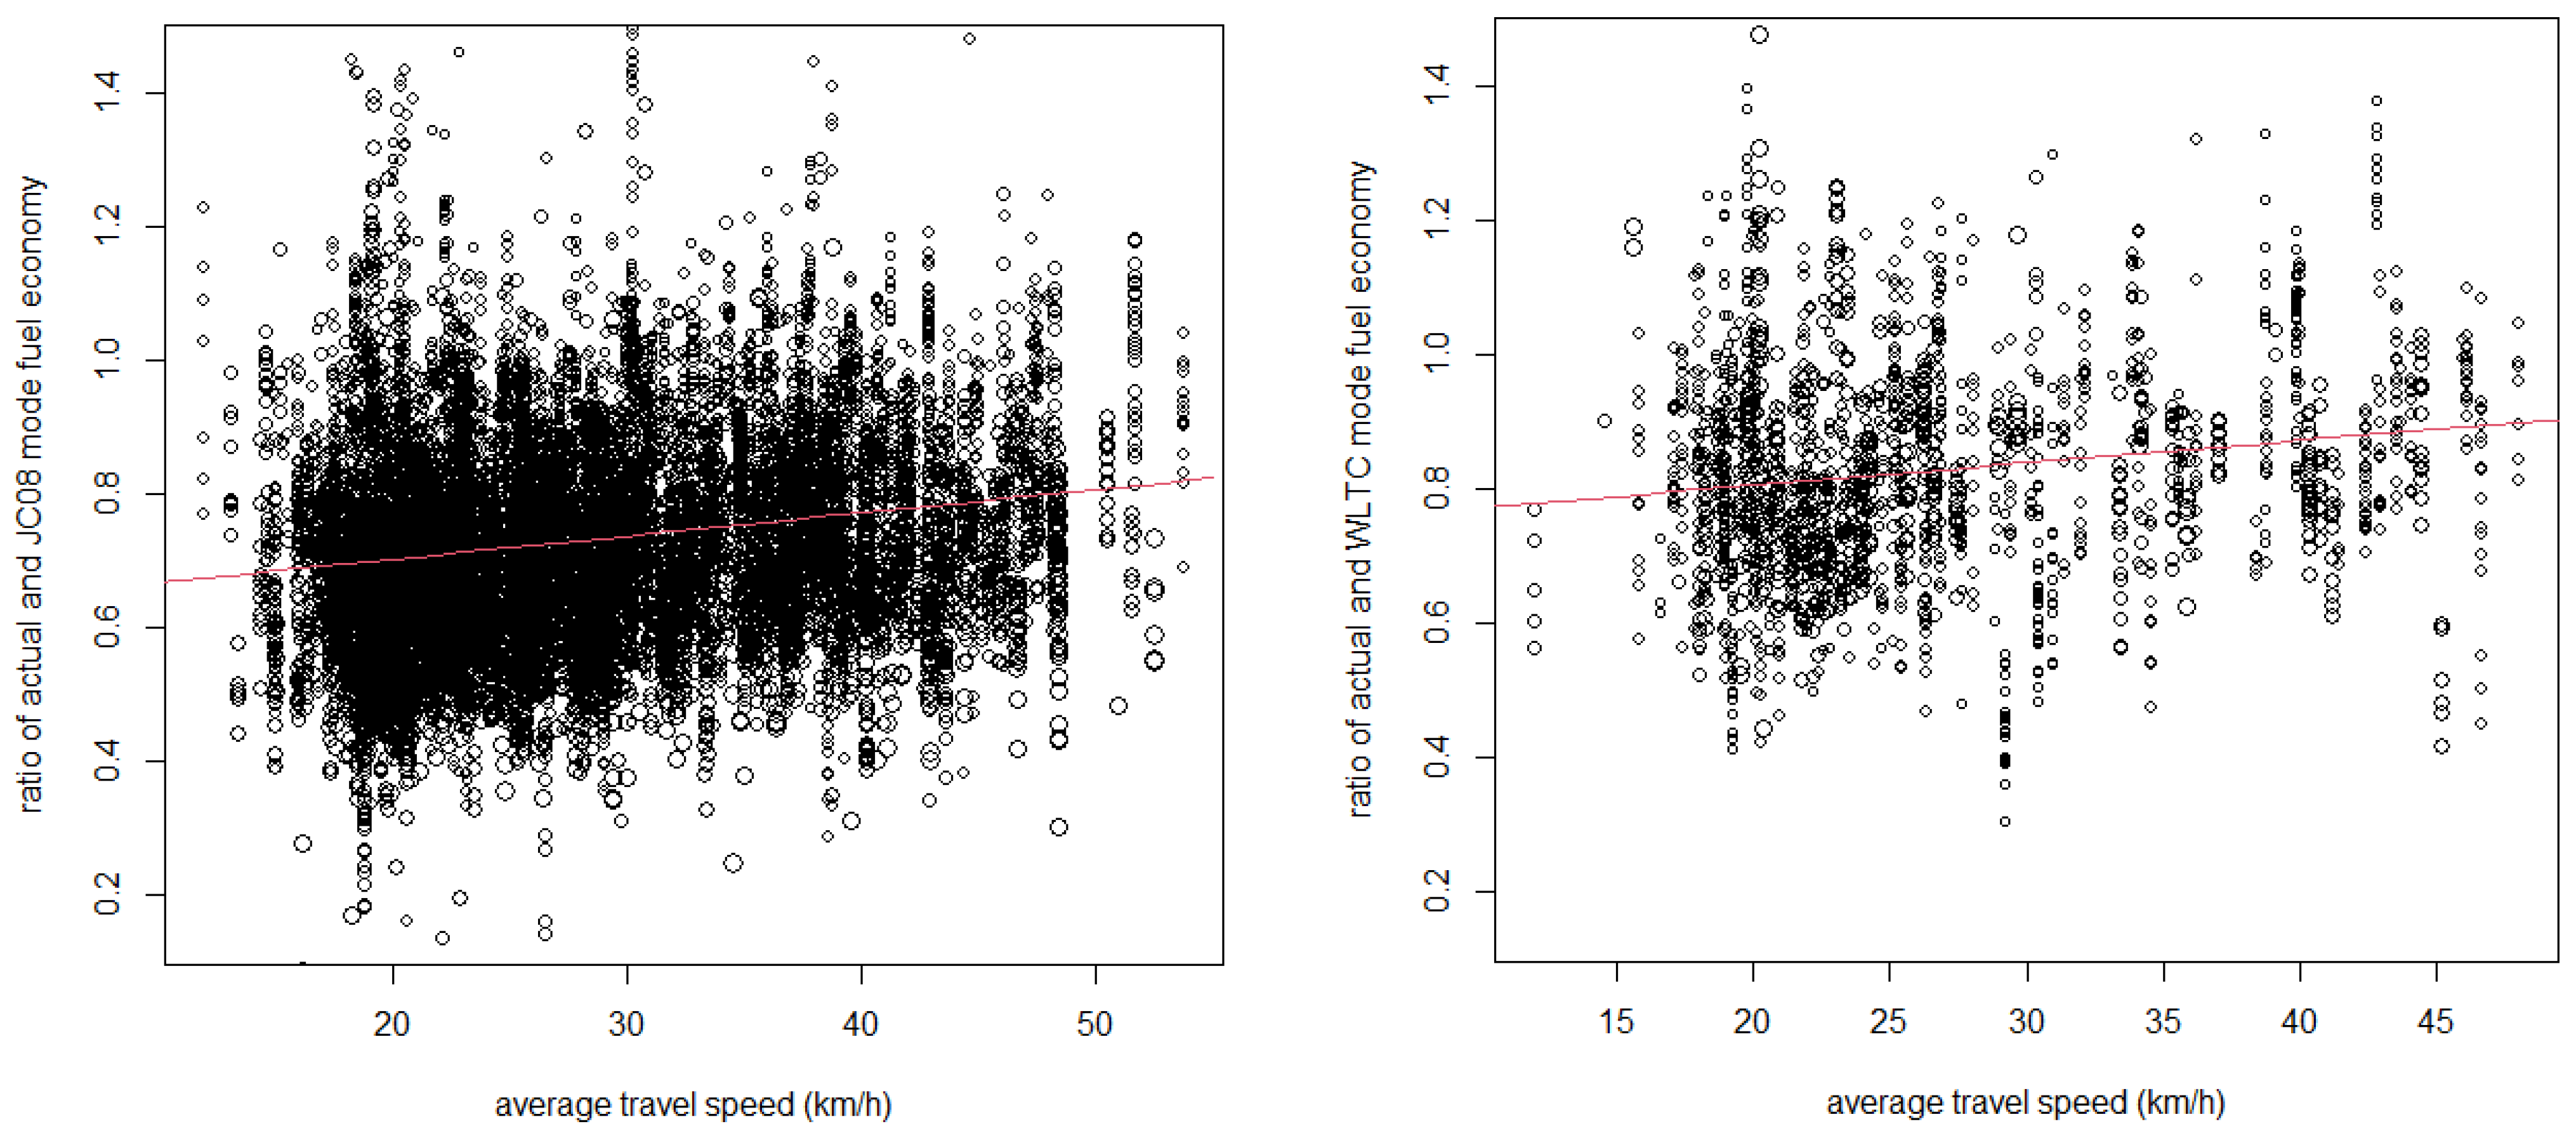
3.2. Impact of Average Temperature and Travel Speed on the Deviation
4. Discussion
5. Conclusions
- -
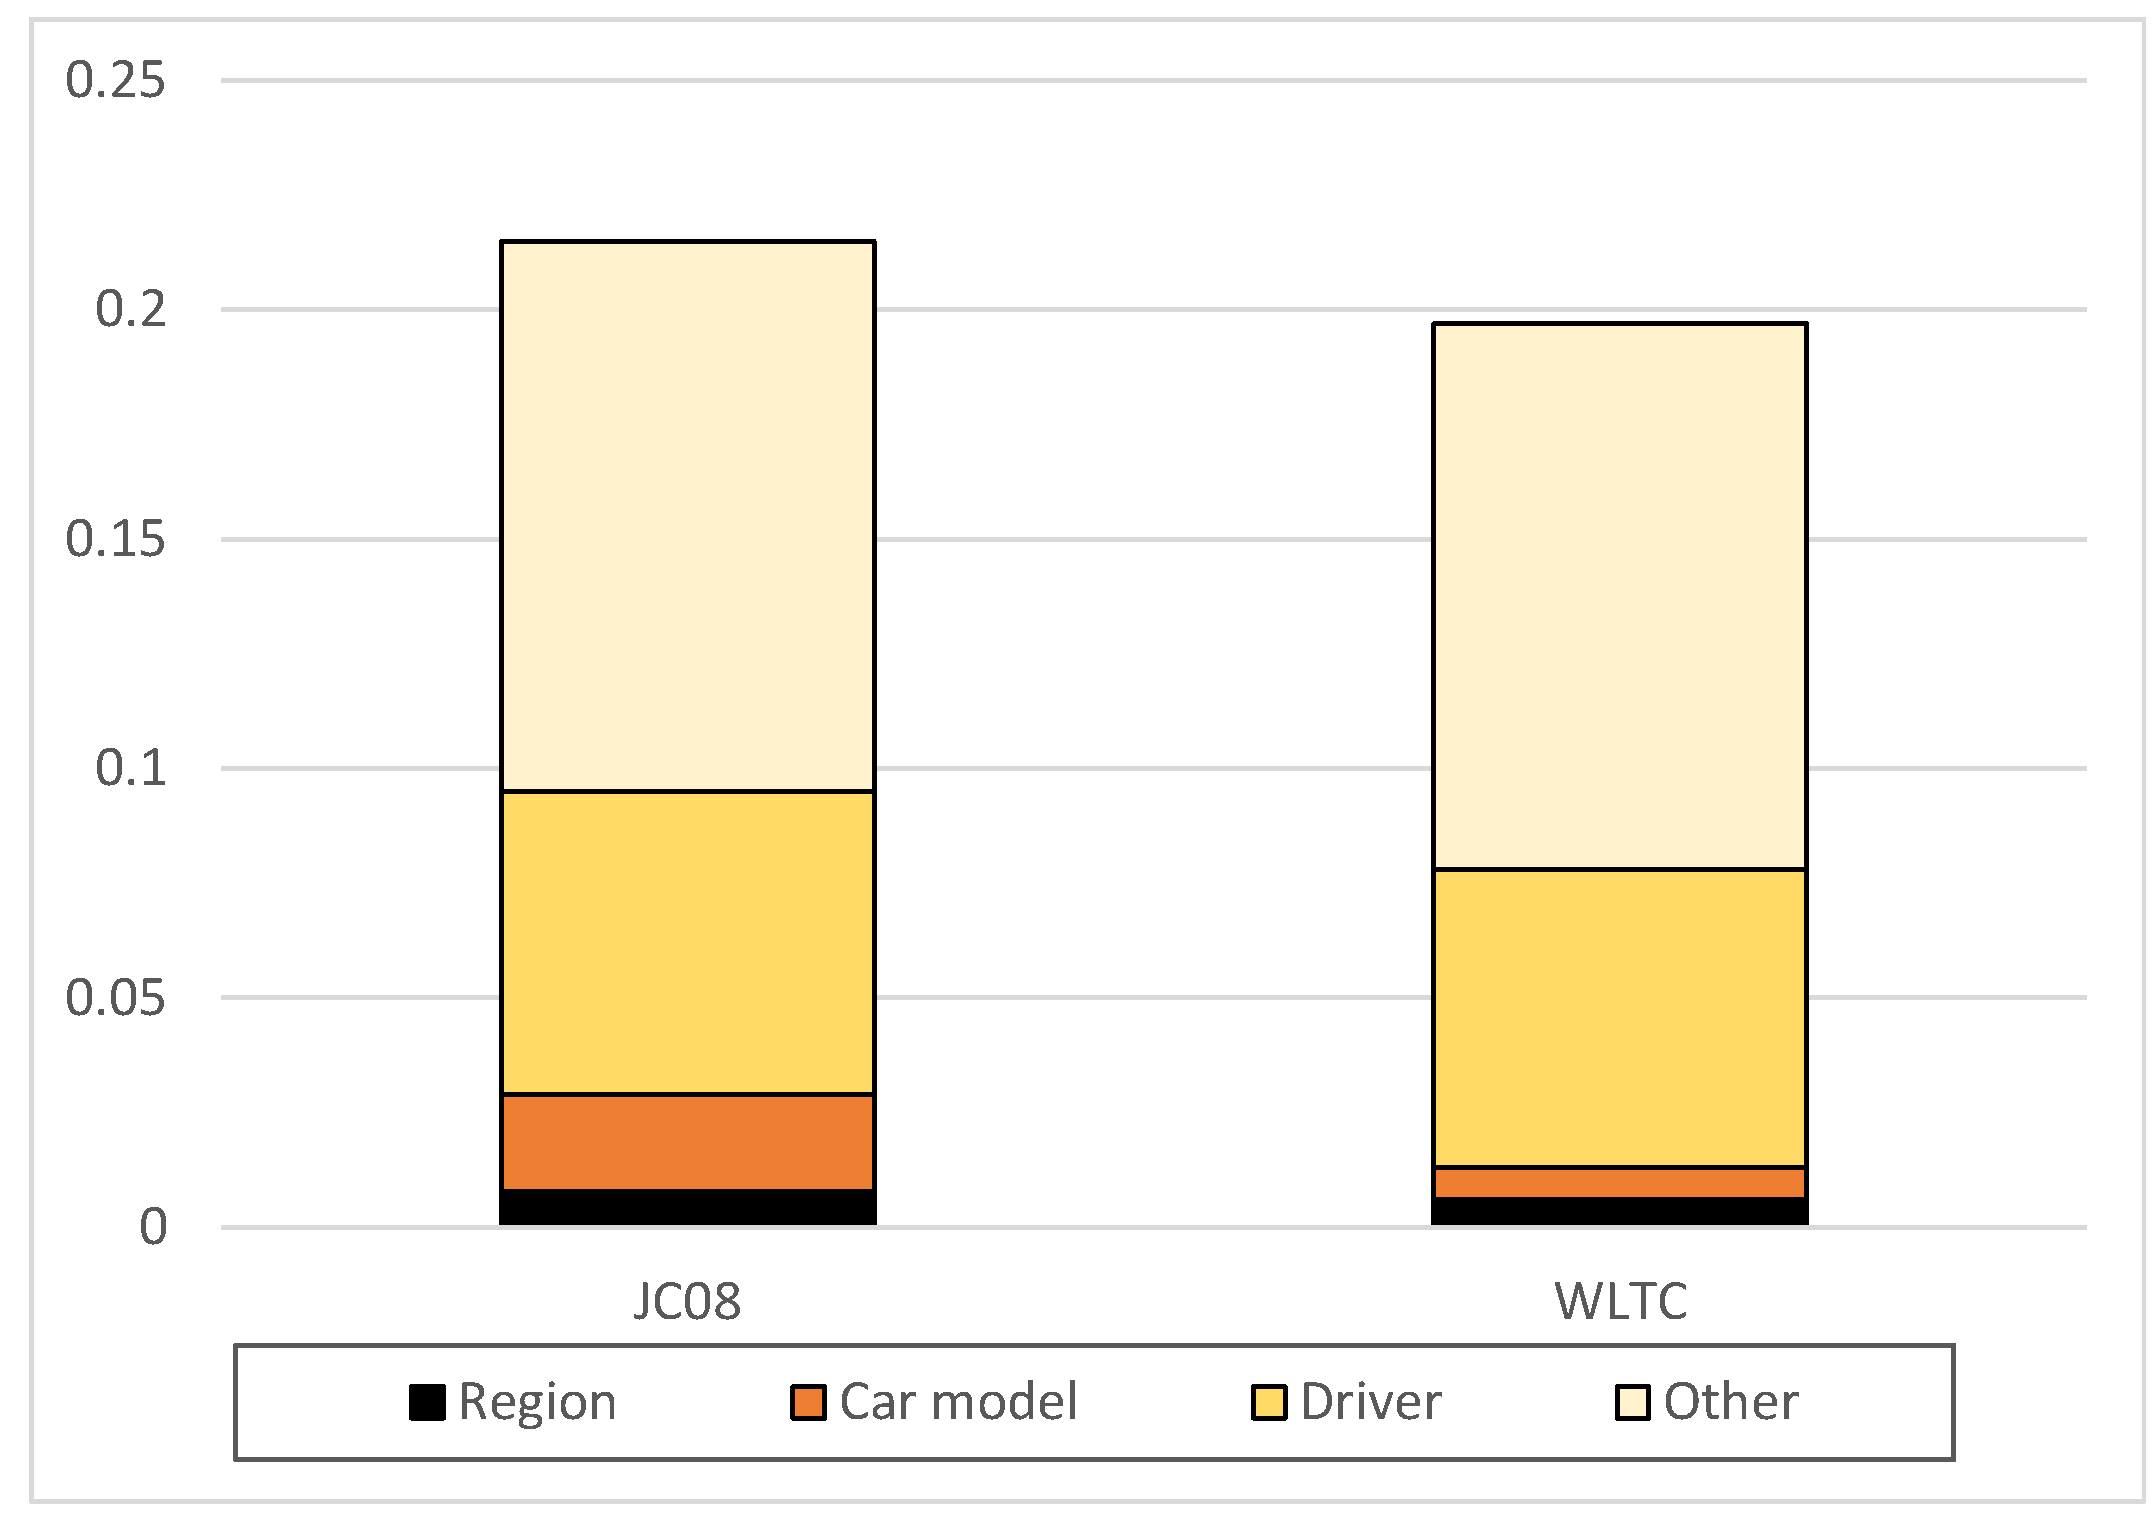
- JC08 mode fuel economy: The better the test fuel economy, the larger the deviation between the actual and test fuel economy.
- -
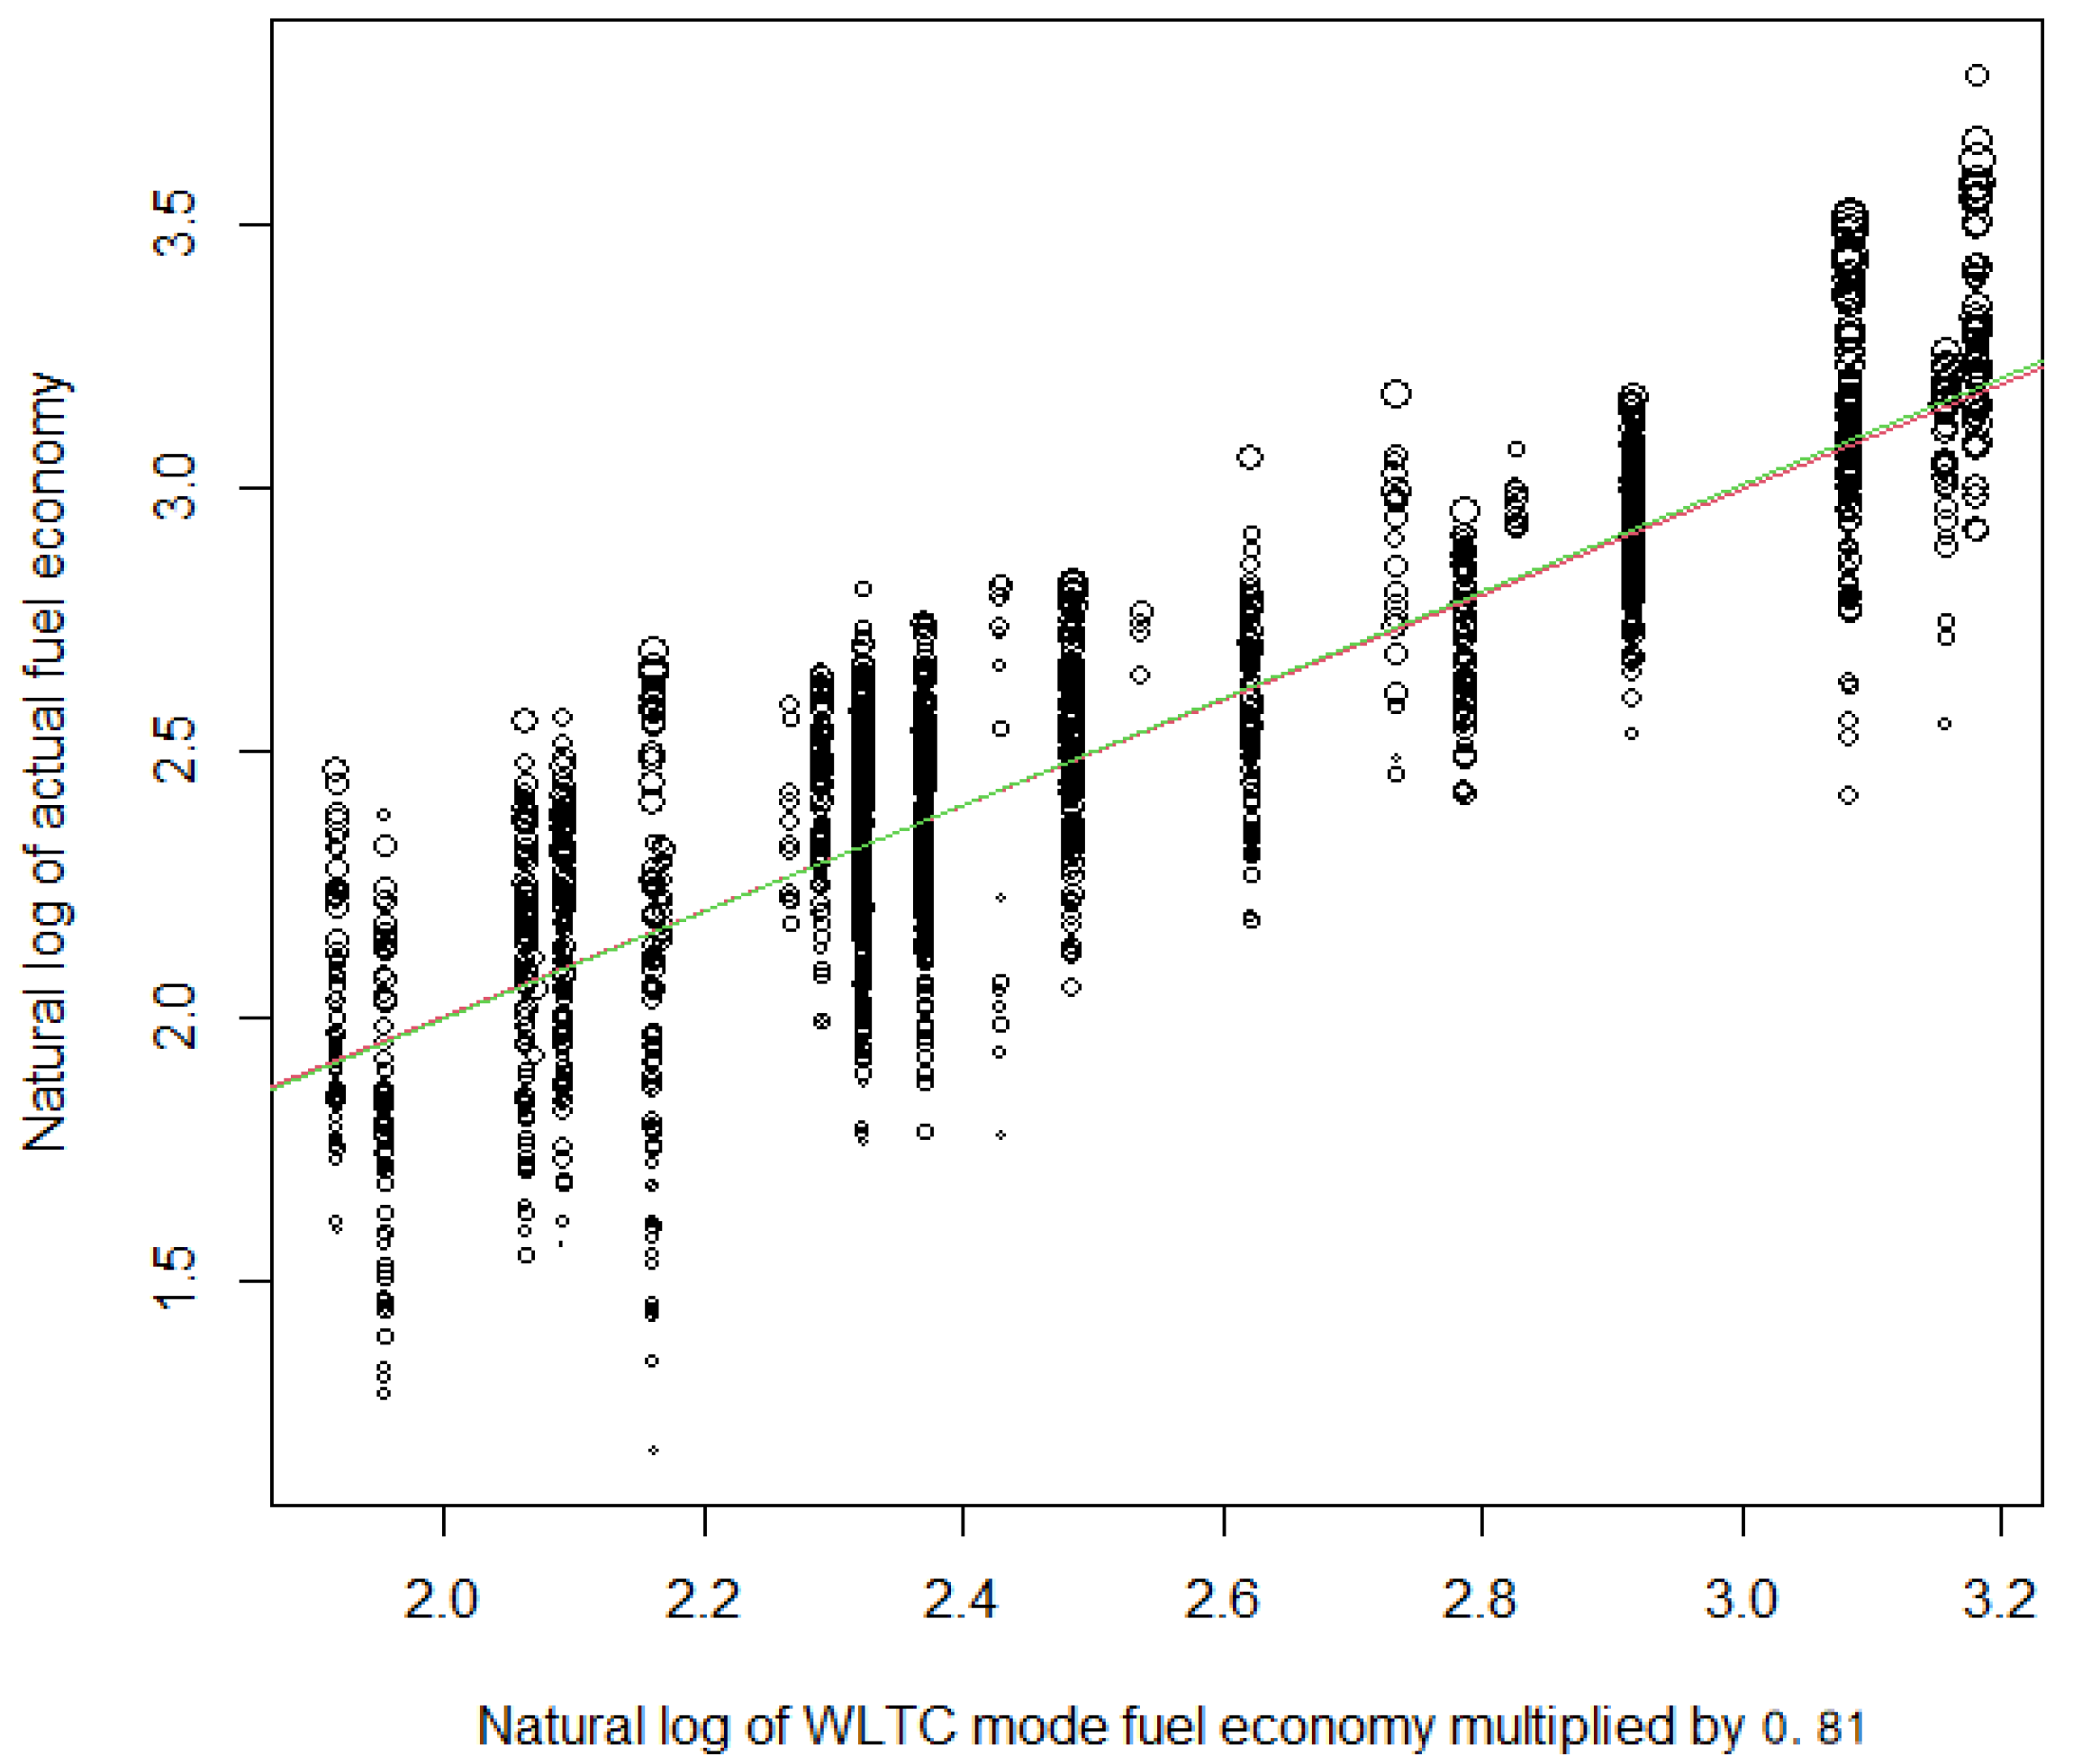
- WLTC mode fuel economy: The deviation is almost constant regardless of the test fuel economy, but there is still a deviation of about 19%.
- -
- The effect of deviation due to average travel speed and temperature is only 8%.
Author Contributions
Funding
Institutional Review Board Statement
Informed Consent Statement
Data Availability Statement
Acknowledgments
Conflicts of Interest
References
- Greene, D.L.; Khattak, A.J.; Liu, J.; Wang, X.; Hopson, J.L.; Goeltz, R. What is the evidence concerning the gap between on-road and Environmental Protection Agency fuel economy ratings? Transp. Policy 2017, 53, 146–160. [Google Scholar] [CrossRef]
- Lim, J.; Lee, Y.; Kim, K.; Lee, J. Experimental analysis of calculation of fuel consumption rate by on-road mileage in a 2.0 L gasoline-fueled passenger vehicle. Appl. Sci. 2018, 8, 2390. [Google Scholar] [CrossRef]
- Sano, M.; Ohno, E.; Kotake, T. Analysis of the gap between on-road real fuel economy and certified fuel economy using the Data Collected by the Web. Trans. Soc. Automot. Eng. Jpn. 2010, 41, 745–750. (In Japanese) [Google Scholar]
- Lee, Y.K.; Park, J.I.; Lee, J.H. Analysis of the effect of cold start on fuel economy of gasoline automatic transmission vehicle. Int. J. Automot. Technol. 2014, 15, 709–714. [Google Scholar] [CrossRef]
- Zacharof, N.G.; Fontaras, G.; Ciuffo, B.; Tsiakmakis, S.; Anagnostopoulos, K.; Marotta, A.; Pavlovic, J.; Codrea, C.; Hodgson, I. Review of in use factors affecting the fuel consumption and CO2 emissions of passenger cars. JRC Sci. Policy Rep. 2016. [Google Scholar] [CrossRef]
- Fontaras, G.; Zacharof, N.; Ciuffo, B. Fuel consumption and CO2 emissions from passenger cars in Europe—Laboratory versus real-world emissions. Prog. Energy Combust Sci. 2017, 60, 97–131. [Google Scholar] [CrossRef]
- Jimenez, J.L.; Valido, J.; Molden, N. The drivers behind differences between official and actual vehicle efficiency and CO2 emissions. Transp. Res. Part D 2019, 67, 628–641. [Google Scholar] [CrossRef]
- Pavlovic, J.; Fontaras, G.; Ktistakis, M.; Anagnostopoulos, K.; Komnos, D.; Ciuffo, B.; Clairotte, M.; Valverde, V. Understanding the origins and variability of the fuel consumption gap: Lessons learned from laboratory tests and a real-driving campaign. Environ. Sci. Eur. 2020, 32, 53. [Google Scholar] [CrossRef]
- Pavlovic, J.; Ciuffo, B.; Fontaras, G.; Valverde Morales, V.; Marotta, A. How much difference in type-approval CO2 emissions from passenger cars in Europe can be expected from changing to the new test procedure (NEDC vs. WLTP)? Transp. Res. Part A Policy Pract. 2018, 111, 136–147. [Google Scholar] [CrossRef]
- Pathak, S.K.; Sood, V.; Singh, Y.; Channiwala, S.A. Real world vehicle emissions: Their correlation with driving parameters. Transp. Res. Part D Transp. Environ. 2016, 44, 157–176. [Google Scholar] [CrossRef]

| Test Cycle Mode | Samples | Car Model | Postal Code | Drivers |
|---|---|---|---|---|
| JC08 | 12,169 | 52 | 579 | 1035 |
| WLTC | 1840 | 19 | 152 | 182 |
| Min. | Mean | Max. | s.d. | |
|---|---|---|---|---|
| JC08 (km/L) | 8.6 | 21.27 | 35.4 | 7.5 |
| WLTC (km/L) | 9.8 | 16.84 | 29.7 | 5.6 |
| Urban (km/L) | 7.1 | 14.31 | 27.7 | 6.5 |
| Suburban (km/L) | 9.9 | 17.76 | 32.1 | 6.0 |
| Rural (km/L) | 11.5 | 17.81 | 29.1 | 4.8 |
| Actual (km/L) | 3.7 | 15.1 | 44.0 | 5.1 |
| Distance to refueling (km) | 77 | 467 | 1403 | 196 |
| Amount of refueling (liter) | 4.6 | 35.2 | 74.2 | 11.6 |
| Average temperature (°C) | −6.6 | 15.6 | 29.8 | 8.2 |
| Average travel speed (km/h) | 12 | 28.4 | 53.8 | 8.5 |
| JC08 | 1: Car Model | 2: +Regional Factors | 3: +Random Effect of Drivers | |||
|---|---|---|---|---|---|---|
| Fixed effect | Coef. | t-value | Coef. | t-value | Coef. | t-value |
| Intercept | −2.48 × 10⁻¹ | −30.94 | −5.46 × 10⁻¹ | −39.95 | −5.42 × 10⁻¹ | −18.84 |
| Average temperature | 1.67 × 10⁻² | 17.34 | 1.66 × 10⁻² | 24.31 | ||
| (Average temperature)2 | −5.14 × 10⁻⁴ | −16.55 | −4.89 × 10⁻⁴ | −22.50 | ||
| Average travel speed | 3.73 × 10⁻³ | 14.48 | 3.20 × 10⁻³ | 4.73 | ||
| Car model dummy | YES | |||||
| Random effect | Std. dev. | |||||
| Driver | 0.14 | |||||
| Number of samples | 12,169 | |||||
| Adj. R-squared | 0.27 | 0.33 | 0.74 | |||
| BIC | −4716 | −5461 | −11,814 | |||
| WLTC | 1: car model | 2: + regional factors | 3: + random effect of drivers | |||
| Fixed effect | Coef. | t-value | Coef. | t-value | Coef. | t-value |
| Intercept | −3.30 × 10⁻¹ | −14.86 | −6.25 × 10−0 | −16.68 | −5.50 × 10⁻¹ | −8.35 |
| Average temperature | 1.95 × 10⁻² | 6.94 | 2.05 × 10⁻² | 9.95 | ||
| (Average temperature)2 | −5.66 × 10⁻⁴ | −6.49 | −6.09 × 10⁻⁴ | −9.58 | ||
| Average travel speed | 4.54 × 10⁻³ | 6.47 | 4.16 × 10⁻³ | 2.35 | ||
| Car model dummy | YES | |||||
| Random effect | Std. dev. | |||||
| Driver | 0.14 | |||||
| Number of samples | 1840 | |||||
| Adj. R-squared | 0.09 | 0.14 | 0.63 | |||
| BIC | −581 | −658 | −1458 | |||
Publisher’s Note: MDPI stays neutral with regard to jurisdictional claims in published maps and institutional affiliations. |
© 2021 by the authors. Licensee MDPI, Basel, Switzerland. This article is an open access article distributed under the terms and conditions of the Creative Commons Attribution (CC BY) license (https://creativecommons.org/licenses/by/4.0/).
Share and Cite
Tanishita, M.; Kobayashi, T. Analysis of the Deviation Factors between the Actual and Test Fuel Economy. Vehicles 2021, 3, 162-170. https://doi.org/10.3390/vehicles3020010
Tanishita M, Kobayashi T. Analysis of the Deviation Factors between the Actual and Test Fuel Economy. Vehicles. 2021; 3(2):162-170. https://doi.org/10.3390/vehicles3020010
Chicago/Turabian StyleTanishita, Masayoshi, and Takashi Kobayashi. 2021. "Analysis of the Deviation Factors between the Actual and Test Fuel Economy" Vehicles 3, no. 2: 162-170. https://doi.org/10.3390/vehicles3020010
APA StyleTanishita, M., & Kobayashi, T. (2021). Analysis of the Deviation Factors between the Actual and Test Fuel Economy. Vehicles, 3(2), 162-170. https://doi.org/10.3390/vehicles3020010


