Abstract
Aqueous two-phase systems (ATPSs) have long been used for the facile and rapid extraction of biomolecules of interest. Selective partitioning of DNA is useful for nucleic acid purification and in the design of novel sensing technologies. This paper investigates the partitioning of a plasmid within a poorly understood ATPS comprising the polymers poly(ethylene glycol) (PEG) 35 kDa and Ficoll 400 kDa. The focus is placed on dissecting the compositional effects of the ATPS—that is, whether set concentrations of physiological ions or the polymers themselves can tune DNA phase preference and strength of partitioning. The work here uncovers the antagonistic effects of magnesium and ammonium ions, as well as the role that phase-forming polymer partitioning plays in plasmid enrichment. Testing the ions in conjunction with different ATPS formulations highlights the complexity of the system at hand, prompting the exploration of DNA’s conformational changes in response to polymer and salt presence. The work presented here offers multiple optimization parameters for downstream applications of PEG–Ficoll ATPSs, such as in vitro transcription/translation-based biosensing, in which performance is heavily dependent upon nucleic acid partitioning.
1. Introduction
The phase separation of various pairs of water-soluble, immiscible polymers is well known to form aqueous two-phase systems (ATPSs) [,]. ATPSs are stable indefinitely, are often formed using widely available and low-cost polymers, and are generally non-toxic towards biological materials and the environment. For these reasons, ATPSs are useful for the separation and purification of macromolecules like nucleic acids [,,,,,]. These applications rely on the ability of an ATPS to selectively partition an object of interest, where a molecule such as a plasmid could find one phase energetically favorable to partition into. This partitioning phenomenon is further leveraged in the design of sensing schemes, in which ATPSs provide a structure allowing analyte detection [,,]. Tuning the localization of a plasmid can have significant effects on the effectiveness of such a scheme. Insights into how ATPS composition modulates nucleic acid partitioning could then be used to guide the development of these biosensors, but could also find use in general purification strategies.
ATPSs have long been studied for their ability to partition nucleic acids, since the early days of the field []. ATPSs comprising polymers such as poly(ethylene glycol) (PEG) and dextran were among the first systems to be thoroughly characterized in the context of nucleic acid purification, in which factors such as polymer concentration, salt composition, ionic strength, and nucleic acid sequence were revealed as important considerations, with salt standing out as the most influential []. Despite the work on PEG–DEX ATPSs, PEG–salt ATPSs have gained prominence as a system for the extraction and purification of biomolecules [], with widespread reporting for various types of DNA [,,,,,,]. PEG–salt ATPSs benefit from desirable properties such as fast settling times and lower viscosity in comparison to two-polymer ATPSs []. However, PEG–salt ATPSs may not always be a reliable option, as salts could exhibit cytotoxicity or impact cell growth and morphology [], affecting ATPS-based applications requiring long experimental timescales []. Additionally, salts may need to be tightly regulated for ATPSs adapted into artificial cells, whose cell-free machinery can be impacted by salt concentration []. These latter applications support the need for further analysis of nucleic acid behavior in two-polymer ATPSs.
One particular ATPS of interest is that comprising poly(ethylene glycol) (PEG) and Ficoll. While PEG–dextran is far more common in the literature, even for nucleic acid applications [,], our group has published comparisons between PEG–dextran and PEG–Ficoll ATPSs that suggest that PEG–Ficoll can be a sufficient, if not preferable, alternative. Primarily, the PEG–Ficoll ATPS, when outfitted as an artificial cell, outperforms PEG–dextran in protein expression, in addition to retaining cell-free components []. Our group has also shown that in rehydrating ATPSs, the Ficoll-rich phase exhibits significantly different fluid dynamical regimes compared to the dextran-rich phase [], which could potentially explain the difference in artificial cell performance described above. Despite our findings, the PEG–Ficoll ATPS has been largely neglected in the literature. This may be explained in part by the lack of consensus over the basic physics of Ficoll, as fundamental characteristics such as its molecular shape are still not clear [,,,]. The few existing studies [,] of the PEG–Ficoll ATPS are consistent in reporting the peculiarities of Ficoll, as phase boundaries (binodals) change depending on the method used to generate them. We previously found a phase diagram for an ATPS of PEG 35K–Ficoll 400K, noting the abnormal shape of the binodal, but also, more importantly, that the binodal position changes in response to a buffer containing myriad physiological ions, such as divalent cations and small molecules like nucleotides []. This buffer, termed Emix, is a necessary component for certain in vitro transcription–translation reactions [], gaining wide use in biotechnology [,,,], and is critical for the operation of a PEG–Ficoll ATPS-based sensor [] developed by our group. Others report buffers rich in similar ions [,,,], further supporting investigation into salt effects on the PEG–Ficoll ATPS, which could be adapted into more biotechnological platforms than just biosensing. By generating binodal curves, one could identify experimental bases for ATPS application development, as the phase diagrams provide a map from which tie lines and formulations, features needed to optimize assays, could be readily extracted [,,,,,]. In addition, failure to study the effect of Emix buffer on PEG–Ficoll could also increase the difficulty in utilizing this ATPS for the above applications.
In this work, we further investigate the role that Emix buffer has on the PEG 35K-Ficoll 400K ATPS, and how individual components may influence the system and nucleic acid partitioning. As this cation-laden buffer induces a strong shift in the barrier to phase separation in addition to partitioning, elucidating the effects that individual cations (magnesium, potassium, and ammonium) have on PEG–Ficoll could be advantageous in future work. We find that ATP and other nucleotides at the concentrations used have a minimal effect on binodal shifting, whereas the cations are necessary for such shifts. Analysis of cation effects on DNA partitioning reveals Mg2+ and NH4+ as two ions inducing opposite phase preferences in a plasmid, with magnesium having the strongest concentration enhancement. Additionally, for given additive conditions (i.e., with or without Emix buffer), we test DNA partitioning in different composition PEG–Ficoll ATPSs, finding that the effect of Emix buffer on DNA partitioning is dependent on the PEG–Ficoll formulation. Efforts to explain these differences are also described, based on potential differences in tie line lengths (TLLs) as well as Mg2+-dependent changes in DNA conformation. This manuscript provides fundamental, as well as practical, information for the use of PEG–Ficoll ATPSs, particularly for applications involving nucleic acids. The work also highlights some of the unusual properties of the very common polymer Ficoll.
2. Materials and Methods
2.1. Materials
Poly(ethylene glycol) (nominal Mw 35,000 Da) and Ficoll PM 400 (nominal Mw 400,000 Da) were both purchased from Sigma-Aldrich (St. Louis, MO, USA). SYTOX Green was purchased from Thermo Fisher Scientific (Waltham, MA, USA). Plasmid DNA (pJL1) was prepared as follows: cultured bacteria harboring the plasmid were lysed using EZNA Maxi columns (Omega Bio-tek; Norcross, GA, USA), the resulting lysate underwent isopropanol and ethanol purification, and DNA-rich pellets were reconstituted in elution buffer. DNA concentrations were found using a NanoDrop 2000 spectrophotometer (Thermo Fisher); samples were stored in −20 °C until use. The buffer ‘Emix’ was prepared as previously described []; its constituent components (Supplementary Table S1) were available individually, and the salts potassium glutamate, magnesium glutamate, and ammonium glutamate (Sigma) were prepared as needed (final concentrations of 130, 12, and 10 mM, respectively). The solutions with either magnesium or ammonium had an approximate pH of 7.
2.2. Tie Line Analysis
Mixtures of polymer stock solutions and nuclease-free water were micro-pipetted into 15 mL conical tubes placed on an analytical balance. The tubes were vortexed to facilitate phase separation. The resultant turbid mixtures were then placed in a centrifuge and spun down at 4000 rpm for 30 min at room temperature. In these tubes, two clear phases would form. Most of the top phase could be easily extracted by a micro-pipette. After aspirating the rest of the top phase, the bottom phase could then be extracted by pipetting, without concern of cross-contamination. The weight fraction of Ficoll in each phase was measured using an MCP 150 polarimeter (Anton Paar; Graz, Austria), after first calibrating with a range of solutions from 0.2 to 3 wt% Ficoll. The density and refractive index of each phase were measured using a DMA 4501 density meter and an Abbemat 3200 digital refractometer (both Anton Paar), respectively. All measurements were set at a temperature of 20 °C, with the accuracy of the polarimeter being the limiting factor (±0.01 °C). The concentrations of PEG in each phase were calculated according to an equation described by Liu et al. []:
where and are the PEG and Ficoll weight fractions, and are the PEG and Ficoll refractive index increments, and are the refractive indices of the phase and the solvent, and is the phase density. The density meter and refractometer were used initially to calculate PEG and Ficoll and , the polymer’s partial specific volume, using freshly prepared solutions of each polymer at each target weight fraction. We found that = 0.1374 mL/g and = 0.8329 mL/g for PEG 35K, and = 0.1432 mL/g and = 0.6637 mL/g for Ficoll 400K, all of which were values in close agreement with previously reported figures [,,,,]. The weight fractions of water were found by subtracting PEG and Ficoll weight fractions from 1.00. The concentrations in weight fraction and volume fraction were converted using density measurements (Supplementary Figure S2). The weight fractions were plotted into a ternary plot using Mathematica v13.1.0.0 (Wolfram Research; Champaign, IL, USA), and the resulting plots were cropped using Adobe Illustrator v25.4.1 (Adobe; San Jose, CA, USA).
2.3. Partition Experiments
The concentrations of pJL1 plasmids in the top and bottom phases of a PEG–Ficoll ATPS were measured using a microvolume fluorometer (DeNovix; Wilmington, DE, USA), in which DNA was labeled just before the measurements using a Qubit dsDNA BR Assay Kit (Thermo Fisher). Before the measurement stage, samples were isolated as previously stated []. Briefly, tubes for each ATPS were prepared with the plasmids in the specified experimental condition, pipetted until complete turbidity, and allowed to settle into two distinct phases overnight at 4 °C, without any dye added to the mixture. Each phase was then isolated carefully through pipetting, in which the bottom phase was isolated after the complete removal of the top phase. The control tubes were of only DNA in water, to confirm that gravity was not influencing the partitioning. Apparent partition coefficients were calculated as , where c represents the concentration in the respective phases.
2.4. Atomic Force Microscopy
A 5 nM solution of pJL1 plasmids was prepared in a 1 wt% PEG 35K solution in nuclease-free water. Two additional conditions were prepared, in which SYTOX Green and magnesium chloride were separately included. After attaching a mica slab (Ted Pella; Redding, CA, USA) to a glass slide with double-sided tape, single-sided tape was used to generate freshly cleaved mica, to which 20 µL of 0.01% poly-L-lysine (PLL; Sigma) was added and allowed to incubate for 5 min, before washing with 4 mL of MilliQ water. The slides were then gently tapped on one edge onto a paper towel to shake off the excess water, and a Kimwipe was carefully patted at one mica end to absorb the residual water. Then, 20 µL of the plasmid solution was pipetted onto the mica and allowed to incubate for 5 min, before following the same washing and drying steps after PLL application. The slides were kept under vacuum until imaging. Imaging was performed on a Dimension Icon AFM instrument (Bruker; Billerica, MA, USA) with the commercial Nanoscope software in ScanAsyst tapping mode, using the necessary probe (ScanAsyst-FLUID+, Bruker). The settings were automatically optimized by the software; the images had dimensions of either 500 × 500 nm or 2 × 2 µm, with the scan rate set just below 0.5 Hz in each case. The images were then flattened and exported with Nanoscope Analysis v2.0 before being cropped and adjusted for brightness/contrast in Fiji.
3. Results
3.1. Cation Influence on DNA Partitioning in PEG–Ficoll
Previously, we demonstrated that DNA could partition differently within the PEG–Ficoll ATPS upon addition of Emix buffer []. We sought to examine this further on two fronts: first, to dissect the contributions that the Emix buffer components and polymer concentrations have towards partitioning; and second, to check if plasmid structure is affected by Emix buffer components. Our data show that nucleotides do not lead to noticeable changes in binodal placement, as a 1.5 vol%/13 vol% PEG 35K–Ficoll 400K ATPS still undergoes phase separation if the solution contains Emix buffer without nucleotides (Supplementary Figure S1a,b). No phase separation is observed in this ATPS formulation with 13 vol% Ficoll supplemented with Emix buffer, omitting the salts magnesium glutamate, ammonium glutamate, and potassium glutamate. We henceforth focus on the salts as being the impactful Emix buffer components.
Due to concerns regarding the use of an intercalating dye (as discussed later), we used a commercial fluorometer which utilizes a proprietary dye in calculating nucleic acid concentrations. This dye would only be added to samples after the isolation of each settled phase, to prevent any dye-mediated effects on partitioning. For simplicity, we only considered partitioning of the pJL1 plasmids, and we updated the partition coefficients K to be calculated as the fold enhancement into the Ficoll-rich phase (Figure 1a). Initially, we wanted to dissect the contributions that the individual cations had towards DNA partitioning. To this end, we found that the addition of magnesium had approximately a 58-fold enhancement of plasmid localization into the Ficoll-rich phase, about 6.8 times more than in the 5 vol%/10 vol% PEG–Ficoll ATPS alone (Figure 1b). Interestingly, potassium weakly enhanced partitioning, while ammonia induced a slight preference for the PEG-rich phase.
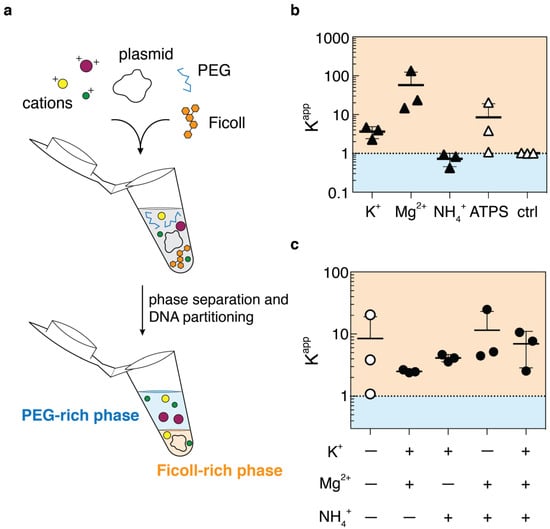
Figure 1.
Partitioning of pJL1 plasmids in response to cation presence. (a) An overview of the experiment: PEG, Ficoll, plasmids, and various salts are mixed in a centrifuge tube and allowed to phase separate. Phases are isolated and DNA concentration is measured to calculate partition coefficients. (b) Partition data of pJL1 in response to various salts added to a 5 vol%/10 vol% PEG 35K–Ficoll 400K ATPS. Salts were added to have final concentrations the same as in 1× Emix buffer. Error bars represent standard deviation (n = 3). (c) Partition data of pJL1 in response to select pairs of cations. Experiments in (b,c) were performed at the same time, so control condition is shared among the two plots. Error bars represent standard deviation (n = 3).
We also probed the effects that pairs of ions may have, in the hopes of uncovering any synergistic effects. These were found to some degree, as the plasmids in the ammonium-containing ATPSs would suddenly show Ficoll-phase preference (K > 1) when either potassium or magnesium ions were introduced (Figure 1c). Curiously, the two cations exhibiting Ficoll-phase DNA enrichment, K+ and Mg2+, would result in partitioning closer to K+ alone rather than Mg2+ alone, and having all three ions in the ATPS would lead to a mean K-value near that of ATPS itself. This latter point does suggest that salts are not the only necessary component of Emix buffer for affecting plasmid phase preference, considering our previously published partition data with whole Emix buffer. Still, salts are shown to be influential for PEG–Ficoll ATPS as much as for other two-polymer ATPSs [].
3.2. ATPS Formulation Effects on DNA Localization
Next, we considered the role that changing polymer concentrations would have on DNA partitioning. Tie lines of a PEG 35K–Ficoll 400K–water ternary system were first collected to find the composition of each phase, as our previous work only looked at the concentrations of mixtures above and below the binodal. To accomplish this, we made use of the fact that polysaccharides such as Ficoll are optically active, whereas PEG is not. First, the densities and refractive indices of the PEG and Ficoll solutions were measured to calculate the specific volume and refractive index increment for each polymer (Supplementary Figures S2 and S3). Then, after calibrating a polarimeter (Supplementary Figure S4), the concentrations of Ficoll in the top and bottom phases of select ATPS compositions were measured, and by utilizing the parameters above, the PEG and water amounts could be calculated. The final calculated concentrations of PEG, Ficoll, and water are plotted onto a ternary graph (Figure 2a). The data points outline a binodal curve which make clear that the interactions between Ficoll and water are different than for PEG and water. Indeed, the amount of water in the Ficoll phase is significantly lower than in the PEG phase, such that we cannot reliably use the classical ATPS approximation [] of the system into an orthogonal representation in which the water concentration axis is omitted. Additionally, because of contributive optical activities of the myriad Emix buffer components, the above methods could not be used to measure the Ficoll or PEG concentrations in each phase, and thus we could not perform tie line analysis (TLA), even if we were to riskily assume that all components partitioned evenly across the phases.
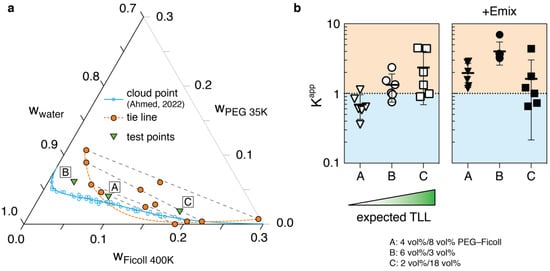
Figure 2.
Polymer composition effects on plasmid partitioning. (a) Ternary phase diagram for the PEG 35K–Ficoll 400K ATPS used in this work []. Tie line end point compositions in weight fractions were calculated from optical rotation, density, and refractive index measurements, and are plotted in orange circles, with the orange dashed line as the predicted binodal. In comparison, previously published cloud point data and fitted binodal were recalculated into the ternary format and are plotted in blue. Test points used for partition experiments (green triangles, converted into weight fractions using their densities), have the following compositions: A: 4 vol%/8 vol% PEG–Ficoll; B: 6 vol%/3 vol%; C: 2 vol%/18 vol%. (b) Partition data of pJL1 in three select ATPS formulations, with or without Emix buffer. A, B and C are ordered according to expected tie line length (TLL), with A being closest to the critical point in both the cloud point and tie line binodals. Error bars represent standard deviation (n = 6).
From our phase diagram, we can highlight three interesting formulations. Two formulations (A: 4 vol%/8 vol% PEG–Ficoll, C: 2 vol%/18 vol%) are within the two-phase region predicted by the binodal found through tie line analysis, and one formulation (B: 6 vol%/3 vol%) resides outside of the TLA binodal, but above the cloud point binodal (Figure 2a). The formulations are ordered from A–C based on expected tie line length, with A being the shortest. The plasmid partition experiments in the different formulations, with and without Emix buffer, are presented in Figure 2b. For the PEG–Ficoll ATPS without Emix buffer, the preference for the Ficoll-rich phase does increase in accordance with increasing TLL, as expected (TLLs are estimated based on a rough line connecting each point to the blue cloud point binodal in Figure 2a). Longer tie lines correspond to more extreme separation of polymers between the two phases, and often result in improved biomolecule partitioning []. The partition data involving Emix buffer are more difficult to explain by just this TLL principle. In general, the mean K-values for all three formulations are above 1, but formulation C breaks the increasing K-value trend forming with A and B. It is likely that the cation effects discovered in the previous section become an important factor here, possibly through influencing DNA conformation within the ATPS, which we will delve into next.
3.3. DNA Conformation Underlying Partitioning
Atomic force microscopy (AFM) is a widely used method for imaging immobilized DNA [,,,], and is thus used in this report to assess the structure of the pJL1 plasmid. First, we hypothesized that dye intercalation exposes the plasmid’s hydrophobic nucleobases, which are more likely to interact with PEG than Ficoll (or possibly just repel Ficoll). This was partly supported by a previous report stating that the intercalating dye PicoGreen can induce DNA elongation []. We tested whether the intercalating SYTOX dyes we used prior to this work for measuring DNA concentrations in the phases would act similarly, distorting local DNA structure and perhaps contributing to PEG–DNA interaction. In our earlier report, we incubated DNA with SYTOX Green overnight, but here, we imaged plasmids by allowing the dye to incubate for 30 min before immobilizing onto PLL-coated mica. The images show that the plasmids are generally in a relaxed form in PEG (Figure 3a), but in the presence of dye, large aggregates appear to associate with the DNA, many of which stretch along a segment of the plasmid (Figure 3b), even though we prepared the SYTOX dye to be sufficiently dilute such that only one dye would bind every 50 bp along a plasmid, a ratio lower than a previous report, in which no aggregates were observed [].
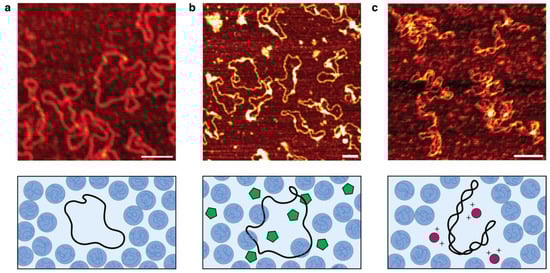
Figure 3.
AFM images of immobilized pJL1 plasmids. (a) Plasmids in PEG solution (shown as blue blobs) with no additives. (b) Plasmids in PEG but with SYTOX Green (green pentagons) added at a 1:50 bp ratio. (c) Plasmids in PEG but with 10 mM MgCl2 (red circles) added. Scale bars, 100 nm.
Next, we considered the component of Emix buffer which showed the strongest effect on increasing DNA partitioning into the Ficoll phase: magnesium. Following the same procedure as above, we incubated 10 mM of Mg(GLU)2 with pJL1 plasmids in PEG for 30 min, before depositing the DNA onto PLL-mica. AFM imaging revealed that the plasmids formed globular structures, highly distinct from the relaxed plasmids seen just before (Figure 3c). Importantly, the DNA also displayed more coiling. The more compact shape could be suggested to result from different phosphate groups being pulled towards free Mg2+ to form more ionic bonds. The plasmid structure change likely explains, at least in part, the significant improvement in Ficoll-rich phase localization as seen with all the Mg2+-containing conditions in Figure 1.
4. Discussion
The work detailed in this manuscript sought to expand upon a previous effort from our group in fundamentally understanding the PEG–Ficoll ATPS, with focus placed on developing testable strategies for the optimization and implementation of this ATPS. Our key findings—that salt selection and polymer concentration can have contrasting impacts on DNA partitioning—show the versatility of PEG–Ficoll for nucleic acid-based technologies. Although such features are detailed for classic ATPSs like PEG–dextran, a promising established case from our group [], in which PEG–Ficoll overperformed other ATPSs, warranted the work performed here. As mentioned in the introduction, salt-rich buffers very similar to Emix buffer are widely used in synthetic biology and biotechnology, and for ATPSs to be adapted to these methods, the study of salt effects is crucial. The work here still supports the use of PEG–Ficoll in methods such as nucleic acid purification, as Emix buffer components can be tailored to dictate the phase preference of target nucleic acids. Failure to use Emix buffer would mean a loss of benefits, such as preference control, alongside a lower phase boundary (Supplementary Figure S5).
Though we consider the peculiarity of Ficoll as underlying the results in this work, PEG should be considered as well. Typical PEG-based ATPSs often use lower-molecular-weight PEGs, from 600 to 20,000 Da []. The 35 kDa PEG used here is certainly well above the range here, but in comparison to much larger PEGs, PEG 35K is expected to have similar polydispersity as PEGs within the aforementioned range []. Furthermore, the PEG–Ficoll ATPSs studied previously use PEGs smaller than 35 kDa, yet still feature the cloud point/tie line binodal discrepancy [,], suggesting that PEG size may not explain our binodal data. It should also be noted that PEG is often used to precipitate proteins [], with a general rule being that higher-molecular-weight PEGs correspond to stronger precipitating power []. Importantly, proteins ejected from the PEG-rich phase do not necessarily present as visible particulates, but instead enrich the other ATPS phase (hence, a change in K-value). DNA nanoparticles, such as origami, precipitate in the presence of PEG [], although they require very fast centrifugation speeds, which were not utilized in this study; no precipitates were observed in our experiments. Nevertheless, it cannot be ruled out that the strength of DNA partitioning is influenced by the relatively high PEG molecular weight used here. Higher molecular weight PEGs are more efficient in precipitating proteins, and though the PEG concentration used in this paper is somewhat low (~5 vol%), large DNA molecules may compensate if excluded volume effects are at play. In the context of different tie line ratios, in which concentrations of PEG in the PEG-rich phase vary, it is especially relevant that for the case in which PEG concentration is expected to be the lowest, DNA preferentially partitions into the PEG-rich phase. Therefore, future work may need to consider PEG molecular weight, especially if proteins are involved.
We also highlight the way that the structural conformation of the nucleic acid can have an effect on its partitioning. Magnesium strongly enhances DNA localization into the Ficoll-rich phase, which is likely explained, at least partially, by cation-induced coiling. The partitioning data presented here are somewhat in conflict with our prior data, as the salt-rich Emix buffer (which contains magnesium, among other physiological ions) used both here and before shows Ficoll-rich phase enrichment of plasmids. But, the key deviation is in the buffer-free PEG–Ficoll condition. In our earlier work [], plasmids strongly favored the PEG-rich phase, an unexpected and indeed inexplicable observation. We have now shown, with AFM imaging, that the intercalating dye used in that study appears to mediate PEG–DNA contacts, which may explain the apparent PEG phase preference. However, we note that we cannot confirm if the objects present around the plasmids in our images are PEG molecules. Importantly, we cannot make a direct comparison between the K-values in this and the previous report, as they were calculated using different parameters, but the partitioning of plasmids in PEG–Ficoll with Mg2+ here is of the same order of magnitude as for PEG–Ficoll with Emix buffer before. Although we have now shown that PEG–Ficoll alone does not flip plasmid preference compared to the ATPS with Emix buffer, we newly identify ammonium and low tie line length (4 vol% PEG, 8 vol% Ficoll) as two conditions in which plasmids prefer the PEG-rich phase.
One important discussion point is the PEG–Ficoll formulation result. While expected tie line length is one probable explanation for the partitioning behavior in buffer-free formulations, it does not readily apply to formulations with Emix buffer. We expect that the presence of multiple cations should improve plasmid partitioning into the Ficoll-rich phase, which was observed with the first two formulations, starting a trend like in the Emix-free conditions. But, the high Ficoll formulation breaks the trend, instead keeping the plasmid K-values near 1, with wide variation. It is possible that the tie line slope changes [], such that the new formulation arrangement restores the trend, but slope changes could not be confirmed, given the difficulty in performing tie line analysis in the presence of Emix buffer. Still, as we have shown that Emix buffer shifts the PEG–Ficoll phase boundary (Supplementary Figure S5), slope changes are possible.
In general, the work presented here shows the influence a cell-like buffer could exert on DNA partitioning within a two-polymer liquid–liquid phase-separated system. We elucidated physiological ion and polymer composition effects on plasmids within PEG–Ficoll ATPS. Further analysis attempts to link these and previously determined results to plasmid conformation, particularly under the influence of a major buffer cation and a labeling dye. The results overall suggest the important synergistic role that low-concentration intracellular salts may have on the utility of a phase-separating system.
Supplementary Materials
The following supporting information can be downloaded at https://www.mdpi.com/article/10.3390/chemistry6060102/s1: Figure S1: Salts are more influential than nucleotides in modulating the phase boundary.; Figure S2: Calculation of polymer partial specific volume.; Figure S3: Calculation of the refractive index increment dn/dc.; Figure S4: Calibration of optical rotation measurements for Ficoll 400K.; Figure S5: Ternary representation of previously-determined PEG-Ficoll binodals.; Table S1: Complete list of Emix components.
Author Contributions
Conceptualization, T.A., A.V. and S.T.; formal analysis, T.A. and A.V.; funding acquisition, M.P.S. and S.T.; investigation, T.A. and A.V.; methodology, T.A., A.V. and A.T.P.; project administration, S.T.; resources, A.T.P.; supervision, M.P.S. and S.T.; visualization, T.A. and A.V.; writing—original draft, T.A. and S.T.; writing—review and editing, T.A., A.V., A.T.P., M.P.S. and S.T. All authors have read and agreed to the published version of the manuscript.
Funding
This work was supported by funding from the US National Science Foundation, under Award Numbers EF2319391 and EF2319430. A.T.P. is supported by US NSF Graduate Research Fellowship (DGE-2039655).
Data Availability Statement
The original contributions presented in this study are included in the article. Further inquiries can be directed to the corresponding author.
Acknowledgments
We thank James Carter at Anton Paar for his help in acquiring the density meter, refractometer, and polarimeter used in this study. We also thank Michael Jewett for his gift of the pJL1 plasmids used in this study.
Conflicts of Interest
The authors declare no competing interests.
References
- Zaslavsky, B.Y. Aqueous Two-Phase Partitioning: Physical Chemistry and Bioanalytical Applications; M. Dekker: New York, NY, USA, 1995. [Google Scholar]
- Albertsson, P.-Å. Partition of Cell Particles and Macromolecules, 3rd ed.; Wiley: New York, NY, USA, 1986. [Google Scholar]
- Albertsson, P.-Å. Partition studies on nucleic acids: I. Influence of electrolytes, polymer concentration and nucleic acid conformation on the partition in the dextran-polyethylene glycol system. Biochim. Biophys. Acta 1965, 103, 1–12. [Google Scholar] [CrossRef] [PubMed]
- Masukawa, M.K.; Sato, Y.; Yu, F.; Tsumoto, K.; Yoshikawa, K.; Takinoue, M. Water-in-Water Droplets Selectively Uptake Self-Assembled DNA Nano/Microstructures: A Versatile Method for Purification in DNA Nanotechnology. ChemBioChem 2022, 23, e202200240. [Google Scholar] [CrossRef] [PubMed]
- Nakatani, N.; Sakuta, H.; Hayashi, M.; Tanaka, S.; Takiguchi, K.; Tsumoto, K.; Yoshikawa, K. Specific Spatial Localization of Actin and DNA in a Water/Water Microdroplet: Self-Emergence of a Cell-Like Structure. ChemBioChem 2018, 19, 1370–1374. [Google Scholar] [CrossRef]
- Luechau, F.; Ling, T.C.; Lyddiatt, A. Partition of plasmid DNA in polymer–salt aqueous two-phase systems. Sep. Purif. Technol. 2009, 66, 397–404. [Google Scholar] [CrossRef]
- Gomes, G.A.; Azevedo, A.M.; Aires-Barros, M.R.; Prazeres, D.M.F. Purification of plasmid DNA with aqueous two phase systems of PEG 600 and sodium citrate/ammonium sulfate. Sep. Purif. Technol. 2009, 65, 22–30. [Google Scholar] [CrossRef]
- Frerix, A.; Müller, M.; Kula, M.-R.; Hubbuch, J. Scalable recovery of plasmid DNA based on aqueous two-phase separation. Biotechnol. Appl. Biochem. 2005, 42, 57–66. [Google Scholar] [CrossRef] [PubMed]
- Zhang, Y.; Kojima, T.; Kim, G.A.; McNerney, M.P.; Takayama, S.; Styczynski, M.P. Protocell arrays for simultaneous detection of diverse analytes. Nat. Commun. 2021, 12, 5724. [Google Scholar] [CrossRef]
- Minagawa, Y.; Nakata, S.; Date, M.; Ii, Y.; Noji, H. On-Chip Enrichment System for Digital Bioassay Based on Aqueous Two-Phase System. ACS Nano 2022, 17, 212–220. [Google Scholar] [CrossRef] [PubMed]
- Chen, Q.; Zhang, Y.; Chen, H.; Liu, J.; Liu, J. Enhancing the Sensitivity of DNA and Aptamer Probes in the Dextran/PEG Aqueous Two-Phase System. Anal. Chem. 2021, 93, 8577–8584. [Google Scholar] [CrossRef] [PubMed]
- Lif, T.; Frick, G.; Albertsson, P.-Å. Fractionation of nucleic acids in aqueous polymer two-phase systems. J. Mol. Biol. 1961, 3, 727–740. [Google Scholar] [CrossRef]
- Rosa, P.A.J.; Ferreira, I.F.; Azevedo, A.M.; Aires-Barros, M.R. Aqueous two-phase systems: A viable platform in the manufacturing of biopharmaceuticals. J. Chromatogr. A 2010, 1217, 2296–2305. [Google Scholar] [CrossRef]
- Ribeiro, S.C.; Monteiro, G.A.; Cabral, J.M.S.; Prazeres, D.M.F. Isolation of plasmid DNA from cell lysates by aqueous two-phase systems. Biotechnol. Bioeng. 2002, 78, 376–384. [Google Scholar] [CrossRef] [PubMed]
- Meutelet, R.; Bisch, L.J.; Buerfent, B.C.; Müller, M.; Hubbuch, J. Partitioning behavior of short DNA fragments in polymer/salt aqueous two-phase systems. Biotechnol. J. 2024, 19, 2400394. [Google Scholar] [CrossRef] [PubMed]
- Rahimpour, F.; Feyzi, F.; Maghsoudi, S.; Hatti-Kaul, R. Purification of plasmid DNA with polymer-salt aqueous two-phase system: Optimization using response surface methodology. Biotechnol. Bioeng. 2006, 95, 627–637. [Google Scholar] [CrossRef] [PubMed]
- Nazer, B.; Dehghani, M.; Goliaei, B.; Morad, E. Partitioning of pyrimidine single stranded oligonucleotide using polyethylene glycol—Sodium sulfate aqueous two-phase systems; experimental and modeling. Fluid Phase Equilibria 2017, 432, 45–53. [Google Scholar] [CrossRef]
- Ahmed, T.; Yamanishi, C.; Kojima, T.; Takayama, S. Aqueous Two-Phase Systems and Microfluidics for Microscale Assays and Analytical Measurements. Annu. Rev. Anal. Chem. 2021, 14, 231–255. [Google Scholar] [CrossRef] [PubMed]
- Mastiani, M.; Firoozi, N.; Petrozzi, N.; Seo, S.; Kim, M. Polymer-salt aqueous two-phase system (ATPS) micro-droplets for cell encapsulation. Sci. Rep. 2019, 9, 15561. [Google Scholar] [CrossRef]
- Tavana, H.; Kaylan, K.; Bersano-Begey, T.; Luker, K.E.; Luker, G.D.; Takayama, S. Polymeric aqueous biphasic system rehydration facilitates high throughput cell exclusion patterning for cell migration studies. Adv. Funct. Mater. 2011, 21, 2920–2926. [Google Scholar] [CrossRef] [PubMed][Green Version]
- Boyd, M.A.; Thavarajah, W.; Lucks, J.B.; Kamat, N.P. Robust and tunable performance of a cell-free biosensor encapsulated in lipid vesicles. Sci. Adv. 2023, 9, eadd6605. [Google Scholar] [CrossRef]
- Strulson, C.A.; Molden, R.C.; Keating, C.D.; Bevilacqua, P.C. RNA catalysis through compartmentalization. Nat. Chem. 2012, 4, 941–946. [Google Scholar] [CrossRef] [PubMed]
- Tavana, H.; Jovic, A.; Mosadegh, B.; Lee, Q.Y.; Liu, X.; Luker, K.E.; Luker, G.D.; Weiss, S.J.; Takayama, S. Nanolitre liquid patterning in aqueous environments for spatially defined reagent delivery to mammalian cells. Nat. Mater. 2009, 8, 736–741. [Google Scholar] [CrossRef] [PubMed]
- Yamanishi, C.; Oliver, C.R.; Kojima, T.; Takayama, S. Stigmatic Microscopy Enables Low-Cost, 3D, Microscale Particle Imaging Velocimetry in Rehydrating Aqueous Two-Phase Systems. Fron. Chem. 2019, 7, 311. [Google Scholar] [CrossRef] [PubMed]
- Lavrenko, P.N.; Mikryukova, O.I.; Didenko, S.A. Hydrodynamic properties and the shape of the molecules of the polysaccharide ficoll-400 in solution. Polym. Sci. 1986, 28, 576–584. [Google Scholar] [CrossRef]
- Palit, S.; Yethiraj, A. Dynamics and cluster formation in charged and uncharged Ficoll70 solutions. J. Chem. Phys. 2017, 147, 074901. [Google Scholar] [CrossRef]
- Christiansen, A.; Wittung-Stafshede, P. Quantification of Excluded Volume Effects on the Folding Landscape of Pseudomonas aeruginosa Apoazurin In Vitro. Biophys. J. 2013, 105, 1689–1699. [Google Scholar] [CrossRef] [PubMed]
- Fodeke, A.A.; Minton, A.P. Quantitative Characterization of Polymer–Polymer, Protein–Protein, and Polymer–Protein Interaction via Tracer Sedimentation Equilibrium. J. Phys. Chem. B 2010, 114, 10876–10880. [Google Scholar] [CrossRef]
- Croll, T.; Munro, P.D.; Winzor, D.J.; Trau, M.; Nielsen, L.K. Analysis of the Phase Behavior of the Aqueous Poly(ethylene glycol)-Ficoll System. Biotechnol. Prog. 2008, 19, 1269–1273. [Google Scholar] [CrossRef] [PubMed]
- Ahmed, T.; Zhang, Y.; Lee, J.-H.; Styczynski, M.P.; Takayama, S. Nucleic Acid Partitioning in PEG-Ficoll Protocells. J. Chem. Eng. Data 2022, 67, 1964–1971. [Google Scholar] [CrossRef] [PubMed]
- Kwon, Y.-C.; Jewett, M.C. High-throughput preparation methods of crude extract for robust cell-free protein synthesis. Sci. Rep. 2015, 5, 8663. [Google Scholar] [CrossRef] [PubMed]
- Takahashi, M.K.; Tan, X.; Dy, A.J.; Braff, D.; Akana, R.T.; Furuta, Y.; Donghia, N.; Ananthakrishnan, A.; Collins, J.J. A low-cost paper-based synthetic biology platform for analyzing gut microbiota and host biomarkers. Nat. Commun. 2018, 9, 3347. [Google Scholar] [CrossRef]
- Karim, A.S.; Dudley, Q.M.; Juminaga, A.; Yuan, Y.; Crowe, S.A.; Heggestad, J.T.; Garg, S.; Abdalla, T.; Grubbe, W.S.; Rasor, B.J.; et al. In vitro prototyping and rapid optimization of biosynthetic enzymes for cell design. Nat. Chem. Biol. 2020, 16, 912–919. [Google Scholar] [CrossRef]
- Hunt, A.C.; Vögeli, B.; Hassan, A.O.; Guerrero, L.; Kightlinger, W.; Yoesep, D.J.; Krüger, A.; DeWinter, M.; Diamond, M.S.; Karim, A.S.; et al. A rapid cell-free expression and screening platform for antibody discovery. Nat. Commun. 2023, 14, 3897. [Google Scholar] [CrossRef]
- Karlikow, M.; da Silva, S.J.R.; Guo, Y.; Cicek, S.; Krokovsky, L.; Homme, P.; Xiong, Y.; Xu, T. Calderón-Peláez, M.-A.; Camacho-Ortega, S.; et al. Field validation of the performance of paper-based tests for the detection of the Zika and chikungunya viruses in serum samples. Nat. Biomed. Eng. 2022, 6, 246–256. [Google Scholar] [CrossRef]
- Salehi, A.S.M.; Shakalli Tang, M.J.; Smith, M.T.; Hunt, J.M.; Law, R.A.; Wood, D.W.; Bundy, B.C. Cell-Free Protein Synthesis Approach to Biosensing hTRβ-Specific Endocrine Disruptors. Anal. Chem. 2017, 89, 3395–3401. [Google Scholar] [CrossRef]
- Wen, K.Y.; Cameron, L.; Chappell, J.; Jensen, K.; Bell, D.J.; Kelwick, R.; Kopniczky, M.; Davies, J.C.; Filloux, A.; Freemont, P.S. A Cell-Free Biosensor for Detecting Quorum Sensing Molecules in P. aeruginosa-Infected Respiratory Samples. ACS Synth. Biol. 2017, 6, 2293–2301. [Google Scholar] [CrossRef]
- Boyer, M.E.; Stapleton, J.A.; Kuchenreuther, J.M.; Wang, C.W.; Swartz, J.R. Cell-free synthesis and maturation of [FeFe] hydrogenases. Biotechnol. Bioeng. 2007, 99, 59–67. [Google Scholar] [CrossRef]
- Lu, Y.; Welsh, J.P.; Swartz, J.R. Production and stabilization of the trimeric influenza hemagglutinin stem domain for potentially broadly protective influenza vaccines. Proc. Natl. Acad. Sci. USA 2013, 111, 125–130. [Google Scholar] [CrossRef] [PubMed]
- Tavana, H.; Mosadegh, B.; Takayama, S. Polymeric aqueous biphasic systems for non-contact cell printing on cells: Engineering heterocellular embryonic stem cell niches. Adv. Mater. 2010, 22, 2628–2631. [Google Scholar] [CrossRef]
- Tongdee, M.; Yamanishi, C.; Maeda, M.; Kojima, T.; Dishinger, J.; Chantiwas, R.; Takayama, S. One-incubation one-hour multiplex ELISA enabled by aqueous two-phase systems. Analyst 2020, 145, 3517–3527. [Google Scholar] [CrossRef]
- Torre, P.; Keating, C.D.; Mansy, S.S. Multiphase water-in-oil emulsion droplets for cell-free transcription–translation. Langmuir 2014, 30, 5695–5699. [Google Scholar] [CrossRef]
- Yee, M.F.; Emmel, G.N.; Yang, E.J.; Lee, E.; Paek, J.H.; Wu, B.M.; Kamei, D.T. Ionic liquid aqueous two-phase systems for the enhanced paper-based detection of transferrin and Escherichia coli. Front. Chem. 2018, 6, 486. [Google Scholar] [CrossRef] [PubMed]
- Song, Y.; Shimanovich, U.; Michaels, T.C.; Ma, Q.; Li, J.; Knowles, T.P.; Shum, H.C. Fabrication of fibrillosomes from droplets stabilized by protein nanofibrils at all-aqueous interfaces. Nat. Commun. 2016, 7, 12934. [Google Scholar] [CrossRef] [PubMed]
- Chen, F.; Li, X.; Yu, Y.; Li, Q.; Lin, H.; Xu, L.; Shum, H.C. Phase-separation facilitated one-step fabrication of multiscale heterogeneous two-aqueous-phase gel. Nat. Commun. 2023, 14, 2793. [Google Scholar] [CrossRef] [PubMed]
- Liu, Y.; Lipowsky, R.; Dimova, R. Concentration dependence of the interfacial tension for aqueous two-phase polymer solutions of dextran and polyethylene glycol. Langmuir 2012, 28, 3831–3839. [Google Scholar] [CrossRef]
- Acosta, L.C.; Perez Goncalves, G.M.; Pielak, G.J.; Gorensek-Benitez, A.H. Large cosolutes, small cosolutes, and dihydrofolate reductase activity. Protein Sci. 2017, 26, 2417–2425. [Google Scholar] [CrossRef] [PubMed]
- Brandrup, J.; Immergut, E.H.; Grulke, E.A. Polymer Handbook, 4th ed.; Wiley: New York, NY, USA, 2004. [Google Scholar]
- Georgalis, Y.; Philipp, M.; Aleksandrova, R.; Krüger, J.K. Light scattering studies on Ficoll PM70 solutions reveal two distinct diffusive modes. J. Colloid Interface Sci. 2012, 386, 141–147. [Google Scholar] [CrossRef] [PubMed]
- Hansma, H.G.; Bezanilla, M.; Zenhausern, F.; Adrian, M.; Sinsheimer, R.L. Atomic force microscopy of DNA in aqueous solutions. Nucleic Acids Res. 1993, 21, 505–512. [Google Scholar] [CrossRef]
- Hansma, H.G.; Revenko, I.; Kim, K.; Laney, D.E. Atomic Force Microscopy of Long and Short Double-Stranded, Single-Stranded and Triple-Stranded Nucleic Acids. Nucleic Acids Res. 1996, 24, 713–720. [Google Scholar] [CrossRef]
- Rivetti, C.; Guthold, M.; Bustamante, C. Scanning Force Microscopy of DNA Deposited onto Mica: EquilibrationversusKinetic Trapping Studied by Statistical Polymer Chain Analysis. J. Mol. Biol. 1996, 264, 919–932. [Google Scholar] [CrossRef] [PubMed]
- Wiggins, P.A.; Van Der Heijden, T.; Moreno-Herrero, F.; Spakowitz, A.; Phillips, R.; Widom, J.; Dekker, C.; Nelson, P.C. High flexibility of DNA on short length scales probed by atomic force microscopy. Nat. Nanotechnol. 2006, 1, 137–141. [Google Scholar] [CrossRef]
- Japaridze, A.; Benke, A.; Renevey, S.; Benadiba, C.; Dietler, G. Influence of DNA Binding Dyes on Bare DNA Structure Studied with Atomic Force Microscopy. Macromolecules 2015, 48, 1860–1865. [Google Scholar] [CrossRef]
- Ziębacz, N.; Wieczorek, S.A.; Kalwarczyk, T.; Fiałkowski, M.; Hołyst, R. Crossover regime for the diffusion of nanoparticles in polyethylene glycol solutions: Influence of the depletion layer. Soft Matter 2011, 7, 7181–7186. [Google Scholar] [CrossRef]
- Polson, A.; Potgieter, G.M.; Largier, J.F.; Mears, G.E.F.; Joubert, F.J. The fractionation of protein mixtures by linear polymers of high molecular weight. Biochim. Biophys. Acta (BBA)—Gen. Subj. 1964, 82, 463–475. [Google Scholar] [CrossRef]
- Atha, D.H.; Ingham, K.C. Mechanism of precipitation of proteins by polyethylene glycols. Analysis in terms of excluded volume. J. Biol. Chem. 1981, 256, 12108–12117. [Google Scholar] [CrossRef]
- Stahl, E.; Martin, T.G.; Praetorius, F.; Dietz, H. Facile and Scalable Preparation of Pure and Dense DNA Origami Solutions. Angew. Chem. Int. Ed. 2014, 53, 12735–12740. [Google Scholar] [CrossRef] [PubMed]
Disclaimer/Publisher’s Note: The statements, opinions and data contained in all publications are solely those of the individual author(s) and contributor(s) and not of MDPI and/or the editor(s). MDPI and/or the editor(s) disclaim responsibility for any injury to people or property resulting from any ideas, methods, instructions or products referred to in the content. |
© 2024 by the authors. Licensee MDPI, Basel, Switzerland. This article is an open access article distributed under the terms and conditions of the Creative Commons Attribution (CC BY) license (https://creativecommons.org/licenses/by/4.0/).