Abstract
The simultaneous determination of heregulin-α and HER 1–4 plays an important role in brain cancer diagnosis and treatment. To date, only enzyme-linked immunosorbent assay (ELISA) or a semiquantitative colorimetric method have been used for the assay of these biomarkers; these methods are quite expensive and can only determine one biomarker in a run. Four 3D stochastic microsensors based on multi-walled carbon nanotubes enriched with gold nanoparticles and modified with inulin were designed for the simultaneous determination of heregulin-α and HER 1–4 in tumor brain tissue and whole blood samples. For the simultaneous measurement of HRG-α and HER 1–4, all sensors demonstrated low limits of determination (as fg mL−1 magnitude order), high sensitivities, and wide concentration ranges. From biological samples, high recovery values of more than 96% of analytes were obtained. The proposed sensor can detect HER 1–4 and heregulin-α in whole blood and tumor tissue samples at the same time.
1. Introduction
The nervous system’s growth, regeneration, and tumour formation are influenced by heregulin-α (HRG-α) [1]. The four homologous receptors that make up the (Human Epithelial Growth Factor Receptor) HER family are HER-1, HER-2, HER-3, and HER-4 [2]. Cancer is the second greatest cause of death globally [3], but its early diagnosis may save lives by stopping the progression of malignancy [4]. The presence of HER family and heregulin-α is associated more with the aggression of the brain cancer as well as with a personalized treatment, and less with mortality or morbidity [1,2,3]. The prevalence of brain tumours is high, and some cases of malignant brain tumours are still incurable despite substantial advancements in imaging, radiation, chemotherapy, and surgical techniques [5,6]. There is a need to develop fast, ultra-sensitive screening methods for the simultaneous determination of several specific biomarkers in real samples. The use of inulin as a modifier of MWCNT pastes decorated with AuNPs, and the simultaneous testing of HRG-α and HER 1–4 are what make this work innovative. The determination of HRG-α [7,8], HER-1 [9,10,11,12], and HER-2 [13] from biological samples was also done using stochastic sensors prior to this investigation, while the determination of HER-3 and HER-4 was done using this method for the first time. Excellent materials for the design of 3D stochastic microsensors include gold nanoparticles [14] as well as nanomaterials with enhanced active surface area and high conductivity [15]. Stochastic sensors have replaced traditional electrochemical sensors as a good option because they can produce accurate quantitative and qualitative assessments [16]. Pore conductivity is the basis for these kinds of sensors. Pores are potential building blocks for stochastic sensors because they produce fluctuations that are straightforward in their binary manifestations, ton and toff, which stand for ionic current/response through the pore [17].
2. Materials and Methods
2.1. Materials
The solutions were prepared with deionized water from a Direct-Q3 Water Purification system (Millipore Corporation, Darmstadt, Germany), and all the reagents were of analytical quality. HRG-α, Human Epithelial Growth Factor Receptor (HER) 1–4, multi-walled carbon nanotubes (MWCNTs), sodium phosphate dibasic heptahydrate, sodium phosphate monobasic monohydrate, gold nanoparticles (10 nm diameter, OD 1, stabilized suspension in 0.1 mM phosphate buffer solution (PBS), reactant free) were purchased from Sigma Aldrich (Burlington, MA, USA).
To evaluate the proposed sensors, a wide concentration range for each biomarker was chosen. For instance, standard solutions were used for each analyte in order to identify the biomarkers of interest: dilutions containing HRG-α (concentration range between 4.10 × 10⁻⁹–5.00 µg/mL), HER-1 and HER-2 (concentration range between 3.90 × 10⁻⁹–3.90 µg/mL), and HER-3 and HER-4 (concentration range between 1.00 × 10⁻⁹–1.00 µg/mL in PBS (0.1 mol/L) with the same pH = 7.4. The heregulin solutions were used for measurements for a month; after that, they were placed in a refrigerator and kept between 2 and 8 degrees Celsius. Fluka (Buchs, Switzerland) provided paraffin oil. Orafti Non-Food (Oreye, Belgium) provided Inutec SP1a,s (IN), while Sensus (Roosendaal, The Netherlands) provided Frutafit IQ1,f (IQ), Frutafit HD2,f (HD), and Frutafit HD3,f (TEX).
2.2. Methods
The stochastic method was the proposed work procedure. This technique was applied to the qualitative and quantitative evaluation of HRG-α and HER 1–4 in whole blood and tumoral tissue samples from patients with confirmed brain cancer. The toff and ton parameters were identified using the stochastic diagrams. The stochastic diagrams were used to identify the toff value of the analyte, and the value of ton was read in between two toff values and utilized to calculate concentration. The calibration graph 1/ton = a + b × Canalyte allowed the determination of the unknown analyte concentration. Utilizing the linear regression approach, concentration analytes were found for each sensor. The sensing mechanism of the analyte occurred in two steps following the application of the constant potential of 125 mV. The time it takes for the analyte to enter the pore and block it during the first phase is the analyte’s signature (toff value) and the qualitative parameter. When the analyte enters the pore, the current intensity is 0 A. The analyte interacts with the pore wall and undergoes redox reactions in the second phase: Ch(i) + Analyte(i) ⇔ Ch •Analyte(i), where i stands for the interface and Ch for the pore. The time needed for the analyte and pore wall to interact at equilibrium is represented by the quantitative parameter ton.
2.3. Instruments
The surface morphological analysis was performed with a scanning electron microscope (SEM), Inspect S type. For the qualitative analysis of the studied pastes was used Everhart-Thornley detector in high vacuum mode, at a high voltage of 30 kV and magnification of 6000×.
A 3D printer was used in the lab to create 3D microtubes with 25 µm internal diameters. Each of the modified pastes was put into a 3D microtube, and a silver wire ensure a connection between the paste and the outside circuit. Between measurements, deionized water was used to clean and dry the 3D microsensors. They were hidden from light and kept at normal temperature while not in use.
At room temperature, all stochastic measurements were made with a 910 PSTAT mini (Metrohm AG, Utrecht, The Netherlands) connected to a laptop with PSTAT software. For the measurements of ton and toff values, a chronoamperometric technique at a fixed potential (125 mV versus Ag/AgCl) was employed. The working electrode (based on MWCNTs modified with inulins, and decorated with AuNPs), an Ag/AgCl reference electrode, and the counter electrode, a platinum wire, made up the electrochemical cell.
2.4. Design of 3D Microsensors Based on MWCNT
In order to design the 3D microsensors, homogenous pastes were obtained by mixing 50 mg of MWCNT powder with 10 µL of AuNP dispersion and paraffin oil. Each of the pastes was modified with a 50 µL solution of inulin (IN, IQ, HD, and TEX 1.00 × 10⁻³ mol L−1, prepared in deionized water), which were introduced into 3D microtubes. The sensors were protected from light and kept in a refrigerator between 2 and 8 °C when not in use.
2.5. Biological Samples
Patients coming to the emergency room with specific symptoms of brain cancer were considered for the study. After confirmation, the brain cancer, whole blood, and tissue were taken as biopsies were taken and analysed accordingly with the Ethics Committee approval number 65573/14.12.2018, obtained from the University Emergency Hospital in Bucharest. Results obtained for eight brain tumour tissue and twelve whole blood samples were shown in this paper. Patients with confirmed brain cancer gave their informed consent before having their samples taken. Prior to the measurements, the patients had no treatment for their illness. The samples were used as taken from the patients. All brain tumour tissues were analysed fresh just after their collection. Sterile vessels were used every time.
3. Results and Discussion
3.1. Morphological Characterization of the Pastes
SEM images of IN-AuNP-MWCNT, IQ-AuNP-MWCNT, HD-AuNP-MWCNT, and TEX-AuNP-MWCNT are shown in Figure 1a–d. From the analysis of the electron microscopy images, it can be seen that the particles are seen as superimposed and agglomerated in non-uniform formations, with dimensions of several micrometers (up to 10 μm). Moreover, the studied materials present a layered structure, and no major qualitative differences between the four analyzed pastes were observed.
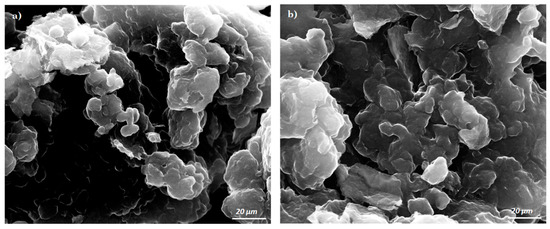
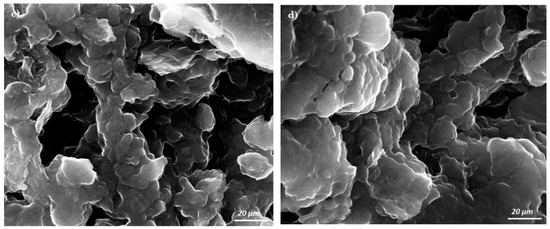
Figure 1.
SEM micrographs of IN-AuNP-MWCNT (a), IQ-AuNP-MWCNT (b), HD-AuNP-MWCNT (c), and TEX-AuNP-MWCNT (d).
3.2. Response Characteristics of Stochastic Microsensors
The molecular recognition of HRG-α and HER 1–4, based on their signatures, as well as the quantification of HRG-α and HER 1–4 using the calibration equations (Table 1), were achieved with the help of stochastic diagrams for brain tumor tissue (Figure 2) and whole blood (Figure 3) samples.

Table 1.
Response characteristics of the 3D microsensors used for the assay of HRG-α, HER-1, HER-2, HER-3, and HER-4.

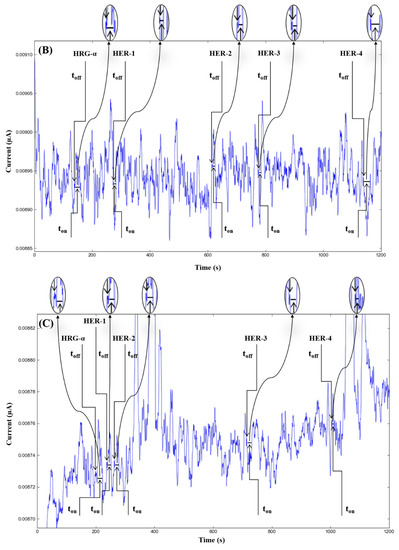
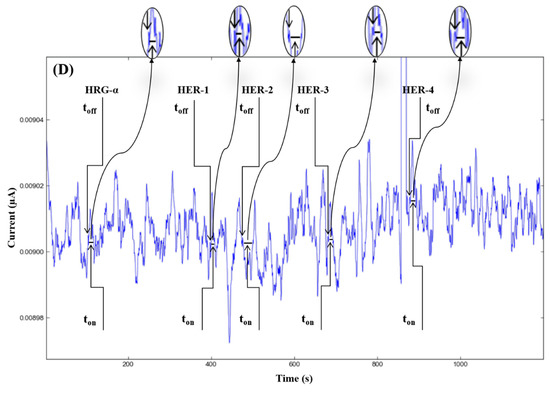
Figure 2.
Stochastic diagrams recorded in brain tumor tissue samples with 3D stochastic microsensors based on IN/AuNP-MWCNT (A), IQ/AuNP-MWCNT (B), HD/AuNP-MWCNT (C), and TEX/AuNP-MWCNT (D).
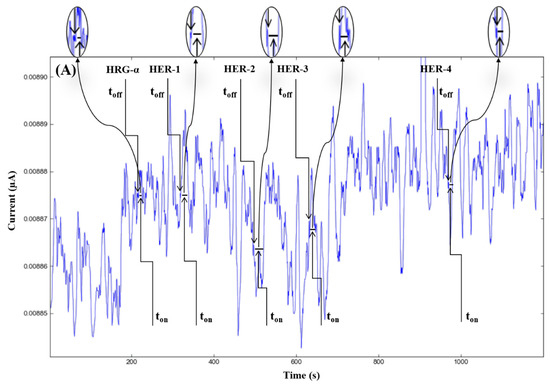
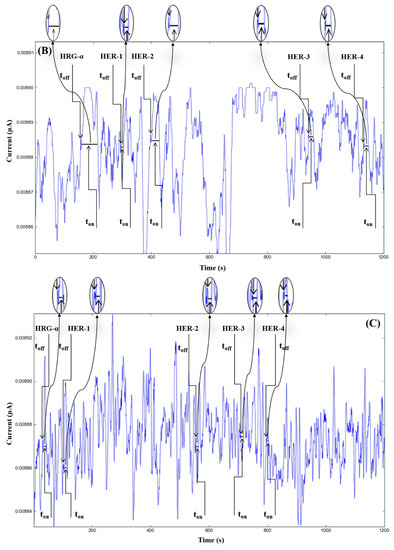
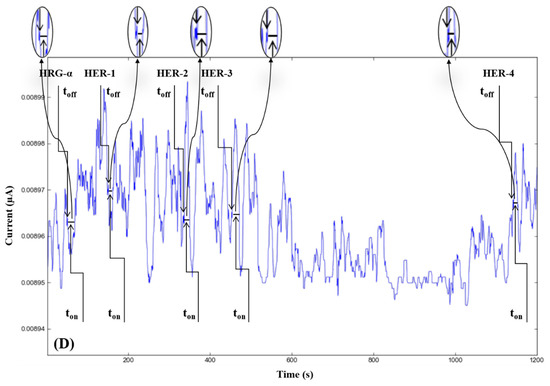
Figure 3.
Stochastic diagrams recorded in whole blood samples with 3D stochastic microsensors based on IN/AuNP-MWCNT (A), IQ/AuNP-MWCNT (B), HD/AuNP-MWCNT (C), and TEX/AuNP-MWCNT (D).
Wider linear concentration ranges were found for the 3D stochastic microsensor based on TEX-AuNP-MWCNT for the assay of HER-1 and HER-2 (3.9 × 10⁻⁹–3.9 × 10⁻¹ µg mL−1), the 3D stochastic microsensor based on IN-AuNP-MWCNT for the assay of HER-3 (1.00 × 10⁻⁹–1.00 × 10⁻² µg mL−1), and the 3D stochastic microsensor based on IQ-AuNP-MWCNT for the assay of HER-4 (1.00 × 10⁻⁹–1.00 × 10⁻¹ µg mL−1).
In comparison to the methods described earlier in the literature for the assay of HER- for heregulin-2 [18,19,20,21], the method using 3D stochastic microsensors based on IQ, HD, and TEX can determine HER-2 at fg mL−1 magnitude order.
The 3D stochastic microsensor based on HD/AuNP-MWCNT achieved the highest sensitivities for all proposed biomarkers in this study. In terms of all sensitivities, the molecular recognition of HRG-α using HD/AuNP-MWCNT yielded the highest sensitivity (2.49 × 10⁷ s g mL−1).
In the case of HRG-α, the limit of quantification for all four sensors was the same magnitude order as the previous determinations which referred to disposable stochastic sensors [7] and 3D stochastic microsensors based on carbon nanotubes [8]. But, the most important achievement of the proposed 3D stochastic microsensors is their ability for simultaneous assay of HRG-α, HER-1, HER-2, HER-3, and HER-4, with very high sensitivities, up to fg mL−1 concentration level, and on wide linear concentration ranges. Larger working concentration ranges were obtained for the proposed stochastic sensors versus the ELISA kits (the only alternative methods of analysis of these biomarkers proposed to date); the working concentration ranges of ELISA are: between 109.38 and 7000 pg mL−1 for HER-1, between 31.25 and 2000 pg mL−1 for HER-2, between 43 and 2500 pg mL−1 for HER-3, between 157 and 10,000 pg mL−1 for HER-4, and between 12.29 and 3000 pg mL−1 for heregulin-α. Also, stochastic sensors presented lower limits of determination (of fg mL−1 magnitude order), compared with those presented by ELISA (of pg mL−1 magnitude order).
3.3. Selectivity
The toff values obtained for potential interferents like cytokines: interleukin-2 human (IL-2), interleukin-4 human (IL-4), and isocitrate dehydrogenases 1 (IDH-1), and 2 (IDH-2), provide information about the selectivity of the 3D microsensors. The signatures of each biomarker varied, as shown in Table 2, hence none of the investigated interferents had an influence on the recognition of HRG-α, HER-1, HER-2, HER-3, and HER-4.
Table 2.
The selectivity of the 3D microsensors.
3.4. Molecular Recognition and Quantification of HRG-α, HER-1, HER-2, HER-3, and HER-4 in Biological Samples
The proposed 3D microsensors were used to screen eight tumour tissue and twelve whole blood samples (Figure 2 and Figure 3). The biological samples were placed into the electrochemical cell, and the sensors were inserted directly into the samples and further proceed accordingly with the stochastic method as described above. Figure 4 and Figure 5 display the outcomes of the analysis of tumor tissues and whole blood samples to identify HRG-α, HER-1, HER-2, HER-3, and HER-4. ELISA was used as the gold standard method. Very good correlations between the screening method based on 3D stochastic microsensors and ELISA were obtained.
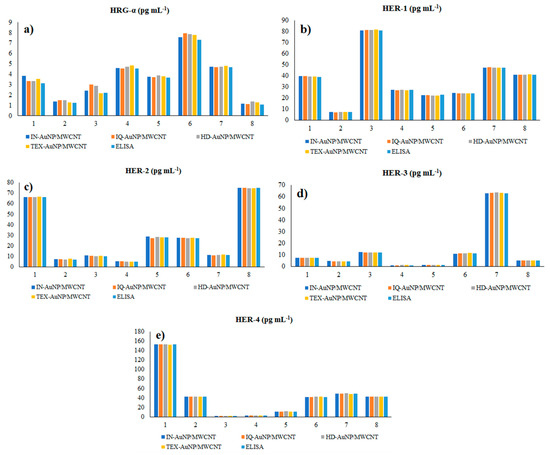
Figure 4.
Determination of HRG-α (a), HER-1 (b), HER-2 (c), HER-3 (d), and HER-4 (e) in brain tumor tissue samples, using 3D stochastic microsensors based on IN/AuNP-MWCNT, IQ/AuNP-MWCNT, HD/AuNP-MWCNT, and TEX/AuNP-MWCN, and the gold standard method-ELISA.
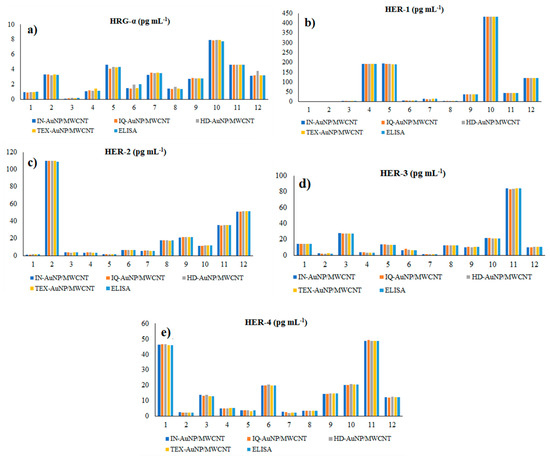
Figure 5.
Determination of HRG-α (a), HER-1 (b), HER-2 (c), HER-3 (d), and HER-4 (e) in whole blood samples, using 3D stochastic microsensors based on IN/AuNP-MWCNT, IQ/AuNP-MWCNT, HD/AuNP-MWCNT, and TEX/AuNP-MWCN, and the gold standard method-ELISA.
Paired t-tests were performed at 99.00% confidence level (tabulated theoretical t-value: 4.032) for the assay of HRG-α, HER-1, HER-2, HER-3, and HER-4 in whole blood and brain tumor tissue using the proposed sensors versus the gold standard method—ELISA. All calculated t-values were less than 3.200 proving that there is no statistically significant difference between the results obtained using the proposed stochastic microsensors. Accordingly, the proposed stochastic microsensors can be reliably used for the molecular recognition and quantification of HRG-α, HER-1, HER-2, HER-3, and HER-4 in whole blood and brain tumor tissue.
The determination of HRG-α, HER-1, HER-2, HER-3, and HER-4 in brain tumor tissue and whole blood samples was carried out using recovery tests: known amounts of biomarkers were added to the whole blood and tissues sample, and determination of the biomarkers was done before and after the addition of the known amounts; the determined amount was divided to the added amount and multiply by 100 to give the percentage recovery. Table 3 shows that the biomarkers can be accurately detected in biological samples, with recoveries higher than 95.00%, and RSD% values lower than 0.10.
Table 3.
Recovery assays of HRG-α, HER-1, HER-2, HER-3, and HER-4 in biological samples using the 3D microsensors (N = 3).
4. Conclusions
The design of stochastic microsensors for screening tests for the detection of brain cancer has proven to be very successful when gold nanoparticles and nanomaterials are combined with inulins for the active surface of the stochastic sensors. The panel of biomarkers HRG-α, HER-1, HER-2, HER-3, and HER-4 were chosen to be evaluated simultaneously in biological samples. The sensors were proven to be reliable when used for the screen test of biological samples such as whole blood, and tumoral tissue samples. The 3D stochastic microsensors have great features for the early detection of brain cancer.
Author Contributions
C.C.N. and R.-I.S.-v.S. performed the electrochemical measurements and wrote the manuscript; P.S. evaluated the surface analysis of the pastes. All authors have read and agreed to the published version of the manuscript.
Funding
This work was supported by a grant from the Ministry of Research, Innovation and Digitization, CNCS/CCCDI—UEFISCDI, project number PN-III-P1-1.1-PD-2019-0324, within PNCDI III.
Institutional Review Board Statement
The University Emergency Hospital from Bucharest provided the whole blood and tissue samples from patients who were diagnosed with brain cancer (informed consent was obtained from all patients, the Ethics committee of the University Emergency Hospital from Bucharest, approval number 65573/14.12.2018) in order to use them for the screening tests for HGR-α, HER-1, HER-2, HER-3, HER-4.
Informed Consent Statement
Informed consent was obtained from all patients, the Ethics committee of the University of Medicine and Pharmacy “Carol Davila” from Bucharest, approval number 65573/14.12.2018.
Data Availability Statement
There are not applicable to this paper.
Conflicts of Interest
The authors declare no conflict of interest.
References
- Falls, D.L.; Rosen, K.M.; Corfas, G.; Lane, W.S.; Fischbach, G.D. ARIA, a protein that stimulates acetylcholine receptor synthesis, is a member of the new ligand family. Cell 1993, 72, 801–815. [Google Scholar] [CrossRef]
- Yarden, Y.; Sliwkowski, M.X. Untangling the ErbB signaling network. Nat. Rev. Mol. Cell Biol. 2001, 2, 127–137. [Google Scholar] [CrossRef] [PubMed]
- GBD 2015 Mortality and Causes of Death Collaborators. Global, regional, and national life expectancy, all-cause mortality, and cause-specific mortality for 249 causes of death, 1980–2015: A systematic analysis for the Global Burden of Disease Study 2015. Lancet 2016, 388, 1459–1544. [Google Scholar] [CrossRef]
- Chandra, P.; Tan, Y.N.; Singh, S.P. Next Generation Point-of-Care Biomedical Sensors Technologies for Cancer Diagnosis; Springer: Singapore, 2017. [Google Scholar] [CrossRef]
- Schwartzbaum, J.A.; Fisher, J.L.; Aldape, K.D.; Wrensch, M. Epidemiology and molecular pathology of glioma. Nat. Clin. Pract. Neurol. 2006, 2, 494–503. [Google Scholar] [CrossRef] [PubMed]
- Smoll, N.R.; Schaller, K.; Gautschi, O.P. Long-term survival of patients with glioblastoma multiforme (GBM). J. Clin. Neurosci. 2013, 20, 670–675. [Google Scholar] [CrossRef] [PubMed]
- Gheorghe, S.S.; Cioates Negut, C.; Badulescu, M.; Stefan-van Staden, R.I. Sensitive Detection of Heregulin-α from Biological Samples Using a Disposable Stochastic Sensor Based on Plasma Deposition of GNPs–AgPs’ Nanofilms on Silk. Life 2021, 11, 894. [Google Scholar] [CrossRef] [PubMed]
- Stefan-van Staden, R.I.; Cioates Negut, C.; Gheorghe, S.S.; Ciorita, A. 3D Stochastic microsensors for molecular recognition and determination of heregulin-α in biological samples. Anal. Bioanal. Chem. 2021, 413, 3487–3492. [Google Scholar] [CrossRef] [PubMed]
- Stefan-van Staden, R.I.; Comnea-Stancu, I.R.; Surdu-Bob, C.C. Molecular screening of blood samples for the simultaneous detection of CEA, HER-1, NSE, CYFRA 21-1 using stochastic sensors. J. Electrochem. Soc. 2017, 164, B267–B273. [Google Scholar] [CrossRef]
- Stefan-van Staden, R.I.; Moldoveanu, I.; Stanciu-Gavan, C. Pattern recognition of HER-1 in biological fluids using stochastic sensing. J. Enzyme Inhib. Med. Chem. 2015, 30, 283–285. [Google Scholar] [CrossRef] [PubMed][Green Version]
- Moldoveanu, I.; Stefan-van Staden, R.I.; van Staden, J.F.; Stanciu-Gavan, C.; Savlovschi, C. Platform based on microsensors used for the screening of HER-1 in peritoneal fluid. Rev. Roum. Chim. 2015, 60, 447–451. [Google Scholar]
- Stefan-van Staden, R.I.; Comnea-Stancu, I.R.; Surdu-Bob, C.C.; Badulescu, M. Nanostructured materials detect epidermal growth factor receptor, neuron-specific enolase and carcinoembryonic antigen. Nanoscale 2015, 7, 15689–15694. [Google Scholar] [CrossRef] [PubMed]
- Moldoveanu, I.; Stefan-van Staden, R.I. Pattern recognition of HER-2 in whole blood samples using stochastic microsensors. ECS J. Solid State Sci. Technol. 2015, 4, S3067–S3070. [Google Scholar] [CrossRef]
- Qiu, H.J.; Guan, Y.; Luo, P.; Wang, Y. Recent advances in fabricating monolithic 3D porous graphene and their applications in biosensing and biofuel cells. Biosens. Bioelectron. 2017, 89, 85–95. [Google Scholar] [CrossRef] [PubMed]
- Arunachalam, S.; Gupta, A.A.; Izquierdo, R.; Nabki, F. Suspended carbon nanotubes for humidity sensing. Sensors 2018, 18, 1655. [Google Scholar] [CrossRef] [PubMed]
- Bayley, H.; Cremer, P.S. Stochastic sensors inspired by biology. Nature 2001, 413, 226–230. [Google Scholar] [CrossRef] [PubMed]
- Gu, L.Q.; Braha, O.; Conlan, S.; Cheley, S.; Bayley, H. Stochastic sensing of organic analytes by a pore-forming protein containing a molecular adapter. Nature 1999, 398, 686–690. [Google Scholar] [CrossRef] [PubMed]
- Li, X.; Shen, C.; Yang, M.; Rasooly, A. Polycytosine DNA electric-current generated immunosensor for electrochemical detection of human epidermal growth factor receptor 2 (HER2). Anal. Chem. 2018, 90, 4764–4769. [Google Scholar] [CrossRef] [PubMed]
- Tabasi, A.; Noorbakhsh, A.; Sharifi, E. Reduced graphene oxide-chitosan-aptamer interface as new platform for ultrasensitive detection of human epidermal growth factor receptor 2. Biosens. Bioelectron. 2017, 95, 117–123. [Google Scholar] [CrossRef] [PubMed]
- Sharma, S.; Zapatero-Rodriguez, J.; Saxena, R.; O’ Kennedy, R.; Srivastava, S. Ultrasensitive direct impedimetric immunosensor for detection of serum HER2. Biosens. Bioelectron. 2018, 106, 78–85. [Google Scholar] [CrossRef] [PubMed]
- Sypabekova, M.; Amantayeva, A.; Vangelista, L.; Gonzalez-Vila, A.; Caucheteur, C.; Tosi, D. Ultralow limit detection of soluble HER2 biomarker in serum with a fiber-optic ball-tip resonator. ACS Meas. Sci. Au 2022, 2, 309–316. [Google Scholar] [CrossRef]


Publisher’s Note: MDPI stays neutral with regard to jurisdictional claims in published maps and institutional affiliations. |
© 2022 by the authors. Licensee MDPI, Basel, Switzerland. This article is an open access article distributed under the terms and conditions of the Creative Commons Attribution (CC BY) license (https://creativecommons.org/licenses/by/4.0/).