You are currently viewing a new version of our website. To view the old version click .
Physics
  • Article
  • Open Access

12 November 2025

Fast and Robust Simulation of Atmospheric Phase Screen by Zernike Polynomials with Recursive Radial Formulas

,
,
,
and
College of Electronic Information and Optical Engineering, Taiyuan University of Technology, Taiyuan 030024, China
*
Author to whom correspondence should be addressed.
This article belongs to the Section Computational Physics

Abstract

The Zernike polynomial method is extensively used for atmospheric phase screen generation but is limited by insufficient high-frequency components. Calculating higher-order terms introduces challenges in computational efficiency and numerical instability when using the direct method. This paper analyzes these issues and proposes replacing the direct method with recursive radial formulas. We evaluate four recursive algorithms (Barmak’s, q-recursive, Prata’s and Kintner’s) for their performance in phase screen generation, focusing on computational speed and numerical stability. Our results demonstrate that recursive methods achieve a 10–20-times improvement in computational efficiency and maintain numerical stability even for high-order expansions. The main novelty of this study lies in the comprehensive comparison and validation of these recursive strategies for high-accuracy atmospheric phase screen simulation.

1. Introduction

When a light beam propagates through the atmosphere, it is influenced by the turbulent effect that causes its wavefront to be disturbed, hence inducing the phenomena of light intensity scintillation, imaging distortion and beam drifting []. This is quite a challenge in astronomical observation. As a consequence, the simulation of atmospheric turbulence provides a valuable technique for better understanding these effects. The frozen flow hypothesis, also known as the Taylor hypothesis [], has shown that it is possible to simulate the turbulence effects with a thin screen on which the accumulated distorted wavefront is evaluated. In addition, the study of the atmospherically distorted wavefront is also closely associated with several other research fields, such as adaptive optics system debugging [,], learning-based algorithms linked to atmospheric effects [,], optical experiment simulations [], and others.
Numerous methods have been proposed to generate the atmospheric phase screen [,,]. The Zernike polynomial method is an often-used method, first detailed by Nicolas Roddier []. However, the Zernike polynomial method suffers from issues with high-frequency component insufficiency, and the only solution is to calculate the higher orders of the Zernike polynomials as much as possible, which is numerically intense. This is especially true when generating a phase screen with a relatively large aperture; thousands of terms are needed [] in order to properly simulate the physical phenomena because a larger aperture corresponds to having a higher cut-off frequency in a diffraction-limited optical system. However, since the Zernike polynomial method is commonly used for studies involving anisoplanatic turbulence simulations [] and dynamic phase screen simulations [,], it is necessary to address the remaining issues first. The problems are computational inefficiency and numerical instability while numerically computing the values of Zernike polynomials. According to Marcel Carbillet and Armando Riccardi [], Greg Forbes [] and Kuo Niu and Chao Tian [], using a recursive formula to calculate the Zernike radial polynomials is a possible solution. Moreover, it is worth discussing how the computational method for Zernike radial polynomials influences the phase screen generation.
In this paper, Section 2 details the generation of a phase screen using the Zernike polynomial method and discusses the reasons for and consequences of computational inefficiency and numerical instability. In order to solve these problems, most-used recursive radial formulas are introduced in Section 3 and presented in detail. Next, their performances in the generation of a phase screen are experimented with and discussed in Section 4. Finally, a conclusion is provided in Section 5.

2. Theory and Problems

2.1. Atmospheric Phase Screen with Zernike Polynomial Method

An optical wavefront can be viewed as a two-dimensional function that can be decomposed into a linear combination of orthogonal bases. The Zernike polynomials have been providing such a set of bases that are orthogonal over a unit circle, and the mathematical expression of them under Noll’s definition [] is as follows:
Z f ρ , θ = 2 n + 1 R n m ρ c o s ( m θ ) , m 0 , j   i s   e v e n , 2 n + 1 R n m ρ s i n ( m θ ) , m 0 , j   i s   o d d , n + 1 R n m ρ , m = 0 ,
where
R n m ρ = n = 0 n m / 2 1 n n 2 ! s ! n + m 2 2 ! n m 2 2 ! ρ n 2 n .
Equation (2) is the analytic expression of Zernike radial polynomials. ρ and θ denote the normalized radial coordinate and the azimuthal angle, respectively. n is the radial index number and m is the frequency index. These indices have to satisfy the following conditions: 0 ≤ mn and (nm) is even; the transform relations between the single index j and double indices n and m are detailed in Ref. [].
As previously mentioned, a wavefront can be expressed as a linear combination of a series of Zernike polynomials since they are orthogonal to each other over the unit circle. Its expression reads
W R ρ , θ = j = 2 N a j Z j ρ , θ ,
where aj is the weighting coefficient of the j-the order of the Zernike polynomial Zj and N corresponds to the maximum Zernike term used to generate the wavefront function. In addition, we summate Equation (3) starting from j = 2 since the piston term (corresponding to the j = 1 term in Zernike polynomials) does not contribute to the atmospheric screen. Additionally, for cases where the radius R of aperture is unequal to 1, the transform ρ = r/R can be made (r ranges from 0 to R); thereby, l ρ is normalized within any given circle aperture size.
However, it is still ineffective to simulate the randomly distorted phase screen only by generating a series of Gaussian random numbers for coefficients aj (j = 2, 3, …, N) for Equation (3) since there exists a given covariance between them that has to be taken into account, signifying that Zernike polynomials are not statistically independent from each other []. The expression of covariance between any two Zernike coefficients under Kolmogorov spectrum consideration reads [,]
E a j , a j = K j j δ j j Γ n + n b / 3 / 2 D / r 0 5 / 8 Γ n n + 17 / 8 / 2 Γ n n + 17 / 8 / 2 Γ n + n + 23 / 3 / 2   ,
where D is the aperture diameter and r0 is the Fried parameter, characterizing the turbulence strength;   Γ is a gamma function; K j j is a factor given as
K j j = Γ 14 / 3 24 / 5 Γ 6 / 5 3 / 6 Γ 11 / 6 2 2 π 2 × 1 n + n 2 m / 2 n + 1 n + 1   ,
where n, n′, m and m′ are the radial degrees and azimuthal frequencies of Zernike polynomials corresponding to aj and aj′. And δjj′ is a logical Kronecker symbol defined as
δ j j = m = m p a r i t y j , j m = 0 ,
where parity (j, j′) denotes whether the indexing numbers j and j′ have the same parity.
Then, the collection for the correlation of coefficients can be written as a covariance matrix whose elements are computed by Equation (4):
C = E A A T = E a 2 , a 2 E a 2 , a 3 E a 2 , a N E a 3 , a 2 E a 3 , a 3 E a 3 , a N E a N , a 2 E a N , a 3 E a N , a N ,
and A is the vector of Zernike coefficients; that is, A = [a2, a3, …, aN]T.
Furthermore, correlated and random Zernike coefficients can be drawn from the covariance matrix (7). Decomposition through the Cholesky factorization method that is used by Nicholas Chimitt and Stanley H. Chan [] was adopted in the current study. Instead of the singular value decomposition (s.v.d.) method commonly used, since the covariance matrix C is a sparsely symmetric and positive definite matrix, a faster and more accurate programming operation results if this strategy is taken. The Cholesky factorization is given as
C = L L T ,
where L is a lower triangular matrix. Then, a Gaussian random vector B = [b2, b3, …, bN]T is created, and its elements are zeros, indicating mean Gaussian random numbers with unit variance. The transformed coefficient vector
A = L B ,
is satisfied by E[AAT] = C. Based on the derivations presented above, a simple and sufficiently rapid method was adopted in this study to draw random samples of inter-mode correlated Zernike coefficients.
The coefficient vector (9), therefore, can then be substituted into Equation (3) to generate the random atmospheric phase screen, which satisfies the statistical properties of Kolmogorov turbulence.
After all the preparation, Equation (3) can be rewritten into numerical vector–matrix format for programming, which can be compactly written as
W = Z A ,
where W is a column vector with elements evaluated within the aperture under linear indexing, the length of which is equal to the number of grid points on the aperture circle. Z can be expressed as Z = [Z2|Z3|…|ZN], where Z2, Z3, and so on, are column vectors with linear-indexed Zernike polynomials values on the aperture, and the length of each term is the same as that of W.

2.2. Evaluation of the Generated Phase Screens

Calculating the structure function is a common method for confirming if the performance of the generated phase screens satisfies the specified statistical property. It is computed by definition:
D r = W ρ + r W ρ 2 ,
where “⟨⟩” stands for the average over realizations (samples). For a good approximation to Kolmogorov turbulence, D(r) should follow
D r = 6.88 ρ / r 0 5 / 3 ,
where r = |r|, where r is a position vector.
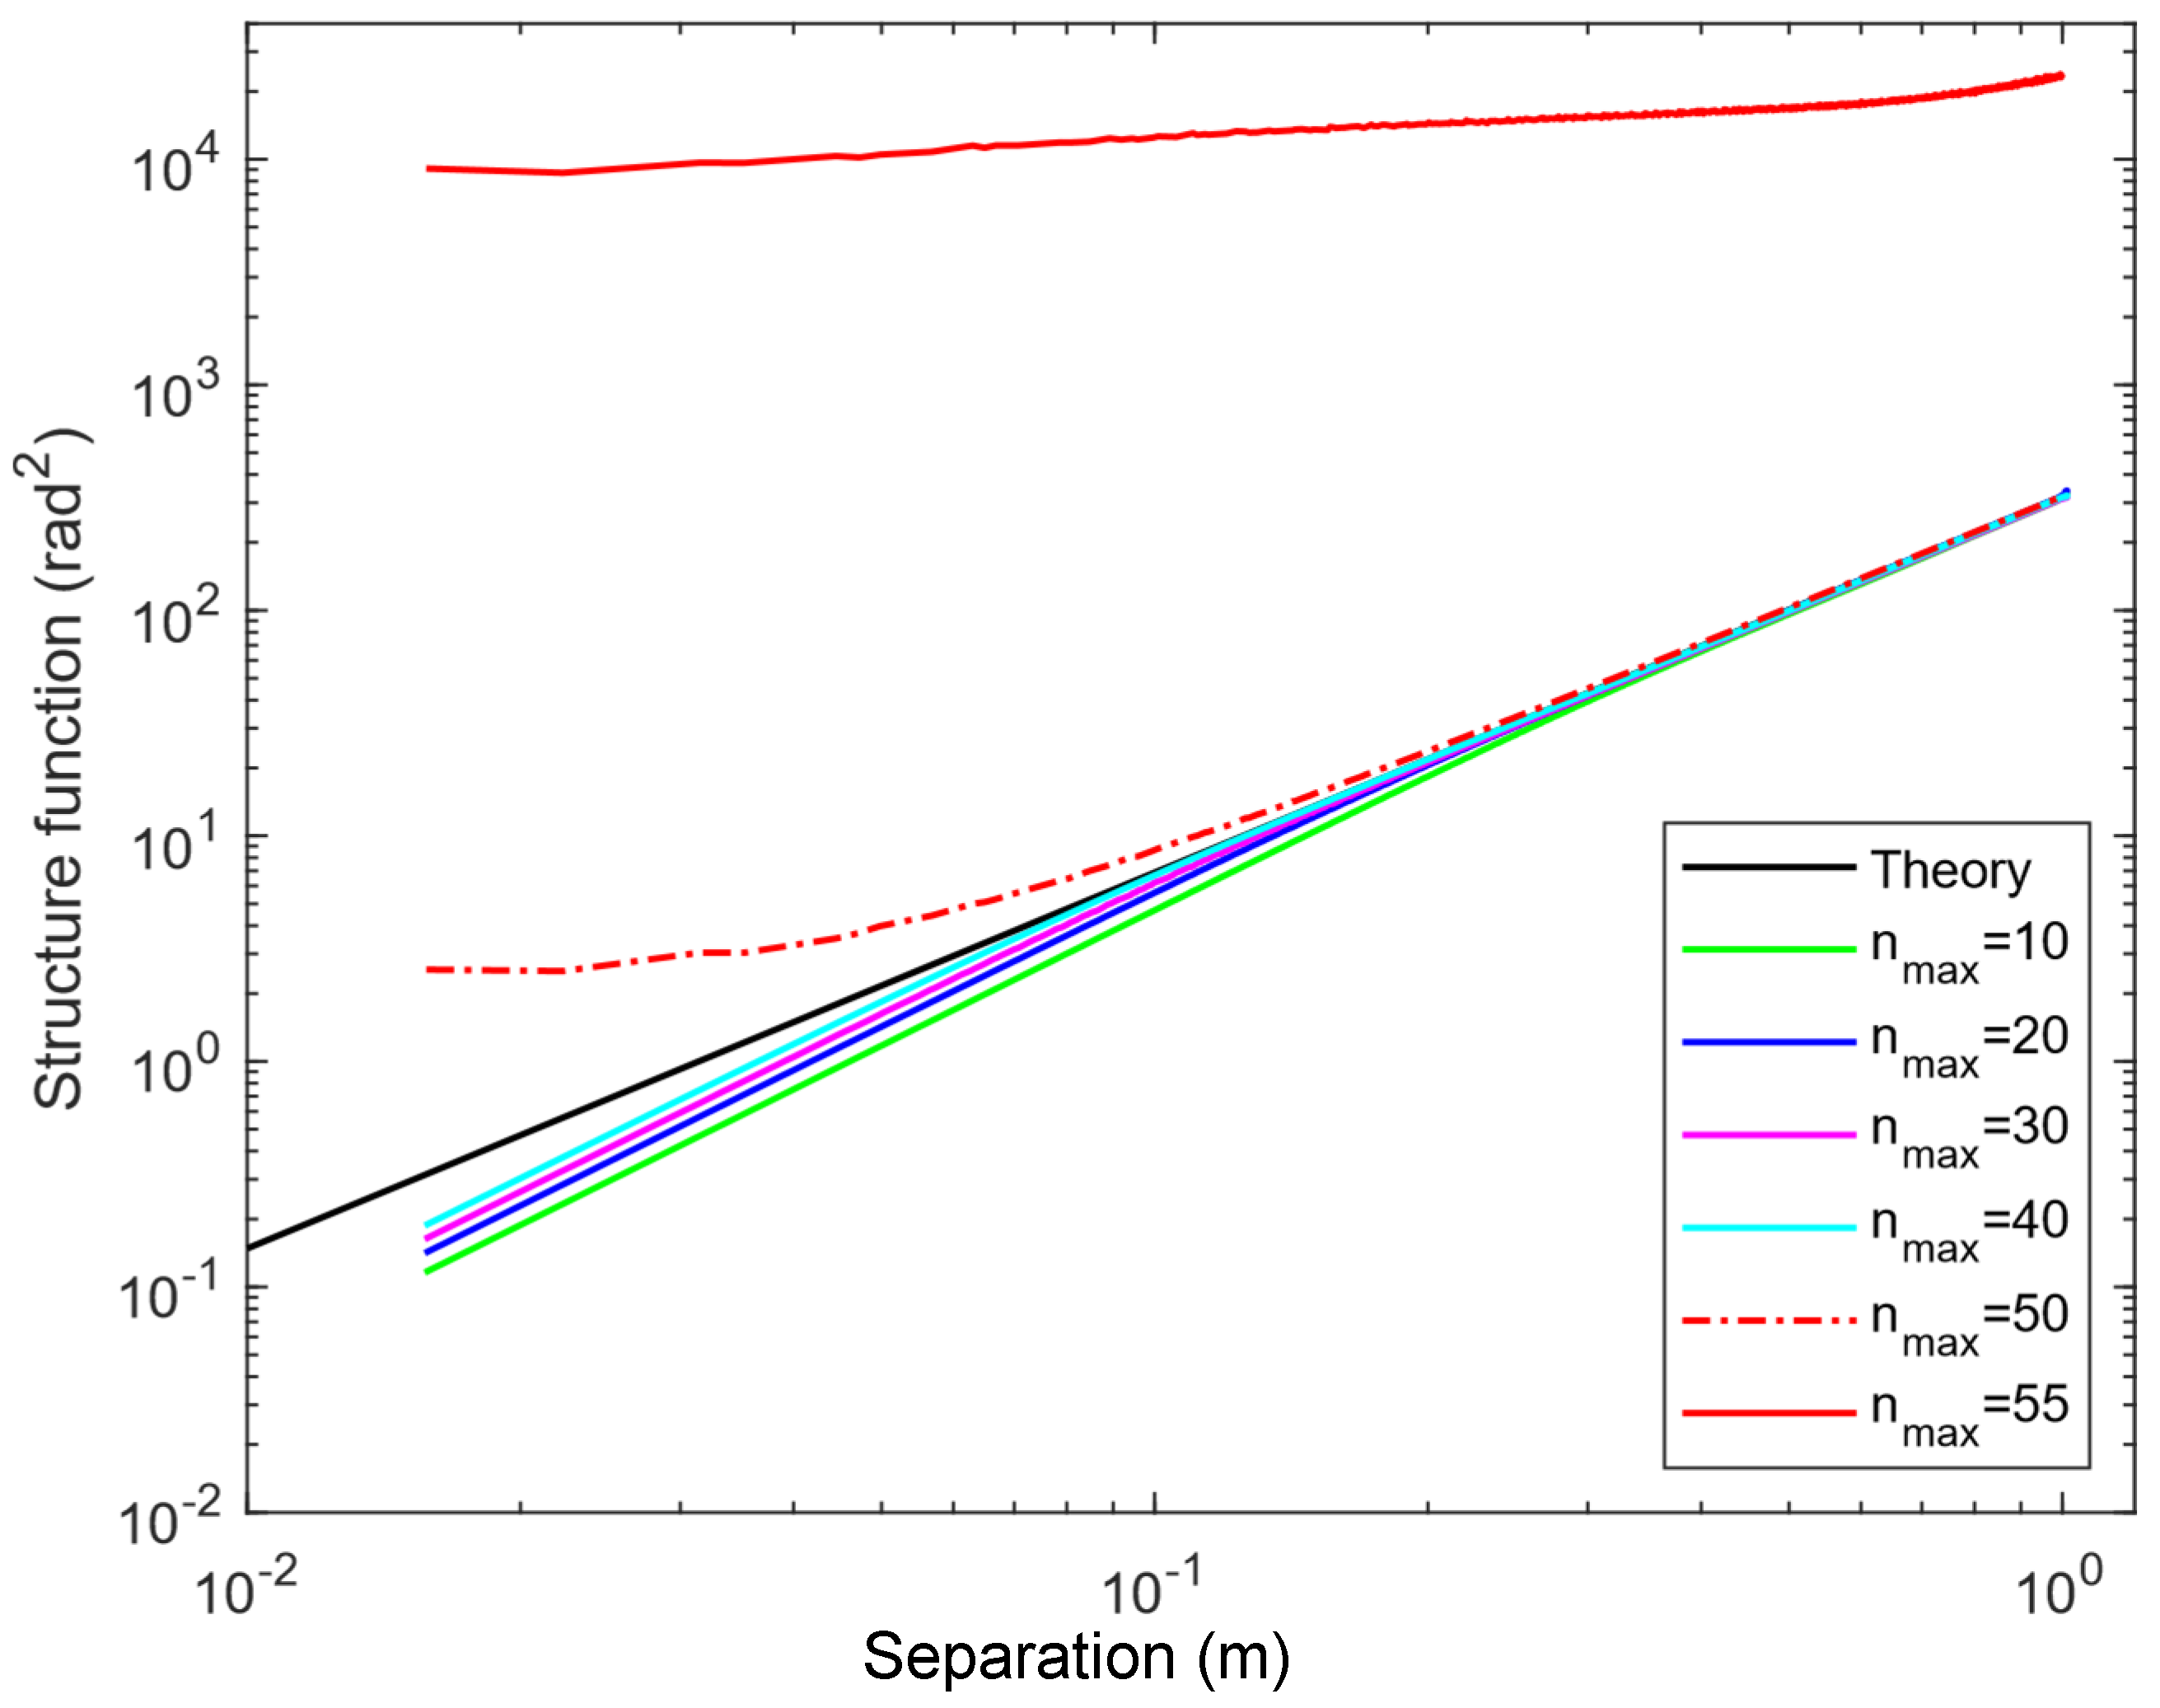
In Figure 1, the experiments are plotted with the following parameters: aperture radius R = 1 m, Fried constant r0 = 0.1, grid size (resolution) of 256, and variant parameter nmax, and the transformation N = nmax(nmax + 1)/2 + nmax + 1 can be applied to compute the total terms of Zernike polynomials used in phase screen generation. The theoretical calculations (black curve) are those by Equation (12). As can be observed in Figure 1, ignoring the red curves for a while, the low-frequency (large separation) part of the experimental and theoretical values fit reasonably well, while the high-frequency (low separation) part of the experimental values is insufficient. However, as the number of terms of the Zernike polynomial increases (as nmax increases from 10 to 40), the high-frequency components of experimental values approach the theoretical value curve. Roddier [] pointed out that the result simulated by a few hundred terms of Zernike polynomials is satisfactory; surely, it is sufficient for relatively long-range imaging scenarios. However, for comparably large-aperture and astronomical imaging applications, it is necessary to compute Zernike polynomials up to a radial order corresponding to D/r0 to accurately capture the blurring effects induced by high-order aberrations. In addition, the experimental values of the red curves (dashed–dotted line for nmax = 50, solid line for nmax = 55) significantly deviate from the theoretical curve, producing an abnormal phenomenon, which we attribute to the numerical instability inherent in the direct calculation method of high-order Zernike radial polynomials (as shown in Equation (2)) []. This instability arises from the summation of large enough alternating-sign terms, leading to catastrophic cancellation in finite-precision arithmetic.
Figure 1. Structure function comparison between theoretical prediction (2) (black curve) and simulations for atmospheric phase screens with Kolmogorov statistics at D/r0 = 20 for the aperture radius R = 1, Fried constant r0 = 1 and the grid size 256 × 256. Simulation curves represent an averages over 1000 independent realizations each. The theoretical curve follows a straight line in the inertial subrange, while the deviations are observed in the simulations arising from the limitation of representing turbulence with a finite number of Zernike terms.
In summary, the experimental phase structure functions indicate that the Zernike polynomial method faces a problem: it is insufficient in high-frequency components; using the terms of Zernike polynomials, as many as possible, to generate the phase screen is the only way to solve this problem but brings two new challenges: (i) a corresponding increase in computation and (ii) the numerical instability issue existing in the calculation of high-orders of Zernike polynomials.

2.3. Challenges in Computational Efficiency and Numerical Stability

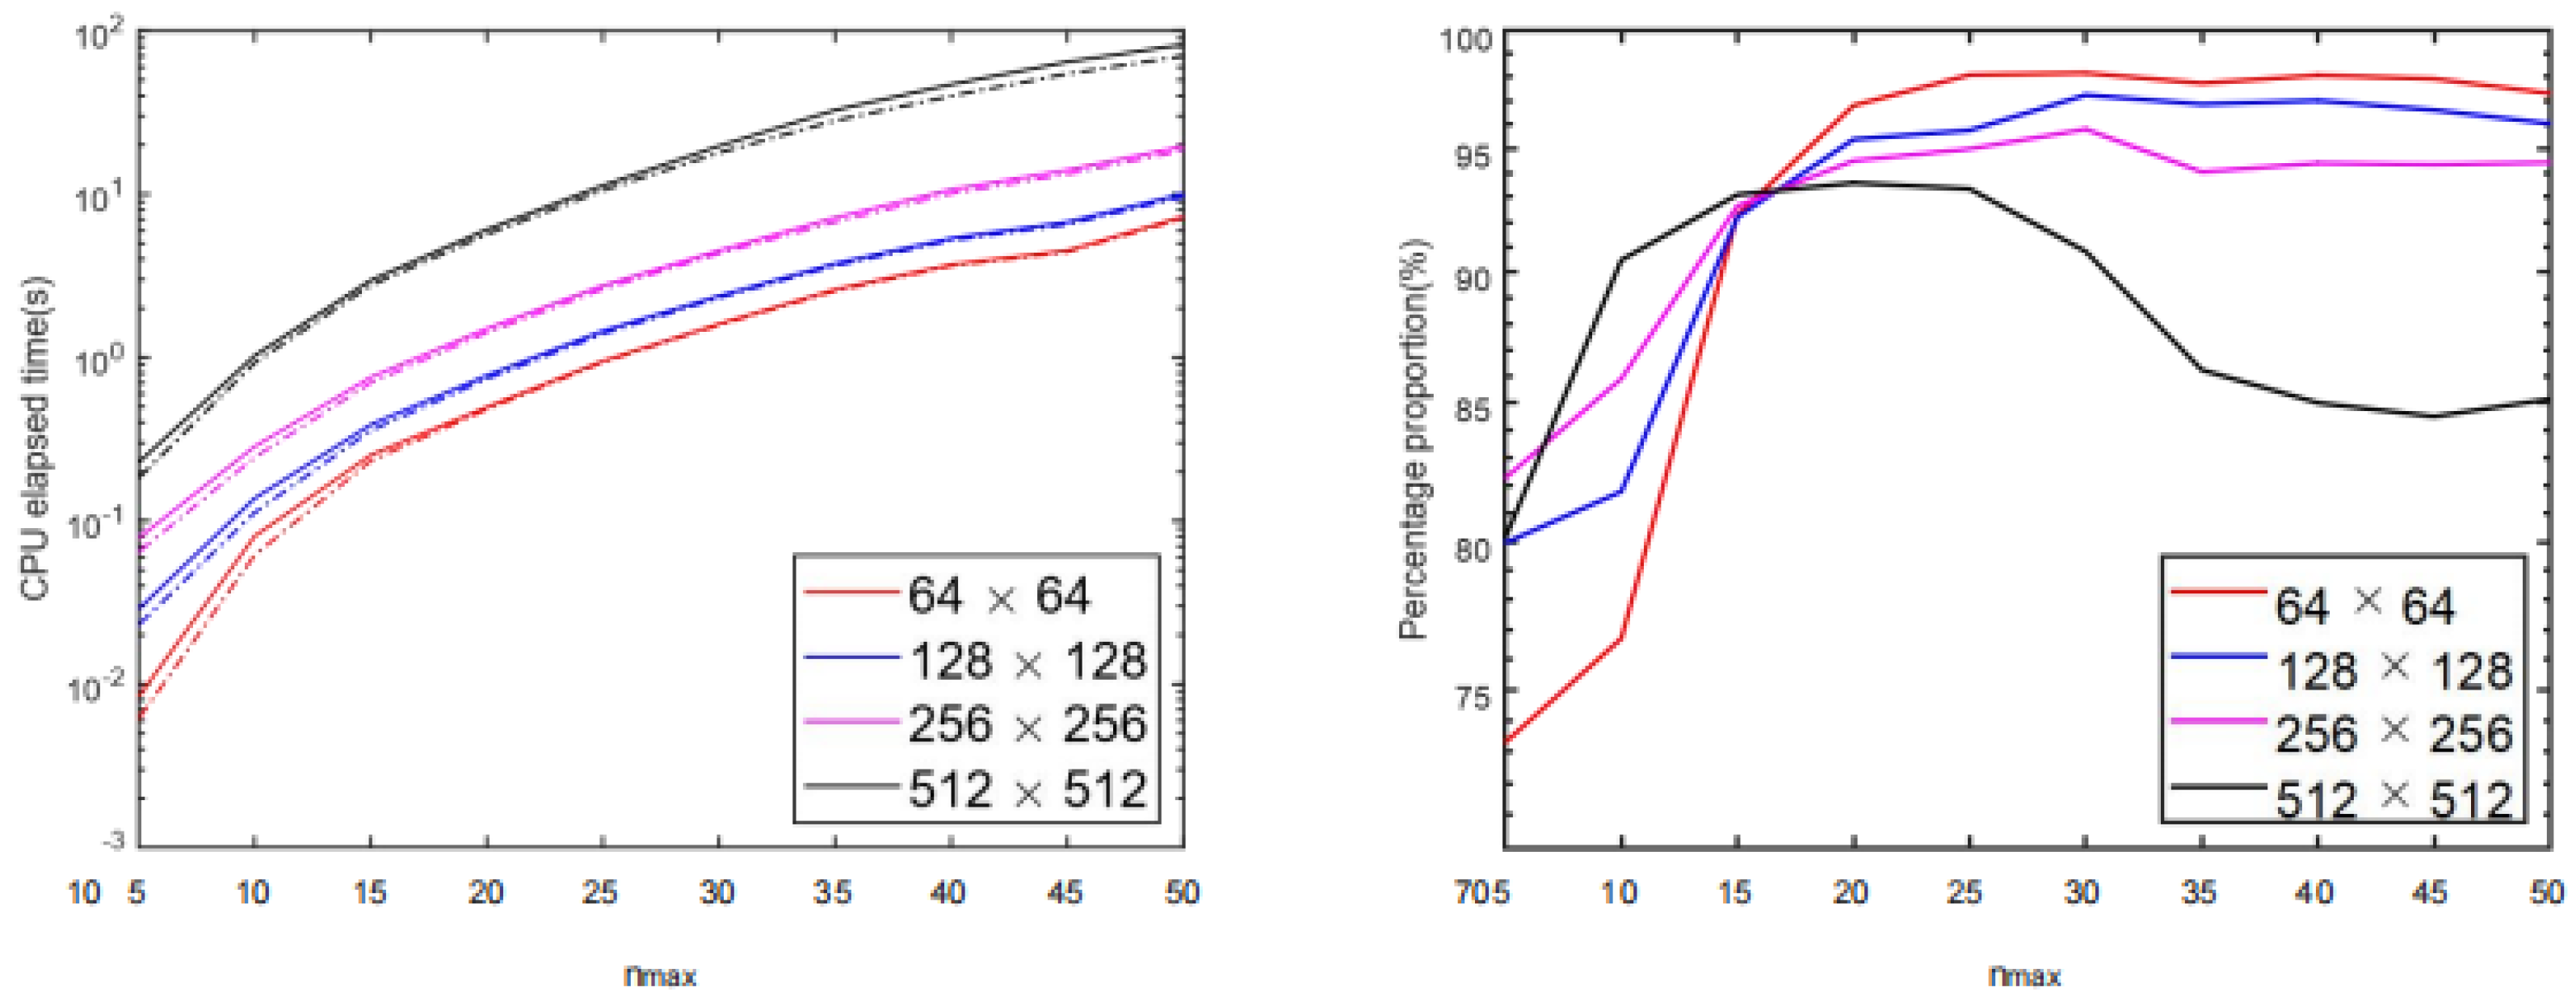
In Section 2.2, Equation (2) was denoted as the direct method for computation of Zernike radial polynomials. One drawback is that, as can be seen from the direct method, computational requirements are high since Equation (2) is heavily dependent on repeated factorial calculation and power series of radius ρ (which is an extensive vector for phase screen generation, e.g., with 51,420 grid points within the aperture circle for a 256 × 256 resolution screen). Therefore, the computational efficiency of the entire program suffers from the direct method; quite a straightforward experiment illustrating the issue is shown in Figure 2.
Figure 2. Left: CPU elapsed time of the entire program (solid curve) and direct method (2) (dashed-dotted curve). Right: the proportion of elapsed time of the direct method over the entire generation program (the program was executed by a laptop with Intel-1240P CPU and 4800MHZ memory, averaging 300 iterations, performed using MATLAB 2020a). The calculations are shown for different size grids as indicated.
Figure 2 identifies the enormous computational cost of elapsed CPU time for computing the Zernike radial polynomials using the direct method, adopting the programming strategy provided earlier. Comparatively, in Figure 2(left), the solid line represents the total runtime for executing the entire phase screen generation program, where the dashed–dotted line corresponds to the cost contributed by radial polynomials computed using the direct method, and Figure 2(right) represents the proportion of computational assumption of the direct method over the entire program as a percentage, showing the results of the dash–dot line divided by the solid line for different color lines, respectively, for phase screens generated with four different resolutions (number of grid points).
Figure 2(left) shows that, for different color lines, solid lines and dash–dot lines are quite close one to another, indicating the considerable time demand that the direct method consumes for the entire program. Therefore, Figure 2(right) is an illustration of the quantification of how the direct method influences the computational consumption for the whole program. As can be seen, the curves are almost over 85%. Moreover, for cases of generation of the exact screen (high values of nmax), the value of the percentage proportion is about 93% (except for 512 × 512 resolution, which is still higher than 85%). Thus, we consider the results in Figure 2 prove that the direct method is the root cause of the computational problem for the Zernike method. It is understandable that, based on Figure 2(right), the curves stabilize gradually and separate distinctly after nmax exceeds 30, and higher resolution corresponds to a lower proportion. The results indicate that the computational efficiency in phase screen generation suffers more from secondary operations (e.g., Zernike angular polynomials, decomposition of covariance matrix, matrix manipulation, and others) as screen resolution increases. However, the computational consumption still cannot be comparable with the radial polynomials.
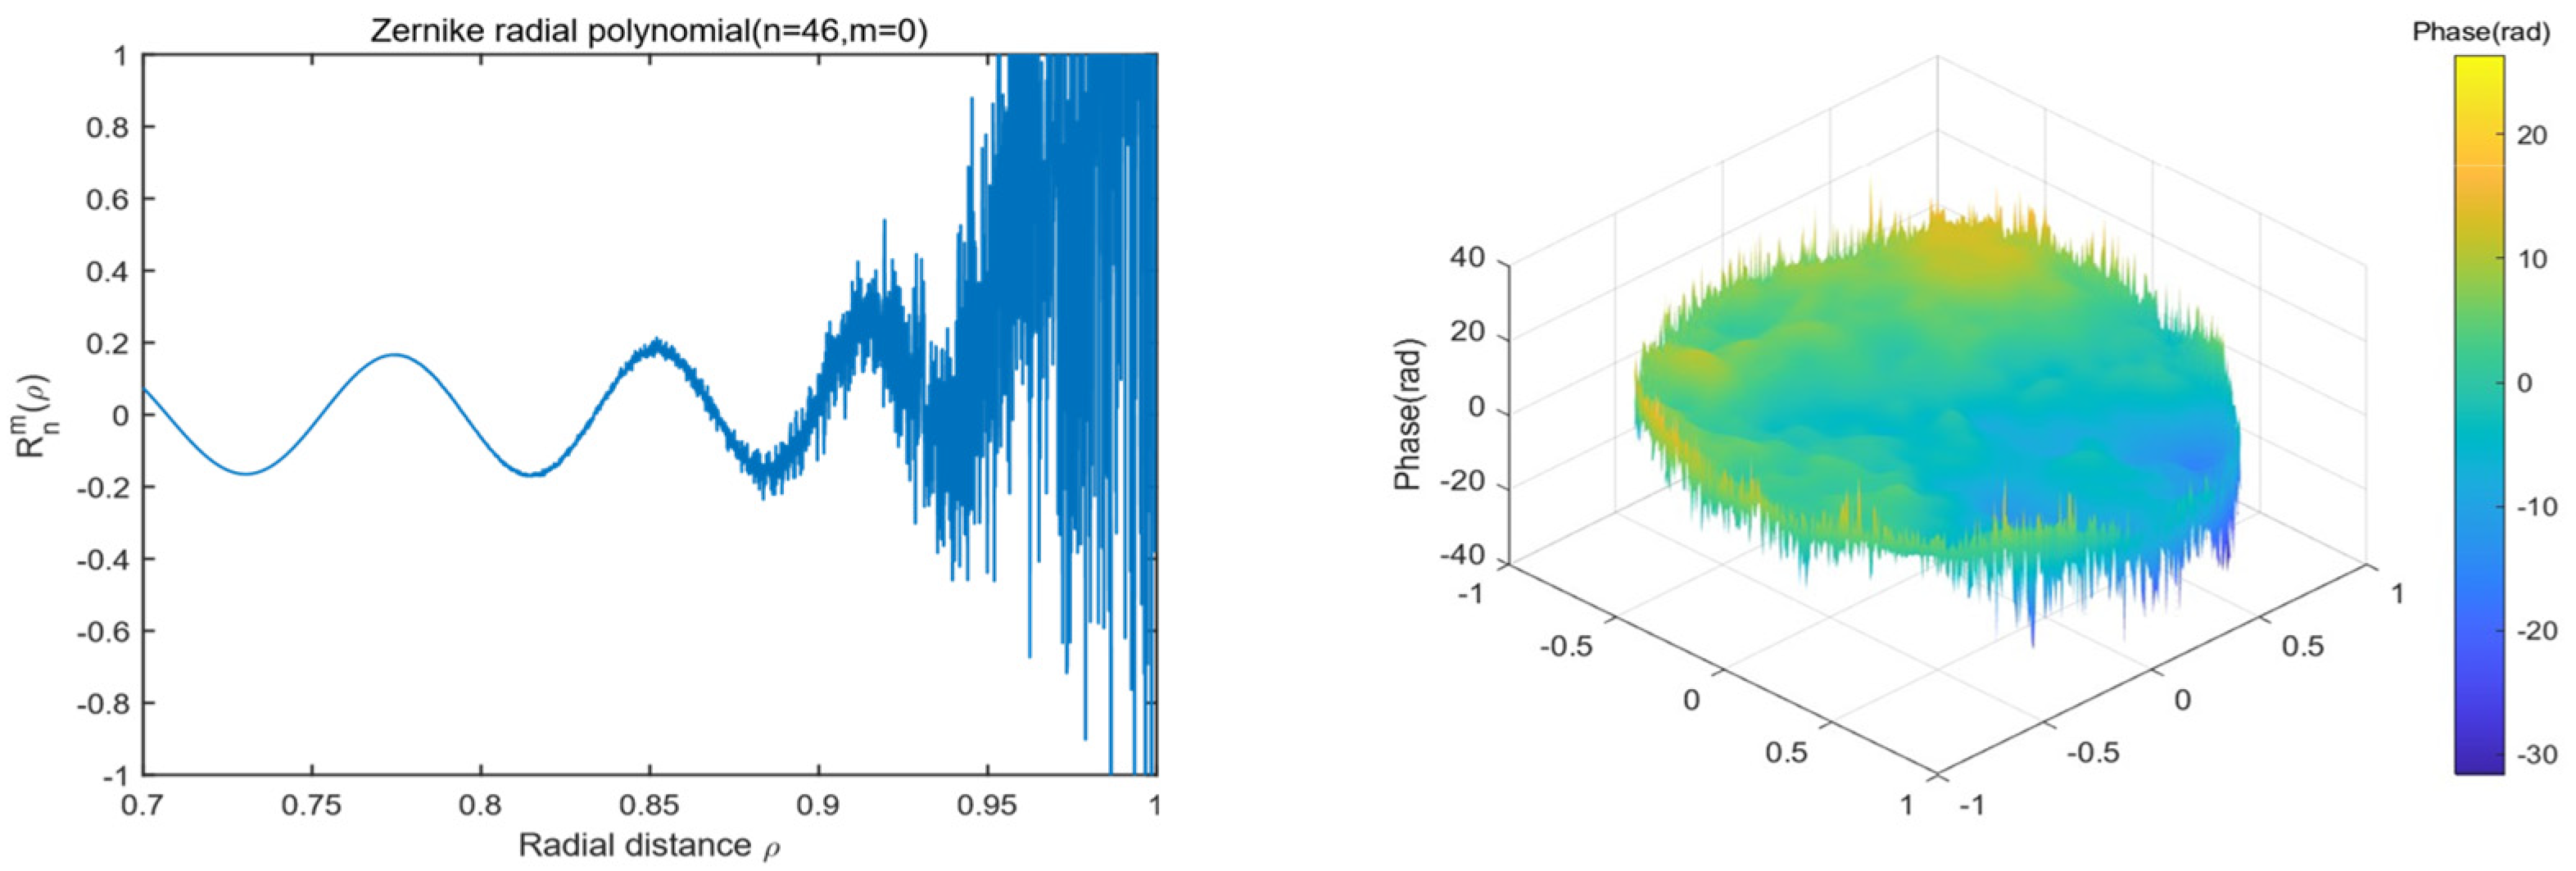
Next, there is another problem in Equation (2). It is quite straightforward to verify that R n m ( 1 ) = 1 , which contributes to the numerical crumble in Zernike radial polynomials, because the magnitude of coefficients of R n m ( ρ ) reaches 100.7n []. This signifies that, for cases of Equation (2) concerning high-index number n and the evaluation of radius ρ close to 1, heavy cancellation in decimal parts happens when the summation of an enormous number eventually shrinks to the value close to 1; an example of numerical catastrophe on radial polynomials and a phase screen can be seen in Figure 3. Therefore, it is no longer possible to ensure numerical stability for computing radial functions with the direct method once index n exceeds 40 (calculated with double precision) [], resulting in problems in the generation of a higher-precision phase screen using the Zernike method.
Figure 3. Left: Zernike radial polynomials computed by direct method (2) with n = 46 and m = 0. Right: normalized phase screen generated by Zernike polynomial method with direct method (simulated with parameters r0 = 0.1, D = 2 m and nmax = 50). The unlabeled axes represent dimensionless spatial coordinates (−1 to 1).
Figure 3 illustrates the numerical instability problem that occurs when Zernike polynomials are used for phase screen generation. Figure 3(left) shows that Zernike radial polynomials computed using the direct method encountered critical numerical instability due to the aforementioned reason. Figure 3(right) depicts the phase screen generated by the direct method for radial polynomials computation; here, “burr effects” occurred at the edge of the screen, which corresponded to the numerical instability phenomenon where values of radius ρ approximate to 1. The oscillated values result in the structure function deviating strongly from the theoretical curve, as shown by the red curves in Figure 1.
In summary, the Zernike polynomial method uses the direct method (2) when calculating radial polynomials, resulting in computational inefficiency and numerical instability problems in the generation of phase screens. Accordingly, recursive radial formulas were recommended to eliminate the drawbacks of the direct method for calculating Zernike radial polynomials [,]. However, the performance of radial recursive formulas in the study of phase screen generation still needs to be completed.

3. Recursive Methods for Zernike Radial Polynomials

Compared with the direct radial method (2), the recursive formula speeds up the computation by reducing repetitive operations, i.e., factorials and vector multiplication. It prompts robust computation by avoiding the heavy cancellation of digital numbers. In this Section, four different recursive formulas are selected and introduced: Barmak’s method [], the q-recursive method [], Prata’s method [] and Kintner’s method [].

3.1. Barmak’s Method

Barmak Hornarvar Shakibaei and Raveendran Paramesran [] proposed the following recurrence expression, denoted as Barmak’s method, derived based on the Chebyshev polynomials of the second kind. The formula is given as
R n m ρ = ρ R n 1 m 1 ρ + R n 1 m + 1 ρ R n 2 m ρ ,
With the initial value R 0 0 ( ρ ) = 1 and R n m ( ρ ) = 0 , when n < m, one can use Equation (13) to generate the necessary terms. Further, compared to the other three recursive formulas discussed in Section 3.2, Section 3.3 and Section 3.4 just below, Barmak’s formula is the only method independent of the computation of coefficients.

3.2. q-Recursive Method

The author [] proposed the q-recursive method for fast computation of Zernike radial polynomials. The q-recursive method uses radial polynomials with fixed index n and a higher index m to derive the radial polynomial with a lower index m. The recurrence formula reads as
R n m 4 ρ = H 1 R n m ρ + H 2 + H 3 ρ 2 R n m 2 ρ ,
where the coefficients H1, H2 and H3 are given by
H 1 = m m 1 2 m H 2 + H 3 n + m + 2 n m 8 , H 2 = H 3 n + m n m + 2 4 m 1 + m 2 , H 3 = 4 m 2 m 3 n + m 2 n m + 4 .
The Formula (14) is not applicable in cases where nm = 0 and nm = 2; for these exceptional cases, the following recurrence relations can be applied:
R n m ρ = ρ R n 1 n 1 ρ , for   n     m   =   0 ; n R n n ρ n 1 R n 2 n 2 ρ , for   n     m   =   2 .
Using the computational strategy described above in this Section, instead of the direct method, in cases where nm = 0 and nm = 2, computational speed is boosted by avoiding the repeated computation of the power series of radius and calculation of coefficients. In addition, once the initial values, R n m ( ρ ) for cases where nm ≤ 2, are calculated, then the remaining polynomials can be recursively computed using Equation (14). Furthermore, nth order polynomials can be computed individually since they are independent of the other nth order polynomials. Therefore, the q-recursive method is ideal with regard to parallel computation in programming [].

3.3. Prata’s Method

Aluizio Prata and Willard Rusch [] derived a three-term recurrence relation for calculating the Zernike radial polynomials, given as
R n m ρ = ρ L 1 R n 1 m 1 ρ + L 2 R n 2 m ρ ,
where the coefficients L 1 and L 2 are defined as
L 1 = 2 n m + n   a n d     L 2 = m n m + n   .
With the initial values R 0 0 ( ρ ) = 1 and R n m ( ρ ) = 1 , when n < m, which is the same approach as Barmak’s method, it is also possible to recursively derive all terms of radial polynomials that enable the higher-order radial polynomials to be derived from the linear combination of lower-order polynomials.

3.4. Kintner’s Method

Eric Kintner [] derived a three-term recurrence relation, based on the recursive properties of Jacobi polynomials, to calculate the higher-order Zernike radial polynomials with a lower degree n of a fixed azimuthal order m, which is given as
R n m ρ = 1 K 1 K 2 ρ 2 + K 3 R n 2 m ρ + K 4 R n 4 m ρ   ,
where the coefficients K1, K2, K3 and K4 are given by
K 1 = n + m n m n 2 2 , K 2 = 2 n n 1 n 2 , K 3 = π 2 n 1 n n 1 n 2 , K 4 = n n + m 2 n m 2 2 .
Similar to q-recursive method, the Formula (19) also breaks down in cases of nm = 0 and nm = 2. Therefore, Kintner’s method was modified in Ref. [] by applying Equation (16) in cases where nm ≤ 2.
Thus, the four often-used recursive radial computation methods are introduced. In Section 4 just below, the performance of those methods in phase screen generation is studied and discussed.

4. Performance and Discussion

In this Section, the performance of four recursive methods described in Section 3 just above for phase screen generation in computational efficiency and numerical stability are considered. Finally, the optimal results for both problems are given.

4.1. Computational Efficiency of Phase Screen Generation with Different Recursive Methods

It should be noted that in a complete atmospheric simulation pipeline, the Zernike polynomials can be precomputed once. However, the computational and memory overhead of precomputation and storage becomes significant for considerably high orders (nmax > 100) or for real-time applications. This study focuses on the efficiency and stability of the polynomial generation process itself, which is a critical component of the overall simulation.
In this Section, phase screen generation is experimentally studied using the four different recursive methods to determine the performance of computational efficiency. This process utilized four variant sizes of screens (64 × 64, 128 × 128, 256 × 256, 512 × 512), and the maximum terms of the Zernike polynomials (N) used in Equation (3) are computed from 231 to 5151 (corresponding to nmax values from 20 to 100). As shown in Table 1, and comparing these values with the results in Figure 2, one can conclude that operating speed increases 10–20 times for the phase screen generation program after the direct method is replaced by the recursive method for the computation of Zernike radial polynomials. The subtle and not enormous differences in CPU elapsed time existing for variant recursive methods are also shown in Table 1.
Table 1. The CPU elapsed time (s) for phase screen generation with different screen resolution and recursive methods by Zernike polynomials method, the program was executed by a laptop with Intel1240P CPU and 4800MHZ memory, averaging 300 iterations, performed with MATLAB 2020a.
According to Table 1, Barmak’s method performs quite well for situations with low resolution (64 × 64, 128 × 128) because MATLAB works better with computing matrix operations. One can observe from Equation (13) that the formula depends only on three radial polynomial terms to derive the new term without the tedious computation of coefficients. However, this also points that Barmak’s method suffers from heavier vector operations; therefore, its effectiveness decreases with increasing screen resolution (256 × 256, 512 × 512).
The rest of the recursive methods all consist of a three-term formula but face a difficulty of the expensive computation of coefficients compared to Barmak’s method. As shown in Table 1, Prata’s method performs faster in circumstances of low resolution, nmax ≤ 256 × 256, since the coefficient computation is straightforward. Nevertheless, differences are reduced between the three methods with the increasing data matrix size (which is related to resolution and nmax parameters), where vector operation takes up the majority of computing consumption instead of coefficient calculation. However, both the q-recursive method and Kintner’s method are more stable with respect to numerical computation, as detailed in Section 4.2. They all perform better with increasing screen resolution compared to Barmak’s method.

4.2. Numerical Stability of Different Recursive Methods

As was verified in Section 3.2, radial polynomials computed by the direct method (2) are the root cause of the numerical crumble problem. To quantitatively study the numerical problem in recursive radial methods, Mohammed Sadeq Al-Rawi [] defined a quality factor for verifying the numerical stability of orthogonal polynomials; this quality factor has been used to show that, in Zernike radial polynomials the numerical instability starts at nmax ≥ 40 for direct method and nmax ≥ 80 for Prata’s method, but the heavy numerical crumble problem does not appears in Kintner’s method or q-recursive method even when nmax ≥ 250. Furthermore, according to Refs. [,], the numerical error in Zernike radial recursive computation methods occurs from ill-posed subtraction and overflow. In other words, subtraction between two similar numbers and an exceptionally large number of values divided by quite a small number in the computation of coefficients are the causes of numerical instability in recursive formulas, instead of vector operations. Therefore, Barmak’s method (13) may be considered without suffering from heavy numerical error since its computational equation is dependent only on vector operations, which, without the ill-posed and overflow problems mentioned in Section 3 just above, theoretically signifies that Barmak’s method is the most stable formula for recursive computation of Zernike radial polynomials.
Nevertheless, for thousands of orders of Zernike polynomials in turbulence simulation, the weighting coefficients aj are exceptionally small (random numbers with zero means and about 10−5 variances). Additional problems still need to be solved. Is the numerical quality of the phase screen itself destroyed by such small coefficients multiplied by the unstable polynomials? This is considered to verify the instability effect on the phase screen instead of on the polynomials. Therefore, we define a quality factor Q by computation as follows:
Q = π 0 1 0 2 π W R ρ , θ d θ d ρ ,
where W represents the mean value of over the aperture. According to the theory of mean-square wavefront aberration of a Zernike-generated screen [], the values of Q to be theoretically close to zero if numerical instability does not exist. Alternatively, the values of Q deviate from zero in circumstances where numerical problems arise.
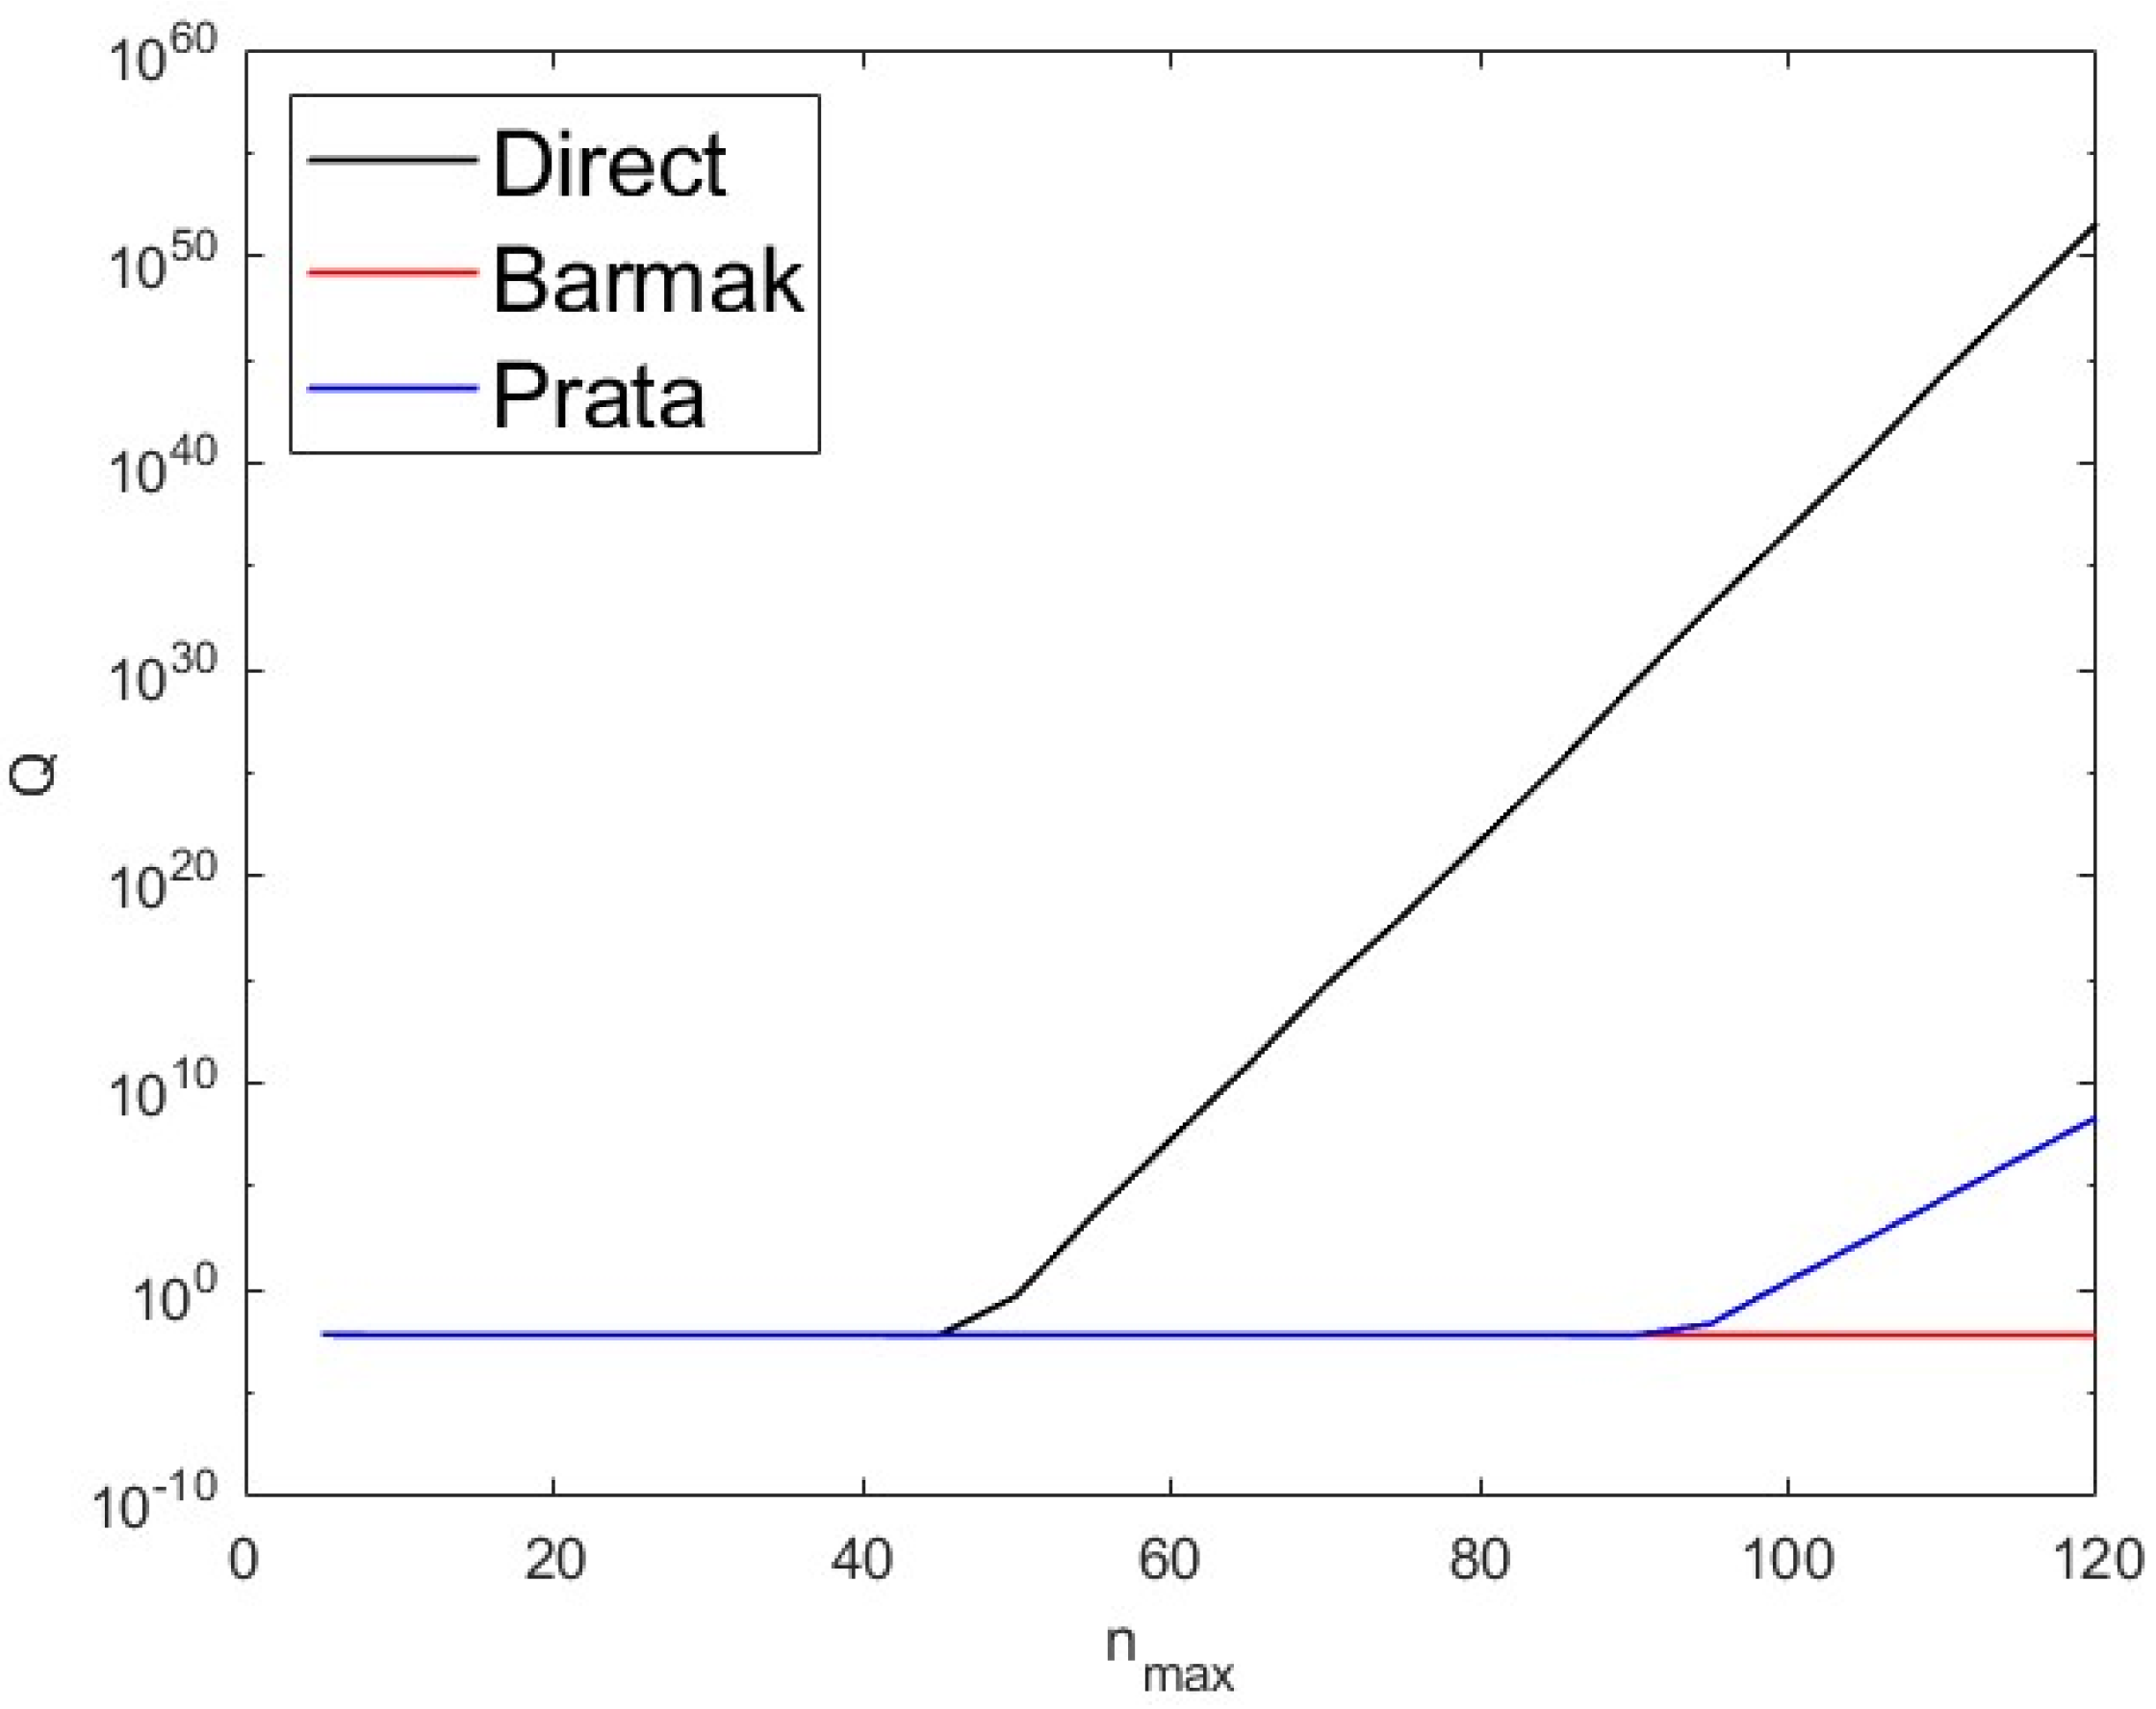
Figure 4 illustrates how the value of quality factor Q changes with the increase in nmax (corresponding N ranges from 23 to 7381); the data for the q-recursive method and Kintner’s method are not plotted since those curves are coincident with the curve of Barmak’s method. Moreover, Figure 4 indicates that a numerical catastrophe occurs on the phase screens, where the values of the quality factor Q dramatically increase for radial polynomials computed by the direct method and Prata’s method, where nmax ≥ 40 and nmax ≥ 80, respectively. This agrees with the earlier analyses in the theory of numerical crumble in Zernike radial polynomials [], one can conclude that the numerical quality of the phase screen is highly correlated with the numerical stability of Zernike radial polynomials. In combination with the results from the radial polynomials discussed in Section 3, this finding proves that Barmak’s method, the q-recursive method, Kintner’s method, and Prata’s method (nmax ≤ 80) are all numerically stable in the application of phase screen generation.
Figure 4. The change in the value of quality factor Q (21) in a phase screen with respect to nmax; the radial polynomials are computed with three different recursive methods (as indicated), tested using: 256 × 256 resolution, D/r0 = 20 parameters, and by averaging over 300 iterations. See text for details.

4.3. Discussion

The results shown in Table 1 were obtained using MATLAB 2020a with default calculation precision (16 significant digits). As mentioned in Section 4.2, Prata’s method generally performs well enough in computational speed but not in numerical stability when nmax ≥ 80. Additionally, one may conclude that with the increase in screen resolution (even for a resolution higher than 512 × 512), Barmak’s method is not recommendable given computational efficiency. The differences in computational speed (measured in CPU elapsed time) between the other three methods (q-recursive, Prata’s and Kintner’s methods) is separated well enough since the majority of operations gradually become vector operations instead of coefficient computations. Barmak’s method can be recommended for low-resolutions (for example, for 64 × 64, 128 × 128), and the q-recursive method or Kintner’s method can be recommended for high-enough resolution cases (for example, for 256 × 256, 512 × 512 or larger resolution cases), both given the efficiency and stability. In addition, the results shown in Table 1 were measured using CPU elapsed time rather than actual CPU running time. Therefore, it looks that s the program performs faster by adopting the q-recursive method in a high-performance machine since the q-recursive method can work for calculating the radial polynomials with parallel computation in programming [].
Further, let us combine the results shown in Section 2 and Section 4. On the one hand, to evaluate the increase in computing speed, focusing on Figure 2 and Table 1, supposing that the direct method is substituted with Prata’s method, when nmax = 40, one can estimate that there is an increase from 10 to 20 times for the efficiency of the overall program for phase screen generation. Alternatively, adopting the recursive radial computing method to remove the coefficient explosion issue for the direct method points that a more exact phase screen can be stably generated, corresponding to cases where nmax ≥ 40, at which point the radial polynomials computed by the direct method start to oscillate.
Employing the programming strategy from Equation (10) for phase screen generation with respect to high precision and resolution is where the storage challenge arises. For example, for a phase screen with size 256 × 256 and maximum terms of Zernike polynomials jmax = 3321 (corresponding to nmax = 80), with double-precision arithmetic, the memory capacity for saving matrix Z is up to 1.3 GB. Hence, it can be derived that about 83 GB of memory capacity is necessary for saving matrix Z for a screen of size 4096 × 4096. Therefore, using the Zernike method, it is not feasible for a low-performance computer to simultaneously generate a phase screen with both high resolution and precision. Hence, a method proposed in Ref. [] can be noted, in which the Zernike method first generates a screen with low resolution but high precision and then interpolations are implemented to increase the resolution. In other words, the Zernike method and the fractal method are combined. If one starts interpolations on a theoretically precise screen, one then can not only mitigate the effects of random errors in the fractal method but also avoids the relatively large-scale matrix operation present in the Zernike polynomial method.

5. Conclusions

This paper discussed computational inefficiency and numerical instability problems observed in phase screen generation using the Zernike polynomial method, while the root cause is found in the computation of radial polynomials via the direct method. As a solution, recursive radial methods are introduced to substitute for the direct method in the calculation of Zernike radial polynomials. Experiments performed show that for phase screen generation, an increase of 10 to 20 times in computational efficiency occurs for a recursive radial method adopted as a substitute for the direct method. Moreover, with suitable recursive methods for different cases, improvements in numerical stability is indicated also be ensured, even for thousands of terms for a Zernike polynomial-generated screen. Thus, by adopting such a programming strategy, a more efficient and precise phase screen generation program may be implemented, effectively improving the program’s application to atmospheric-turbulence-related study.

Author Contributions

Conceptualization, Y.L. and D.C.; methodology, Y.L.; software, Y.L. and B.L.; validation, B.L.; formal analysis, B.L.; investigation, H.X., B.L. and N.W.; resources, N.W.; data curation, B.L.; writing—original draft preparation, Y.L.; writing—review and editing, H.X., N.W., and D.C.; visualization, B.L.; supervision, D.C.; project administration, N.W.; funding acquisition, D.C. All authors have read and agreed to the published version of the manuscript.

Funding

Project supported by the National Natural Science Foundation of China (Grant No. 42004134) and Shanxi Basic Research Program, China (Grant No. 202303021221051).

Data Availability Statement

No new data were created or analyzed in this study. Data sharing is not applicable to this article.

Acknowledgments

The authors would like to thank Maurice Lineman, a Canadian expatriate working in China, for editing the paper for English grammar and contextual understanding.

Conflicts of Interest

The authors declare no conflicts of interest.

References

  1. Tyson, R.K. Principles of Adaptive Optics; CRC Press/Taylor & Francis Group: Boca Raton, FL, USA, 2022. [Google Scholar] [CrossRef]
  2. Taylor, G.I. The spectrum of turbulence. Proc. R. Soc. A Math. Phys. Eng. Sci. 1938, 164, 476–490. [Google Scholar] [CrossRef]
  3. Jia, P.; Cai, D.; Wang, D.; Basden, A. Simulation of atmospheric turbulence phase screen for large telescope and optical interferometer. Mon. Not. R. Astron. Soc. 2015, 447, 3467–3474. [Google Scholar] [CrossRef]
  4. Thomas, S. A simple turbulence simulator for adaptive optics. SPIE Proceed. 2004, 5490, 766–773. [Google Scholar] [CrossRef]
  5. Jia, P.; Wang, W.; Ning, R.; Xue, X. Digital twin of atmospheric turbulence phase screens based on deep neural networks. Opt. Express 2022, 30, 21362–21376. [Google Scholar] [CrossRef]
  6. Xu, Q.-W.; Wang, P.-P.; Zeng, Z.-J.; Huang, Z.-B.; Zhou, X.-X.; Liu, J.-M.; Li, Y.; Chen, S.-Q.; Fan, D.-Y. Extracting atmospheric turbulence phase using deep convolutional neural network. Acta Phys. Sin. 2020, 69, 014209. [Google Scholar] [CrossRef]
  7. Zhao, S.M.; Leach, J.; Gong, L.Y.; Ding, J.; Zheng, B.Y. Aberration corrections for free-space optical communications in atmosphere turbulence using orbital angular momentum states. Opt. Express 2012, 20, 452–461. [Google Scholar] [CrossRef]
  8. McGlamery, B.L. Computer simulation studies of compensation of turbulence degraded images. SPIE Proceed. 1976, 74, 225–233. [Google Scholar] [CrossRef]
  9. Zhai, H.; Wang, B.; Zhang, J.; Dang, A. Fractal phase screen generation algorithm for atmospheric turbulence. Appl. Opt. 2015, 54, 4023–4032. [Google Scholar] [CrossRef]
  10. Roddier, N.A. Atmospheric wavefront simulation using Zernike polynomials. Opt. Engin. 1990, 29, 1174–1180. [Google Scholar] [CrossRef]
  11. Carbillet, M.; Riccardi, A. Numerical modeling of atmospherically perturbed phase screens: New solutions for classical fast Fourier transform and Zernike methods. Appl. Opt. 2010, 49, G47–G52. [Google Scholar] [CrossRef]
  12. Chimitt, N.; Chan, S.H. Simulating anisoplanatic turbulence by sampling intermodal and spatially correlated Zernike coefficients. Opt. Eng. 2020, 59, 083101. [Google Scholar] [CrossRef]
  13. Wilcox, C.C.; Santiago, F.; Martinez, T.; Andrews, J.R.; Restaino, S.R.; Teare, S.W. Performance of a flexible optical aberration generator. Opt. Eng. 2011, 50, 116601. [Google Scholar] [CrossRef]
  14. Anzuola, E.; Gladysz, S. Modeling dynamic atmospheric turbulence using temporal spectra and Karhunen–Loève decomposition. Opt. Eng. 2017, 56, 071508. [Google Scholar] [CrossRef]
  15. Forbes, G.W. Robust and fast computation for the polynomials of optics. Opt. Express 2010, 18, 13851. [Google Scholar] [CrossRef] [PubMed]
  16. Niu, K.; Tian, C. Zernike polynomials and their applications. J. Opt. 2022, 24, 123001. [Google Scholar] [CrossRef]
  17. Noll, R.J. Zernike polynomials and atmospheric turbulence. J. Opt. Soc. Am. 1976, 66, 207. [Google Scholar] [CrossRef]
  18. Al-Rawi, M.S. Numerical stability quality-factor for orthogonal polynomials: Zernike radial polynomials case study. In Image Analysis and Recognition; Kamel, M., Campilho, A., Eds.; Springer: Berlin/Heidelberg, Germany, 2013; pp. 676–686. [Google Scholar] [CrossRef]
  19. Chong, C.-W.; Raveendran, P.; Mukundan, R. A comparative analysis of algorithms for fast computation of Zernike moments. Pattern Recognit. 2003, 36, 731–742. [Google Scholar] [CrossRef]
  20. Shakibaei, B.H.; Paramesran, R. Recursive formula to compute Zernike radial polynomials. Opt. Lett. 2013, 38, 2487–2489. [Google Scholar] [CrossRef]
  21. Prata, A., Jr.; Rusch, W.V.T. Algorithm for computation of Zernike polynomials expansion coefficients. Appl. Opt. 1989, 28, 749–754. [Google Scholar] [CrossRef]
  22. Kintner, E.C. On the mathematical properties of the Zernike polynomials. Opt. Acta Int. J Opt. 1976, 23, 679–680. [Google Scholar] [CrossRef]
  23. Papakostas, G.A.; Boutalis, Y.S.; Papaodysseus, C.N.; Fragoulis, D.K. Numerical error analysis in Zernike moments computation. Image Vis. Comput. 2006, 24, 960–969. [Google Scholar] [CrossRef]
  24. Papakostas, G.A.; Boutalis, Y.S.; Papaodysseus, C.N.; Fragoulis, D.K. Numerical stability of fast computation algorithms of Zernike moments. Appl. Math. Comput. 2008, 195, 326–345. [Google Scholar] [CrossRef]
  25. Schmidt, J.D. Numerical Simulation of Optical Wave Propagation with Examples in MATLAB; SPIE Press: Bellingham, WA, USA, 2010; pp. 76–77. [Google Scholar] [CrossRef]
  26. Harding, C.M.; Johnston, R.A.; Lane, R.G. Fast simulation of a Kolmogorov phase screen. Appl. Opt. 1999, 38, 2161–2170. [Google Scholar] [CrossRef] [PubMed]
Disclaimer/Publisher’s Note: The statements, opinions and data contained in all publications are solely those of the individual author(s) and contributor(s) and not of MDPI and/or the editor(s). MDPI and/or the editor(s) disclaim responsibility for any injury to people or property resulting from any ideas, methods, instructions or products referred to in the content.

Article Metrics

Citations

Article Access Statistics

Multiple requests from the same IP address are counted as one view.