Abstract
Since March 2021, a series of volcanic eruptions on Iceland’s Reykjanes Peninsula has repeatedly triggered wildfires in moss-dominated heathlands—an unprecedented phenomenon in this environment. These fires have consumed extensive organic material, posing emerging health risks and long-term ecological impacts. Using high-resolution multispectral satellite data from the Copernicus program, we present the first quantitative assessment of the spatial and temporal dynamics of volcanic wildfire activity. Our analysis reveals a cumulative burned area extending 11.4 km2 beyond the lava flows, primarily across low-relief terrain. Time series of the Normalized Difference Vegetation Index (NDVI) capture both localized fire scars and diffuse, landscape-scale burn patterns, followed by slow and spatially heterogeneous recovery. Complementary ground surveys conducted in August 2024 document diverse post-fire successional pathways, with vegetation regrowth and species composition strongly governed by microtopography and substrate texture. Together, these results demonstrate that volcanic wildfires represent a novel and consequential secondary disturbance in Icelandic volcanic systems, highlighting the complex and protracted recovery dynamics of moss heath ecosystems following fire-induced perturbation.
1. Introduction
Wildfires often accompany volcanic eruptions in vegetated terrains and are particularly common in (sub)tropical Mediterranean climates; however, they also occur in other climate zones [1]. Nevertheless, volcano-induced wildfires are an understudied and often unrecognized hazard, given the extensive ecological, social, and economic impacts. Various processes can cause wildfires at erupting volcanoes, including the eruption products themselves, as well as cascading effects and lightning. Commonly reported wildfire causes are pyroclastic density currents or lava flows (e.g., in 1902 at Mt. Pelèe (Martinique), in 1997 at Soufrière Hills (Montserrat), and in 2010 at Merapi (Indonesia) [2,3,4]). Ballistic fallout, ash, lapilli, or hot or burning gas may also ignite wildfires. Wildfires may directly involve wood, grass, or other biomass fires and also be accompanied by sulfur or methane gas inflammations.
Wildfires associated with the 2021 Tajogaite eruption (La Palma) showed that, in places, a strong fire adaptation occurs, with the rapid recovery of endemic tree species [5]. Eruption-induced wildfires also occurred at Kilauea and Mauna Loa (Hawaii, USA), the Canary Islands, other than La Palma [5], Stromboli in Italy [6,7], and Mount Etna (B. Behnke, pers. comm.). In Hawaii, the tropical forest as well as grasslands and shrublands provide large amounts of material that can burn. In 2003, wildfires affected an area of 20 km2 [6]. Stromboli Island in the Tyrrhenian Sea, in turn, has lower vegetation (shrubs and Mediterranean bushes on the flanks of the volcano) but a dry climate, favoring fire spreading; thus, after strong explosions (so-called paroxysms) in 2019, an area of almost 5 km2 burned, which accounts for 35% of the island of Stromboli [7].
Even in more harsh climate zones, such as in the subpolar and tundra zones, wildfires may be relevant near volcanoes. Eruptions in Iceland (Figure 1a) occur on average every 3 to 5 years (e.g., [8]) and typically impact the environment and population through glacial floods (so-called jökulhlaups), tephra fall, lava flows, and gas pollution.
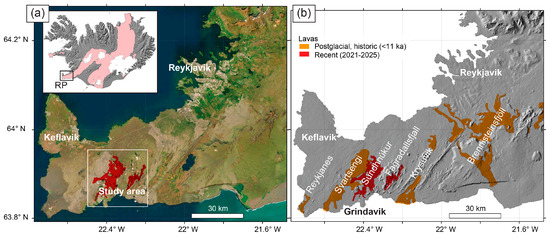
Figure 1.
(a) Reykjanes Peninsula, with the lava- and fire-affected study area in bright green in the southwest. Background: ESRI satellite imagery. The insert shows Iceland with the main volcanic zones and the Reykjanes Peninsula (RP). (b) Reykjanes Peninsula with selected volcanic systems and postglacial (orange) and recent lava fields (in red).
The Reykjanes Peninsula makes up the southwestern part of Iceland (Figure 1a). Including the capital region of Reykjavík, a total of around 270,000 people live in the area, representing about 70% of the Icelandic population [9]. Depending on classification, the Reykjanes Peninsula contains up to eight major volcanic systems active over the last 4000 years (from west to east: Reykjanes-Eldvörp, Svartsengi, Fagradalsfjall, Krýsuvík, Brennisteinsfjöll, and Bláfjöll), five of which are located and well identified in the western part of the Peninsula (Figure 1b). The segment of the rift zone continues to the west, underseas, as the Reykjanes Ridge [10] and terminates towards the east at the Hengill volcanic system, which marks the transition to the Western Volcanic Zone [11]. Volcanism typically lasts decades, after long repose intervals [11].
Following a 800-year episode of quiescence, the systems of Svartsengi and Fagradalsfjall became seismically and geodetically active in 2019, with fractures forming before the first lava effusion in 2021 [12], which was the first of three fissure eruptions at Fagradallsfjall [13]. The past eruption pattern suggests a durable and considerable risk to the local population and important infrastructure (e.g., Keflavík airport, several geothermal power plants, popular tourist destinations, and population centers like Keflavík, Hveragerði, Þorlákshöfn, Grindavík, Vogar, Reykjanesbær, Suðurnesjabær, and Greater Reykjavík) [14], which is why considerable efforts were made by scientists, agencies and officials to improve monitoring.
Lasting until the end of 2024, seven more eruptions followed ~8 km further west at a location near Svartsengi (Table 1), referred to as the Sundhnúkur eruptions, which were all fed by a crustal reservoir [14,15]. Major deformation was associated with this activity, reactivating pre-existing faults, causing widespread damage in the town of Grindavík, rapid injection of magmatic pathways, and complex faulting, sinkholes, and landslides in the mountainous regions [15,16,17,18].

Table 1.
Overview of the eruptions on the Reykjanes Peninsula, 2021 to 2024. Fissure length refers to the fissure length at the beginning of the eruption; by the end, the lava was mostly coming from one main vent.
The study area encompasses major and multiple wildfires triggered by eruptions that occurred at Fagradallsfjall and Sundhnúkur. At the two main eruption sites, Fagradallsfjall in the east and Sundhnúkur in the west, wildfires sometimes occurred and sometimes not. Some of the wildfires were extensive (Figure 2) and led to widespread air pollution warnings in the urban regions of the capital city or the airport. Ash and smoke resulting from wildfires can cause serious eye and respiratory irritations [19], impacting a large part of the inhabitants of Iceland. The fires moreover mark a severe ecosystem disruption in a region with freeze–thaw cycles and high winds, possibly causing other hazards, as the exposed soil might be subject to erosion or desertification [20]. The aim of this work is to explore the temporal and spatial patterns and processes associated with the wildfires. We explore dimensions versus seasons and look at the regrowth of vegetation by using satellite remote sensing data from Sentinel-2 and conduct a spatial analysis of fire sizes and terrain as well as temporal analysis. During a field visit, we study the ecological impact of the wildfires, how these affected the different plants, and how fast recovery or possible erosion are happening.
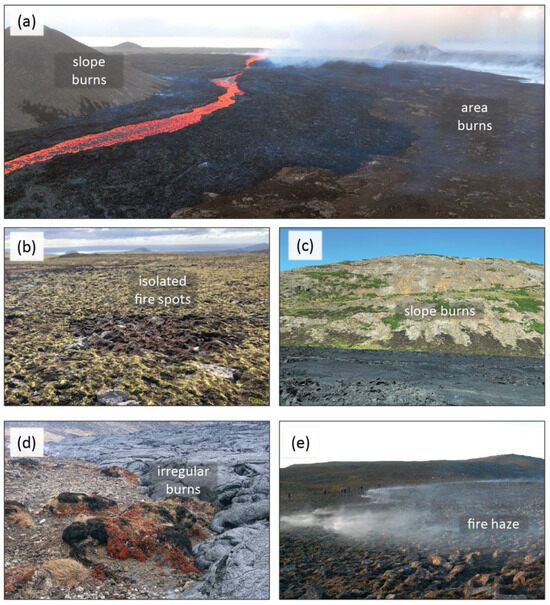
Figure 2.
Field pictures from the study area. (a) Fagradallsfjall 3 eruption on 18 July 2023, with actively burning areas. (b) Isolated burned spot in otherwise intact vegetation, 22 August 2024. (c) Burn pattern on steep slopes following the vegetation pattern, 20 August 2024. (d) Vegetation patch with different small-scale burn severities of vegetation types, 1 September 2021. (e) Areas next to the 2021 eruption, burning again in August 2022, with resulting smoke close to the ground, 4 August 2022.
2. Methods and Materials
2.1. Overview and Spatial Analysis of Wildfires
The wildfires are visible for analysis in optical and multispectral satellite imagery (Figure 3a–d). For this purpose, we obtained the Sentinel-2 L2A data (also available from the Copernicus Browser, https://browser.dataspace.copernicus.eu/, accessed on 23 June 2025) and the Landsat data (Landsat 8–9 L2) (available from the EO Browser, https://apps.sentinel-hub.com/eo-browser/, accessed on 23 June 2025), both multispectral and available at a resolution of 10–20 m and 30 m, respectively. We also considered elevation data developed in a collaborative effort between the National Land Survey of Iceland, the Icelandic Meteorological Office, and the Polar Geospatial Center and available from the ArcticDEM webpage (https://www.pgc.umn.edu/data/arcticdem/ (accessed on 23 June 2025)). All spatial data were projected to be displayed in the UTM zone 27 coordinate system. Evaluation of the satellite coverage showed that cloud-free images were relatively rare but sufficient for the purpose of this study due to the good temporal coverage (Figure 3).
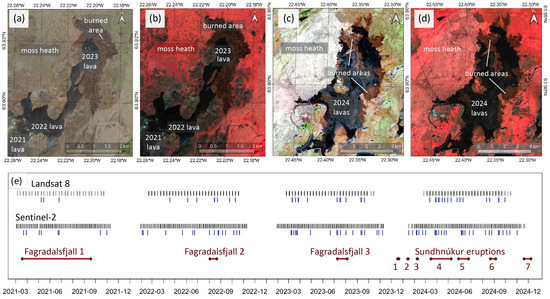
Figure 3.
Satellite data of the eruptions, used for mapping wildfires. (a) From 25 August 2023, after the Fagradalsfjall 3 eruption, as a natural color image and (b) false color image. (c) From 13 September 2024, after the Sundhnúkur 6 eruption, as natural color image and (d) false color image. (e) Eruption timeline with satellite coverage by Landsat 8 (top bars) and Sentinel-2, with the corresponding cloud-free images below (blue). Dark red bars at the bottom show the eruption duration.
For each eruption, Sentinel data from shortly after the end of the eruption were selected. Short-wave infrared (SWIR) is an electromagnetic spectrum band situated between the visible and mid-infrared regions. The SWIR band combination showed good contrast but was discarded because it had a lower resolution. As a starting point, lava outlines for different dates could be accessed from the Natural Science Institute of Iceland and the National Land Survey of Iceland (www.lmi.is). In QGIS (Version 3.36.1), we used the satellite data to manually check and digitize both the limits of the lava flows and the extent of the burns for all of the eruptions from 2021 to 2024. Further analysis was conducted in R (Version 4.4.2).
The digitized outlines of the burned land allowed us to retrieve the sizes of all areas using the field calculator in QGIS. Then, we estimated the lava-to-fire ratio and the number of isolated and connected fires. These numbers were derived from the satellite imagery by digitizing polygons encircling the lava areas and the fire areas of a specific timeframe. The areas of the individual fires for each eruption were plotted as points over a boxplot for a statistical overview.
Wildfires buried by or enclosed by the lava (where patches of land remained uncovered and burned completely) were disregarded. We retrieved points every 10 m. The distance to the nearest hub (points) could be used to determine the distance closest to the lava. For each individual fire, the point with the maximum distance from the lava was filtered out and put into one data frame. The average, 25th, and 75th percentile for each eruption were displayed as boxplots, with the individual maximum distances of each fire as points. Additionally, a Kruskal–Wallis test, with a subsequent Dunn’s post hoc test, was conducted to estimate statistical significance of the differences between the eruptions. The Fagradalsfjall 2 eruption was left out of the post hoc test due to a too small number of fires.
To examine a possible relationship of the size of the burns with the topography in which they occurred, the size of individual fires was plotted against the average slope. For this, the tool zonal statistics was used, with the mapped fires and their calculated areas as input and the slope layer (calculated from the DEM) as the raster. The analysis of the resulting shape file with mean slope and the standard deviation for each fire are shown.
2.2. Temporal Analysis of Wildfire Regions
The NDVI stands for the Normalized Difference Vegetation Index; this is a widely used indicator of vegetation health and density, which are herein derived by band combinations from Landsat 8–9 and Sentinel-2 imagery, respectively. The NDVI is ideal for temporal analysis as it quantifies the difference between near-infrared and visible red light reflectance, where the higher values indicate healthier and denser vegetation and lower values or zero values indicate bare rock or burnt vegetation. The two satellites, Landsat 8–9 and Sentinel-2, are very complimentary, allowing us to use their respective near-infrared (NIR) and red bands for the NDVI calculation, where (NIR − Red)/(NIR + Red). While Sentinel-2 uses Band 8 (NIR) and Band 4 (Red), Landsat 8–9 uses Band 5 (NIR) and Band 4 (Red).
NDVI data were downloaded from the Copernicus browser, using manually drawn polygons of the recent lava field, the burned area, and a comparison area of roughly the same size. To demonstrate the temporal evolution, seasonality, and recovery of vegetation, we arbitrarily selected the Fagradalsfjall 1 eruption from 2021 as an example, where the consecutively burned area on the west side of the lava was chosen for analysis. The lava-, fire- and un-burned reference areas had very different sizes here. Additionally and for comparison, the 2023 eruption (Fagradalsfjall 3, also named Litli-Hrútur by other authors) was used since it had bigger consecutively burned areas (which were helpful to average the NDVI) than the 2021 eruption and occurring over a shorter time period.
The eruptions from Fagradallsfjall also offered the opportunity to observe recovery “after burning” as opposed to the more recent 2024–2025 Sundhnúkur eruptions. For the lava area, only the part newly covered in 2023 was considered. The biggest continuous fire patch in the north and east of the lava field was mapped as the burned area. The area without lava or fire was chosen as directly north of the burned area and of a similar size for optimal comparison. This way, we can display the timeframe of 2018–2024 for Fagradalsfjall 1 and 2020–2024 for Fagradalsfjall 3. Since the data showed high variability and some outliers even when the filter was set to under 50% cloud cover, 2-month bins with a calculated mean were used for better comparability.
2.3. Field Observations
To supplement the remote sensing observations, field work was conducted with close-up imagery and a taxonomic inventory. The size of the study sites as well as the general process of sampling and vegetation recording were inspired by moss colonization studies on lava flows at Hekla volcano [21]. Our focus was primarily on pioneer plant growth and recovery. Therefore, 9 sites around the 2021 lava field were chosen. We used a marked grid with the size of 2.5 m × 2.5 m on the burned ground, a common plot size for moors and meadows in phytosociology [22]. For each of these so-called plots we used a folding ruler for scale; date and time were noted as well as the GPS location. We acquired close-range NDVI multispectral images using a Parrot Sequoia Multispectral NDVI camera at 5–7 m height and conducted a vegetation recording. In addition, general pictures of the surroundings were taken as documentation. For every close-range NDVI plot, a series of calibration pictures with a target plate and the connected sunshine sensor were taken.
The Parrot Sequoia captures images in RGB, green, red, red edge, and near infrared (NIR). The NDVI band combination results in values between −1 and 1; higher values mean vegetation, whereas values around 0 signify bare rock. As next steps, the burned moss cushions (when they existed) were mapped to determine where vegetation could possibly regrow. We filtered the NDVI picture via a raster calculator to values higher than 0.2 (which mean vegetation). With the QGIS tool zonal statistics, we then calculated the percentage share of the moss cushions that had regrown since 2021 and the vegetation cover percentage of the entire plots.
For vegetation recording, the Braun–Blanquet method was used [23] was used as described in the Supplementary Materials (Table S1). After noting coordinates, elevation, and general observations, the 2.5 m × 2.5 m plot plants were identified, and their cover was estimated. Additionally, macro pictures, especially of the mosses, were taken for later verification of the species. The data were compiled in a table with scientific and trivial names, plot number, and cover for each species. The plant species were categorized into growth forms: dwarf-shrubs, herbs, grasses, bryophytes, and lichens. For clearer visualization in graphs, coverage was converted from the Braun–Blanquet scale into percentage values (Supplementary Materials, Table S2).
3. Results
3.1. Remote Sensing
The satellite remote sensing data allow distinguishing wildfires, lava flows, and the old surface, especially by comparing and mapping color and spectral combination appearance (NDVI and false color). Mapping results thus provide an overview over the extent of the wildfires and lava fields in time and space (Figure 4). Results show that the 2021 eruption at Fagradalsfjall (in the south, grey) caused wildfires that were finger-like, extending upward to the surrounding hills and being more extensive on the western side, spreading onto the plateau. The lava itself covered first the area around the main vent and then flowed south and east into the adjacent valleys, covering a total area of 3.8 km2 (Figure 4a). The 2022 Fagradalsfjall 2 eruption was shorter and covered a smaller area with lava. In contrast to the first eruption, the second caused hardly any detectable wildfires; only two small and elongated area fires occurred east of the main vent.
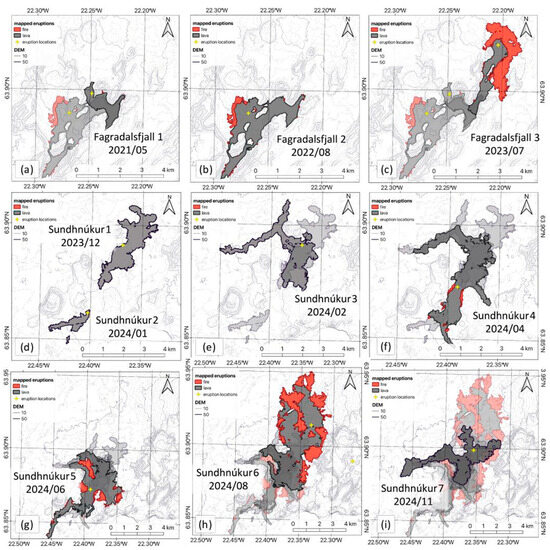
Figure 4.
Mapped outlines of the eruptions from 2021 to 2024 and the wildfires they caused. Upper row shows lava fields from 2021–2023: Fagradalsfjall eruptions 2021 (a), 2022 (b), and 2023 (c). Middle row shows lavas from December 2023 to April 2024: Sundhnúkur eruptions 1 and 2 (d), Sundhnúkur 3 (e), and Sundhnúkur 4 (f). Lower row shows lava fields from May 2024 to November 2024: Sundhnúkur 5 (g), Sundhnúkur 6 (h), and Sundhnúkur 7 (i).
In 2023, the third eruption covered an area with lava that was comparable to the one in 2022 but comprised less than half the area from the 2021 eruption. The main vent was located 3 km northeast of the 2022 eruption, but the lava flowed south and joined (partially overlapped) the two other lava flows. Wildfires were extensive and exceeded 2.2 km2 (Figure 4c), with the largest continuous burn spreading over a rather flat area in the north and east of the erupting vent. Additionally, several small, elongated, finger-like fires spread up the hills to the west of the lava flow. The spreading of the wildfires associated with the Fagradalsfjall eruptions thus appeared terrain-controlled, with hills forming boundaries, steep slopes forming finger-like wildfires, and flat terrains forming more extensive areas of burned wildlife.
The eruption locations then jumped westward, at different locations but with similarly extensive wildfires: Sundhnúkur eruptions took place about 8 km west of the Fagradalsfjall eruptions. By the end of 2024, there were a total of seven eruptions in the area we studied (increasing to nine eruptions by time of this writing). The first three eruptions during the winter of 2023/2024 were very short (maximum of three days), did not cover large areas in lava, and did not cause any wildfires (Figure 4d,e). Sundhnúkur 2 in January was the furthest south, with the main vent only 2.4 km northeast of the town center of Grindavík. The eruptions Sundhnúkur 4–6 during April to September were larger and resulted in wildfires. Sundhnúkur 4 in March to April caused only small fires in the south of the lava area, which did not spread very far (Figure 4f). During the Sundhnúkur 5 eruption, the fires were larger, and in the west of the lava, an enclosed soil area burned completely. The August to September eruption (Sundhnúkur 6, Figure 4h) showed the biggest burned areas. It also covered the biggest area in lava, about 16 km2 (Figure 5a). In the southern and southwestern part of the lava flows, the spreading was directed by the dams that were built to protect the town of Grindavík and the powerplant. The seventh eruption spread mostly over the existing lava fields from the first and third Sundhnúkur eruption (Figure 4i).
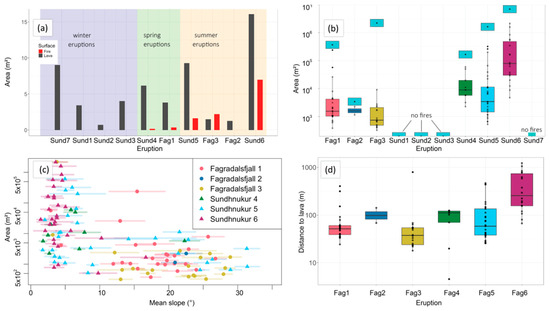
Figure 5.
Spatial and temporal analysis of burned areas. (a) Eruption and wildfire areas sorted by time of year in which they occurred. (b) Area of the individual fires as points with boxplots showing median, percentiles, and outliers on a logarithmic scale. Light blue boxes show the cumulative area. Color coding of the eruptions for comparison of panels. (c) Fire area plotted against slope for each individual fire, with points color-coded by eruption, with standard deviation as lines in the background. (d) Maximum perpendicular distance of the individual fires from the lava as points, with boxplots showing median, percentiles, and outliers on a logarithmic scale. Significant differences in fire area and distance between eruptions in (b,c) are marked by asterisks (according to post hoc Dunn’s test following a Kruskal–Wallis test; in both cases p < 0.001).
The eruption size and corresponding wildfire areas were evaluated for their distribution over the seasons. Sorted by the month in which they occurred, the eruptions during winter (November to March) did not cause any fires (Figure 5a). The spring eruptions in 2021 and 2024 resulted in small wildfires, under 1 km2 total area. The eruptions between June and September all caused fires; the largest ones in August 2024 had a cumulative area of 7 km2.
The mapped areas of the individual fires were relatively small for most eruptions, with a median between 730 m2 and 1700 m2 (without the outliers) on average for the three Fagradalsfjall eruptions (Figure 5b). Of note is the one continuous big fire of the 2023 Fagradalsfjall 3 eruption. Otherwise, the fires in 2023 were rather small. Fagradalsfjall 2 has a small little interquartile range, since there were only two fires. The fires following the Sundhnúkur eruptions were in general larger, with Sundhnúkur 4 having an average individual fire area of 18,400 m2, and Sundhnúkur 5, although the median is lower (Figure 5b), having a mean area of 52,600 m2. Sundhnúkur 6 had the largest individual fires, reaching 233,000 m2 on average and having a maximum similar to Fagradalsfjall 3, with 2.1 km2 for the most extensive fire. It also showed the highest difference between the 25th and 75th percentile.
To evaluate the relationship between slope and area of a fire, these values were plotted against each other. Except for two outliers from Fagradalsfjall 1, all fires on mean slopes over 10° inclination had areas below 10,000 m2, most being under 2000 m2 (Figure 5c). This comprised mainly the Fagradalsfjall fires. The burns with a mean slope under 8° inclination had areas between 500 m2 and over 2 km2 and belonged largely to the Sundhnúkur eruptions. There appears to be a slight correlation between flatter terrain and a bigger fire area.
For another look at the spatial fire distribution, we took the furthest point (greatest perpendicular distance from lava) that each fire reached, to obtain an overview of the spreading distance. Most fires did not advance very far, ranging between 30 m and 120 m for the Fagradalsfjall eruptions, with only a few fires of the 2021 eruption reaching longer distances. The largest fire of Fagradalsfjall 3 reached a distance from the lava of 800 m (Figure 5d). The first three Sundhnúkur eruptions did not produce any detectable fires. The Sundhnúkur eruptions 4 and 5 were similar, with only a few fires spreading over distances greater than 150 m, although Sundhnúkur 4 had a low number of fires in general. For Sundhnúkur 6, the mean distance was larger, at around 250 m, and some fires extended to over 1100 m from the lava.
When the mean NDVI (in 2-month bins) is displayed over time, there is a strong seasonal component. In summer, values are around 0.4 to 0.5, while they drop down to −0.1 to 0.2 in winter. For the Fagradalsfjall 1 eruption in 2021, the timeline 2018 to 2024 is displayed (Figure 6a,b). The area later covered by lava shows lower NDVI values in the years before the eruption and a high standard deviation (grey area, Figure 6b). After the eruption, it drops to values around zero, except for one outlier in the winter of 2022/2023. The fire area (red) shows a similar trend but starts out higher. After the eruption, some seasonal variation is still visible, with NDVI values for the burned area at around 0.2 in summer. Until 2024, no recovery trend towards pre-fire values is detectable. The comparison area had already slightly lower NDVI values than the fire area in the years 2018–2020 before the eruption. Afterwards, the values drop slightly but are still significantly higher than the ones of the lava and fire area in the years after the eruption.
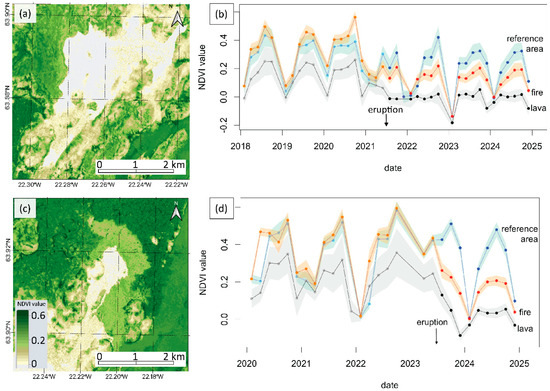
Figure 6.
(a) The 22 May 2022 NDVI imagery after the Fagradalsfjall 1 eruption in 2021 with (b) corresponding timelines of the fire area (red), lava area (black), and adjacent reference area (blue). (c) The 25 August 2023 NDVI imagery after the Fagradalsfjall 3 eruption with (d) corresponding timelines of the fire area (red), lava area (black), and an adjacent reference area (blue). Points indicate the mean NDVI, and the shaded background indicates the standard deviation.
The Fagradalsfjall 3 eruption took place in summer 2023, with a clear distinction between lava, fire, and intact area visible in the NDVI satellite image afterwards (Figure 6c). Charting the development over time, in the middle of 2023, there is a visible drop in NDVI of the burned area after the eruption, and this remains low the following year, reaching only 0.2, even in summer. The (later) lava-covered area shows lower NDVI values than the burn area even before the eruption (Figure 6d). Additionally, there is a high standard deviation until the middle of 2023. It is noteworthy that the standard deviation is a lot lower after the ground is covered by lava and therefore more homogenous. In the reference area, the standard deviation is lower than for the lava and fire areas, and no difference in the seasonal curve is recognizable after the eruption. The reference has a very similar curve to the burn area until 2023 and reaches NDVI values of up to 0.6. For all three areas, there is no lowering in NDVI during the winter of 2023/2024 due to missing data in those months. Similar to the Fagradalsfjall 1 areas, all three curves of Fagradalsfjall 3 show very low NDVI values in the winter of 2022/2023. The summer NDVI before the eruption was higher than in the 2021 areas, indicating more or higher vegetation in the area around the Fagradalsfjall 3 eruption.
3.2. Field Observations
Multispectral images of two plots (i.e., representative field sites 2.5 m × 2.5 m in size) next to the 2021 eruption were taken, one in the burned area, and a second one in the adjacent unburned terrain (Figure 7a). The natural color images already showed visible differences in vegetation cover, which was confirmed in the classified NDVI picture, as the white areas represent vegetation and black is bare soil or rocks (Figure 7b,c). The unburned area 0u has a much higher vegetation cover of around 25% in comparison to the area 0b, which burned three years prior to fieldwork (Figure 7d). Considering the taxonomic inventory, the greatest decline from unburned to burned area was observed in bryophytes, which were the dominant growth form before the fire (Supplementary Materials, Table S2). Grasses and lichens also experienced significant reduction in area (Figure 7e). The only growth form with increased presence after the fire were herbs, and by observations in other places in the field, also dwarf shrubs. Additionally, a larger bryophyte species diversity was observed in the burned areas in comparison to unburned areas.
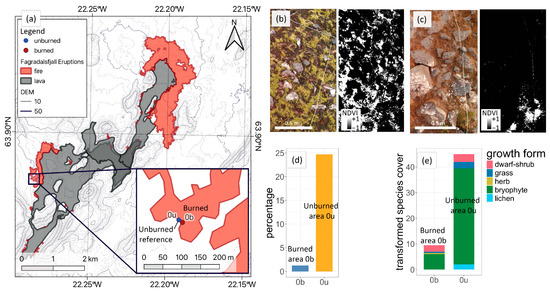
Figure 7.
Field observations near the Fagradalsfjall 1 lava field. (a) Location of the close-up NDVI pictures and taxonomic inventory. (b) The 21 August 2024 unburned area U1 as RGB picture (left) and classified NDVI image (right side) with vegetation in white and rocks or bare soil in black. (c) The 21 August 2024 burned fire area F1 as RGB (left) and classified NDVI image (right). (d) Vegetation cover of burned and unburned area, for comparison and in percent, of the 2.5 m × 2.5 m sample area. (e) Plant species composition of burned and unburned area, classified by growth form.
4. Discussion
In subarctic or tundra environments, volcano-induced wildfires have not received major scientific attention, although recent concerns and alerts in Iceland suggest that “wildfires are (…) considered the greatest hazard to inhabited areas” after the July 2025 eruption on the Reykjanes Peninsula [24]. At similar latitudes (>50° N), active volcanic regions are the Kamchatka Peninsula of Russia (and south of this, the Kuril Islands) or along the Aleutian Island Arc (USA), where vegetation may be affected by explosive volcanism [1,25]. As major wildfires do exist far north, e.g., in Canada, Alaska, and Siberia [26,27], the volcano triggered wildfire potential is imminent.
The ecosystem of Iceland mainly includes the boreal forest or taiga biome [28], whereas the inland vegetation of mosses mixed with dwarf bushes and grasses is more similar to tundra. However, the soil properties vary widely. The Canadian or Russian tundra underground is often deep peat, dominated by permafrost [29], while Iceland’s unique volcanic background allows only shallow soil development, and often mosses grow as first colonizers, directly on lava flows [21]. The continental areas of the tundra also typically receive much less precipitation than Iceland and are therefore drier and more favorable for wildfires to spread [30].
The most catastrophic eruption on Iceland, and the largest European effusive eruption in the past 1000 years, was the 1783/1784 Laki eruption, with gas and ash clouds, which caused a decimation of livestock and resulted in a famine in Iceland [31,32]. The Laki eruption started in June 1783, during a timing when wildfires are prominent, as our study suggests. Therefore, we conjecture that the Laki eruption, occurring in a densely moss-covered and flat terrain, during its 7 month-long activity, was accompanied by extensive wildfires that exceeded the herein studied wildfires many times. Another similar (although larger) eruption to the recent Reykjanes fires are the Krafla fires of 1975–1984. These fissure eruptions are well documented; however, they occurred in an area with only sparse vegetation. We explored maps and existing aerial pictures (accessible through the Natural Science Institute of Iceland, LMI); no wildfires are recognizable, nor are there eyewitness accounts, photographs, or papers mentioning them. This is surprising, as the eruption was long, from 1975 and 1984, which implies that wildfires on Iceland do not always accompany large fissure eruptions. Other wildfires also occurred on Iceland, though at a smaller scale. In 2006, a wildfire occurred in the northwest of Iceland, burning 73 km2 of brush and sedges in a wetland; however, it was not caused by volcanic activity [33]. Historically, wildfires are part of the Icelandic ecosystem and can be reconstructed through stratigraphic data [34], but their causes are unknown. The recent eruptions, therefore, seem to be the first time that substantial lava-ignited fires can be directly monitored in Iceland.
4.1. Limitations and Alternatives
Satellite coverage proved to be the strongest limiting factor for obtaining a complete understanding and good temporal resolution of the progress of the eruptions and burns. While Sentinel-2 has very good coverage even as far north as Iceland (with an image every two or three days), during the winter (November to January), there are usually no or very few pictures due to the limited daylight hours (around four hours of daytime in Reykjavík on the 21 December). When the sun is very low, this leads to shadows obscuring the hill-covered landscape. Additionally, cloud cover can obstruct the view for long periods of time due to the maritime location of Iceland, which results in frequent precipitation. Filtering for cloud cover is possible, but even a cloud cover of 10% does not guarantee that the study area is visible.
The NDVI has some weaknesses, such as change with the wetness of an area. Usually, this is a good indicator of the general water availability, e.g., in a forest, but since moss reacts very fast (in minutes) to water being added, even a short shower can transform an area from completely dried up and grey to a lush green and can also change the NDVI [35]. Furthermore, the index does not allow recognition of clouds, with the value of the water vapor sometimes being similar to barren ground. A low angle of the sun and the resulting shadows on the hills also have an influence. For analysis, the mean NDVI over two months was calculated, which made a smoother curve but also resulted in problems when the winter months only had one value, which then highly impacted the results.
The NDVI is also dependent on pre-existing structures on the ground. One example would be the 2024 Sundhnúkur 6 eruption, where the burned area next to the lava had similar NDVI values as an unburned area to the west of it (Supplementary Materials, Figure S1). This would make it difficult to distinguish burned and unburned surfaces solely using NDVI. The reason for this is that the area around the eruptions was heterogeneous in itself, with naturally occurring different levels of vegetation cover, corresponding to the ground structure, mountain, and soil properties.
A widely used satellite tool for change detection is Satellite Aperture Radar (SAR), particularly for large fires where passive satellites do not penetrating clouds. This is because, in contrast to Sentinel-2 optical data, SAR images from Sentinel-1 are acquired with an active sensor. This has the advantage of being able to penetrate fires, steam, and clouds and is independent of day or nighttime [36]. Using SAR requires preprocessing and using pictures of exactly the same, with an ascending or descending path and polarization for comparison [37]. Usually, when an area is affected by wildfire, the ground structure changes drastically: before a fire, dense vegetation produces high backscatter due to the rough surface and volume. After burning, the ground is exposed and typically smooth or ash-covered, leading to lower backscatter. Additionally, SAR is sensitive to moisture content in vegetation and ground, which can also change after a wildfire [38]. Therefore, we conjecture that for wildfires on Iceland, SAR imagery might be advantageous.
Our own preliminary tests, however, suggest that details of the localized wildfires on the Reykjanes Peninsula are difficult to see in Sentinel-1 SAR data. The large 2023 fire was still recognizable in the SAR image (Supplementary Materials, Figure S2), probably due to a change in dielectric properties and surface structure as associated with the burned area. The fires in the other years, especially 2021, were more difficult to recognize, since they took place mostly on hills, and the ground was covered with stones. Moss mostly filled the gaps in between or occurred in cushions. The smaller fires creeping up the hillsides were not possible to detect using SAR.
Other methods used for burn detection are the Normalized Burn Ratio Index (NBR) and NDVI difference. After calculating the index, it is possible to subtract the values “before fire” from the values “after fire” and derive a change map [39]. NBR uses Sentinel-2 Bands 12 and 8A, similar to the SWIR imagery, while NDVI uses Bands 4 and 8.
These two indices were tested using a script in the Google Earth Engine (adapted from [40]). The resulting NDVI and NBR difference was then classified into three groups to distinguish lava and fire from the surrounding and unchanged areas (Figure 8). The NDVI map shows that this method is capable of separating unchanged and changed terrain, but the lava and fire areas are too similar to enable a clear distinction between them. The NBR showed better results in distinguishing the burned area in the 2023 eruption. It should, therefore, be considered for possible classification work in the future.
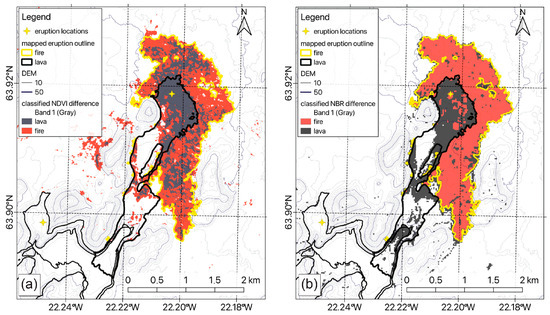
Figure 8.
Classified images showing difference in index before and after the 2023 Fagradalsfjall 3 eruption using (a) NDVI and (b) NBR.
Calculating the cover percentage via NDVI on 2.5 m × 2.5 m plots seems not to be the best method to estimate recovery in the analyzed region. The slopes, even in the “original” state before burning, do not have 100% vegetation cover. Some plots had lots of bare rock, with only a few burned moss cushions. Other areas (Supplementary Materials, Figure S3) show continuous soil cover and lots of bare roots, indicating complete vegetation cover before burning (Supplementary Materials, Figure S4). Calculating NDVI on a small scale with high resolution to estimate regrowth percentage is a good method for homogenous areas and should, therefore, be considered, for example, for the large and flat areas that burned in 2023 or during the Sundhnúkur 6 eruption.
The taxonomic inventory in Iceland yielded several difficulties. Bryophytes, especially mosses, are generally more difficult to identify in the field than vascular plants, leading to identification only at the genus level in some cases [41]. Some of the mosses only occurred in small patches, just starting to regrow and not showing sporophytes, which help identification. In Iceland, one cannot take samples of vegetation without a special permit. Plant identification in itself, based on visual inspection, only poses an error source. Some plants were only identified to the genus or family level.
4.2. Interpretation and Hazard Implications
4.2.1. Spatial Patterns
The wildfires accompanying the 2021–2024 eruptions on the Reykjanes Peninsula showed high diversity in their form and occurrence. The best example of this is the 2023 Fagradalsfjall 3 eruption. On the western side, the fire crept up the steep hills in the form of “fingers” (Figure 2a, left side of the picture)—elongated areas of 10 to 50 m length. On the northern and eastern side (on the right in the picture), the burns covered a bigger and more continuous area. Here, the terrain was much flatter. Slope angle is known to influence the spreading speed and pattern of fires, but the fuel bed and structure has a larger impact [42]. Hence, the Fagradalsfjall 3 fires spread further in the flat areas due to more vegetation (moss) availability, while the sparse vegetation structure on the mountain flanks prevented bigger continuous burned areas. This pattern was highly visible on the flanks of the Sundhnúkur 5 eruptions in 2024 (Figure 2c). The Sundhnúkur eruptions to the west took place on a generally flatter terrain than the Fagradalsfjall eruptions of 2021–2023, which corresponds to bigger fire areas.
Wind speed and direction can also have an influence on the spreading pattern of wildfires in heath ecosystems [43]. In the case of the Reykjanes wildfires, the wind probably did not play a huge role in propagation. The average wind speed during the 2023 eruption was slower in comparison to the summers before [44,45]. The year 2024 showed high wind speeds during the first day of the Sundhnúkur 6 eruption (around 60 km/h) in a northward direction, but the fires spread in all directions similarly.
Comparison between wildfire occurrence and vegetation maps shows that fires predominantly affect moss heathlands. Vegetation within the mapped areas is classified according to the dominant and characteristic plant species and is regularly updated as a downloadable dataset [46] and accessible from the Natural Science Institute of Iceland via a webgis interface (https://www.natt.is/ accessed on 12 April 2025). The second edition of the Digital Vegetation Map of Iceland, at an effective scale of 1:25,000, currently covers about 45% of the country’s ice-free land area. At Fagradalsfjall, the major fire zones correspond to the vegetation type moss cover (Mosagróður), specifically the subtype A3xh (mosses with Carex bigelowii and dwarf shrubs). Similarly, at Sundhnúkur, the burned regions fall within the same A3xh subtype and the A4zh subtype (mosses with dwarf shrubs). A consistent pattern emerges, in which burned areas are concentrated in regions characterized by relatively dense vegetation cover—approximately 75% (x)—and situated on lava fields (h). This suggests that a threshold level of vegetation density is necessary for wildfire propagation in these subarctic moss-dominated environments.
It is likely that the spreading of the fires depends strongly on the air and ground temperature and on precipitation in the days and weeks before an eruption. July 2023 showed several weeks with hardly any rain before and during the Fagradalsfjall 3 eruption, which started on the 10 July 2023 [44,45]. This likely caused the vegetation to dry out and present favorable ground for fire. The first two weeks of June 2024 and the second half of August 2024 were rather dry as well, fitting with the fires in that timeframe. Additionally, the season is likely to play a role. The eruptions that took place in winter or spring (beginning of Fagradalsfjall 1 eruption, Sundhnúkur 1, 2, 3, and 7) did not cause any fires. Winter temperatures are around freezing from December until March, with higher precipitation than in summer [44,45].
Considering the extensive spatial extent of the wildfires and associated hazards observed at Fagradalsfjall and Sundhnúkur, together with their documented effects on air quality across Iceland, future eruptive activity should be accompanied by enhanced atmospheric monitoring and targeted sampling. Current air-quality assessment frameworks at active volcanoes are primarily designed to measure volcanic gas emissions and related pollutants (e.g., SO2, CO2, aerosols; [47]), but they typically do not capture wildfire-related emissions such as particulate matter or organic combustion products. Consequently, the atmospheric and climatic consequences of these fires remain underrepresented in both monitoring efforts and predictive modeling. Importantly, wildfire emissions have not yet been incorporated into models evaluating the local and regional climate impacts of volcanic eruptions. Integrating this additional emission source into existing models [48] would provide a more comprehensive understanding of the coupled volcanic–atmospheric system, particularly under the unique conditions of subarctic environments where volcanic and wildfire processes interact.
4.2.2. Ecological Development
The NDVI analysis of the moss-covered areas shows different values for different terrains, such as valley, slope side, and flat area, due to different vegetation in those areas. However, all show a characteristic seasonal curve. The curve has similar characteristics as in other areas of the same latitude, with a steep increase in NDVI during May, high values through summer, and a sudden decrease around October. The maximum values of 0.4 to 0.5 in summer are typical for shrubs and grasslands [49].
After the eruption, the NDVI values dropped significantly to around 0 for lava areas, which can be expected for barren ground. The burned areas have an NDVI that is a bit higher and still show a little seasonality. This probably indicates vegetation that was not burned. Very low values below zero can be considered outliers, probably due to cloud cover and little data during the winter months. So far, no recovery signal (increasing NDVI) is recognizable in the NDVI timeline of the Fagradalsfjall 1 eruption, which conflicts with the field work, which showed considerable regrowth. The prevalent rocky structure of the area adjacent to the lava, which allowed very little vegetation even before the eruption, is a possible explanation for this.
Further information on the regrowth process can be seen in the taxonomic inventory. Burned plots had comparatively more vascular plants, especially more dwarf shrubs and herbs. The moss diversity was much higher on burned plots; Racomitrium lanuginosum was the only observed bryophyte on the unburned areas. In other research, moss was observed to present unfavorable conditions for vascular plant growth in Iceland [50]. Overall, the areas burned in 2021 show a shift from a moss heath ecosystem towards a more diverse plant community dominated by dwarf shrubs, grasses, and herbs. However, this development is drawn from only eight plots, so more observations will need to be carried out.
Similar trends of vegetation shift after a wildfire were also observed in northern Alaska (USA). In several locations, the previously widespread lichen recovered very slowly in burned areas, while grass and shrub cover were higher in burned areas in comparison to unburned areas, even as long as 14 years after the fires [39,51]. Another study in Lithuania found that a forest fire (pine forest with some birches and undergrowth of shrubs, herbs, and mosses) increased the available nutrients. In the first three years following the fire, the herbaceous species richness was higher. Recovery of the herb and dwarf shrub layer took 5–6 years, while for moss cover it was 9 years, and some differences in species composition remained [52]. In northern Britain, low-intensity wildfires were found to cause fast re-sprouting in heathland plants [53]. However, all of these locations were slightly different ecosystems from the Reykjanes Peninsula.
An example of vegetation development in a similar environment can be found in the Miðdalsheiði fire of 2007, which took place around 20 km east of Reykjavík and burned an area of 0.89 km2. The total vegetation cover in the area decreased from 95% to 0.5% after burning, and it recovered to 33% by 2013 [54,55]. The burned area also showed a clear vegetation shift. While moss (Racomitrium lanuginosum) was dominant on unburned plots (78% cover), six years after burning, vascular plants made up most of the existing vegetation on burned plots. The most abundant ones were Agrostis vinealis, several Festuca species, and Salix herbacea [54]. Salix herbacea was also one of the most prominent vascular plants on burned plots in this study. However, instead of grasses, the plots had higher abundances of dwarf shrubs. These findings confirm the probable shift from a moss-dominated ecosystem towards vascular plants after a wildfire in Iceland. On satellite imagery, the burn scar of the 2007 fire is still recognizable 17 years later, indicating in general very slow recovery, which can similarly be expected for the burns next to the Fagradalsfjall and Sundhnúkur eruptions.
In the field, in some places, there were also small, burned spots, completely surrounded by unaffected vegetation (Figure 2b). These isolated spots were probably ignited either by hot gas propagating through faults or ejected hot pyroclastic material (airfall tephra). During the 2021 eruption, lapilli was found up to 600 m from the vent [9]. The same process probably caused the repeated burning in the “2021 areas” one year later. Additionally, these spots show a much more fragmented distribution of burned areas, the mapping of which is not possible with the image resolution of 10 m that Sentinel-2 provides.
Observations from 2021 further showed that some other processes might be occurring during the eruptions. While moss cushions were completely black and apparently burned, the adjacent dwarf shrubs and grasses were still structurally intact but dead (Figure 2d). Most plants tolerate temperatures of up to 42 °C [56], which are easily reached in close proximity to the lava. Consequently, the shrubs could have died from heat exposure, although it seems unlikely that the moss in direct contact with the shrubs burned through without igniting the leaves. Shrubs should ignite more easily, since leaves are typically more flammable than wet moss. The effect fire has on moss can vary on a microtopography scale though, with drier hummocks usually burning more severely than adjacent hollows [57].
5. Conclusions
This study provides the first comprehensive assessment of lava-induced wildfires in Iceland, a phenomenon previously underestimated and rarely documented in subarctic environments. Using Sentinel-2 satellite data in combination with field surveys, we quantified the extent, timing, and ecological effects of wildfires triggered by volcanic eruptions on the Reykjanes Peninsula between 2021 and 2024. During this period, at least 11.4 km2 of moss-dominated heathland burned beyond the lava margins, with the largest consecutive fires covering 2.1 km2 and occurring up to 1100 m from the lava.
Our spatial analysis revealed that fire extent correlated positively with gentle slopes and low-relief terrain, while steeper slopes tended to host smaller, elongated burn patches—patterns likely governed by vegetation structure and vegetation continuity. Seasonality emerged as a decisive control, with fires occurring exclusively between April and September, peaking in August. These events caused significant air pollution and ecosystem disruption, potentially increasing erosion risk in this fragile volcanic landscape.
Field observations documented highly variable post-fire surface and vegetation conditions. Burned plots showed heterogeneous regrowth, with vegetation cover ranging from 0.9% to 27.6% and a clear shift from moss-dominated communities toward higher vascular plant diversity. These patterns suggest altered successional trajectories and long-term ecological change, though additional monitoring is required to confirm these trends.
From a methodological perspective, manual mapping of burn areas using Sentinel-2 imagery proved reliable, though it was constrained by cloud cover and complex topography. NDVI and NBR classifications captured general burn patterns and regrowth trends but remain limited in areas of sparse pre-fire vegetation. Incorporating higher-resolution aerial or drone imagery and expanding the number of field plots would improve future monitoring accuracy and ecological interpretation.
Overall, lava-ignited moss burns represent a novel and consequential secondary disturbance in Icelandic volcanic environments. Beyond their immediate hazards, these fires offer a unique opportunity to study fire ecology, plant succession, and resilience in subarctic systems where wildfires were previously unknown. Continued observation of these landscapes will be essential for developing hazard assessments, understanding ecosystem recovery, and informing future land management on newly formed volcanic terrains.
Supplementary Materials
The following supporting information can be downloaded at: https://www.mdpi.com/article/10.3390/geohazards6040070/s1, Table S1: Vegetation cover classified in accordance with Braun–Blanquet and converted into a continuous scale; Table S2: Vegetation recorded in the 2.5 × 2.5 m plots around the Fagradalsfjall 1 eruption; Figure S1: NDVI image from 2024-09-13 (retrieved from Copernicus Browser) with outlines of the lava areas (black) and fire areas (yellow) of the Sundhnúkur 6 eruption; Figure S2: Comparison of true color, false color, and NDVI image from Sentinel-2 and synthetic aperture radar (SAR) image from Sentinel-1; Figure S3: Locations of the plots taken for NDVI analysis and plant inventory. Figure S4: Vegetation cover of the 2.5 × 2.5 m field plots The eight plots are adjacent to the lava flow from the 2021 Fagradalsfjall 1 eruption, calculated from NDVI close-up pictures taken with a multispectral camera. The abundance of each occurring species was transformed from the Braun–Blanquet-scale into the mean cover values. References [23,58] are cited in the supplementary materials.
Author Contributions
Conceptualization, J.S. and T.R.W.; methodology, J.S.; field validation, J.S. and L.S.; investigation, J.S., T.R.W., L.S. and T.H.; writing—original draft preparation, J.S. and T.R.W.; writing—review and editing, J.S., T.R.W., L.S. and T.H.; visualization, J.S.; supervision, T.R.W. and T.H.; funding acquisition, T.R.W. All authors have read and agreed to the published version of the manuscript.
Funding
This research was supported by the Hazard Assessment and Risk Team (HART) fund provided by the hosting institution. No external funding.
Data Availability Statement
The original contributions presented in this study are included in the article/Supplementary Materials. Further inquiries can be directed to the corresponding author.
Acknowledgments
We thank all relevant parties and acknowledge funding sources, if any. The authors appreciate the survey data, maps, and information provided by Svarmi through Tryggvi Stefánsson; the Icelandic Institute of Natural History, especially Birgir Vilhelm Óskarsson and Robert A. Askew; and the National Land Survey of Iceland through Joaquín M.C. Belart. We also thank Magnús T. Guðmundsson and Inga Ingeborg for the discussion.
Conflicts of Interest
The authors declare that they have no conflicts of interest. The funders had no role in the design of the study; in the collection, analysis, or interpretation of data; in the writing of the manuscript; or in the decision to publish the results.
References
- Quah, J.Y.; Hayes, J.L.; Fitzgerald, R.H.; Lerner, G.A.; Jenkins, S.F.; Wilson, T.M.; Scheele, F.; Lukovic, B.; Fleischmann, C. Fire from volcanic activity: Quantifying the threat from an understudied hazard. Fire Saf. J. 2023, 141, 103935. [Google Scholar] [CrossRef]
- Tanguy, J.-C. The 1902–1905 eruptions of Montagne Pelée, Martinique: Anatomy and retrospection. J. Volcanol. Geotherm. Res. 1994, 60, 87–107. [Google Scholar] [CrossRef]
- Baxter, P.J.; Boyle, R.; Cole, P.; Neri, A.; Spence, R.; Zuccaro, G. The impacts of pyroclastic surges on buildings at the eruption of the Soufrière Hills volcano, Montserrat. Bull. Volcanol. 2005, 67, 292–313. [Google Scholar] [CrossRef]
- Jenkins, S.; Komorowski, J.C.; Baxter, P.J.; Spence, R.; Picquout, A.; Lavigne, F.; Surono. The Merapi 2010 eruption: An interdisciplinary impact assessment methodology for studying pyroclastic density current dynamics. J. Volcanol. Geotherm. Res. 2013, 261, 316–329. [Google Scholar] [CrossRef]
- Shatto, C.; Kiene, M.; Hofmann, P.; Walentowitz, A.; Wilkens, V.; Heuser, T.; Weiser, F. Assessing the recovery of Pinus canariensis stands after wildfires and volcanic eruption on La Palma, Canary Islands. Forest Ecol. Manag. 2024, 572, 122317. [Google Scholar] [CrossRef]
- Ainsworth, A.; Kauffman, J.B. Interactions of fire and nonnative species across an elevation/plant community gradient in Hawaii Volcanoes National Park. Biotropica 2010, 42, 647–655. [Google Scholar] [CrossRef]
- Turchi, A.; Di Traglia, F.; Luti, T.; Olori, D.; Zetti, I.; Fanti, R. Environmental aftermath of the 2019 stromboli eruption. Remote Sens. 2020, 12, 994. [Google Scholar] [CrossRef]
- Thordarson, T.; Höskuldsson, A. Postglacial volcanism in Iceland. Jokull 2008, 58, 197–228. [Google Scholar] [CrossRef]
- Barsotti, S.; Parks, M.M.; Pfeffer, M.A.; Óladóttir, B.A.; Barnie, T.; Titos, M.M.; Jónsdóttir, K.; Pedersen, G.B.M.; Hjartardóttir, Á.R.; Stefansdóttir, G.; et al. The eruption in Fagradalsfjall (2021, Iceland): How the operational monitoring and the volcanic hazard assessment contributed to its safe access. Nat. Hazards 2023, 116, 3063–3092. [Google Scholar] [CrossRef]
- Thordarson, T.; Höskuldsson, Á. Iceland, 3rd ed.; Dunedin Academic Press Ltd.: Perth, UK, 2014; p. 280. [Google Scholar]
- Sæmundsson, K.; Sigurgeirsson, M.A.; Fridleifsson, G.O. Geology and structure of the Reykjanes volcanic system, Iceland. J. Volcanol. Geotherm. Res. 2020, 391, 106501. [Google Scholar] [CrossRef]
- Ducrocq, C.; Árnadóttir, T.; Einarsson, P.; Jónsson, S.; Drouin, V.; Geirsson, H.; Hjartardóttir, Á.R. Widespread fracture movements during a volcano-tectonic unrest: The Reykjanes Peninsula, Iceland, from 2019–2021 TerraSAR-X interferometry. Bull. Volcanol. 2024, 86, 14. [Google Scholar] [CrossRef]
- Bindeman, I.N.; Deegan, F.M.; Troll, V.R.; Thordarson, T.; Höskuldsson, Á.; Moreland, W.M.; Zorn, E.U.; Shevchenko, A.V.; Walter, T.R. Diverse mantle components with invariant oxygen isotopes in the 2021 Fagradalsfjall eruption, Iceland. Nat. Commun. 2022, 13, 3737. [Google Scholar] [CrossRef]
- Troll, V.R.; Deegan, F.M.; Thordarson, T.; Tryggvason, A.; Krmíček, L.; Moreland, W.M.; Lund, B.; Bindeman, I.N.; Höskuldsson, Á.; Day, J.M.D. The Fagradalsfjall and Sundhnúkur fires of 2021–2024: A single magma reservoir under the Reykjanes Peninsula, Iceland? Terra Nova 2024, 36, 447–456. [Google Scholar] [CrossRef]
- Parks, M.; Drouin, V.; Sigmundsson, F.; Hjartardóttir, Á.R.; Geirsson, H.; Pedersen, G.B.M.; Belart, J.M.C.; Barsotti, S.; Lanzi, C.; Vogfjörd, K.; et al. 2023–2024 inflation-deflation cycles at Svartsengi and repeated dike injections and eruptions at the Sundhnúkur crater row, Reykjanes Peninsula, Iceland. Earth Planet. Sci. Lett. 2025, 658, 119324. [Google Scholar] [CrossRef]
- De Pascale, G.P.; Fischer, T.J.; Moreland, W.M.; Geirsson, H.; Hrubcová, P.; Drouin, V.; Forester, D.; Payet-Clerc, M.; da Silveira, D.B.; Vlček, J.; et al. On the move: 2023 observations on real time graben formation, Grindavík, Iceland. Geophys. Res. Lett. 2024, 51, e2024GL110150. [Google Scholar] [CrossRef]
- Sigmundsson, F.; Parks, M.; Geirsson, H.; Hooper, A.; Drouin, V.; Vogfjoerd, K.S.; Ofeigsson, B.G.; Greiner, S.H.M.; Yang, Y.L.; Lanzi, C.; et al. Fracturing and tectonic stress drive ultrarapid magma flow into dikes. Science 2024, 383, 1228–1235. [Google Scholar] [CrossRef]
- Hurley, M.; Oestreicher, N.; Shevchenko, A.V.; De Pascale, G.P.; Gudmundsson, M.T.; Gudnason, E.Á.; Hersir, G.P.; De Jarnatt, B.F.; Joachim, A.; Ruch, J.; et al. Fracture dynamics and topographic controls at Mount Thorbjörn during the Svartsengi 2023–2024 volcanic unrest, iceland. J. Volcanol. Geotherm. Res. 2025, 466, 108407. [Google Scholar] [CrossRef]
- Cascio, W.E. Wildland fire smoke and human health. Sci. Total Environ. 2018, 624, 586–595. [Google Scholar] [CrossRef] [PubMed]
- Arnalds, O. The Soils of Iceland; Springer: Dordrecht, The Netherlands, 2015; Volume 1, p. 183. [Google Scholar]
- Cutler, N.A.; Belyea, L.R.; Dugmore, A.J. Spatial patterns of microsite colonisation on two young lava flows on Mount Hekla, Iceland. J. Veg. Sci. 2008, 19, 277–286. [Google Scholar] [CrossRef]
- Dierßen, K. Einführung in die Pflanzensoziologie (Vegetationskunde); Wiss. Buchges.: Darmstadt, Germany, 1990; Volume 1, p. 241. [Google Scholar]
- Braun-Blanquet, J. Pflanzensoziologie; Springer: Vienna, Austria, 1964; Volume 1, p. 866. [Google Scholar]
- IMO. The Ninth Eruption on the Sundhnúkur Crater Row has Ended. 2025. Available online: https://en.vedur.is/about-imo/news/a-magma-instrusion-has-started-on-sundhnuksgigarod-crater-row (accessed on 19 September 2025).
- Grosse, P.; Euillades, P.A.; Euillades, L.D.; van Wyk de Vries, B. A global database of composite volcano morphometry. Bull. Volcanol. 2013, 76, 784. [Google Scholar] [CrossRef]
- Canosa, I.V.; Biesbroek, R.; Ford, J.; McCarty, J.L.; Orttung, R.W.; Paavola, J.; Burnasheva, D. Wildfire adaptation in the Russian Arctic: A systematic policy review. Clim. Risk Manag. 2023, 39, 100481. [Google Scholar] [CrossRef]
- Masrur, A.; Taylor, A.; Harris, L.; Barnes, J.; Petrov, A. Topography, climate and fire history regulate wildfire activity in the Alaskan Tundra. J. Geophys. Res. Biogeosciences 2022, 127, e2021JG006608. [Google Scholar] [CrossRef]
- Olson, D.M.; Dinerstein, E.; Wikramanayake, E.D.; Burgess, N.D.; Powell, G.V.N.; Underwood, E.C.; D’Amico, J.A.; Itoua, I.; Strand, H.E.; Morrison, J.C.; et al. Terrestrial ecoregions of the world: A new map of life on earth: A new global map of terrestrial ecoregions provides an innovative tool for conserving biodiversity. BioScience 2001, 51, 933–938. [Google Scholar] [CrossRef]
- Pfadenhauer, J.S.; Klötzli, F.A. Vegetation der Erde; Springer Spektrum: Berlin/Heidelberg, Germany, 2014; Volume 1, p. 645. [Google Scholar]
- Givnish, T.J. Adaptive significance of evergreen vs. Deciduous leaves: Solving the triple paradox. Silva Fenn. 2002, 36, 535. [Google Scholar] [CrossRef]
- Gudmundsson, M.; Larsen, G.; Hoskuldsson, A.; Gylfason, Á. Volcanic hazards in Iceland. Jökull 2008, 58, 251–268. [Google Scholar] [CrossRef]
- Wieners, C.E. Haze, hunger, hesitation: Disaster aid after the 1783 Laki eruption. J. Volcanol. Geotherm. Res. 2020, 406, 107080. [Google Scholar] [CrossRef]
- Thorsteinsson, T.; Magnusson, B.; Gudjonsson, G. Large wildfire in Iceland in 2006: Size and intensity estimates from satellite data. Int. J. Remote Sens. 2011, 32, 17–29. [Google Scholar] [CrossRef]
- Ardenghi, N.; Harning, D.J.; Raberg, J.H.; Holman, B.R.; Thordarson, T.; Geirsdóttir, Á.; Miller, G.H.; Sepúlveda, J. A holocene history of climate, fire, landscape evolution, and human activity in northeastern Iceland. Clim. Past. 2024, 20, 1087–1123. [Google Scholar] [CrossRef]
- Raynolds, M.K.; Walker, D.A. Increased wetness confounds Landsat-derived NDVI trends in the central Alaska North Slope region, 1985–2011. Environ. Res. Lett. 2016, 11, 085004. [Google Scholar] [CrossRef]
- Ban, Y.; Zhang, P.; Nascetti, A.; Bevington, A.R.; Wulder, M.A. Near real-time wildfire progression monitoring with Sentinel-1 SAR time series and deep learning. Sci. Rep. 2020, 10, 1322. [Google Scholar] [CrossRef]
- Ajadi, O.A.; Meyer, F.J.; Webley, P.W. Change detection in synthetic aperture radar images using a multiscale-driven approach. Remote Sens. 2016, 8, 482. [Google Scholar] [CrossRef]
- Hosseini, M.; Lim, S. Burned area detection using Sentinel-1 SAR data: A case study of Kangaroo Island, South Australia. Appl. Geogr. 2023, 151, 102854. [Google Scholar] [CrossRef]
- Jandt, R.; Miller, E.; Jones, B. Fire Effects 10 Years After the Anaktuvuk River Tundra Fires; Bureau of Land Management Alaska: Anchorage, AK, USA, 2021. [Google Scholar]
- Martinez, S. Gee-ndvi-Change-Detection. 2019. Available online: https://github.com/sabrinanicc/GEE-NDVI-Change-Detection (accessed on 13 February 2025).
- Ingimundardóttir, G.V.; Cronberg, N.; Magnússon, B. Bryophytes of Surtsey, Iceland: Latest developments and a glimpse of the future. Surtsey Res. 2022, 15, 61–87. [Google Scholar] [CrossRef]
- Linn, R.R.; Winterkamp, J.L.; Weise, D.R.; Edminster, C. A numerical study of slope and fuel structure effects on coupled wildfire behaviour. Int. J. Wildland Fire 2010, 19, 179–201. [Google Scholar] [CrossRef]
- Davies, G.M.; Legg, C.J.; Smith, A.A.; MacDonald, A.J. Rate of spread of fires in Calluna vulgaris-dominated moorlands. J. Appl. Ecol. 2009, 46, 1054–1063. [Google Scholar] [CrossRef]
- IMO. Icelandic Met Office: The Weather in Iceland in 2023. 2024. Available online: https://en.vedur.is/about-imo/news/the-weather-in-iceland-in-2023 (accessed on 13 February 2025).
- Weatherspark. 2023 Weather History at Keflavík International Airport. 2025. Available online: https://weatherspark.com/h/y/147626/2023/Historical-Weather-during-2023-at-Reykjavik-Airport-Iceland (accessed on 12 June 2025).
- Anon, NI_G25v Vegetation map of Iceland-1:25,000. 2023. Available online: http://data.europa.eu/88u/dataset/7fbb84d8-3f86-48ce-8cb8-242adec77dba (accessed on 13 October 2025).
- Wainman, L.; Ilyinskaya, E.; Pfeffer, M.; Mandon, C.; Bali, E.; Edwards, B.A.; Kleine-Marshall, B.I.; Gudjonsdottir, S.R.; Cotterill, A.; Scott, S.W.; et al. Trace element emissions vary with lava flow age and thermal evolution during the fagradalsfjall 2021–2023 eruptions, iceland. Geochem. Geophys. Geosystems 2024, 25, e2024GC011822. [Google Scholar] [CrossRef]
- Zoëga, T.; Storelvmo, T.; Krüger, K. Modelled surface climate response to effusive Icelandic volcanic eruptions: Sensitivity to season and size. Atmos. Chem. Phys. 2025, 25, 2989–3010. [Google Scholar] [CrossRef]
- Idrees, M.O.; Omar, D.M.; Babalola, A.; Ahmadu, H.A.; Yusuf, A.; Lawal, F.O. Urban land use land cover mapping in tropical savannah using Landsat-8 derived normalized difference vegetation index (NDVI) threshold. S. Afr. J. Geomat. 2022, 11, 100–112. [Google Scholar] [CrossRef]
- Jägerbrand, A. Patterns of species richness and vegetative performance in heath ecosystems at Thingvellir, Southwest Iceland. Icel. Agric. Sci. 2004, 16–17, 29–38. [Google Scholar]
- Jandt, R.; Joly, K.; Meyers, C.R.; Racine, C. Slow recovery of lichen on burned caribou winter range in Alaska Tundra: Potential influences of climate warming and other disturbance factors. Arct. Antarct. Alp. Res. 2008, 40, 89–95. [Google Scholar] [CrossRef]
- Marozas, V.; Racinskas, J.; Bartkevicius, E. Dynamics of ground vegetation after surface fires in hemiboreal Pinus sylvestris forests. For. Ecol. Manag. 2007, 250, 47–55. [Google Scholar] [CrossRef]
- Mallik, A.U.; Gimingham, C.H. Regeneration of heathland plants following burning. Vegetatio 1983, 53, 45–58. [Google Scholar] [CrossRef]
- Alfreðsson, M.S. Mosabruninn á Miðdalsheiði 2007: Áhrif hans á Smádýr. 2016. Available online: http://hdl.handle.net/1946/26190 (accessed on 19 September 2025).
- Grétarsdóttir, I. Moss fires in miðdalsheiði in the summer of 2007. Agric. Educ. Forum 2009, 8, 443–447. [Google Scholar]
- Sage, R.F.; Kubien, D.S. The temperature response of C3 and C4 photosynthesis. Plant Cell Environ. 2007, 30, 1086–1106. [Google Scholar] [CrossRef] [PubMed]
- Andersen, R.; Fernandez-Garcia, P.; Martin-Walker, A.; Klein, D.; Marshall, C.; Large, D.J.; Hughes, R.; Hancock, M.H. Blanket bog vegetation response to wildfire and drainage suggests resilience to low severity, infrequent burning. Fire Ecol. 2024, 20, 26. [Google Scholar] [CrossRef]
- Van der Maarel, E. Transformation of cover-abundance values in phytosociology and its effects on community similarity. Vegetatio 1979, 39, 97–114. [Google Scholar] [CrossRef]
Disclaimer/Publisher’s Note: The statements, opinions and data contained in all publications are solely those of the individual author(s) and contributor(s) and not of MDPI and/or the editor(s). MDPI and/or the editor(s) disclaim responsibility for any injury to people or property resulting from any ideas, methods, instructions or products referred to in the content. |
© 2025 by the authors. Licensee MDPI, Basel, Switzerland. This article is an open access article distributed under the terms and conditions of the Creative Commons Attribution (CC BY) license (https://creativecommons.org/licenses/by/4.0/).