Article

Sodium Oxide-Fluxed Aluminothermic Reduction of Manganese Ore with Synergistic Effects of C and Si Reductants: SEM Study and Phase Stability Calculations

by
Theresa Coetsee
1,* and
Frederik De Bruin
2
1
Department of Materials Science and Metallurgical Engineering, University of Pretoria, Pretoria 0002, South Africa
2
Independent Metallurgical Consultant, Pretoria 0002, South Africa
*
Author to whom correspondence should be addressed.
Reactions 2025, 6(3), 40; https://doi.org/10.3390/reactions6030040
Submission received: 12 June 2025 / Revised: 17 July 2025 / Accepted: 25 July 2025 / Published: 28 July 2025

Abstract

Aluminothermic reduction is an alternative processing route for the circular economy because Al is produced electrochemically in the Hall–Héroult process with minimal CO2 emissions if the electricity input is sourced from non-fossil fuel energy sources. This circular processing option attracts increased research attention in the aluminothermic production of manganese and silicon alloys. The Al2O3 product must be recycled through hydrometallurgical processing, with leaching as the first step. Recent work has shown that the NaAlO2 compound is easily leached in water. In this work, a suitable slag formulation is applied in the aluminothermic reduction of manganese ore to form a Na2O-based slag of high Al2O3 solubility to effect good alloy–slag separation. The synergistic effect of carbon and silicon reductants with aluminium is illustrated and compared to the test result with only carbon reductant. The addition of small amounts of carbon reductant to MnO2-containing ore ensures rapid pre-reduction to MnO, facilitating aluminothermic reduction. At 1350 °C, a loosely sintered mass formed when carbon was added alone. The alloy and slag chemical analyses are compared to the thermochemistry predicted phase chemistry. The alloy consists of 66% Mn, 22–28% Fe, 2–9% Si, 0.4–1.4% Al, and 2.2–3.5% C. The higher %Si alloy is formed by adding Si metal. Although the product slag has a higher Al2O3 content (52–55% Al2O3) compared to the target slag (39% Al2O3), the fluidity of the slags appears sufficient for good alloy separation.

1. Introduction

Beketov pioneered the aluminothermic reduction process in 1859 [1]. Once lower-cost aluminium became available in the 19th century, the practical application of aluminothermic reduction expanded through the work of Beketov and Goldschmidt, respectively [1]. Thermic reduction with Al or Si as reductant is a well-established method of producing low-carbon ferroalloys of manganese and chromium from a molten slag [2]. Medium–carbon ferromanganese (MCFeMn) can be produced by thermic reduction or via oxygen refining of high-carbon ferromanganese (HCFeMn). Silicothermic reduction of manganese oxide-based slags is performed in an electric furnace because the exothermic heat generated by silicothermic reduction is insufficient to meet overall process heat requirements [2]. Low-carbon ferromanganese (LCFeMn) is only produced with silicothermic reduction because of excessive manganese losses in oxygen refining. Table 1 presents the chemical compositions of the various carbon ferromanganese alloys [3]. The silicon reductant is sourced as silicomanganese alloy of 16–30% Si for medium-carbon ferro-manganese production, and 32–33%Si for low-carbon ferro-manganese production. The silico-manganese minimum %Si content is selected based on the target %C in the product alloy because the carbon solubility in Fe–Mn–Si–C alloys decreases drastically with increased %Si [2]. The need for low-carbon and low-phosphorus manganese alloys is motivated in the production of transformation-induced plasticity (TRIP) and twinning-induced plasticity (TWIP) steels since these grades contain high manganese (15–25% Mn), silicon (3%), and aluminium (3%) and low carbon levels (0.01% C) [4]. Furthermore, the application of aluminium-silicon-manganese (AMS), ferromanganese-aluminium (FMA), and ferrosiliconmanganese–aluminium (FAMS) complex alloys in conventional steelmaking plants is more efficient than adding individual deoxidiser alloys [5,6]. These alloys are produced in electric furnaces operated at high temperatures, using coke as a reductant to reduce Al2O3 to Al [6].
The application of aluminium as a reductant opens the possibility of a circular process with reduced CO2 emissions as proposed in recent studies [7,8,9,10]. These studies explain that since aluminium is produced electrochemically in the Hall–Héroult process, and the slag and aluminium are reacted in an electric furnace, most of the process CO2 formation can be negated. Recent work applied discarded smelter slag as the MnO source in aluminothermic reduction since much MnO slag is stockpiled [7,8]. However, these slags are currently produced as a by-product or discard product of carbothermic reduction processes. Therefore, applying aluminothermic reduction with the ore as the starting material in a single step can provide a simplified circular process [7,8,9,10]. Some examples of this approach are already being used industrially. For example, low-carbon ferro-manganese production from roasted low-grade manganese ore is described in [11]. Pre-roasting of the ore is required to convert MnO2 to Mn2O3 or Mn3O4, thereby decreasing the violent heat release during aluminothermic reduction with MnO2 [11]. The ore feed requirement is a minimum of 46% Mn and a Mn/Fe ratio of 9, with a P content below 0.12%. CaF2 is added as a flux [11]. The product alloy composition ranged from 70–84% Mn, 13–16% Fe, 1–10% Si, <0.03% Al, and <0.24% P, and the metal yield was 58–64%.
Researching the fundamentals of the aluminothermic reduction reaction is complicated by the rapid release of heat from the exothermic reaction between Al and oxidants. The implication is that the reaction system is reacted under non-isothermal conditions, which complicates the kinetic analysis [12]. Oxidants other than air may be added deliberately as an additive, or the oxides targeted for the reduction reaction may form the dual purpose of oxidant and metal/alloy product former. In some studies the mixture is reacted under a protective gas atmosphere, such as Argon gas, to eliminate oxygen in the air from reacting with the feed mixture [8,9,13]. However, it has been shown that some air is required to initiate the reaction in MnO2–Al mixtures since this mixture did not act under Argon gas [12]. Therefore, varied reaction mixtures have been reported in the literature with different particle sizes, aluminium-to-oxide ratios, mixture compaction extents, oxide and metal solution phases formed, reactor materials, and, most importantly, inert or oxygen-containing atmosphere selection, with or without ignition chemicals or oxidants [8,9,11,12,13,14]. Industrial applications typically do not use expensive inert atmospheric gases for shielding against air; therefore, process feasibility must be tested in an air atmosphere first. This effect is observed in the work of Sarangi et al. [12], where a fundamental kinetic study on MnO2–Al mixtures was conducted in static air, following the failure of the reaction under an Argon atmosphere. Activation energy values ranging from −518 kJ/mol to −910 kJ/mol were reported for heating rates of 5 K/min and 15 K/min [12]. In comparison, 284 kJ/mol was reported for 5 µm Al reacted, versus 416 kJ/mol for nano-Al reacted at a heating rate of 10 K/min [15]. In the low-temperature (750–850 °C) reaction of MnO and Mn3O4 with a stirred aluminium bath in air, activation energy values of 330 kJ/mol and 36 kJ/mol were reported [16]. It is clear that the rate constant values from each study result in apparent activation energy values peculiar to the specific factors of the reactant mixture, such as particle size, mixture compaction density, and phase chemistry changes with reaction progress [12,15,16]. Thus, in the aluminothermic reduction process, the attainment of liquid slag and alloy from the aluminothermy heat and mixture formulation is the first process requirement to ensure optimal separation of the produced alloy from the slag.
Since Al2O3 has a high melting point, the slag chemistry must be designed to flux most Al2O3. Thus, the slag volume can be excessive, and the phase chemistry of the slag will influence the ease of subsequent processing for hydrometallurgical recovery of Al2O3 [7,8,17,18]. Since CaO and Al2O3 form low liquidus compounds and CaO in the slag increases the activity of MnO in the slag to promote aluminothermic reduction of MnO, the aim slag of CaO-Al2O3 was applied [7,8]. The leaching of Al from CaO-Al2O3 slag has been demonstrated in a 10% Na2CO3 solution, reacted at 30–45 °C [17]. Only a small quantity of the silicate phase was not leachable. Another approach is a Na2O-Al2O3-based slag since the NaAlO2 compound is easily leached in water [18]. Adequate leaching conditions were identified at a solid–liquid ratio of 1:10 with a leaching time of 60 min at 60 °C. The leachate contained Na+:Al3+ at 1.43:1. Carbonation with CO2 gas bubbled through the solution at 80 °C resulted in a pH of 12.5–10.5 for 96.5% Al recovery as α-Al(OH)3 (Bayerite) particles of 90% +44 μm and 98.8% alumina grade, suitable for feed to the Hall–Héroult process after calcination to α-Al2O3 [18].
This work aims to formulate and test a suitable slag formulation for the application of circular processing of aluminium as the primary reductant in manganese ore reduction, producing a low-carbon ferro–manganese alloy. The slag must have high Al2O3 solubility to effect adequate alloy–slag separation and must allow the Al2O3 product to be recovered via hydrometallurgy. The synergistic effect of carbon and silicon reductants with aluminium is illustrated and compared to distinct scenarios, as well as to the test result with only carbon as a reductant.

2. Materials and Methods

2.1. Materials

The reaction mixture consisted of manganese ore, coal, metal powders of aluminium and silicon, and lime and sodium silicate as flux. The chemically pure metal powders were sourced as follows: Al (99.7% Al, −1 mm) and Si (99.9% Si, −44 µm) provided by Sigma-Aldrich (Johannesburg, South Africa). The chemically pure sodium silicate is supplied by Sigma-Aldrich (Johannesburg, South Africa), and CaO is provided by Associated Chemical Enterprises (Johannesburg, South Africa). The manganese ore is a pyrolusite (MnO2)-based ore sourced from a small-scale ore body complex in South Africa, and the medium-volatile coal is also sourced from South Africa. The composition of the manganese ore and coal ash is shown in Table 2. The coal contains 22.5% volatile matter, 12% ash, 62.2% fixed carbon, and 3.3% moisture. The mixture, based on 100 g of ore, was placed in a graphite crucible and sealed with a graphite lid. The crucible dimensions were 50 mm inner diameter, 70 mm in height, and 7 mm in wall thickness. The lid was recessed by 7 mm to fit the crucible’s inner diameter. The reaction mixtures are summarised in Table 3.

2.2. Methods

The reaction mixture masses were weighed and mixed thoroughly in a mixing container. The mixture was transferred into the graphite crucible, and the graphite lid was placed onto the crucible rim. The muffle furnace was pre-heated and soaked for 12 h at the set-point temperature of 1350 °C. The furnace temperature was controlled using a proportional-integral-derivative (PID) controller. The aluminothermic reaction consists of placing the graphite crucible and contents into the muffle furnace. From prior experimentation, it was noted that the crucible must be removed from the furnace 2 min after ignition, marked by a flash flame exiting the muffle furnace’s top side panel joint gaps. Therefore, the reaction mixture was not entirely heated by the muffle furnace, but rather via the exothermic aluminium (aluminothermic) reaction. The ignition time was 6 min after placing the crucible in the furnace. Following a total reaction time of 8 min, the crucible and its contents were removed from the furnace. The lid was then removed, and the fluid metal and slag were poured into a cast-iron mould. Upon cooling to room temperature, the poured contents were returned to the graphite crucible for manual separation of metal and slag.
The large slag and alloy blobs were sectioned for chemical analysis of the alloy and slag phases using a scanning electron microscope (SEM). The cross-section faces were coated with gold for analysis by SEM via a Zeiss 540 Ultra FEG (field emission gun) SEM (Zeiss, Oberkochen, Germany) with energy dispersive X-ray spectroscopy (EDX) probe operated at 20 kV. Inductively coupled plasma optical emission spectroscopy (ICP-OES) method using a Perkin Elmer Optima 5300 instrument (Perkin Elmer, Springfield, IL, USA) was used in bulk alloy and slag analyses. The alloy carbon and sulphur content was analysed by the combustion method using a LECO CS 744 instrument (LECO, St Joseph, MO, USA).

3. Results

The base case sample did not form any significant metal within the reaction time, and at the low temperature of the muffle furnace (1350 °C), the crucible contents consisted of a loosely sintered mixture. The magnetic fraction of this sample is shown in Figure 1a. Figure 1b,c show that large alloy blobs were effectively separated from the slag in samples A and C, with some smaller metal droplets. It is seen that sample A formed one large alloy volume, and sample C formed multiple smaller alloy volumes. Thus, in sample A with added C and Al, and sample C with added C, Si, and Al, clear slag and alloy formation and separation were achieved.
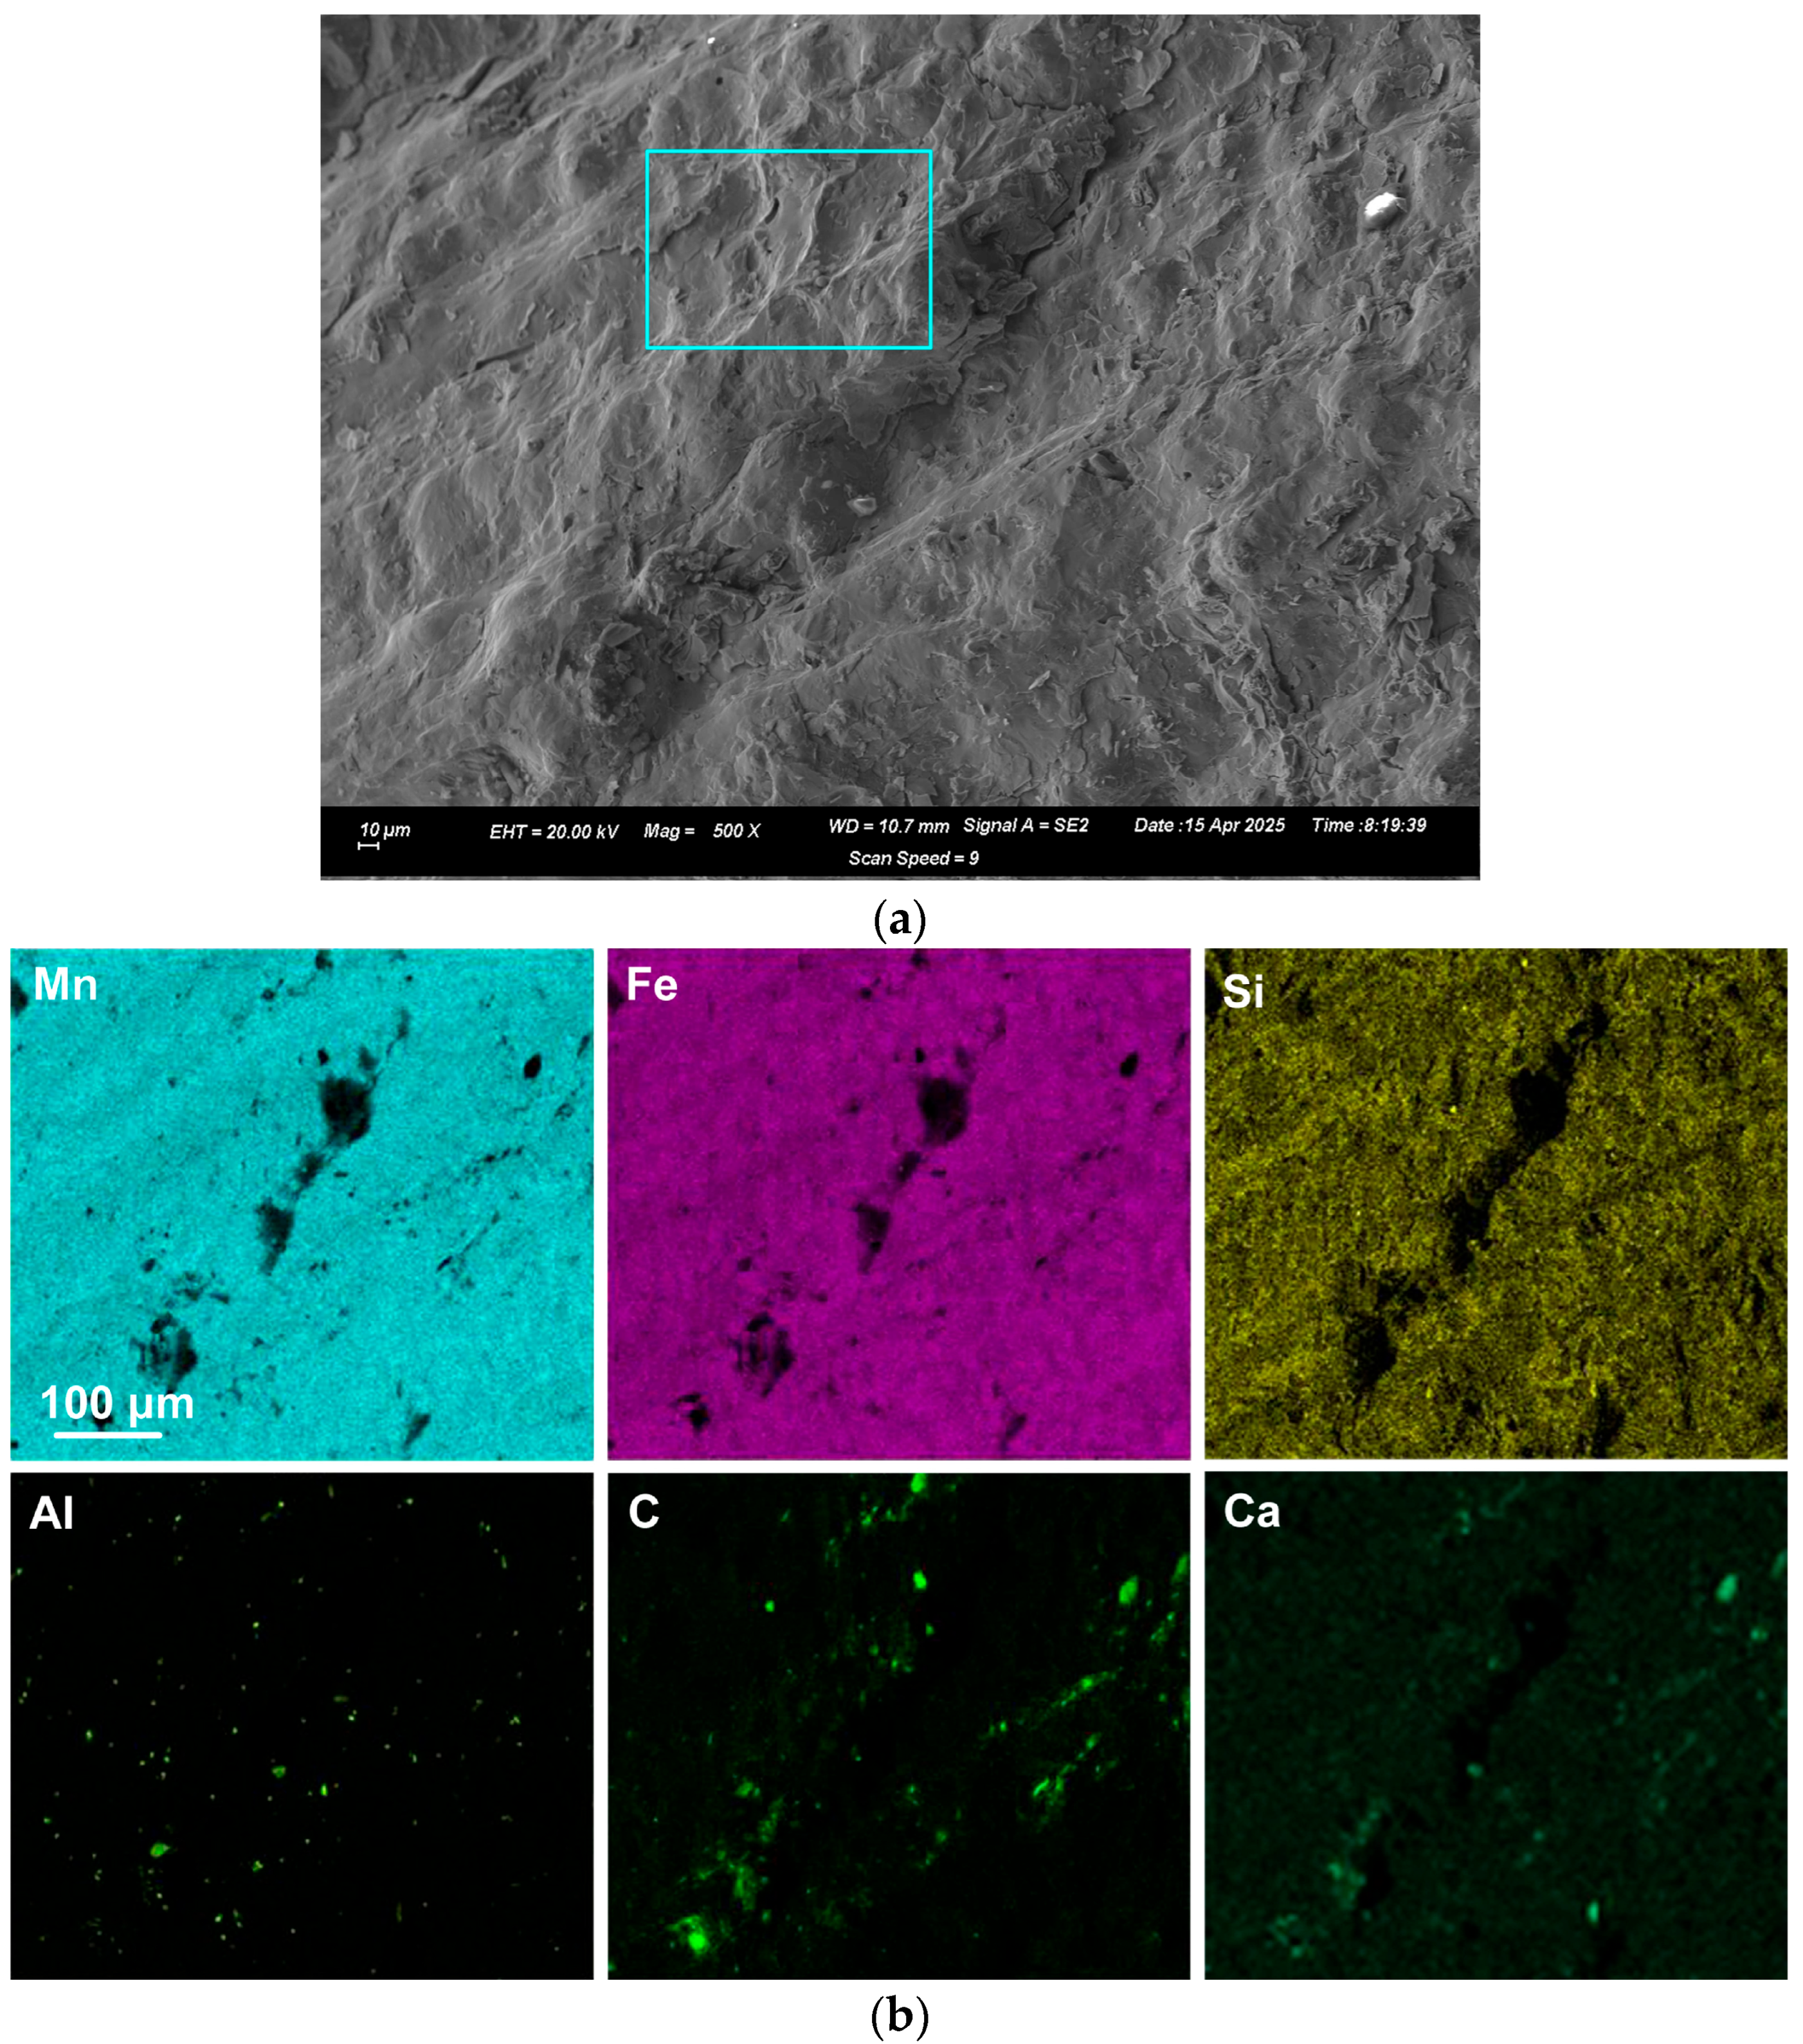
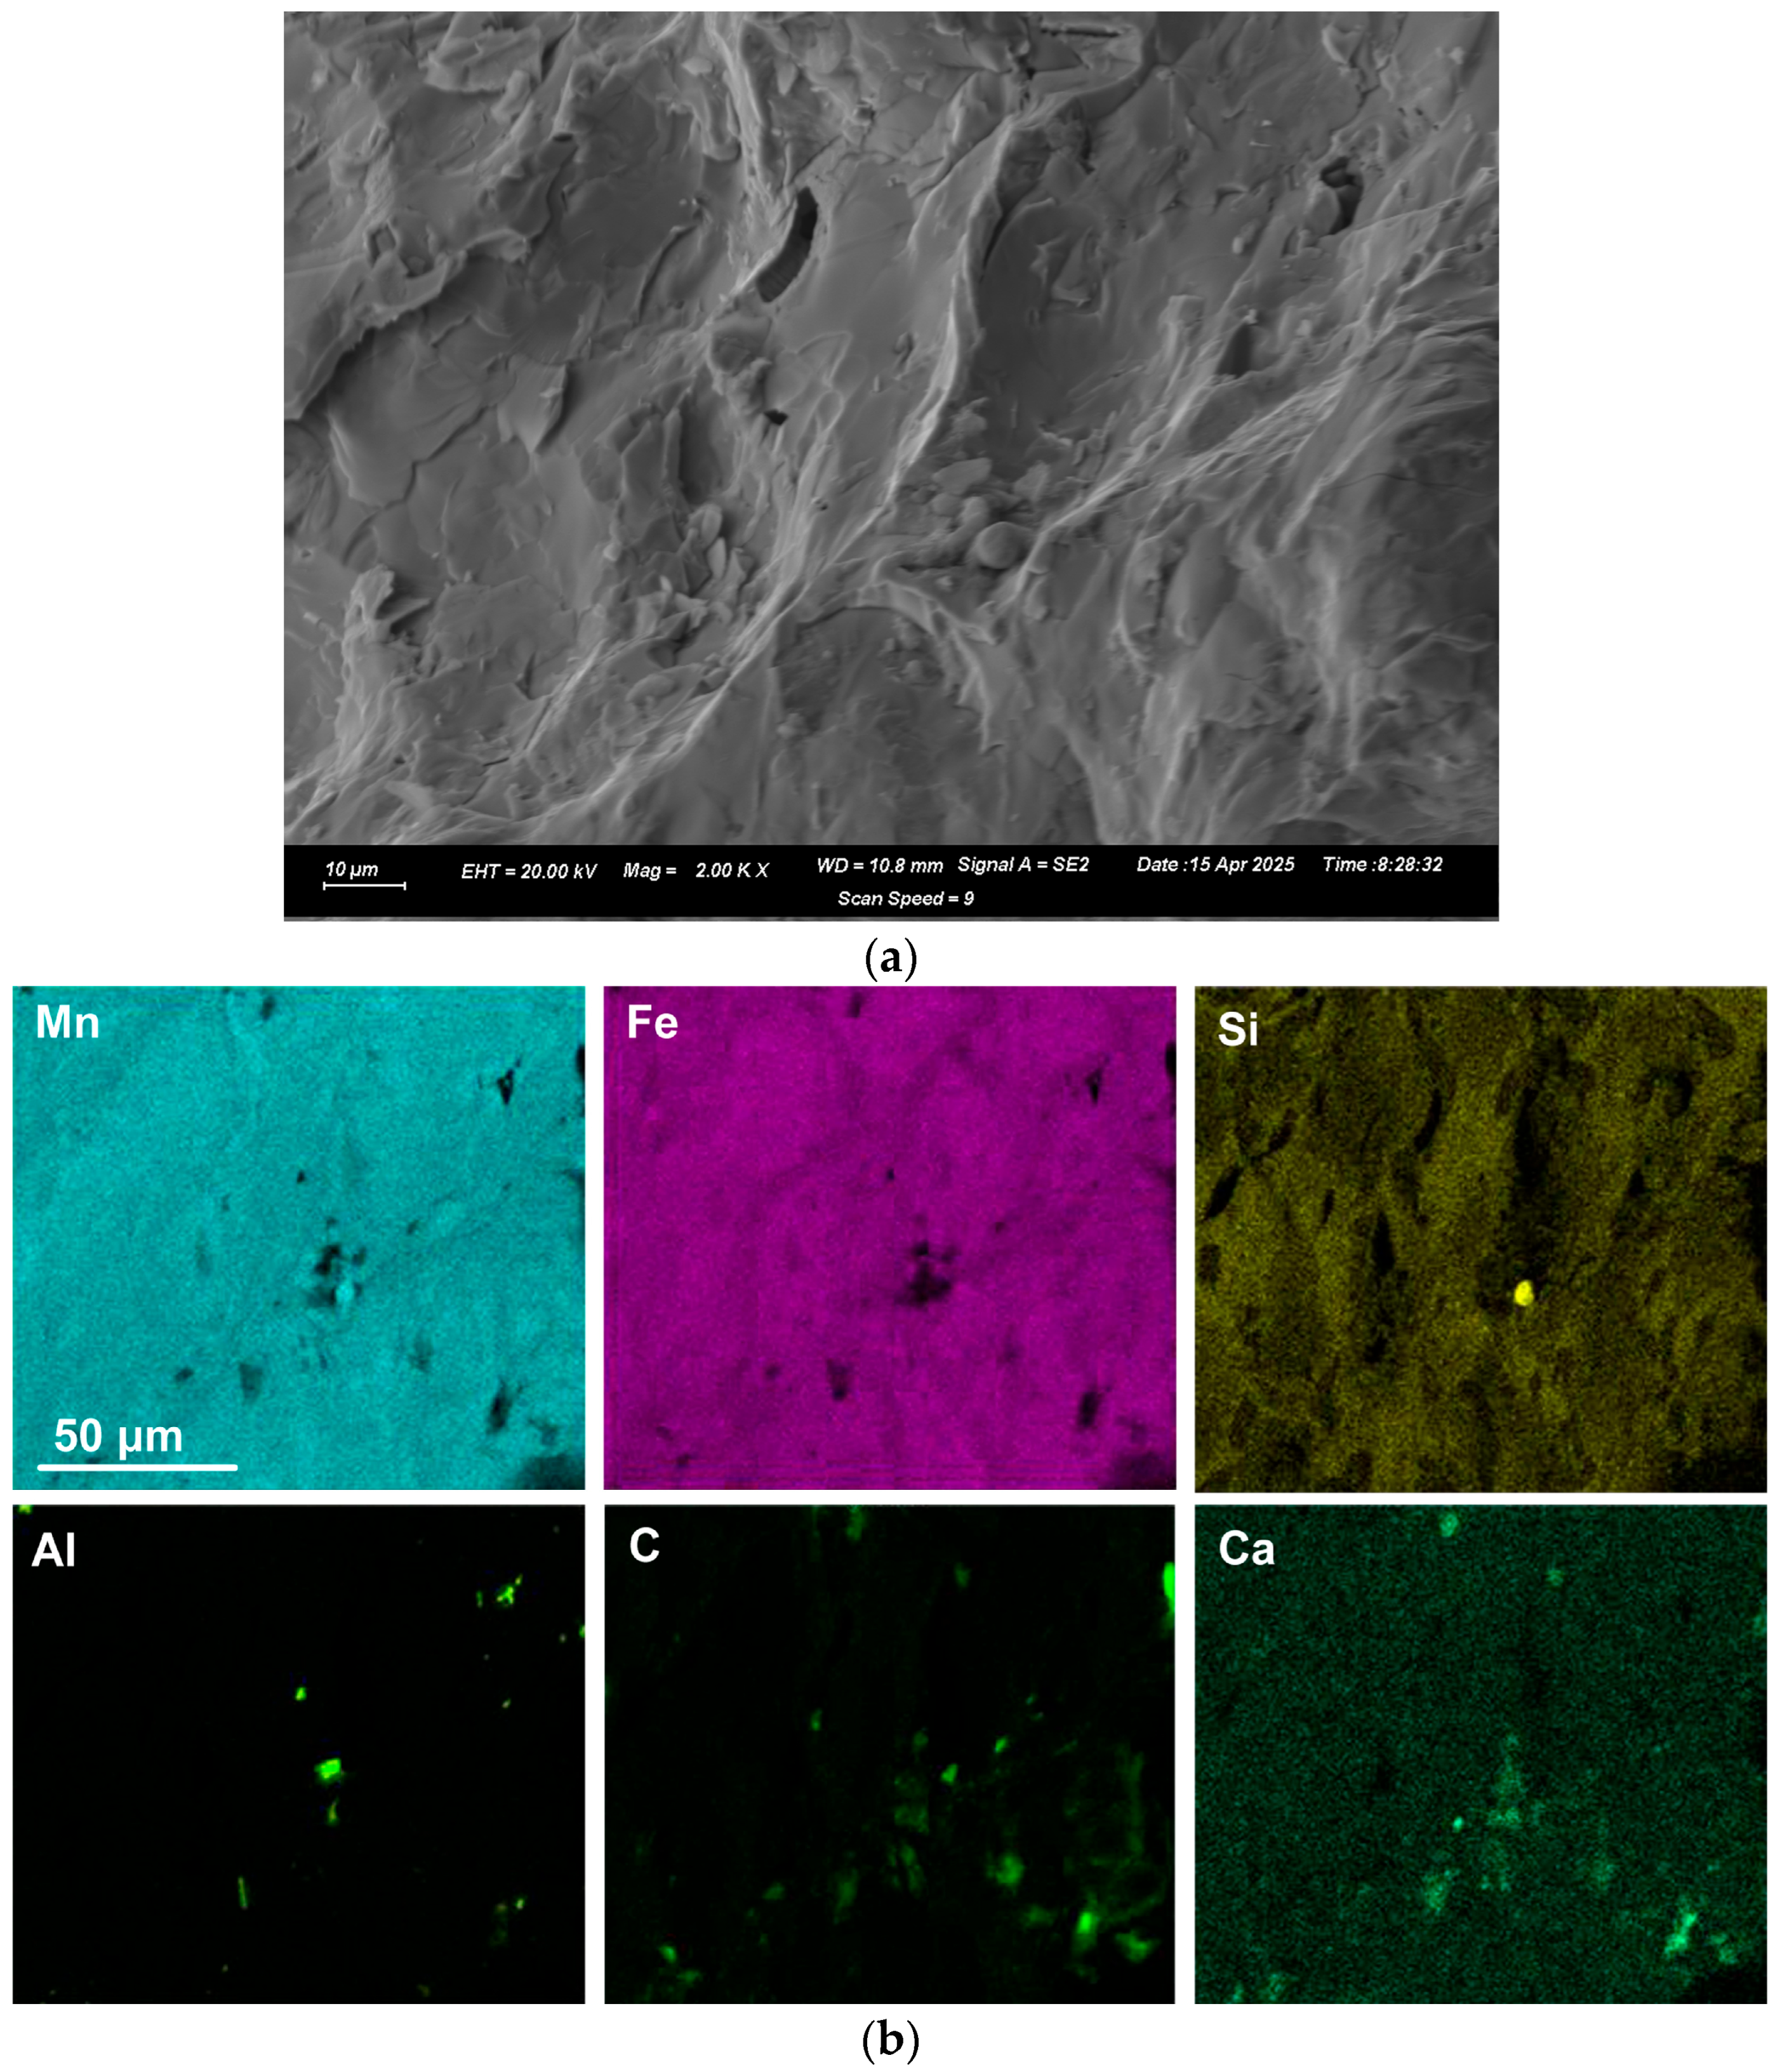
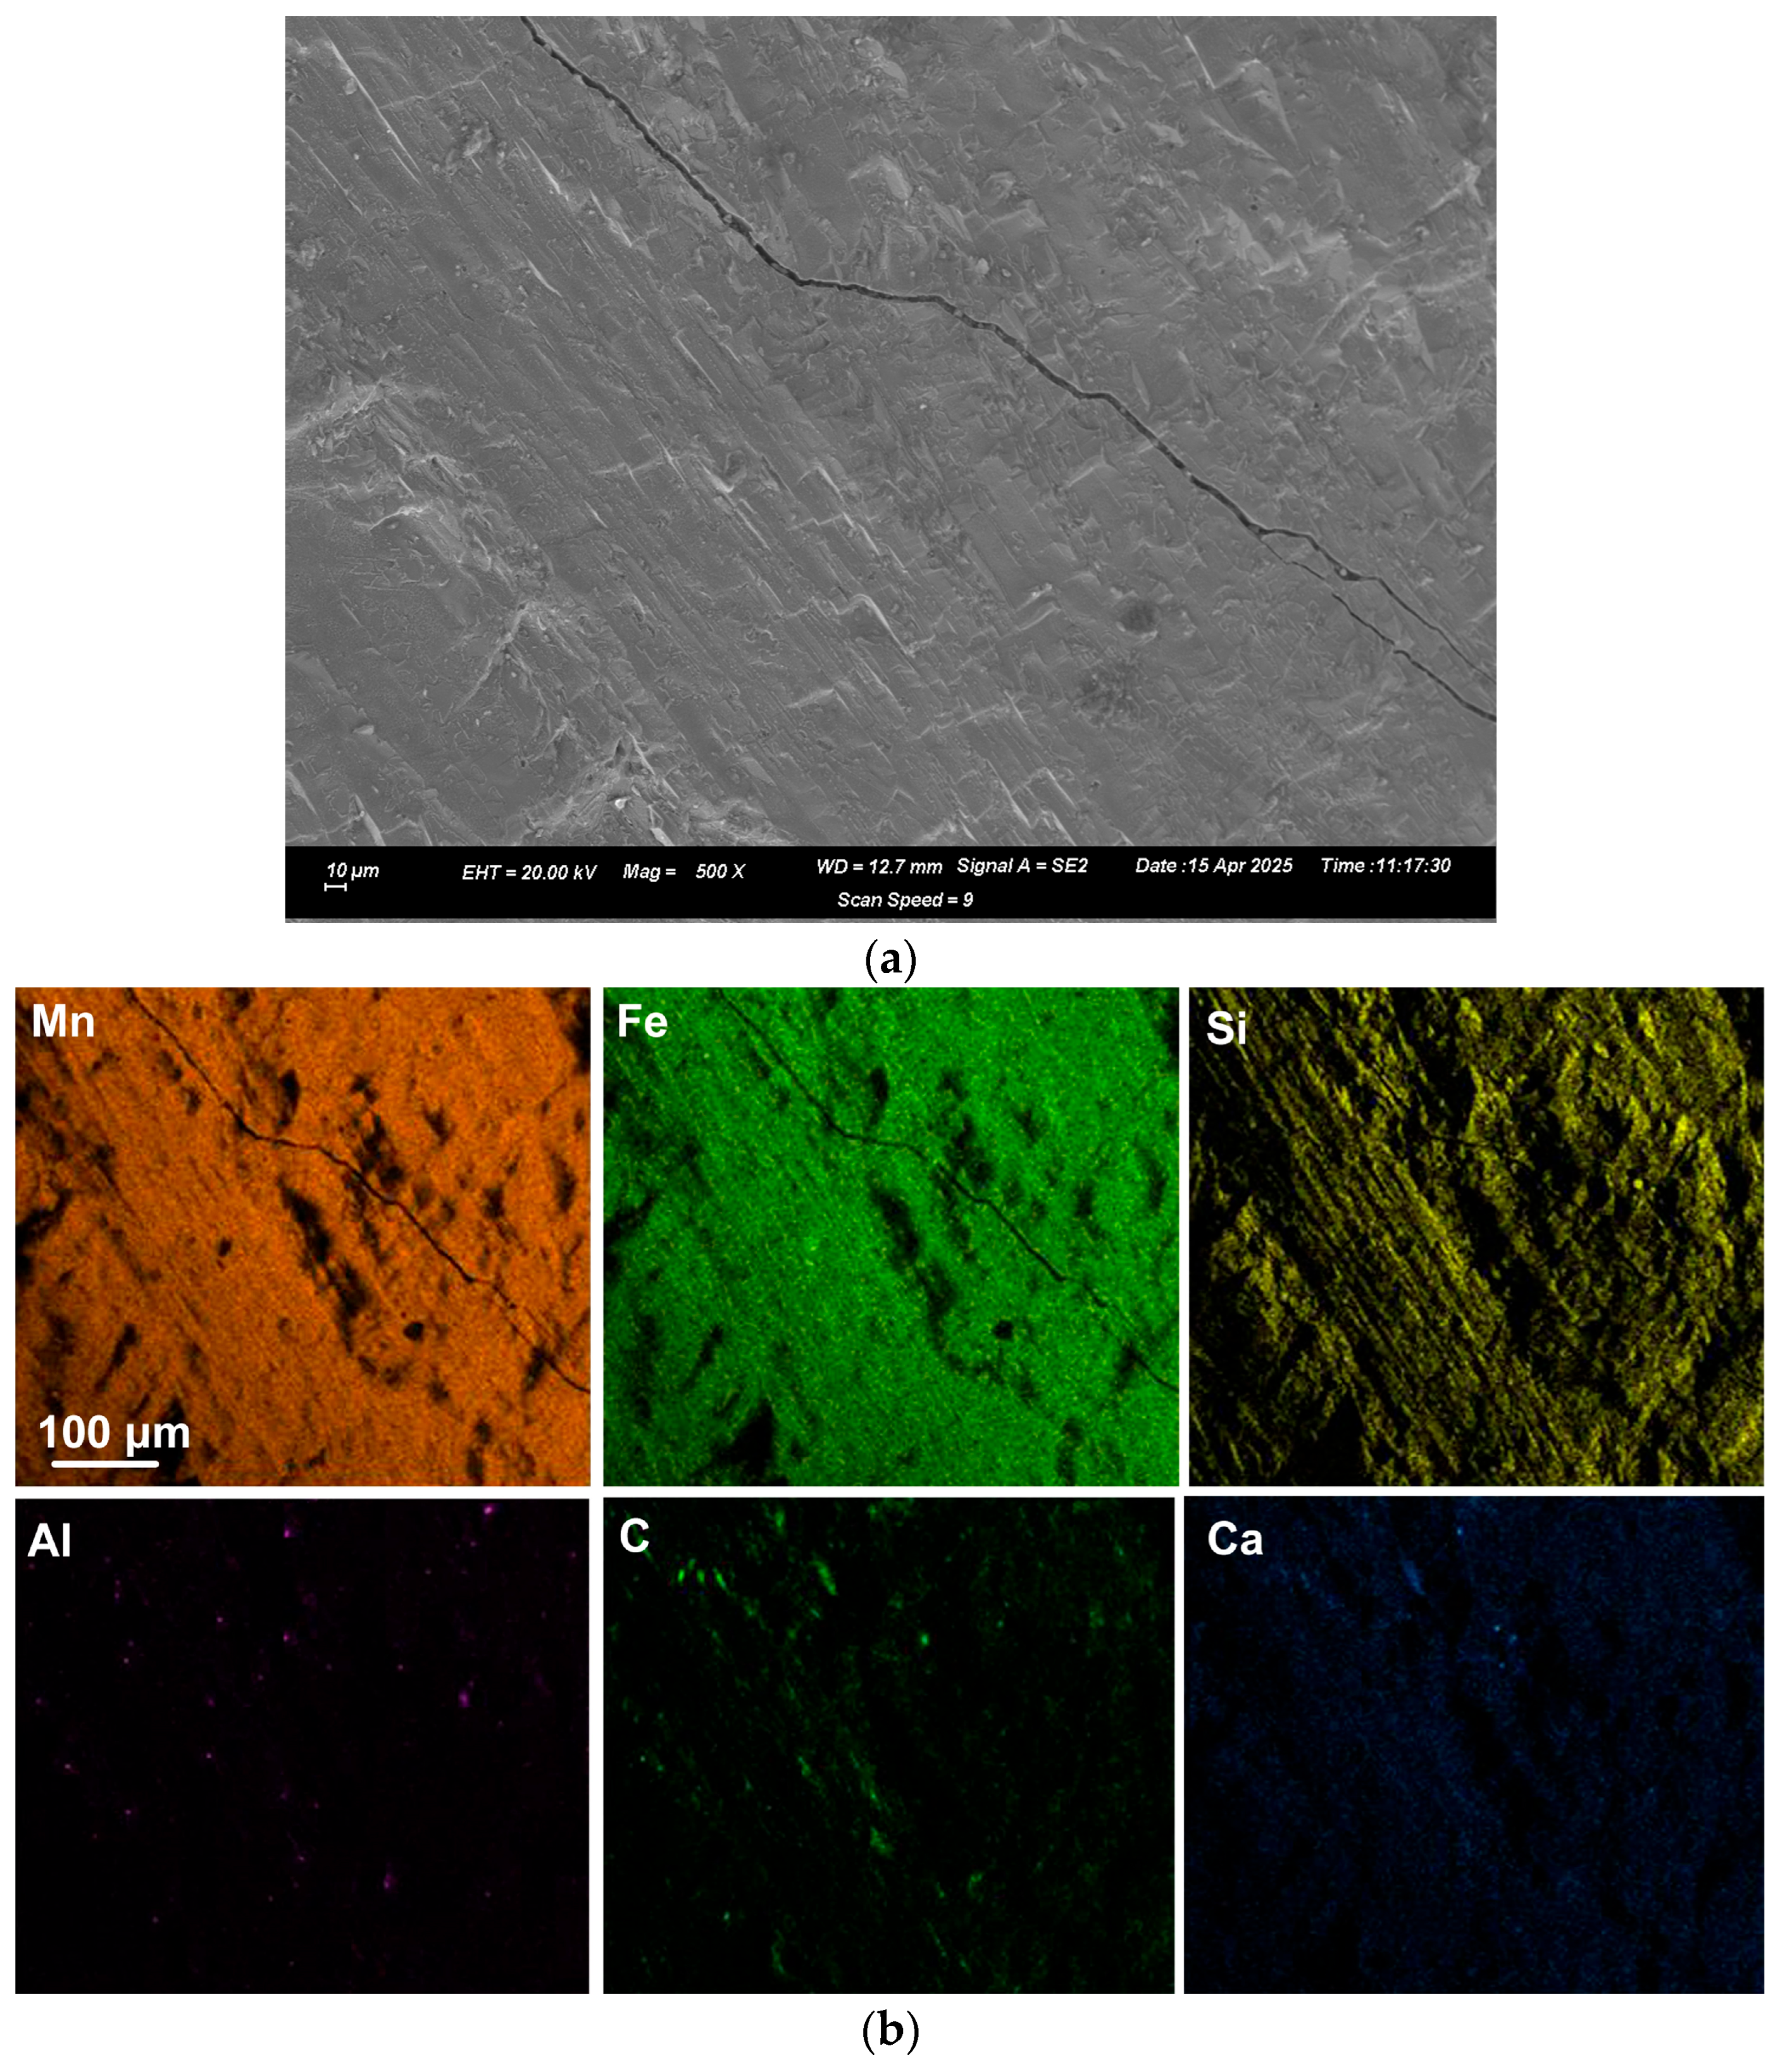
EDX was applied to measure the alloy composition from the fractured surface made through the large alloy volume. A typical analysis area consisted of 0.5 mm × 0.5 mm, as shown for samples A and C alloy in Figure 2, Figure 3 and Figure 4; the analysis of these areas is summarised in Table 4 and Table 5. The bulk alloy analyses are also presented in Table 4 and Table 5, particularly the %C, as it is not accurately analysed by SEM-EDX. The analyses per area in each sample are closely matched. The main difference is evident in the increased silicon content in some regions of sample C (areas 8–10), most likely due to the incorporation of Si metal powder into the bulk alloy volume. The element maps in Figure 2 and Figure 3 indicate that the alloy matrix primarily consists of a Mn–Fe–Si alloy, with Al, Ca, and C appearing as specks. The C appears as surface flakes rather than being dissolved into the alloy. This is better seen in Figure 2b at the higher magnification of 2000X. The element maps for sample C in Figure 4b appear similar to those for sample A in Figure 2 and Figure 3. The slight difference is that no V was analysed. Some S was also analysed as displayed in Table 5 and confirmed to be present in both sample A and sample C bulk alloy analyses at 0.03% S and 0.08% S, respectively. The bulk alloy %C decreased with increased %Si, with 3.5% C at 1.4% Si in sample A alloy and 2.2% C at 8.7% Si in sample C alloy. The low Al content in both alloys confirms that the aluminium content addition in Table 3 is close to optimal. Too little Al addition would cause insufficient reduction of the ore, and too much Al addition would cause a high alloy %Al.

4. Discussion

Aluminothermic reduction is a non-equilibrium process due to the rapid release of heat, resulting in a short reaction time and limited room for process control, as observed in most furnace-based processes. As explained in prior work, the feed material’s recipe chemistry and particle size largely determine the final product outcomes, which can easily reach 3000 °C in the reaction melt [12,14,15,19]. Thus, calculating the feed recipe is not as straightforward as in most furnace-based processes.

4.1. Alloy Composition

From the %Al, %Si and %C analyses of sample A and sample C alloys, it is already clear that equilibrium is not a precise guide of the gas–slag–metal process in aluminothermic reduction. The carbon saturation level for sample A alloy at 1550 °C is 6.5 %C, and for sample C alloy with a higher %Si, the carbon saturation level is 4.2 %C. Compared to the %C shown in Table 4 and Table 5, at 3.5 %C in sample A alloy and 2.2 %C in sample C alloy.
The EDX results in Figure 2, Figure 3 and Figure 4 indicate that the alloys consist of a single phase with no apparent regular second phase present. The phase–chemical composition of each alloy was calculated using Thermo-Calc 2023b thermochemical software with the SGTE Alloy 4.9 database [20]. The bulk alloy compositions in Table 4 for sample A and Table 5 for sample C served as the basis for the calculations. As shown in Figure 5a, the sample A alloy composition can form multiple solid phases below the solidus temperature of 1093 °C. The liquidus temperature is close to the solidus temperature, at 1171 °C. The importance of a low liquidus temperature and a narrow solidification temperature range is that the alloy separation time from the melt is longer, allowing the alloy composition to be set in a short period. The phase chemistry for sample C, shown in Figure 5b, indicates fewer phases below the solidus temperature. Sample C has a lower solidus temperature of 975 °C and a liquidus temperature of 1099 °C, due to its higher silicon content of 8.7%, compared to only 1.4% Si in Sample A.
Although C was added in the form of coal, and ample C is available from contact with the graphite crucible, the take-up of carbon in the alloy is limited. The addition of coal as a reductant is intended to facilitate rapid pre-reduction to the MnO level, as previous studies have highlighted the need for pre-roasting MnO2 ore to lower oxides and limit excessive heat release [11]. The synergistic effect of Si, acting both as a reductant and influencing alloy carbon uptake, is evident from the reduction work performed by Si and the expected decrease in carbon uptake in the Fe–Mn alloy with increased Si content [2]. This effect is shown in Figure 6a,b for the Mn-Si-C system at 1250 °C and 1450 °C. It is seen that for the phase boundary of liquid and graphite, the carbon saturation level of the liquid phase decreases with an increase in %Si. For example, in Figure 6a, the phase boundary of liquid and graphite coordinates varies from 5.2% C at 8.7% Si to 3.4% C at 13.4% Si. This effect is shown more clearly in Figure 6b when fewer solid phases are stable.
Recent work has shown that the contact time with the carbon crucible can be adjusted to vary the carbon content to some extent in steel production via aluminothermy, so preventing saturation of the steel with C at the reaction temperature [14]. Additionally, when using a non-carbon crucible in the carbothermic reduction of manganese ore, the alloy carbon content can be limited by controlling the feed mixture formulation and the slag-ore reaction layer [21,22].

4.2. Slag Composition

The target slag composition was selected to maintain a low liquidus temperature in the slag, even as a high level of Al2O3 uptake appears from the aluminothermic reduction reactions, such as reaction (1). Comparison of the average SEM slag analyses to the target slag analysis in Table 6 shows some differences from the expected composition. Comparison of the slag A composition to the target slag composition reveals lower percentages of CaO, Na2O, and SiO2, and higher levels of Al2O3 and MnO than expected. The differences may be due to some volatilisation of Na2O, some reduction of SiO2 and lesser reduction of MnO. Comparison of the slag C to the aim of slag composition also indicates lower percentages of Na2O and CaO, as well as significantly lower percentages of MnO at 7%. This is partly due to the dilution of the slag with SiO2 formed through silicothermic reduction using the added Si metal reductant.
3(MnO) + 2(Al) = <Al2O3> + 3(Mn)
< > = solid; ( ) = liquid
Despite the silicothermic reduction via Si, more Si was added to the alloy at 9% Si, as compared to the sample A alloy at 1% Si. Complex simultaneous reactions in the reaction system make pre-calculation of the alloy composition difficult, as the process is not an equilibrium process [14]. Therefore, the assumptions used in setting the target slag composition calculation are estimates, as is clear from the slag compositions in Table 6. The higher %Al2O3 content compared to the target slag %Al2O3 may indicate a preferential use of Al as a reductant, rather than C and Si.
In addition, the bulk chemical analyses of the product slags are displayed in Table 6. Reduction of iron oxides to metallic iron is expected to be complete. Therefore, the iron in the bulk analyses in Table 6 is considered to be due to alloy entrapment in the slag. The bulk slag analyses were corrected in terms of %MnO, %SiO2, and %Al2O3 by subtracting the entrained alloy Mn, Si, and Al from the bulk slag analyses, and are labelled as “corrected” in Table 6. The total alloy yield consists of the weighed alloy mass and the slag-entrapped alloy mass, divided by the mass of Mn, Fe, and Si metal in the feed. The values are summarised in Table 7. It is observed that the yield of sample A alloy is 43%, compared to a yield of 56% for sample C alloy. These numbers are lower than the metal yield numbers of 58–64% reported for 10 kg of pre-roasted ore in the feed material mixture, as may be expected, since a larger volume of reacted material typically yields increased process efficiencies [11]. The element accounting percentages in Table 8 indicate a good accounting of Fe, with some loss of Mn, Si, and Al to the gas due to volatilisation of metals at the high reaction temperatures expected in thermic reduction. This effect may be countered by applying industrial methods, such as using a reaction chamber hood with a positive off-gas pressure to counter volatilisation and capture fumes for recycling [6].
The viscosities and phase chemistries of the slags were calculated using FactSage 7.3 thermochemical software, which utilised the FToxid database, as discussed in the following section. Based on the alloy yield values in Table 7, the addition of Si metal as a reductant aids overall alloy formation. However, a proportionally greater amount of alloy appears to be trapped in the slag. Figure 7 shows the calculated viscosity values of the slags at temperatures ranging from 1650 °C to 1900 °C. The slag liquidus temperatures are as follows: target slag at 1373 °C, slag A at 1652 °C, and slag C at 1530 °C. The higher SiO2 containing slag in sample C is more viscous than the target slag and the sample A slag. This difference can account for the higher fraction of entrapped alloy in slag C. However, the viscosity values below 3 Poise should be all tappable slags in an industrial setting [23].
Since the precise target slag chemistry was not achieved in the product slag, the phase chemistry should be adjusted by increasing the Na2O flux to transform the high Al2O3 content of the slag into the desired compound, NaAlO2. The cooling curve of the target slag is shown in Figure 8a. It is seen that the slag liquidus temperature is 1373 °C and the slag solidus is much lower at 1010 °C, providing ample time for the alloy to separate from the slag upon cooling. It is observed that the desired leachable NaAlO2 compound is expected to form upon cooling, although only up to a maximum of 37%. However, after tapping the slag from the aluminothermic reaction vessel, the slag can still be conditioned by adding more Na2O to convert more Al2O3 to NaAlO2. This effect is illustrated in Figure 8b for a mass of 20 kg of Na2O.SiO2 addition/100 kg slag, the proportion of NaAlO2 is increased to 60% at the slag solidus temperature of 978 °C.
In conclusion, the results demonstrate that the sodium-oxide slag formulation used in the aluminothermic reduction of manganese ore offers an alternative, sustainable processing option for the circular economy. A lower %C containing ferro-manganese alloy can be produced in this way at less than the HCFeMn but higher than the MCFeMn carbon level. The addition of Al and Si in the alloy product may be beneficial, as the alloy can be considered a complex alloy for steelmaking alloying additions [5,6].

5. Conclusions

The alternative sustainable metallurgy processing route of sodium silicate fluxed aluminothermic reduction of manganese ore is illustrated with good slag–alloy separation. The Na2O fluxed formulation enables the formation of a water-soluble NaAlO2 compound, allowing for the recycling of Al2O3 through hydrometallurgy processing in the Bayer process. This process produces Al(OH)3 feed for the Hall–Héroult electrochemical process, which is used to produce aluminium. In this way, CO2 emissions are minimal if electricity input is sourced from non-fossil fuel energy sources. The addition of a small quantity of coal as a reductant facilitates rapid pre-reduction to the MnO level, thereby eliminating the need for an extra step of pre-roasting the MnO2 ore. Analyses of the separated bulk alloy show compositions of 66% Mn, 22–28% Fe, 2–9% Si, 0.4–1.4% Al, and 2.2–3.5% C. This complex alloy can be used as a steelmaking alloy addition.

Author Contributions

F.D.B. conceptualised the work; F.D.B. and T.C. executed the experiments together, interpreted the data together, and prepared the manuscript together. All authors have read and agreed to the published version of the manuscript.

Funding

This research was funded in part by the University of Pretoria.

Data Availability Statement

The data sets presented in this study are available upon reasonable request to the corresponding author, as indicated on the first page.

Acknowledgments

The authors are grateful to Coenraad Snyman at the Laboratory for Microscopy and Microanalysis at the University of Pretoria for his advice and assistance on SEM imaging and analysis in this work.

Conflicts of Interest

The authors declare no conflicts of interest. The funders had no role in the design of the study; in the collection, analysis, or interpretation of data; in the writing of the manuscript, or in the decision to publish the results.

Abbreviations

The following abbreviations are used in this manuscript:
HCFeMnHigh-carbon ferromanganese
MCFeMnMedium-carbon ferromanganese
LCFeMnLow-carbon ferromanganese
TRIPTransformation-induced plasticity
TWIPTwinning-induced plasticity
AMSAluminium–silicon–manganese
FMAFerromanganese–aluminium
FAMSFerrosiliconmanganese–aluminium
PIDProportional-integral-derivative
SEM Scanning electron microscope
EDXEnergy dispersive X-ray spectroscopy
ICP-OESInductively coupled plasma optical emission spectroscopy

References

  1. Andrusev, M.M. 150 Years since the birth of the eminent Russian physical chemist and metallurgist N.N. Beketov. Metallurgist 1977, 21, 416–418. [Google Scholar] [CrossRef]
  2. Habashi, F. (Ed.) Handbook of Extractive Metallurgy; Wiley-VCH: Weinheim, Germany, 1997; Volume 1, pp. 420–451. [Google Scholar]
  3. ASTM A99-03(2014); Standard Specification for Ferromanganese. ASTM International: West Conshohocken, PA, USA, 2014.
  4. Safarian, J.; Kolbeinsen, L. Purity requirements for Mn-alloys for producing high manganese TRIP and TWIP steels. In Proceedings of the Thirteenth International Ferroalloys Congress (INFACON XIII), Almaty, Kazakhstan, 9–13 June 2013. [Google Scholar]
  5. Zhuniskaliyev, T.; Nurumgaliyev, A.; Chekimbayev, A.; Kelamanov, B.; Kuatbay, Y.; Mukhambetgaliyev, Y.; Mukhambetkaliyev, A.; Abdirashit, A. Experimental Investigation of the Influence of Phase Compounds on the Friability of Fe-Si-Mn-Al Complex Alloy. Metals 2024, 14, 1091. [Google Scholar] [CrossRef]
  6. Gasik, M. Handbook of Ferroalloys; Butterworth-Heinemann: Oxford, UK, 2013; pp. 495–499. [Google Scholar]
  7. Kudyba, A.; Akhtar, S.; Johansen, I.; Safarian, J. Aluminothermic Reduction of Manganese Oxide from Selected MnO-Containing Slags. Materials 2021, 14, 356. [Google Scholar] [CrossRef]
  8. Kudyba, A.; Safarian, J. Manganese and Aluminium Recovery from Ferromanganese Slag and Al White Dross by a High Temperature Smelting-Reduction Process. Materials 2022, 15, 405. [Google Scholar] [CrossRef]
  9. Philipson, H.; Wallin, M.; Einarsrud, K.E.; Tranell, G. Kinetics of silicon production by aluminothermic reduction of silica using aluminum and aluminum dross as reductants. In Proceedings of the 16th International Ferro-Alloys Congress (INFACON XVI), Virtual, 27–29 September 2021; NTNU: Trondheim, Norway, 2021. [Google Scholar]
  10. Tranell, G.; Safarian, J.; Wallin, M. SisAl—A New Process for Production of Silicon. In Silicon for the Chemical and Solar Industry XV; NTNU: Trondheim, Norway, 2020; pp. 129–139. ISBN 978-82-997357-9-7. [Google Scholar]
  11. Bhoi, B.; Murthy, B.V.R.; Datta, P.; Rajeev; Jouhari, A.K. Studies on Aluminothermic Reduction of Manganese ore for Ferro Manganese Making. In Ferro Alloy Industries in the Liberalised Economy; Vatsh, A.K., Singh, S.D., Goswami, N.G., Ramachandrarao, P., Eds.; NML: Jainshedpur, India, 1997; pp. 66–70. [Google Scholar]
  12. Sarangi, B.; Sarangi, A.; Ray, H.S. Kinetics of aluminothermic reduction of MnO2 and Fe2O3: A thermoanalytical investigation. ISIJ Int. 1996, 36, 1135–1141. [Google Scholar] [CrossRef]
  13. Sparis, D.; Lazou, A.; Balomenos, E.; Panias, D. Thermodynamics of Aluminothermic Processes for Ferrotitanium Alloy Production from Bauxite Residue and Ilmenite. Metals 2024, 14, 200. [Google Scholar] [CrossRef]
  14. Barsukova, N.V.; Komarov, O.N.; Zhilin, S.G.; Predein, V.V.; Popov, A.V.; Khudyakova, V.A. Control of Properties of Iron-Carbon Alloys Produced by Aluminothermy by Varying Technological Factors. Metallurgist 2023, 67, 1192–1207. [Google Scholar] [CrossRef]
  15. Song, J.; Guo, T.; Dine, W.; Yang, L.; Zhang, X.; Yu, Z.; Wu, J.; Zhang, J.; Fang, X. The effect of Al particle size on the thermal behvior and kinetics of Al- MnO2 thermite system. Adv. Mater. Sci. Eng. 2020, 2020, 3097404. [Google Scholar] [CrossRef]
  16. Salas Avilés, J.A.; Flores Valdés, A.; Torres Torres, J.; Ochoa Palacios, R.M.; Flores Saldívar, A.A. A Kinetic Study on the Preparation of Al-Mn Alloys by Aluminothermic Reduction of Mn3O4 and MnO Powders. Metals 2023, 13, 1556. [Google Scholar] [CrossRef]
  17. Azof, F.I.; Safarian, J. Leaching kinetics and mechanism of slag produced from smelting-reduction of bauxite for alumina recovery. Hydrometallurgy 2020, 195, 105388. [Google Scholar] [CrossRef]
  18. Pilla, G.; Hertel, T.; Pontikes, Y. Toward and integrated and sustainable Bauxite residue valorization, employing H2 reduction roasting, carbonation, and bio-carbon smelting. J. Sustain. Metall. 2025, 11, 1745–1765. [Google Scholar] [CrossRef]
  19. Branzei, M.; Cojocaru, M.O.; Coman, T.A.; Vascan, O. A model of optimization and control the thermite kit for aluminothermic welding. Solid State Phenom. 2016, 254, 83–90. [Google Scholar] [CrossRef]
  20. Andersson, J.-O.; Helander, T.; Höglund, L.; Shi, P.; Sundman, B. Thermo-Calc & DICTRA, computational tools for materials science. Calphad 2002, 26, 273–312. [Google Scholar] [CrossRef]
  21. Coetsee, T. A review of ore smelting in high carbon ferromanganese production. Miner. Process Extr. Metall. Rev. 2020, 41, 255–278. [Google Scholar] [CrossRef]
  22. Coetsee, T. The effect of processing parameters on ferromanganese alloy carbon content in Mamatwan ore reduction. Miner. Process Extr. Metall. Rev. 2017, 38, 116–125. [Google Scholar] [CrossRef]
  23. Ely, F.G.; Barnhart, D.H. Coal Ash-Its effect on boiler availability. In Chemistry of Coal Utilization Supplementary Volume; John Wiley & Sons: New York, NY, USA, 1963; pp. 820–837. [Google Scholar]
  24. Bale, C.W.; Bélisle, E.; Chartrand, P.; Decterov, S.A.; Eriksson, G.; Gheribi, A.E.; Hack, K.; Jung, I.-H.; Kang, Y.-B.; Melançon, J.; et al. Reprint of: FactSage thermochemical software and databases, 2010–2016. Calphad 2016, 55, 1–19. [Google Scholar] [CrossRef]
Figure 1. (a) Photographs of magnetic fraction from Sample BC; (b) easily separated alloy from Sample A; (c) easily separated alloy from Sample C.
Reactions 06 00040 g001
Figure 2. (a): SEM image (×500) of analysed area (number 4) in Sample A; (b): EDX map of area in (a).
Reactions 06 00040 g002
Figure 3. (a): SEM image (×2000) of blocked area in Sample A as marked in Figure 2a; (b): EDX map of area in (a).
Reactions 06 00040 g003
Figure 4. (a): SEM image (×500) of analysed area (number 6) in Sample C; (b): EDX map of area in (a).
Reactions 06 00040 g004
Figure 5. Phase chemistry of alloy: (a) Sample A alloy; (b) Sample C alloy: Calculated in Thermo-Calc [20].
Reactions 06 00040 g005
Figure 6. (a) Mn-Si-C Phase chemistry at 1250 °C: Calculated in Thermo-Calc [20]; (b) Mn-Si-C Phase chemistry at 1450 °C: Calculated in Thermo-Calc [20].
Reactions 06 00040 g006
Figure 7. Slag viscosity calculated in FactSage [24].
Reactions 06 00040 g007
Figure 8. (a) Target slag phase chemistry calculated in FactSage [24]; (b) possible post-tap modified slag phase chemistry calculated in FactSage [24].
Reactions 06 00040 g008
Table 1. Ferromanganese alloy compositions (mass%); n.s. = not specified [3,5,6].
%Mn%Si%C%P %S%Al
HCFeMn (A)78–82<1.2 <7.5<0.35<0.02n.s.
MCFeMn (A)80–85<1.5<1.5<0.30<0.02n.s.
LCFeMn (B)80–855.0–7.0<0.75<0.30<0.02n.s.
AMS60–705–150.4–2.0<0.05n.s.8–20
FMA40–80<2.5<1.5<0.3<0.0312–16
FAMS22–2410–151–2<0.06n.s.10–14
Table 2. Bulk chemical composition of manganese ore and coal ash (mass%).
%FeO%MnO%Cr2O3%V2O5%TiO2%CaO%K2O%P2O5%SiO2%Al2O3%MgO%Na2O%BaO
Ore10.7061.590.030.040.050.230.210.015.432.610.110.001.85
Ash1.510.020.050.052.162.460.511.1951.4439.350.680.300.27
Table 3. Reaction mixtures (grams).
OreCoalNa2O.SiO2CaOAlSi
Base case (BC)10027201500
A100102015300
C1001020153010
Table 4. EDS analyses of Sample A alloy (mass%); n.a. = not available; n.d. = not detected.
Area%Al%Si%Mn%Fe%Ca%V%S%C
10.62.469.426.90.10.60.0n.a.
20.02.268.828.30.20.60.0n.a.
31.62.368.227.00.20.60.0n.a.
40.82.168.128.30.10.60.0n.a.
51.41.867.528.60.20.60.0n.a.
Average0.92.268.427.80.20.60.0n.a.
Maximum σ0.010.010.060.030.000.01n.d.
Bulk Alloy0.41.466.128.00.050.400.033.5
Table 5. EDS analyses of Sample C alloy (mass%); n.a. = not available.
Area%Al%Si%Mn%Fe%Ca%S%C
60.92.771.923.80.20.0n.a.
71.13.071.423.70.40.0n.a.
81.05.569.123.30.20.2n.a.
91.16.867.923.00.20.3n.a.
100.87.268.022.70.10.4n.a.
Average1.05.069.723.30.20.2n.a.
Maximum σ0.010.010.080.040.010.01
Bulk Alloy1.48.765.821.80.0070.082.2
Table 6. Target vs. test slag analyses (mass%).
%Al2O3%SiO2%MnO%FeO%CaO%Na2O%BaOB2 = %CaO/%SiO2
Target slag3917140.0171121.0
Slag A: EDX54.59.120.00.08.05.52.80.9
Slag A: bulk53.212.327.62.47.14.61.50.6
Slag A: Corrected52.111.922.70.07.04.51.50.6
Slag C: EDX52.418.76.50.112.67.52.30.7
Slag C: bulk45.723.626.94.18.05.61.20.3
Slag C: Corrected49.021.912.60.08.76.11.30.4
Table 7. Mass balance numbers.
Gram Weighed Alloy Gram Mn in Weighed AlloyGram Fe in Weighed Alloy Gram Weighed SlagGram Fe in SlagGram Alloy in SlagGram Mn in OreGram Fe in OreGram Mn + Fe + Si in Feed %Alloy Yield
Sample A18.712.45.379.11.55.347.78.356.043
Sample C19.212.64.2121.83.918.047.78.366.056
Table 8. Mass accounting of main elements (per cent).
%Fe %Mn%Si%Al
Sample A81675862
Sample C97747377
Disclaimer/Publisher’s Note: The statements, opinions and data contained in all publications are solely those of the individual author(s) and contributor(s) and not of MDPI and/or the editor(s). MDPI and/or the editor(s) disclaim responsibility for any injury to people or property resulting from any ideas, methods, instructions or products referred to in the content.

