Abstract
The monitoring of perennial and annual crops requires different analytical approaches due to their contrasting phenological dynamics and management practices. This study investigates the temporal behavior of the Normalized Difference Vegetation Index (NDVI) derived from Harmonized Landsat and Sentinel-2 (HLS) imagery to characterize apple, grape, soybean, and maize crops in Vacaria, Southern Brazil, between January 2024 and April 2025. NDVI time series were extracted from cloud-free HLS observations and analyzed using raw, interpolated, and Savitzky–Golay, smoothed data, supported by field reference points collected with the AgroTag application. Distinct NDVI temporal patterns were observed, with apple and grape showing higher stability and soybean and maize exhibiting stronger seasonal variability. Descriptive statistics derived from 112 observation dates confirmed these differences, highlighting the ability of HLS-based NDVI time series to capture crop-specific phenological patterns at the municipal scale. Complementary analysis using the SATVeg platform demonstrated consistency in long-term vegetation trends while evidencing scale limitations of coarse-resolution data for small perennial plots. Overall, the findings demonstrate that the NDVI enables robust monitoring of mixed agricultural landscapes, with complementary spatial resolutions and analytical tools enhancing crop-specific phenological analysis.
1. Introduction
Perennial and annual crops represent some of the productive elements within agricultural systems and require distinct analytical approaches due to their contrasting phenological dynamics. Perennial crops, such as apple and grape, remain in the field for multiple years and exhibit more stable vegetative patterns [1]. In contrast, annual crops like soybean and maize follow seasonal cycles, often requiring planting and harvesting within a single year [2]. Monitoring these systems is crucial to understanding crop development, productivity, and overall land use dynamics, especially in regions with diversified agricultural landscapes. The growing demand for more efficient food production reinforces the need to monitor both crop types accurately throughout the growing season.
Despite the widespread use of satellite data for crop monitoring, challenges remain in regions where perennial and annual crops coexist. Differences in phenological dynamics and management practices complicate direct comparisons, and applied studies integrating Harmonized Landsat and Sentinel-2 (HLS) time series with digital agriculture tools to compare these crop types at the municipal scale are still limited.
In this context, Vacaria, in Rio Grande do Sul, Southern Brazil, was selected as the study area due to its significant production of both fruit and grain crops. The region plays an important role in the national supply of apples and grapes, while also contributing to the cultivation of soybean and maize [3]. The mix of perennial and annual crops presents a unique monitoring challenge, particularly due to the differences in growth cycles, canopy structure, and management practices. Vacaria is one of the ten study districts of the Semear Digital project, led by Embrapa [4,5], which fosters the adoption of digital agriculture technologies to improve sustainability and productivity in Brazilian farming, with special attention to facilitating the participation of small and medium-sized producers in this technological advancement.
Remote sensing has become an essential tool for agricultural assessment, enabling the monitoring of crop phenology, health, and productivity across time and space [6,7,8]. Among the available satellite products, Harmonized Landsat and Sentinel-2 (HLS) imagery [9] stands out for combining high temporal resolution with moderate spatial detail, resulting from the harmonization of multisensor observations and making it suitable for monitoring heterogeneous agricultural areas. This harmonized dataset enhances the availability of cloud-free observations, facilitating consistent time series analysis in agricultural settings. In regions with frequent cloud cover, such as southern Brazil, this increased revisit frequency is especially advantageous for capturing critical phenological stages of annual crops.
One of the most widely used tools in remote sensing for vegetation monitoring is the Normalized Difference Vegetation Index (NDVI), which provides insight into the vigor and density of vegetation [10]. The NDVI is particularly useful for distinguishing crop types, monitoring growth stages, and identifying stress or degradation [11]. When applied to time series data, the NDVI allows for the characterization of seasonal dynamics and comparisons between different crop types [12]. Despite the growing availability of alternative vegetation indices and advanced analytical methods, the NDVI remains the most widely applied indicator across a broad range of crops and environmental conditions [13,14,15,16]. The NDVI has a strong correlation with vegetation biophysical properties, and historical consistency across sensors ensures its continued relevance for monitoring agricultural systems. In mixed agricultural regions such as Vacaria, NDVI time series analysis offers valuable insights into the phenological behavior of both perennial and annual crops.
Therefore, this study aims to evaluate the complementary roles of harmonized multisensor satellite imagery, field-based observations, and digital agriculture tools for monitoring perennial and annual crops in a diversified agricultural system. NDVI time series derived from HLS imagery were analyzed for apple, grape, soybean, and maize crops in Vacaria, Southern Brazil. This study assesses the strengths and limitations of each data source for characterizing crop-specific phenological dynamics and supporting operational agricultural monitoring.
2. Materials and Methods
This study focused on analyzing the NDVI time series with HLS for different crop types in the municipality of Vacaria, located in the southern region of Brazil. In addition to the applied temporal analysis, the study incorporated a qualitative discussion of recent scientific advances related to NDVI applications in agriculture. This combined approach enabled the integration of local-scale results with broader trends identified in the current literature, thereby supporting a contextualized interpretation of NDVI dynamics for both perennial and annual crops [9,17]. Figure 1 shows the workflow of this study.
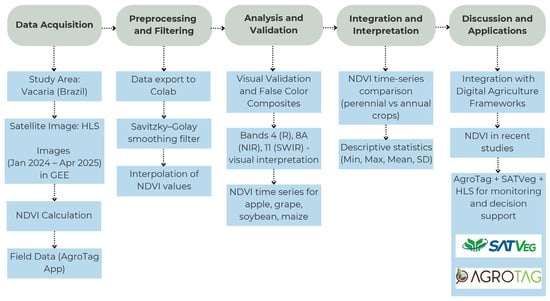
Figure 1.
Workflow of the study presenting the main methodological steps, from data acquisition to analysis and interpretation.
2.1. Study Area
Figure 2 illustrates the geographical location of Vacaria in southern Brazil, along with a visual representation of vegetation patterns based on NDVI values. Vacaria has an average altitude of 881.40 m. The climate according to the Köppen Climate Classification is Cfb Humid subtropical oceanic climate without a dry season but with temperate summer and a regular precipitation during the year [18]. Vacaria has predominance of Bruno Latosol: 87,900 hectares, corresponding to 41% of the territory and Humic Cambisol, associated with more dissected relief with 67,800 hectares, corresponding to 32% of the territory [19].
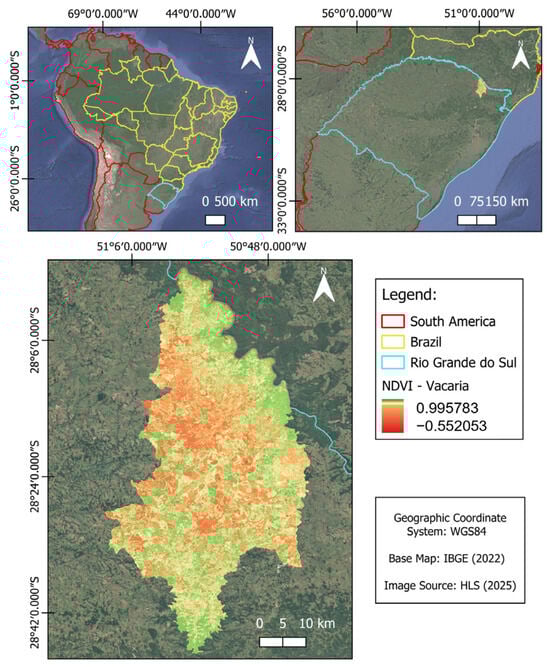
Figure 2.
Geographic location and NDVI distribution in Vacaria (Rio Grande do Sul state, Brazil) based on a Harmonized Landsat and Sentinel-2 (HLS) image. Base Map [20].
The bottom map displays NDVI values derived from a Harmonized Landsat and Sentinel-2 (HLS) image acquired in March 2025, ranging from −0.55 (red, indicating low vegetation cover or bare soil) to 0.99 (green, indicating dense and healthy vegetation). This spatial distribution provides an overview of the spatial variability of vegetation conditions across the study area.
2.2. Image Processing and NDVI Calculation
The image acquisition was conducted using the Google Earth Engine (GEE). HLS images covering Vacaria were selected for the period between January 2024 and April 2025. All available cloud-free scenes during this time window were considered (112 available dates), and the NDVI was calculated from each image using the standard formula based on the red and near-infrared bands. The analysis focused on areas with a high concentration and diversity of crops, representing the dominant agricultural regions within the municipality.
After extracting NDVI values, the data were exported and further processed using Google Colab. Three NDVI versions were considered for the analysis: the original (raw) NDVI values obtained directly from the images, the linear interpolated NDVI values, and the smoothed NDVI using the Savitzky–Golay (SG) filter [21]. This filtering method helps preserve key features of the NDVI curve, such as peak values and temporal dynamics, while reducing noise caused by atmospheric interference and data gaps. The interpolation enabled a more continuous and accurate representation of surface phenology over time for each crop type.
2.3. Field Data and Visual Validation
A false-color composite was generated using bands 4 (Red), 8A (Near-Infrared, NIR), and 11 (Shortwave Infrared, SWIR), supporting the visual interpretation of land cover and validation with in situ observations.
Field data were collected during a single field campaign conducted over three consecutive days (11–13 March 2025) and covered the entire municipality of Vacaria. The data were collected using the Agrotag mobile application [22,23] developed by Embrapa, which allows georeferenced data collection and photographic documentation directly in the field. The points were used to validate crop type identification and to support the interpretation of NDVI temporal behavior over the full analysis period (January 2024 to April 2025).
A total of 646 georeferenced points were collected, representing 16 different land use and land cover types. For the purposes of this study, only points corresponding to the four target crops, apple, grape, soybean, and maize were considered, resulting in a subset of 328 reference points, which represents more than 50% of the total field observations. Specifically, the dataset included 105 apple points, 11 grape points, 169 soybean points, and 43 maize points.
The unequal number of reference points among crops reflects the actual distribution and availability of cultivated areas identified during the field survey, as each point corresponds to a distinct field or management unit. Consequently, crops such as grape are represented by fewer points due to their limited production within the municipality, rather than by any sampling constraint or selection bias (Figure 3).
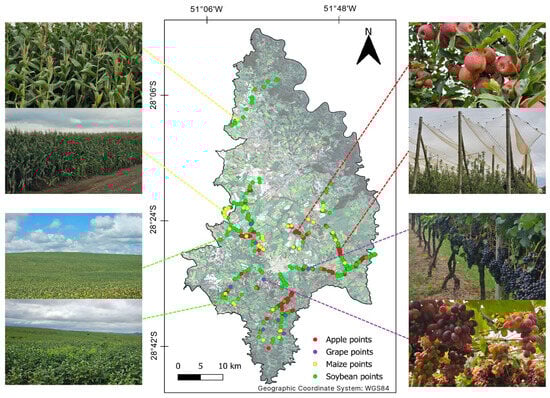
Figure 3.
Spatial distribution of field samples of apple, grape, soybean, and maize crops, including field photographs used for visual validation.
Each field reference point included geographic coordinates, georeferenced photographs, and brief field notes describing crop conditions. These notes documented the crop type and general growth stage at the time of the survey (e.g., early development or harvest), and, for apple orchards, the presence or absence of anti-hail nets. Field photographs acquired during the same period were used for visual correlation and contextual validation, supporting the interpretation of NDVI temporal patterns derived from HLS imagery rather than serving as quantitative input variables. This combined approach reinforced the consistency between satellite-derived spectral responses and on-site observations.
2.4. Data Analysis
To evaluate the phenological behavior of the crops, time-series plots were generated for each class, allowing comparisons between perennial (apple and grape) and annual (soybean and maize) crop types. Furthermore, descriptive statistics, including minimum, maximum, mean, median, and standard deviation of NDVI values, were calculated for each class over the study period. These indicators were used to support the analysis of temporal variability and to assess differences in vegetation dynamics across the selected crops.
Additionally, findings from recent literature were used to contextualize the observed NDVI behavior across crop types, linking the local patterns in Vacaria to broader trends in agricultural monitoring identified globally.
2.5. Digital Agriculture Tools for Monitoring
In addition to the field data collected with the AgroTag application, this study also demonstrates how another digital agriculture tool developed by Embrapa, the Temporal Vegetation Analysis System (SATVeg), can assist in vegetation monitoring and data integration [24]. SATVeg provides access to long-term NDVI and EVI (Enhanced vegetation index) time series derived from MODIS and Sentinel-2 imagery, allowing users to visualize and analyze vegetation dynamics across South America. The platform supports both research and operational monitoring by offering rapid access to vegetation indicators that reflect crop development, management practices, and environmental variations [24].
In this study, SATVeg was used to extract NDVI profiles for selected agricultural areas in Vacaria. These profiles were compared with NDVI results derived from Harmonized Landsat and Sentinel-2 (HLS) imagery, enabling the verification of temporal consistency and the evaluation of regional vegetation patterns.
Together, AgroTag and SATVeg exemplify how digital agriculture tools can complement satellite-based analyses by linking ground-truth data with temporal vegetation trends. This integration enhances the reliability and applicability of NDVI-based monitoring frameworks, contributing to scalable digital solutions aligned with the objectives of the Semear Digital initiative to support sustainable innovation and decision-making for small and medium-sized producers.
3. Results and Discussion
3.1. NDVI Analysis for Agricultural Crops
3.1.1. Perennial Crops
Figure 4 presents examples of field photographs of apple and grape crops, acquired during fieldwork in Vacaria in March 2025, alongside high-resolution images from Google Earth and false-color HLS composites (bands 4-11-8A). These visual materials support the identification of crop patterns and structural characteristics associated with perennial cultivation systems. The comparison highlights the differences in canopy organization and spectral responses between the crop types.
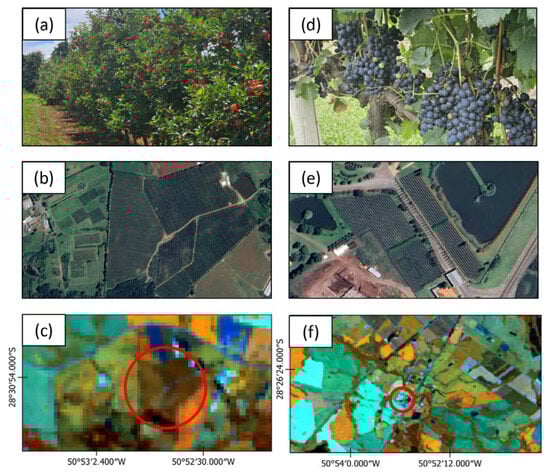
Figure 4.
Photographs in Vacaria (Rio Grande do Sul state, Brazil). Panels (a,d) show field photographs of apple and grape orchards collected during fieldwork in March 2025. Panels (b,e) present high-resolution aerial imagery from Google Earth corresponding to the same locations. Panels (c,f) display false-color composites derived from HLS imagery using bands 4 (red), 11 (SWIR) and 8A (NIR), highlighting the satellite pixel-level representation of the orchards (red circles).
Figure 5 shows the NDVI temporal profiles for perennial crops: apple and grape, based on HLS imagery available in the GEE from January 2024 to April 2025. The graph includes raw NDVI values, interpolated NDVI values, and smoothed NDVI values using the Savitzky–Golay filter. These time series reveal seasonal trends and phenological variations, allowing comparative analysis of vegetation dynamics between the two crop types.
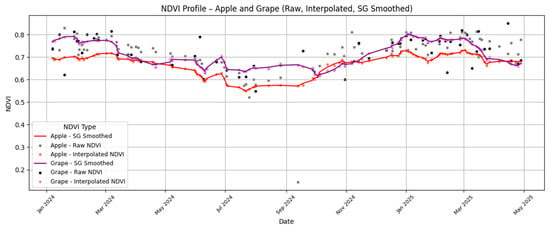
Figure 5.
NDVI time series for apple and grape from HLS imagery (January 2024–April 2025) in Vacaria (Rio Grande do Sul state, Brazil).
Perennial fruit crops, such as apple and grape, present unique challenges and opportunities for remote sensing-based monitoring due to their life cycles, structured canopy formations, irrigation, and sensitivity to climatic variability [25,26]. As shown in Figure 2, the field photographs, Google Earth imagery, and false-color HLS composites visually demonstrate the spatial organization and spectral response of these crops in Vacaria. The distinct planting patterns and vegetation structure of orchards and vineyards allow for their identification in medium-resolution imagery, especially when complemented with field observations. The use of HLS imagery facilitates this analysis by providing frequent and consistent acquisitions suitable for agricultural landscapes with diverse crop types.
The NDVI profiles shown in Figure 5 reflect the expected seasonal phenological behavior of apple and grape crops during the 2024–2025 cycle. Rather than indicating novel phenological patterns, the relatively stable NDVI curves and well-defined peaks associated with the active vegetative period demonstrate the consistency of HLS-derived NDVI time series in capturing perennial crop dynamics at the municipal scale. The raw NDVI values, although informative, are often affected by noise due to atmospheric effects and cloud contamination. The use of interpolation and smoothing techniques, such as the Savitzky–Golay filter, enhances the temporal continuity of the dataset, allowing for a more accurate assessment of growth dynamics [21,27]. The smoothed NDVI curves provide clearer insights into the timing and intensity of vegetation development, which are critical for agricultural planning and productivity estimation.
Several studies have explored the application of the NDVI in fruit cultivation, including apples, grapes, citrus, and other orchard crops, to assess canopy cover, vigor, and yield potential [28,29]. However, many of these rely on either low-temporal-resolution data or require high-resolution commercial imagery, limiting scalability. The integration of the NDVI with freely available HLS data offers an effective alternative, especially in regions like Vacaria, where perennial fruit production is a key economic activity. HLS’s spatial resolution (30 m in this study) is sufficient to capture the characteristic spatial patterns of orchards and vineyards, while its high revisit frequency allows for near real-time monitoring during critical growth phases.
For fruit producers in Vacaria, this approach offers the potential to improve crop management by enabling the detection of intra-seasonal variability, stress conditions, and long-term trends in crop performance. Additionally, it supports initiatives related to sustainable agriculture, resource optimization, and climate resilience. On a broader scale, the use of HLS-derived NDVI time series can contribute to municipal-level agricultural monitoring, providing data-driven insights.
3.1.2. Annual Crops
Figure 6 illustrates representative examples of soybean and maize fields in Vacaria, including field photographs, high-resolution satellite imagery from Google Earth, and false-color composites generated from HLS data using bands 4, 11, 8A. The contrast between the crops is noticeable in terms of field size, planting density, and spectral reflectance, which supports their visual and spectral distinction in satellite imagery.
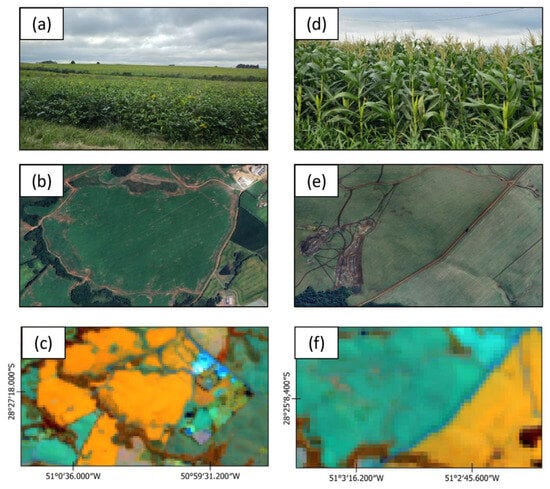
Figure 6.
Photographs in Vacaria (Rio Grande do Sul state, Brazil). Panels (a,d) show field photographs of soybean and maize crops collected during fieldwork in March 2025. Panels (b,e) present high-resolution aerial imagery from Google Earth corresponding to the same agricultural fields. Panels (c,f) display false-color composites derived from HLS imagery using bands 4 (red), 11 (SWIR), and 8A (NIR), illustrating the satellite pixel-level representation of the crops. The pixelated appearance reflects the native spatial resolution of HLS imagery and highlights scale-related constraints for detailed visualization of annual crop fields.
Figure 7 displays the NDVI time series for soybean and maize in Vacaria derived from HLS imagery obtained through GEE, covering the period from January 2024 to April 2025. The curves represent raw, interpolated, and Savitzky–Golay–smoothed NDVI data and capture the distinct growth cycles of these annual crops, with rapid increases during vegetative development, well-defined peak values, and sharp declines after harvest. This pronounced temporal variability reflects the short and well-defined phenological cycles of soybean and maize, two of the most widely cultivated annual crops in Brazil with significant economic and social importance at both regional and national scales [30,31]. The observed dynamics reinforce the importance of high-frequency monitoring to adequately capture the full development cycle of annual crops [32].
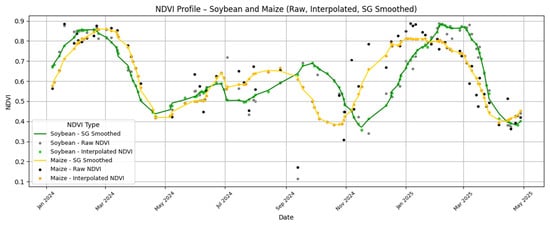
Figure 7.
NDVI time series for soybean and maize from HLS imagery (January 2024–April 2025) in Vacaria (Rio Grande do Sul state, Brazil).
Earth imagery and false-color HLS composites provide a detailed overview of the structure and spatial patterns of soybean and maize fields in Vacaria. The relatively large, homogeneous fields and the spectral differences between growth stages allow for effective remote detection and monitoring. Vegetated areas appear in green shades depending on canopy density and water content, while bare soil and dry regions are highlighted in orange to yellow tones. This spectral combination enhances the discrimination of land cover types, particularly in identifying stress conditions, harvest stages, and exposed soils.
The NDVI temporal profiles presented in Figure 7 reflect the expected seasonal growth dynamics of soybean and maize from January 2024 to April 2025. Both crops exhibit two complete production cycles during the study period, characterized by rapid NDVI increases during vegetative development, peak values during maximum canopy development, and sharp declines following harvest. Rather than indicating novel phenological behavior, these patterns demonstrate the ability of HLS-derived NDVI time series, particularly when smoothed using the Savitzky–Golay filter, to consistently capture the timing and duration of annual crop cycles at the municipal scale.
The use of the NDVI for monitoring annual crops has been widely documented in the literature due to its simplicity and effectiveness in capturing vegetation vigor, canopy development, and biomass accumulation [33,34,35]. However, the usefulness of the NDVI is directly linked to the availability and consistency of satellite data. In this regard, HLS imagery offers a significant advantage by providing cloud-free observations at frequent intervals, with adequate spatial resolution to monitor medium-sized fields typical of Vacaria’s agricultural landscape. For local producers and agricultural advisors, the integration of NDVI time series with HLS data represents a valuable tool for decision-making. It enables the estimation of growth stages, supports timely interventions, and facilitates the detection of crop failures or low-performing areas within fields [17]. On a broader scale, this approach can be incorporated into precision agriculture strategies and regional monitoring programs aimed at improving sustainability and productivity.
Future studies should consider integrating additional spectral indices, ML classifiers, or SAR data to improve crop identification and growth modeling.
3.1.3. Normalized Difference Vegetation Index Values
Table 1 presents minimum, maximum, mean, median, and standard deviation values of the NDVI after Savitzky–Golay smoothing, calculated for each crop class using field-validated sample points. 112 available dates were considered from January 2024 to April 2025. The descriptive statistics in Table 1 provide a complementary summary of NDVI variability over the analysis period, rather than a phenological characterization of crop development, which is addressed through the temporal profiles.

Table 1.
Descriptive statistics of NDVI values for apple, grape, soybean, and maize crops in Vacaria, based on HLS imagery acquired from January 2024 to April 2025, computed from 112 observation dates. Values were derived from smoothed NDVI time series using the Savitzky–Golay filter.
Perennial crops exhibited relatively stable NDVI behavior over the study period. Apple orchards showed moderate NDVI variability (standard deviation of 0.14), with mean values around 0.67, reflecting a dense and persistent canopy structure typical of perennial systems. Similarly, grape crops presented slightly higher mean NDVI values (0.71) and lower variability (standard deviation of 0.12), indicating more uniform vegetation vigor across vineyards, despite the smaller number of field reference points. These patterns are consistent with the phenological stability expected for perennial crops during their active growing stages.
In contrast, annual crops displayed greater NDVI variability associated with their short and well-defined phenological cycles. Soybean and maize exhibited higher standard deviation values (0.23 and 0.21, respectively), reflecting rapid canopy development followed by abrupt declines after harvest. Mean NDVI values for these crops ranged from 0.63 to 0.64, with pronounced seasonal fluctuations influenced by planting dates, management practices, and weather conditions. Peak NDVI values were concentrated during mid-to-late summer, whereas minimum values occurred outside the active growing period, highlighting the importance of high-frequency monitoring to capture the dynamic phenological behavior of annual cropping systems.
3.2. Integrating NDVI Findings with Recent Advances
3.2.1. NDVI and False Color in Perennial and Annual Crops
The use of the NDVI for monitoring perennial and annual crops has gained new attention in recent years due to advances in spatial and temporal resolution of satellite imagery. Studies have demonstrated that the NDVI effectively characterizes the phenological behavior of perennial species, particularly fruit crops such as apple, grape, banana and citrus, whose stable canopy structures allow for consistent temporal monitoring [16,28,29,36]. Recent works emphasize that the integration of the NDVI with satellite datasets, enables the detection of subtle variations in canopy vigor and productivity linked to management practices and climate changes [37,38].
In perennial orchards, NDVI profiles typically exhibit smoother temporal variations compared to annual crops, reflecting the relatively stable vegetative cover throughout the growing seasons. Between 2020 and 2025, authors [25,39,40,41] explored the potential of the NDVI to distinguish physiological stages of apple and grape canopies, identifying correlations between NDVI peaks and flowering or fruiting phases, as well as other parameters. These studies reinforce that the NDVI remains a simple yet powerful index for monitoring vegetative dynamics, despite the growing popularity of alternative indices such as Normalized Difference Red Edge (NDRE) and EVI. The persistence of the NDVI as a preferred index lies in its interpretability and compatibility with long-term historical records.
False-color composites complement NDVI analyses by enhancing the visual interpretation of vegetation patterns in orchards. In recent research, false-color imagery has been employed in studies with machine learning (ML) and deep learning (DL) models applied to fruit detection and analysis [42,43]. For perennial crops, these composites allow rapid visual assessment of canopy density and the identification of spatial variability within orchards, supporting NDVI-derived assessments. When combined, NDVI and false-color visualization provide a comprehensive framework for both quantitative and qualitative crop evaluation.
In the context of this study, the NDVI patterns obtained from HLS imagery for apple and grape fields in Vacaria follow the trends observed in the recent literature. The temporal stability of the NDVI curves confirms the expected behavior of perennial crops, with well-defined vegetative peaks and gradual transitions between growth stages. The integration of false-color composites enhanced the differentiation between canopy-covered areas and bare soil, validating the NDVI-based classification. This approach demonstrates that combining time-series analysis and visual composites can improve interpretation accuracy in heterogeneous agricultural landscapes.
Annual crops such as soybean, maize, and wheat present rapid and highly dynamic phenological cycles, requiring frequent satellite observations to identify transitions from planting to harvest [6,44,45]. NDVI time series from high-temporal-resolution sensors such as Sentinel-2 and HLS have enhanced the ability to detect growth stages, estimate yields, and identify stress conditions with precision [6,45].
Between 2020 and 2025, studies consistently demonstrated that the NDVI reliably captures phenological milestones, contributing to crop mapping and productivity [45,46,47]. These advances highlight NDVI’s continued relevance as a fast, interpretable indicator for agricultural monitoring. Furthermore, studies highlight the importance of further research on the impacts of non-climate-related factors on annual crops and the effectiveness of other vegetation indices besides the NDVI [44,45].
False-color composites complement the NDVI by visually distinguishing vegetation vigor, soil exposure, and harvest stages. Combinations of red, NIR, and SWIR bands amplify spectral contrast, supporting the detection of early planting zones, and post-harvest soil exposure [48]. Their integration with NDVI profiles strengthens interpretation and validation efforts, especially in heterogeneous agricultural landscapes.
In this study, HLS-derived NDVI time series for soybean and maize in Vacaria reproduced expected annual crop patterns, with pronounced seasonal peaks followed by abrupt declines at harvest. False-color imagery confirmed spatial patterns observed in the NDVI curves, aiding the differentiation between vegetated and bare-soil periods. These results reinforce the applicability of the NDVI and multispectral visualization for monitoring annual crop dynamics and management outcomes.
More broadly, the combined use of the NDVI and false-color imagery aligns with the growing adoption of digital and precision agriculture approaches. Cloud-based platforms, such as Google Earth Engine, have increased the operational feasibility of these analyses, enabling scalable and near-real-time monitoring. Together, spectral metrics and visual diagnostics form a robust foundation for decision-support tools and sustainable crop management strategies in annual production systems.
3.2.2. NDVI with Satellite Images in Agriculture
The combination of HLS imagery and NDVI analysis presents a valuable tool for the temporal assessment of crops such as apple, grape, soybean and maize. Its application in Vacaria illustrates the potential of open-access satellite data to support precision agriculture and enhance regional agricultural monitoring frameworks.
The integration of HLS imagery for NDVI-based crop monitoring has proven to be a valuable approach, particularly in regions characterized by diverse agricultural landscapes such as Vacaria. One of the primary advantages of HLS over traditional sensors like MODIS lies in its spatial resolution. While MODIS provides daily observations at coarse spatial resolutions (250–500 m), HLS offers 30 m resolution, which is sufficient to detect and monitor medium to small agricultural fields [17,49]. This improved spatial detail enables a more accurate representation of crop structure and field-level variability, which is critical for precision agriculture applications and local-scale assessments.
Another key strength of HLS is its temporal resolution. By harmonizing the observation schedules of Landsat-8/9 and Sentinel-2A/2B, the HLS system delivers data at a high revisit frequency, with intervals of 2–3 days under ideal conditions [17]. This greatly enhances the probability of acquiring cloud-free scenes during critical crop development stages, which is often a limiting factor in optical remote sensing. In contrast, while MODIS provides daily coverage, its lower spatial resolution often leads to mixed pixels and less reliable information for individual crop types, particularly in heterogeneous regions.
In terms of NDVI time series generation, the consistency and radiometric calibration of HLS imagery result in smoother and more stable temporal profiles, especially when combined with preprocessing techniques such as interpolation and filtering. This allows for detailed tracking of crop phenology, identification of stress events, and assessment of inter-seasonal dynamics, which are difficult to achieve with MODIS in small or medium-sized agricultural parcels.
Furthermore, HLS data are open-access and well-integrated into cloud-based processing platforms such as GEE, which facilitates large-scale monitoring, reproducibility, and integration with ancillary datasets [50].
While MODIS remains useful for continental or global-scale agricultural studies due to its high temporal density and historical depth, its limitations in spatial resolution make it less suitable for municipal or field-level applications. In contrast, HLS bridges the gap between spatial detail and temporal frequency, making it particularly advantageous for applications that require frequent, accurate, and localized information.
3.2.3. Integration of National Digital Tools: AgroTag and SATVeg
AgroTag and SATVeg are digital tools developed by Embrapa that support agricultural monitoring and data collection across Brazil [24]. Their integration into this study highlights the growing role of national platforms in advancing digital agriculture and improving the accessibility of geospatial data for research and field management.
AgroTag is a mobile application that allows in situ georeferenced data collection, integrating photos, crop descriptions, and management information [17,22]. In this study, AgroTag was used to collect ground-truth points for apple, grape, soybean, and maize fields during fieldwork conducted in March 2025. These data provided accurate reference samples that supported the validation and interpretation of NDVI results obtained from satellite imagery.
SATVeg, the Temporal Vegetation Analysis System developed by Embrapa Digital Agriculture, provides long-term NDVI and EVI time series derived from MODIS imagery [24]. The platform enables rapid visualization of vegetation dynamics across South America, serving as a national benchmark for vegetation monitoring. NDVI profiles extracted from SATVeg for selected areas in Vacaria (apple orchards under and without hail nets) complemented the HLS analysis, illustrating how spectral responses can capture management-related variations in perennial crops.
Figure 8 presents NDVI time profiles generated using the SATVeg platform, combined with field photographs to provide contextual and visual information about the monitored plots. These profiles are included for qualitative visualization and familiarization with the data and are not intended to support quantitative analysis of temporal patterns, anomalies, or phenological metrics.
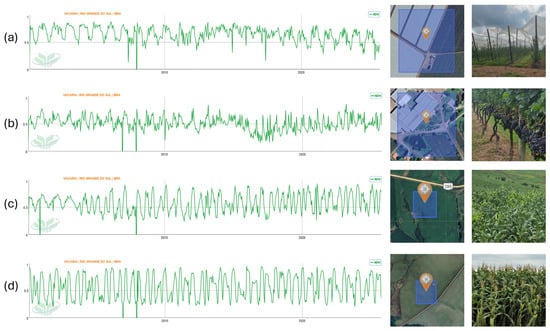
Figure 8.
Illustrative NDVI time series generated using the SATVeg platform for selected sampling points in Vacaria (Rio Grande do Sul state, Brazil). Each profile corresponds to the pixel area defined by the MODIS spatial resolution (250 m), with the location of the analyzed point shown on the high-resolution base image and corresponding field photographs: (a) apple orchard under white hail nets; (b) vineyard (NDVI profile covers an area larger than the actual vineyard due to pixel size); (c) soybean field; and (d) maize field.
As shown in Figure 8, the temporal NDVI profiles generated through the SATVeg platform cover a long-term series extending from the year 2000 to the present. The system allows users to adjust the time window according to specific analysis needs, enabling both historical assessments and recent vegetation dynamics to be visualized. This flexibility supports the examination of long-term vegetation trends as well as short-term agricultural cycles, as illustrated in Figure 9 and Figure 10.
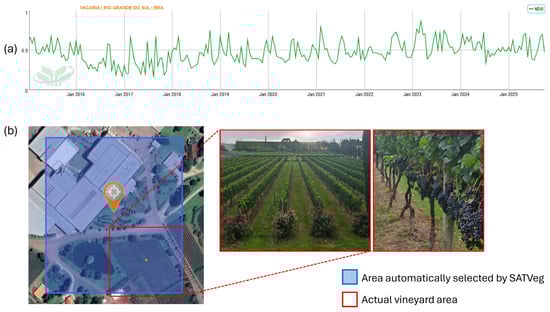
Figure 9.
NDVI time series generated using the SATVeg platform for a vineyard area in Vacaria (Rio Grande do Sul, Brazil) from 2016 to 2025. Panel (a) shows the long-term NDVI temporal profile derived from MODIS data. Panel (b) compares the area automatically selected by SATVeg for NDVI extraction (blue square, MODIS pixel at 250 m spatial resolution) with the actual vineyard extent (red polygon), illustrated with field photographs. This comparison highlights the spatial mismatch between coarse-resolution pixels and small perennial plots, evidencing scale-related limitations when applying the MODIS-based NDVI to vineyards and other fragmented agricultural systems.
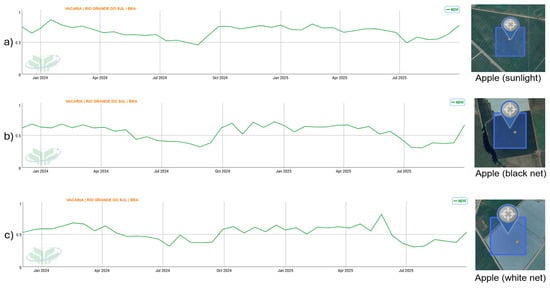
Figure 10.
NDVI temporal profiles generated using the SATVeg platform for apple orchards in Vacaria (Rio Grande do Sul, Brazil) between January 2024 and July 2025 under different cultivation conditions: (a) orchard under full sunlight (no hail net), (b) orchard under black hail net, and (c) orchard under white hail net. The blue squares indicate the MODIS pixel area (250 m) automatically selected by SATVeg for NDVI extraction. The profiles illustrate differences in NDVI magnitude and temporal behavior associated with contrasting canopy and light conditions, highlighting the influence of hail netting on satellite-derived vegetation signals.
The AgroTag application enables the georeferenced recording of field information. Through the mobile app, users can record the coordinates of each sampled point, select the type of land use and cover, attach georeferenced photographs, and add descriptive notes about local conditions [17,22,50]. One of the main advantages of AgroTag is its ability to operate offline, allowing users to track their real-time position in the field and record information even without mobile or internet signal, ensuring data continuity in remote or low-connectivity areas. All collected points are automatically synchronized with the WebGIS platform, allowing subsequent access, spatial visualization of the samples, and integration with other geospatial databases. This linkage between field data collection and web-based analysis facilitates the organization and consistency of agro-environmental information. As shown in Figure 11, AgroTag was used in this study to collect and visualize representative points of different agricultural uses.
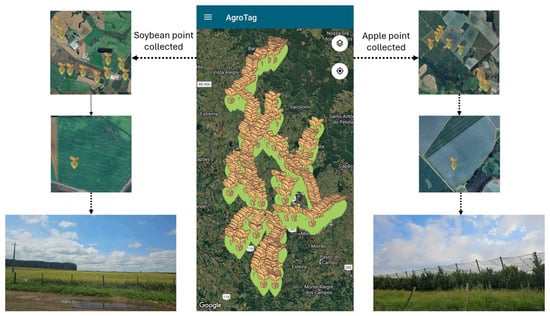
Figure 11.
Field data collected in Vacaria (Rio Grande do Sul state, Brazil) using the AgroTag mobile application. The central map shows all georeferenced sampling points recorded during fieldwork, while the side images present examples of collected points for soybean (left) and apple (right) crops. The sequence illustrates the location of each point and the corresponding field photographs captured directly within the AgroTag app.
The tools developed by Embrapa demonstrate the synergy between field-based data collection (AgroTag) and satellite-based vegetation monitoring (SATVeg), reinforcing the potential of Brazil’s digital agriculture infrastructure. Within the context of the Semear Digital project, these resources contribute to the development of scalable applications and decision-support systems aimed at small and medium-sized producers. The combination of open-access platforms, field validation, and harmonized satellite products exemplifies an integrated framework that bridges research and practical agricultural innovation.
3.2.4. NDVI Combined with Machine and Deep Learning Approaches
In recent years, the integration of NDVI with ML and DL algorithms has emerged as a major trend in precision agriculture. These approaches enhance the interpretation of spectral patterns by learning complex, nonlinear relationships between vegetation indices and biophysical or management variables. Algorithms such as Random Forest, Support Vector Machine, and Gradient Boosting have been widely applied to classify crop types and estimate parameters such as yield, biomass, and chlorophyll content [51,52].
DL models, particularly convolutional neural networks (CNNs) and transformer-based architectures, have advanced the automatic detection of spatial patterns and temporal transitions in NDVI time series. Unlike traditional methods, DL models can process high-dimensional data from multiple sensors, capturing subtle spectral and structural variations. Studies using architectures such as U-Net, ConvLSTM, and Vision Transformers have demonstrated promising results in crop segmentation, stress detection, and prediction of phenological stages [53].
Integrating the NDVI with ML/DL also allows the creation of hybrid monitoring systems that combine spectral indicators with ancillary data, such as topography, soil properties, and climate variables, providing a holistic understanding of crop conditions. These systems have proven particularly useful for early-warning applications, where deviations in NDVI trends can be linked to yield reduction, pest incidence, or irrigation inefficiency [54,55].
In the context of this study, future applications could incorporate NDVI time series derived from HLS imagery into ML/DL pipelines to improve crop classification and phenological mapping in Vacaria. This would enable automated identification of perennial and annual crop cycles and facilitate the detection of atypical seasonal behaviors. The combination of open-access datasets, digital tools such as AgroTag and SATVeg, and AI-based analytics represents a key direction for scalable, data-driven agricultural monitoring within the Semear Digital initiative.
3.2.5. Potential Applications and Limitations
As illustrated in Figure 9, the NDVI profile obtained for vineyard areas using SATVeg represents a spatial unit larger than the actual cultivated plots. This occurs because SATVeg is based primarily on MODIS imagery, which has a spatial resolution of 250 m per pixel. Consequently, each sampling point in the system corresponds to an area of approximately 6.25 ha, encompassing not only the vineyard but also adjacent land cover types such as urban areas, pastures, or native vegetation. This pixel aggregation results in mixed spectral responses, which can smooth or distort the NDVI signal for small or fragmented crops such as grapes.
This limitation reinforces the need for complementary analyses using higher-resolution satellite products, such as the HLS dataset, which combines 30 m spatial detail with frequent temporal coverage. HLS imagery enables a more accurate characterization of canopy structure and phenological dynamics, allowing differentiation between crop types even within heterogeneous agricultural landscapes. Therefore, while SATVeg is valuable for regional-scale monitoring and long-term NDVI trends, HLS provides the spatial precision required for field-level analyses and decision support in fruit production systems.
Recent updates to the SATVeg platform include a redesigned interface, optimized MODIS time series access, and the incorporation of Sentinel-2 data through the Brazil Data Cube, enabling higher spatial resolution analyses and multi-point visualization at the national scale. These advances, released after the temporal scope of the present study, highlight the rapid evolution of digital agriculture tools and point to future opportunities for integrating higher-resolution data with harmonized multisensor products for operational crop monitoring. The new SatVeg update was released in November 2025, now with more tool options.
Despite these advances, several methodological and operational challenges remain. NDVI, while robust and interpretable, is limited in capturing saturation effects in dense vegetation and sensitivity to background soil reflectance. Future studies could benefit from combining NDVI with complementary indices such as the EVI or the NDRE, which improve sensitivity to canopy structure and chlorophyll content. In addition, integrating multi-sensor datasets, including synthetic aperture radar (SAR) imagery, may help overcome cloud-related gaps and provide information on biomass and surface moisture, contributing to more resilient monitoring frameworks.
Future work should also explore the use of ML and DL approaches for multi-temporal classification, anomaly detection, and trend analysis. Historical archives of HLS imagery could be leveraged to build long-term vegetation profiles and predictive models capable of assessing productivity fluctuations and stress patterns. Moreover, incorporating data from digital agriculture tools such as AgroTag and SATVeg into cloud-based analytics platforms would strengthen the connection between field observations and satellite indicators. These advancements could support decision-making processes within initiatives like the Semear Digital project, promoting scalable and accessible digital monitoring solutions for Brazilian agriculture.
Future research may benefit from integrating NDVI trends with complementary data sources, such as thermal or hyperspectral imagery, to expand the understanding of crop responses to environmental and agronomic factors. In particular, ongoing research is exploring the potential of satellite-based monitoring to assess the effects of hail netting systems on orchard canopy dynamics and vegetation indices.
4. Conclusions
This study analyzed NDVI time series derived from Harmonized Landsat and Sentinel-2 (HLS) imagery, supported by field reference data, to monitor perennial and annual crops at the municipal scale in southern Brazil. The results showed clear and consistent differences in temporal NDVI behavior between perennial crops (apple and grape), characterized by higher stability and lower variability, and annual crops (soybean and maize), which exhibited pronounced seasonal cycles and rapid NDVI fluctuations associated with planting and harvest periods.
The comparison between raw, interpolated, and Savitzky–Golay smoothed NDVI time series demonstrated that temporal smoothing improves signal interpretability while preserving seasonal dynamics, supporting its use in operational crop monitoring. Field observations collected across the municipality enabled reliable crop identification and strengthened the interpretation of satellite-derived temporal patterns.
Together, these results demonstrate that HLS-based NDVI time series provide a robust and scalable approach for distinguishing crop systems and supporting agricultural monitoring in heterogeneous landscapes at the municipal level. Digital agriculture tools, such as AgroTag and SATVeg, play a complementary role by facilitating field data collection and qualitative visualization, while the core analytical assessment is driven by harmonized satellite time series.
Future research should focus on integrating additional spectral indices (e.g., EVI, NDRE), ML and DL algorithms, and multi-year HLS archives to expand the temporal scope and predictive capacity of vegetation analysis. Such developments will further align with the objectives of the Semear Digital project, fostering innovation and decision support for small and medium-sized producers through scalable, science-based digital agriculture solutions.
Author Contributions
Conceptualization, D.E.G.F. and É.L.B.; methodology, D.E.G.F., É.L.B. and T.C.P.; software, D.E.G.F. and T.C.P.; validation, D.E.G.F., É.L.B., T.C.P. and V.B.S.; formal analysis, D.E.G.F.; investigation, D.E.G.F., É.L.B., T.C.P. and L.G.; resources, É.L.B. and L.G.; data curation, D.E.G.F., É.L.B. and T.C.P.; writing—original draft preparation, D.E.G.F.; writing—review and editing, D.E.G.F., É.L.B., T.C.P., V.B.S. and L.G.; visualization, D.E.G.F.; supervision, É.L.B.; project administration, É.L.B.; funding acquisition, D.E.G.F., É.L.B., T.C.P., V.B.S. and L.G. All authors have read and agreed to the published version of the manuscript.
Funding
This research was funded by the São Paulo Research Foundation (FAPESP), grant numbers #2022/09319-9, #2024/05205-4 (D.E.G.F.), #2024/13150-5 (T.C.P.), and #2025/01750-0 (V.B.S.). This work was also supported by the National Council for Scientific and Technological Development (CNPq), through Research Productivity Fellowships (PQ) #302963/2025-1 (E.L.B.).
Institutional Review Board Statement
Not applicable.
Informed Consent Statement
Not applicable.
Data Availability Statement
The data presented in this study are available on request from the corresponding author.
Acknowledgments
The authors would like to thank Nicolas Brandt (Emater, Vacaria, Rio Grande do Sul) for his valuable collaboration and assistance.
Conflicts of Interest
Danielle Elis Garcia Furuya, Édson Luis Bolfe, and Luciano Gebler are affiliated with the Brazilian Agricultural Research Corporation. The authors declare no conflicts of interest.
Abbreviations
| EVI | Enhanced vegetation index |
| GEE | Google Earth Engine |
| HLS | Harmonized Landsat and Sentinel-2 |
| ML | Machine Learning |
| NDVI | Normalized Difference Vegetation Index |
| NDRE | Normalized Difference Red Edge |
| NIR | Near-Infrared band |
| SAR | Synthetic Aperture Radar |
| SATVeg | Temporal Vegetation Analysis System |
| SG | Savitzky–Golay |
| SWIR | Shortwave Infrared band |
References
- Meza, F.; Zhang, Y.; Kistner, M.; Anderson, R.G.; Lee, J.; Loescher, H.W. Assessing Temperature-Based Adaptation Limits to Climate Change of Temperate Perennial Fruit Crops. Glob. Change Biol. 2023, 29, 2557–2571. [Google Scholar] [CrossRef] [PubMed]
- Mahlayeye, M.; Darvishzadeh, R.; Nelson, A. Cropping Patterns of Annual Crops: A Remote Sensing Review. Remote Sens. 2022, 14, 2404. [Google Scholar] [CrossRef]
- Furuya, D.E.G.; Bolfe, É.L.; Parreiras, T.C.; Barbedo, J.G.A.; Santos, T.T.; Gebler, L. Combination of Remote Sensing and Artificial Intelligence in Fruit Growing: Progress, Challenges, and Potential Applications. Remote Sens. 2024, 16, 4805. [Google Scholar] [CrossRef]
- EMBRAPA. Center of Science for Development in Digital Agriculture. 2024. Available online: https://www.semear-digital.cnptia.embrapa.br/ (accessed on 7 October 2025).
- FAPESP. Fundação de Amparo à Pesquisa do Estado de São Paulo. Center of Science for Development in Digital Agriculture. 2022—CCD-AD/SemeAr. Available online: https://bv.fapesp.br/en/auxilios/111242/center-of-science-for-development-in-digital-agriculture-ccd-adsemear/ (accessed on 7 October 2025).
- Gao, F.; Zhang, X. Mapping Crop Phenology in Near Real-Time Using Satellite Remote Sensing: Challenges and Opportunities. J. Remote Sens. 2021, 2021, 100005. [Google Scholar] [CrossRef]
- Omia, E.; Bae, H.; Park, E.; Kim, M.S.; Baek, I.; Kabenge, I.; Cho, B.K. Remote Sensing in Field Crop Monitoring: A Comprehensive Review of Sensor Systems, Data Analyses and Recent Advances. Remote Sens. 2023, 15, 354. [Google Scholar] [CrossRef]
- Joshi, A.; Pradhan, B.; Gite, S.; Chakraborty, S. Remote-Sensing Data and Deep-Learning Techniques in Crop Mapping and Yield Prediction: A Systematic Review. Remote Sens. 2023, 15, 2014. [Google Scholar] [CrossRef]
- NASA. Harmonized Landsat and Sentinel-2 (HLS). Available online: https://hls.gsfc.nasa.gov/ (accessed on 28 October 2025).
- Rouse, J.W.; Haas, R.H.; Schell, J.A.; Deering, D.W. Monitoring vegetation systems in the Great Plains with ERTS. NASA Tech. Rep. 1974, 1, 309–317. Available online: https://ntrs.nasa.gov/citations/19740022614 (accessed on 25 October 2025).
- Tenreiro, T.R.; García-Vila, M.; Gómez, J.A.; Jiménez-Berni, J.A.; Fereres, E. Using NDVI for the Assessment of Canopy Cover in Agricultural Crops within Modelling Research. Comput. Electron. Agric. 2021, 182, 106038. [Google Scholar] [CrossRef]
- Ali, A.; Rondelli, V.; Martelli, R.; Falsone, G.; Lupia, F.; Barbanti, L. Management Zones Delineation through Clustering Techniques Based on Soil Traits, NDVI Data, and Multiple Year Crop Yields. Agriculture 2022, 12, 231. [Google Scholar] [CrossRef]
- Atanasov, A.I.; Atanasov, A.Z.; Evstatiev, B.I. Application of NDVI for Early Detection of Yellow Rust (Puccinia striiformis). AgriEngineering 2025, 7, 160. [Google Scholar] [CrossRef]
- Orlandella, I.; Smith, K.N.; Belcore, E.; Ferrero, R.; Piras, M.; Fiore, S. Monitoring Strawberry Plants’ Growth in Soil Amended with Biochar. AgriEngineering 2025, 7, 324. [Google Scholar] [CrossRef]
- Parreiras, T.C.; Santos, C.d.O.; Bolfe, É.L.; Sano, E.E.; Leandro, V.B.S.; Bayma, G.; Silva, L.A.P.d.; Furuya, D.E.G.; Romani, L.A.S.; Morton, D. Dense Time Series of Harmonized Landsat Sentinel-2 and Ensemble Machine Learning to Map Coffee Production Stages. Remote Sens. 2025, 17, 3168. [Google Scholar] [CrossRef]
- Soares, V.B.; Parreiras, T.C.; Furuya, D.E.G.; Bolfe, É.L.; Nechet, K.d.L. Mapping Banana and Peach Palm in Diversified Landscapes in the Brazilian Atlantic Forest with Sentinel-2. Agriculture 2025, 15, 2052. [Google Scholar] [CrossRef]
- Bolfe, É.L.; Parreiras, T.C.; Silva, L.A.P.d.; Sano, E.E.; Bettiol, G.M.; Victoria, D.d.C.; Sanches, I.D.; Vicente, L.E. Mapping Agricultural Intensification in the Brazilian Savanna: A Machine Learning Approach Using Harmonized Data from Landsat Sentinel-2. ISPRS Int. J. Geo-Inf. 2023, 12, 263. [Google Scholar] [CrossRef]
- da Silva, T.L.; Romani, L.A.S.; Evangelista, S.R.M.; Datcu, M.; Massruhá, S.M.F.S. Drought Monitoring in the Agrotechnological Districts of the Semear Digital Center. Atmosphere 2025, 16, 465. [Google Scholar] [CrossRef]
- Silva, G.B.S.; Bolfe, E.L.; Gava, G.J.C.; Moraes, J.F.L.; Silveira, J.M.C.; De Maria, I.C.; Pires, R.C.M.; Sano, E.E.; Parreiras, T.C.; Santos, C.O.; et al. Diagnóstico Agroambiental dos Municípios com os Distritos Agrotecnológicos do Projeto Semear Digital; Embrapa Meio Ambiente: Jaguariúna, Brazil, 2025; 53p, Available online: https://www.infoteca.cnptia.embrapa.br/infoteca/handle/doc/1178722 (accessed on 7 October 2025).
- IBGE—Instituto Brasileiro de Geografia e Estatística. Base Cartográfica Contínua do Brasil ao Milionésimo—BCIM; IBGE: Rio de Janeiro, Brazil, 2022. Available online: https://www.ibge.gov.br/geociencias/downloads-geociencias.html (accessed on 7 October 2025).
- Savitzky, A.; Golay, M.J.E. Smoothing and Differentiation of Data by Simplified Least Squares Procedures. Anal. Chem. 1964, 36, 1627–1639. [Google Scholar] [CrossRef]
- Araújo, L.S.d.; Vicente, L.E.; Manzatto, C.V.; Skorupa, L.A.; Victoria, D.C.; Soares, A.R. AgroTag: Um sistema de coleta, análise e compartilhamento de dados de campo para qualificação do uso e cobertura das terras no Brasil. In Proceedings of the Anais do Simpósio Brasileiro de Sensoriamento Remoto—SBSR, Santos, Brazil, 14–19 April 2019; INPE: São José dos Campos, Brazil, 2019; pp. 451–454. Available online: http://www.alice.cnptia.embrapa.br/alice/handle/doc/1109062 (accessed on 28 October 2025).
- EMBRAPA. AgroTag. Available online: https://www.agrotag.cnptia.embrapa.br (accessed on 10 October 2025).
- Esquerdo, J.C.D.M.; Antunes, J.F.G.; Coutinho, A.C.; Speranza, E.A.; Kondo, A.A.; dos Santos, J.L. SATVeg: A Web-Based Tool for Visualization of MODIS Vegetation Indices in South America. Comput. Electron. Agric. 2020, 175, 105516. [Google Scholar] [CrossRef]
- Ferreira, S.; Sánchez, J.M.; Gonçalves, J.M.; Eugénio, R.; Damásio, H. Remote Sensing-Assisted Estimation of Water Use in Apple Orchards with Permanent Living Mulch. Agronomy 2025, 15, 338. [Google Scholar] [CrossRef]
- Garajeh, M.K.; Salmani, B.; Naghadehi, S.Z.; Goodarzi, H.V.; Khasraei, A. An Integrated Approach of Remote Sensing and Geospatial Analysis for Modeling and Predicting the Impacts of Climate Change on Food Security. Sci. Rep. 2023, 13, 1057. [Google Scholar] [CrossRef]
- Chen, J.; Jönsson, P.; Tamura, M.; Gu, Z.; Matsushita, B.; Eklundh, L. A Simple Method for Reconstructing a High-Quality NDVI Time-Series Data Set Based on the Savitzky–Golay Filter. Remote Sens. Environ. 2004, 91, 332–344. [Google Scholar] [CrossRef]
- Vanella, D.; Consoli, S.; Ramírez-Cuesta, J.M.; Tessitori, M. Suitability of the MODIS-NDVI Time-Series for a Posteriori Evaluation of the Citrus Tristeza Virus Epidemic. Remote Sens. 2020, 12, 1965. [Google Scholar] [CrossRef]
- Gupta, H.; Kaur, L.; Asra, M.; Avtar, R.; Reddy, C.S. MODIS NDVI Multi-Temporal Analysis Confirms Farmer Perceptions on Seasonality Variations Affecting Apple Orchards in Kinnaur, Himachal Pradesh. Agriculture 2021, 11, 724. [Google Scholar] [CrossRef]
- Bigolin, T.; Talamini, E. Impacts of Climate Change Scenarios on the Corn and Soybean Double-Cropping System in Brazil. Climate 2024, 12, 42. [Google Scholar] [CrossRef]
- Branco, J.E.H.; Bartholomeu, D.B.; Junior, P.N.A.; Caixeta Filho, J.V. Mutual Analyses of Agriculture Land Use and Transportation Networks: The Future Location of Soybean and Corn Production in Brazil. Agric. Syst. 2021, 194, 103264. [Google Scholar] [CrossRef]
- Yang, B.; Zhu, W.; Rezaei, E.E.; Li, J.; Sun, Z.; Zhang, J. The Optimal Phenological Phase of Maize for Yield Prediction with High-Frequency UAV Remote Sensing. Remote Sens. 2022, 14, 1559. [Google Scholar] [CrossRef]
- Hnizil, O.; Baidani, A.; Khlila, I.; Nsarellah, N.; Laamari, A.; Amamou, A. Integrating NDVI, SPAD, and Canopy Temperature for Strategic Nitrogen and Seeding Rate Management to Enhance Yield, Quality, and Sustainability in Wheat Cultivation. Plants 2024, 13, 1574. [Google Scholar] [CrossRef]
- Farbo, A.; Sarvia, F.; De Petris, S.; Basile, V.; Borgogno-Mondino, E. Forecasting Corn NDVI through AI-Based Approaches Using Sentinel-2 Image Time Series. ISPRS J. Photogramm. Remote Sens. 2024, 211, 244–261. [Google Scholar] [CrossRef]
- Shen, Y.; Zhang, X.; Yang, Z. Mapping Corn and Soybean Phenometrics at Field Scales over the United States Corn Belt by Fusing Time Series of Landsat 8 and Sentinel-2 Data with VIIRS Data. ISPRS J. Photogramm. Remote Sens. 2022, 186, 55–69. [Google Scholar] [CrossRef]
- Sozzi, M.; Boscaro, D.; Zanchin, A.; Marinello, F.; Tomasi, D. Reducing Within-Vineyard Spatial Variability Through Real-Time Variable-Rate Fertilization: A Case Study in the Conegliano Valdobbiadene Prosecco DOCG Region. AgriEngineering 2025, 7, 280. [Google Scholar] [CrossRef]
- Md-Tahir, H.; Mahmood, H.S.; Husain, M.; Khalil, A.; Shoaib, M.; Ali, M.; Ali, M.M.; Tasawar, M.; Khan, Y.A.; Awan, U.K.; et al. Localized Crop Classification by NDVI Time Series Analysis of Remote Sensing Satellite Data; Applications for Mechanization Strategy and Integrated Resource Management. AgriEngineering 2024, 6, 2429–2444. [Google Scholar] [CrossRef]
- Bhatti, M.T.; Gilani, H.; Ashraf, M.; Iqbal, M.S.; Munir, S. Field Validation of NDVI to Identify Crop Phenological Signatures. Precis. Agric. 2024, 25, 2245–2270. [Google Scholar] [CrossRef]
- Kasimati, A.; Psiroukis, V.; Darra, N.; Kalogrias, A.; Kalivas, D.; Taylor, J.A.; Fountas, S. Investigation of the Similarities between NDVI Maps from Different Proximal and Remote Sensing Platforms in Explaining Vineyard Variability. Precis. Agric. 2023, 24, 1220–1240. [Google Scholar] [CrossRef]
- Peng, X.; Chen, D.; Zhou, Z.; Zhang, Z.; Xu, C.; Zha, Q.; Wang, F.; Hu, X. Prediction of the Nitrogen, Phosphorus and Potassium Contents in Grape Leaves at Different Growth Stages Based on UAV Multispectral Remote Sensing. Remote Sens. 2022, 14, 2659. [Google Scholar] [CrossRef]
- Tsoulias, N.; Saha, K.K.; Zude-Sasse, M. In-Situ Fruit Analysis by Means of LiDAR 3D Point Cloud of Normalized Difference Vegetation Index (NDVI). Comput. Electron. Agric. 2023, 205, 107611. [Google Scholar] [CrossRef]
- Ye, N.; Mai, W.; Qin, F.; Yuan, S.; Liu, B.; Li, Z.; Liu, C.; Wan, F.; Qian, W.; Wu, Z.; et al. Early Detection of Citrus Huanglongbing by UAV Remote Sensing Based on MGA-UNet. Front. Plant Sci. 2025, 16, 1503645. [Google Scholar] [CrossRef]
- Ilniyaz, O.; Kurban, A.; Du, Q. Leaf Area Index Estimation of Pergola-Trained Vineyards in Arid Regions Based on UAV RGB and Multispectral Data Using Machine Learning Methods. Remote Sens. 2022, 14, 415. [Google Scholar] [CrossRef]
- Yang, Y.; Tao, B.; Liang, L.; Huang, Y.; Matocha, C.; Lee, C.D.; Sama, M.; Masri, B.E.; Ren, W. Detecting Recent Crop Phenology Dynamics in Corn and Soybean Cropping Systems of Kentucky. Remote Sens. 2021, 13, 1615. [Google Scholar] [CrossRef]
- Santana, C.T.C.d.; Adami, M.; Prudente, V.H.R.; Garcia, A.D.B.; Caldas, M.M. Using Harmonized Landsat Sentinel-2 Vegetation Indices to Estimate Sowing and Harvest Dates for Corn and Soybeans in Brazil. Remote Sens. 2025, 17, 2927. [Google Scholar] [CrossRef]
- Maranhão, R.L.A.; Caldas, M.M.; Kastens, J.; Watson, J.; Lollato, R.P. Assessing NDVI, Climate, and Management to Predict Winter Wheat Yields at Field Scale in Kansas, USA. Remote Sens. 2025, 17, 3500. [Google Scholar] [CrossRef]
- Shammi, S.A.; Meng, Q. Use Time Series NDVI and EVI to Develop Dynamic Crop Growth Metrics for Yield Modeling. Ecol. Indic. 2021, 121, 107124. [Google Scholar] [CrossRef]
- Li, P.; Li, W.; Shi, D.; Nath, A.J. Normalized Difference Red–NIR–SWIR: A New Sentinel-2 Three-Band Spectral Index for Mapping Freshly-Opened Swiddens in the Tropics. Ecol. Inform. 2024, 82, 102775. [Google Scholar] [CrossRef]
- Berra, E.F.; Fontana, D.C.; Yin, F.; Breunig, F.M. Harmonized Landsat and Sentinel-2 Data with Google Earth Engine. Remote Sens. 2024, 16, 2695. [Google Scholar] [CrossRef]
- Parreiras, T.C.; Bolfe, É.L.; Chaves, M.E.D.; Sanches, I.D.; Sano, E.E.; Victoria, D.d.C.; Bettiol, G.M.; Vicente, L.E. Hierarchical Classification of Soybean in the Brazilian Savanna Based on Harmonized Landsat Sentinel Data. Remote Sens. 2022, 14, 3736. [Google Scholar] [CrossRef]
- Geng, G.; Gu, Q.; Zhou, H.; Zhang, B.; He, Z.; Zheng, R. Random Forest Model that Incorporates Solar-Induced Chlorophyll Fluorescence Data Can Accurately Track Crop Yield Variations under Drought Conditions. Ecol. Inform. 2025, 85, 102972. [Google Scholar] [CrossRef]
- Yang, X.; Zhou, H.; Li, Q.; Fu, X.; Li, H. Estimating Canopy Chlorophyll Content of Potato Using Machine Learning and Remote Sensing. Agriculture 2025, 15, 375. [Google Scholar] [CrossRef]
- Lei, L.; Yang, Q.; Yang, L.; Shen, T.; Wang, R.; Fu, C. Deep Learning Implementation of Image Segmentation in Agricultural Applications: A Comprehensive Review. Artif. Intell. Rev. 2024, 57, 149. [Google Scholar] [CrossRef]
- Vera-Esmeraldas, A.; Pizarro-Oteíza, S.; Labbé, M.; Rojo, F.; Salazar, F. UAV-Based Spectral and Thermal Indices in Precision Viticulture: A Review of NDVI, NDRE, SAVI, GNDVI, and CWSI. Agronomy 2025, 15, 2569. [Google Scholar] [CrossRef]
- Wang, J.; Chen, C.; Wang, J.; Yao, Z.; Wang, Y.; Zhao, Y.; Sun, Y.; Wu, F.; Han, D.; Yang, G.; et al. NDVI Estimation Throughout the Whole Growth Period of Multi-Crops Using RGB Images and Deep Learning. Agronomy 2025, 15, 63. [Google Scholar] [CrossRef]


Disclaimer/Publisher’s Note: The statements, opinions and data contained in all publications are solely those of the individual author(s) and contributor(s) and not of MDPI and/or the editor(s). MDPI and/or the editor(s) disclaim responsibility for any injury to people or property resulting from any ideas, methods, instructions or products referred to in the content. |
© 2026 by the authors. Licensee MDPI, Basel, Switzerland. This article is an open access article distributed under the terms and conditions of the Creative Commons Attribution (CC BY) license.