Abstract
This research investigates the physical and mechanical properties of Codonopsis pilosula seedlings to provide fundamental mechanical data to address issues like high damage rates and low efficiency in mechanized transplanting. After precise physical parameter measurements, we classified the seedlings into four types: l-type, Y-type, V-type, and W-type. The l-type was the most common, accounting for a large proportion (80.95%) of the total, with a median length of approximately 270 mm, a median diameter of around 5.0 mm, and an average individual weight of about 2.83 g. Freshly harvested seedlings had an average moisture content and density within the typical range for this species. Using the Box–Behnken design method, we determined that the primary and secondary factors affecting tensile force (FN) and tensile strength (σ) were sample diameter (D), sample length (L), and loading speed (V). Sample diameter had a significant impact: FN increased rapidly as the diameter grew, while tensile strength (σ) decreased. The tensile strength of different regions of the seedling (i.e., head, middle, and tail) showed distinct characteristics, with relatively small deviations between theoretical and experimental values. For the whole seedling, errors in tensile force (FN) and strength (σ) between measured and theoretical values were below 5%. The average Young’s modulus, Poisson’s ratio, and shear modulus were also calculated. These mechanical property indices thus provide crucial references for future related research.
1. Introduction
Codonopsis pilosula stands as one of the principal traditional Chinese medicinal herbs, renowned for its efficacy in invigorating vital energy, earning it the laudatory title of “little ginseng”. Beyond its esteemed medicinal attributes, Codonopsis pilosula also possesses notable nourishing properties []. Globally, there are approximately 40 species of Codonopsis plants, with China hosting about 39 of these []. The primary regions for cultivating authentic Codonopsis pilosula are located in the arid and semi-arid areas of northwest China. Notably, Gansu Province emerges as the foremost cultivator of Codonopsis pilosula in China, contributing roughly 60% of the national output. Weiyuan, a prominent county renowned for its traditional Chinese medicine cultivation, has been bestowed with the honorific title of “Hometown of Codonopsis pilosula in China” by the Ministry of Agriculture and the Chinese Agricultural Society []. Currently, there exists a burgeoning global demand for Codonopsis pilosula, driving a steady annual expansion in its cultivation area. However, the seedlings of Codonopsis pilosula are characterized by their slender, soft, and rod-like structure, rendering them inherently fragile with easily damaged surfaces. Consequently, the transplantation process of Codonopsis pilosula predominantly relies on manual labor, with mechanization levels remaining exceedingly low. In light of these challenges, investigating the physical parameters and mechanical properties of Codonopsis pilosula seedlings assumes paramount importance. Such endeavors hold the potential to accelerate the development of specialized transplantation equipment for Codonopsis pilosula, thereby mitigating damage during the transplantation phase.
In recent years, numerous experts have investigated the physical and mechanical properties of crop straws, including wheat, corn, and rice [,]. Concurrently, research on the mechanical characteristics of rod-shaped crops—such as stem lettuce, white radish stems, enoki mushrooms, and scallions—has increased significantly [,,,]. A common thread in these studies is exploring how the physical and mechanical properties of agricultural materials influence various stages of agricultural processes, from harvesting to post-harvest handling and biomass processing. For instance, Ahmad et al. [] investigated the physical and mechanical properties of carrots to minimize waste during harvesting and post-harvest operations. Zheng et al. [] used a texture analyzer to perform creep and puncture tests on tomatoes at four maturity stages, analyzing mechanical disparities between their axial and radial directions and providing reliable mechanical data for end-effector design. Xiliang Zhang et al. [] conducted an in-depth study on tomato plant stems, which are composite materials with a microstructure consisting of the epidermis, cortex, vascular bundles, and pith. The study involved testing the moisture, tensile, and shear properties of different stem sections. Yu et al. [] performed tensile and shear tests on the stems of Miscanthus altissima (big bluestem), corn stover, intermediate wheatgrass, and switchgrass, measuring specific tensile and shear energies at failure to facilitate the design of efficient biomass processing equipment. Antoine Duval et al. [] explored hemp fiber mechanics by testing fibers from the stem’s base, middle, and apex. Middle-section fibers exhibited higher tensile strength and ultimate elongation than top/bottom fibers, though no difference in stiffness was observed. The mechanical behavior of hemp fibers was found to be strongly dependent on their diameter. Despite these significant contributions, a comprehensive understanding of the mechanical behavior of agricultural materials remains incomplete. A notable research gap exists regarding on the physical and mechanical properties of Codonopsis pilosula seedlings. Given its importance as a traditional Chinese medicinal herb, a detailed investigation into these properties is essential for optimizing its cultivation, harvesting, and processing techniques.
In order to design and develop a Codonopsis pilosula transplanter suitable for the terrain and agronomic requirements of the hilly and mountainous areas in northwest China, Codonopsis pilosula seedlings commonly planted in Gansu Province were selected as experimental subjects. We measured the physical parameters and tensile mechanical properties of 1-year-old Codonopsis pilosula seedlings. This study hypothesizes that the sample diameter (D), sample length (L), and loading speed (V) of 1-year-old Codonopsis pilosula seedlings will exert significant and interactive effects on the tensile force (FN) and tensile strength (σ) of the seedlings. Specifically, an increase in sample diameter is proposed to lead to an increase in both tensile force and tensile strength, as a larger cross-sectional area can bear greater load. Conversely, an increase in sample length may result in a decrease in tensile strength as the stress is distributed over a longer distance, potentially leading to more defects or weaknesses being exposed. Regarding loading speed, it is expected that a higher loading speed will induce a higher tensile force at failure, but may also reduce tensile strength as the material may not have sufficient time for plastic deformation and redistribute stress evenly. By testing these hypotheses, this study aims to provide a comprehensive understanding of the mechanical behavior of Codonopsis pilosula seedlings under tensile loading, which is crucial for designing and developing an efficient and damage-minimizing Codonopsis pilosula transplanter.
To test the above hypotheses and achieve the research goal, this study adopted the response surface methodology (RSM), selecting sample diameter (D), sample length (L), and loading speed (V) as test factors to investigate the effects of these three factors on test indicators of tensile force (FN) and tensile strength (σ). Using the Box–Behnken (BBD) design in Design-Expert 8.0.6 software, a three-factor, three-level response surface experimental design was conducted. Response surface methodology was employed to analyze the experimental data. Multiple regression fitting was performed on the response surface test results, followed by variance analysis of the regression equation and validation of the regression model’s residuals. Additionally, verification experiments were carried out to calculate the errors between the measured and theoretical values of tensile force and tensile strength, aiming to validate the significant influencing factors of the tensile force and tensile strength tests for Codonopsis pilosula seedlings, as well as the multiple regression fitting model. Finally, experiments and calculations were conducted on the Young’s modulus, Poisson’s ratio, and shear modulus of Codonopsis pilosula seedlings, providing critical mechanical data to support the optimization of Codonopsis pilosula transplanter design.
2. Materials and Methods
2.1. Basic Physical Characteristic Parameter Testing of Materials
2.1.1. External Dimensions
One-year-old Codonopsis pilosula seedlings were selected as experimental subjects. These seedlings were cultivated in the arid regions of northwest China, where they grew solely relying on natural rainfall with no artificial irrigation available due to local conditions. The cultivation soil was yellow loam, a typical soil type in the region. The seedlings were sown from Codonopsis pilosula seeds in March of the previous year, grew in the field for 12 months, and were freshly harvested in March of the current year for transplanting. At the time of harvest, the shoot apices of the seedlings were just beginning to initiate their second sprouting. Based on their structural characteristics, the freshly harvested seedlings were categorized into four morphological types—l-type, Y-type, V-type, and W-type, as illustrated in Figure 1. l-type seedlings accounted for the highest proportion (80.95%), while Y-type, V-type, and W-type seedlings constituted 10.12%, 8.33%, and 0.60%, respectively.
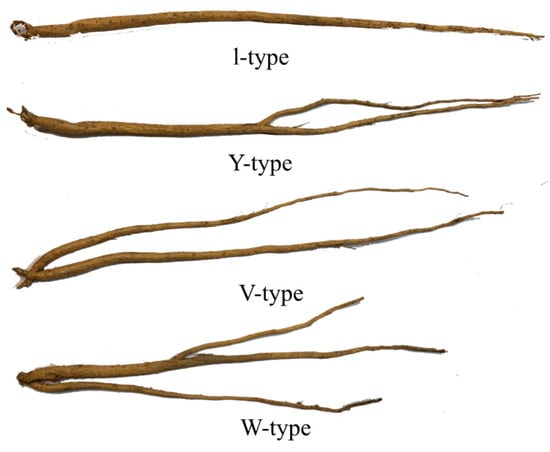
Figure 1.
Morphological types of seedlings.
The experimental material consisted of freshly harvested Codonopsis pilosula seedlings from the open-field planting base in Weiyuan County, Gansu Province. For experimental samples, healthy (disease-free) seedlings with l-shaped, straight growth forms were selected. Specifically, seedlings were sampled from representative subplots across the planting base (rather than the entire base or a single restricted subset) to ensure representativeness. During selection, potential blocking factors such as soil texture uniformity and positions along planting furrows were considered to minimize environmental bias. A total of 437 l-shaped seedlings were randomly chosen from the pre-selected healthy samples, and their seedling length, root diameter, and weight were measured in accordance with the local standard of Gansu Province DB62/T 2816-2017 [] Seedlings of Codonopsis pilosula for Traditional Chinese Medicine. Figure 2 presents a schematic diagram of the measurement setup for seedling length and root diameter. The seedling length was defined as the distance from the reed head to the tip of the main root, while the root diameter was measured at a point 1 cm below the reed head. A vernier caliper with an accuracy of 0.01 mm was used to measure external dimensions, and the results were subjected to statistical analysis, as depicted in Figure 3. The length and diameter conformed to a normal distribution, with median values of 270 mm and 5.0 mm, respectively. Weighing was conducted using a JT3003D electronic balance (accuracy: 1 mg), yielding an average single-seedling weight of 2.83 g.
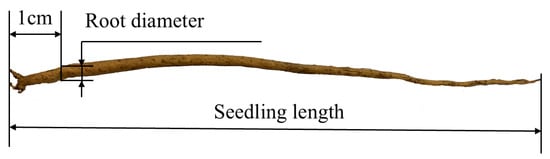
Figure 2.
Dimensional measurement diagram.
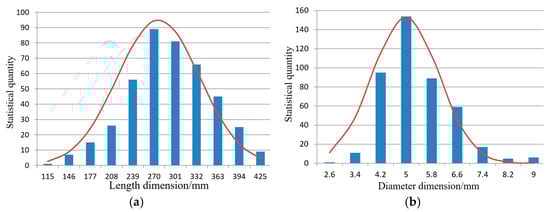
Figure 3.
Seedling dimensions. (a) Length dimension distribution. (b) Diameter dimension distribution.
Codonopsis pilosula seedlings with median dimensions were selected as standard samples. Diameter measurements were taken at 1 cm intervals along the seedlings. The 0–90 cm segment was designated as the head region, 90–180 cm as the middle region, and 180–270 cm as the tail region. The full-size profile of the standard sample is illustrated in Figure 4, with cross-sections of the head, middle, and tail regions shown in Figure 5. The cross-section consists of an outer epidermis, middle fleshy layer, and core ducts. The epidermis comprises the periderm (including cork layer, cork cambium, phelloderm) and phloem; the middle fleshy part primarily consists of xylem and interspersed parenchyma cells; the core is mainly composed of ducts, wood fibers, and wood parenchyma cells.
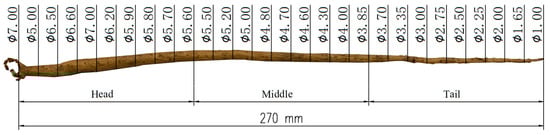
Figure 4.
Full-size diagram of seedlings.
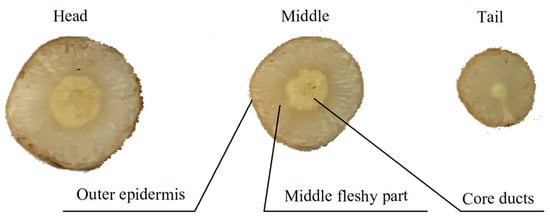
Figure 5.
Cross-sectional diagram of seedlings.
2.1.2. Moisture Content
The moisture content of seedlings serves as a crucial indicator for assessing seedling quality. Common moisture determination methods include the oven-drying weight loss method, chemical method, and distillation method. In this study, the oven-drying weight loss method was employed, with testing procedures conducted in accordance with GB/T 3543.6-1995 “Rules for agricultural seed testing–Determination of moisture content” []. The entire seedling was sectioned into 1 cm segments, which were dried in an oven maintained at 103 ± 2 °C for 8 h. Using a JT3003D electronic balance (accuracy: 1 mg), wet mass () was first recorded, followed by dry mass () after drying. Seedling moisture content () was then calculated using the wet-basis moisture content Formula (1):
where
—wet-basis moisture content of seedlings
—weight of seedlings before oven-drying
—weight of seedlings after oven-drying
To further investigate the changes in moisture content of Codonopsis pilosula seedlings after harvest, this study randomly selected 20 freshly harvested Codonopsis pilosula seedlings and positioned them in a climate-simulated environment replicating the transplanting area, with temperature maintained at 15 ± 5 °C and humidity at 35% ± 5%. Five seedlings were sampled every 8 h, each cut into sections to prepare a single sample. Moisture content was measured for five samples per time point, and average values were recorded (Table 1). As shown in Table 1, freshly harvested seedlings had an average moisture content of 75.26%, decreasing by 1.11% after 8 h, 3.22% after 16 h, and 7.75% after 24 h. During transplantation and testing, when seedlings were exposed aboveground for up to 8 h, the moisture content reduction rate remained below 2%.

Table 1.
Moisture content of seedlings.
2.1.3. Density
After the completion of moisture content determination, 5 Codonopsis pilosula seedlings were randomly selected for density measurement. Prior to measurement, each seedling was cut into segments, with no special treatment applied to the cut ends. The mass (m) of each selected Codonopsis pilosula seedling segment was measured individually using a JT3003D electronic balance, which has an accuracy of 1 mg. Following mass measurement, the volume of each seedling was determined using a measuring cylinder (accuracy: 0.1 mL) via the drainage method, with pure water as the measuring liquid. Since Codonopsis pilosula seedlings are non-porous and do not absorb pure water, the volume measurement procedure involved noting the initial liquid-level volume (V0) and then submerging the seedling segments completely in water using a fine needle. The submerged volume (V) was recorded immediately after submersion (submersion time < 1 s) to avoid potential water absorption. The volume of the seedlings was calculated, and their density was derived using Formula (2). The density measurement data for the 5 seedlings are presented in Table 2, revealing an average density of 925 kg/m3.
where
Table 2.
Density of Codonopsis pilosula seedlings.
ρ—Density of Codonopsis pilosula seedlings, in kg/m3
m—Mass of Codonopsis pilosula seedlings, in g
V—Submerged volume, in mL
V0—Initial reference liquid-level volume, in mL
2.2. The Methods of Mechanical Property Testing
When it comes to measuring the mechanical properties of flexible rod-shaped agricultural materials, including plant stems and rhizomes, tensile, compressive, shear, or three-point bending tests are predominantly employed. The tensile mechanical properties of Codonopsis pilosula seedlings represent the most fundamental mechanical characteristics, which can gauge the seedlings’ capacity to withstand external pressure and resist damage. In this study, tensile tests are chosen to investigate the mechanical properties of Codonopsis pilosula seedlings. This approach is beneficial for evaluating the performance of transplanting machinery and can effectively mitigate the mechanical damage that occurs during the mechanized transplanting process.
2.2.1. Experimental Materials and Equipment
This study selects Codonopsis pilosula seedlings in good growth condition. Specifically, seedlings with a length of 270 ± 20 mm, a diameter of 5.0 ± 0.25 mm, and a moisture content of 75 ± 2% are chosen. To minimize errors arising from the inherent characteristics of the seedlings, only those with similar sizes and moisture contents are included in the experiments.
The WDW-20 microcomputer-controlled electronic universal testing machine, manufactured by Jinan Chuanbai Instrument Equipment Co., Ltd., Shandong, China, is employed in this study to conduct tensile mechanical property tests []. This testing machine has a measurement accuracy of Class 0.5, an indicative relative error of ±0.5%, a resolution of 1/300,000, stepless speed regulation, and a displacement rate adjustment range of 0.005–500 mm/min.
2.2.2. Test Methods
Tensile mechanical tests were carried out at the Nanjing Agricultural Mechanization Research Institute under the Ministry of Agriculture and Rural Affairs. The objectives of these tests were to identify key factors that significantly influence the measurement of the mechanical properties of Codonopsis pilosula seedlings, enhance the accuracy of mechanical property measurements, and furnish essential parameters for the subsequent optimization of the design of the Codonopsis pilosula seedling transplanting machine. With reference to the standard GB/T 1447-2005 “Fiber-reinforced plastics composites–Determination of tensile properties” [], separate tensile tests were performed on Codonopsis pilosula seedlings. The formula for calculating tensile strength is presented in Formula (3).
In the formula:
—Tensile strength of Codonopsis pilosula seedlings, expressed in MPa.
FN—Tensile failure load of Codonopsis pilosula seedlings, measured in N.
A—Tensile cross-sectional area of Codonopsis pilosula seedlings, in mm2.
2.2.3. Tensile Mechanics Testing Process
The tensile test setup for Codonopsis pilosula seedlings is illustrated in Figure 6. In this study, a serrated stretching clamp is employed. However, Codonopsis pilosula seedling samples are susceptible to damage under the clamping force exerted by the clamp, which can lead to inaccurate tensile force test results. To address this issue, the samples are processed by removing half of the middle testing region. Consequently, the cross-sectional area of the Codonopsis pilosula seedlings becomes half of the original area. Additionally, the clamping sections at both ends of the samples are wrapped with sponge double-sided tape to minimize the damage caused by the clamp. Test data are collected using a desktop computer.
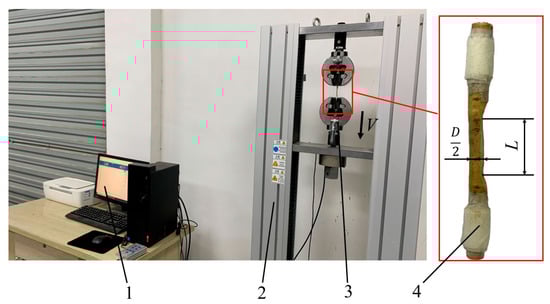
Figure 6.
Tensile test of Codonopsis pilosula seedlings. 1. Desktop computer. 2. WDW-20 type microcomputer-controlled electronic universal testing machine. 3. Serrated stretching clamp. 4. Codonopsis pilosula seedling samples.
2.2.4. Tensile Test Design
A central composite experimental design was employed to systematically evaluate the influence of three key factors—sample diameter (D), sample length (L), and loading speed (V)—on the tensile test indicators, specifically tensile force (FN) and tensile strength (σ). The factor level coding scheme is detailed in Table 3. For sample diameter (3–7 mm), the range selection was based on preliminary morphological measurements of Codonopsis pilosula seedlings. The median value (5 mm) served as the central point, while the upper (7 mm) and lower (3 mm) limits were established to encompass the typical size variations observed in the specimens. The sample length range (10–30 mm) was determined through two considerations: (1) shorter lengths minimized diameter discrepancies between the two ends of the test segment, and (2) lengths exceeding 30 mm introduced significant diameter variations. Additionally, this range accommodated the clamping length requirements of the testing apparatus. The loading speed range (5–25 mm/min) was optimized based on a review of relevant literature and preliminary experiments conducted using our universal testing machine. Speeds below 5 mm/min generated excessive redundant data, whereas speeds above 25 mm/min compromised data validity by reducing the number of usable measurements. This intermediate range thus represents an optimal balance between data quality and experimental efficiency. Using Design-Expert 8.0.6, a three-factor, three-level Box–Behnken(BBD) design was implemented, which is a type of response surface design. The design yielded 17 test points, including 5 central point tests. Each test was repeated three times, and average values were calculated. The detailed tensile test schemes and results for Codonopsis pilosula seedlings are shown in Table 4.
Table 3.
Level table of experimental factors for tensile test of Codonopsis pilosula seedlings.
Table 4.
Tensile test plan and results.
3. Results
3.1. Tensile Test Analysis
The following section presents the tensile test results. A multiple regression analysis was conducted on the results of the response-surface test to derive the regression equations that describe the effects of sample diameter (D), sample length (L), and loading speed (V) on the tensile force (FN) and tensile strength (σ) of Codonopsis pilosula seedlings.
The results of the variance analysis for the regression equations of tensile force (FN) and tensile strength (σ) in Codonopsis pilosula are presented in Table 5. As shown, the regression model for FN is highly significant (p < 0.01), while that for strength (σ) is significant (p < 0.05). The lack-of-fit terms for tensile force (FN) and strength (σ) are 0.4682 and 0.5226 (both p > 0.05), indicating high quadratic-term fitting accuracy. Sample diameter (D) exerts an extremely significant effect on both tensile force (FN) and strength (σ) (p < 0.01), whereas sample length (L) and loading speed (V) show no significant influence (p > 0.05). The coefficients of variation (CV) for tensile force (FN) and strength (σ) models are 15.53% and 14.20%, respectively, suggesting stable data and reliable results. The determination coefficients (R2) and adjusted determination coefficients (Adj R2) for tensile force (FN) testing are 0.9040 and 0.7805, respectively, reflecting that 90.40% of the variation in tensile force can be explained by the model, with the adjusted value accounting for the number of independent variables. For strength (σ) testing, the R2 is 0.8772 and Adj R2 is 0.7194, indicating 87.72% of the variation in strength is explainable by the model, with the adjusted coefficient correcting for overestimation due to variable count. Both results confirm good agreement between predicted and actual values for both tensile force and strength measurements. The order of factor importance is sample diameter (D), followed by sample length (L), and loading speed (V).
Table 5.
Variance analysis of regression equation.
To ensure the validity of the regression models for tensile force (FN) and tensile strength (σ), it is essential to validate their residuals. Figure 7a,b present the normal probability plots of the residuals for tensile force (FN) and tensile strength (σ), respectively. The residual points for both tensile force (FN) and tensile strength (σ) in these figures are closely clustered around the red line, and the model errors conform to the normal distribution requirement. Figure 8a,b depict the residuals versus the run order for tensile force (FN) and tensile strength (σ). In these figures, the residual points for tensile force (FN) and tensile strength (σ) show no discernible trend and are randomly scattered within ±3 times the standard deviation (indicated by the red line). This indicates that the residuals satisfy the “independence” assumption. The model adequately fits the data without omitting any significant factors, and there is no systematic bias in the error term. Consequently, the use of the ordinary least squares method to fit Equations (3) and (4) is justified, as these assumptions are fully met. When these assumptions hold true, unbiased coefficient estimates with the minimum variance are obtained, which further bolsters confidence in the current model.
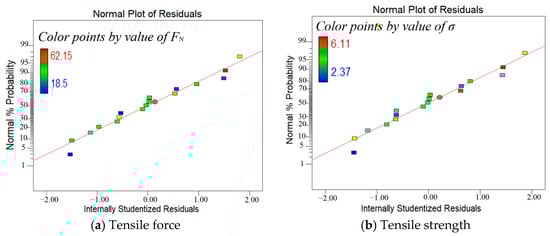
Figure 7.
Normal probability plot of residuals.
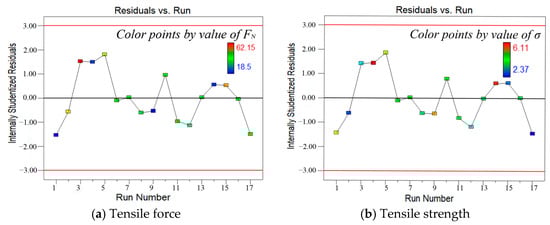
Figure 8.
Plot of residuals versus run order.
To further explore the influence of individual factors, namely sample diameter (D), sample length (L), and loading speed (V), on the tensile force (FN) test indicators, Figure 9a–c illustrates the effects of each single factor on the FN test indicators. Figure 9c and Figure 10a,b the influence of interactive factors on the tensile force test indicator. As evident from Figure 9a and Figure 10a,b, the sample diameter (D) exerts a highly significant impact on the tensile force (FN) of Codonopsis pilosula seedlings, with FN increasing rapidly as the sample diameter (D) increases. From Figure 9b and Figure 10b,c, it is observed that the tensile force (FN) of Codonopsis pilosula seedlings shows negligible variation with changes in sample length (L), indicating that the sample length (L) has no significant effect on FN. Similarly, Figure 9c and Figure 10b,c reveals that the loading speed (V) has no significant influence on the tensile force (FN) of Codonopsis pilosula seedlings, as FN remains almost constant with varying loading speeds (V).
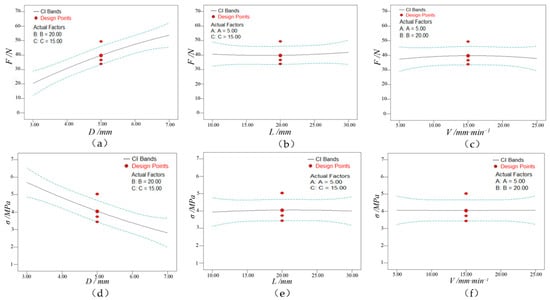
Figure 9.
Influence of single factors on tensile force test indicator and tensile strength test indicator. (a) Influence of sample diameter (D) on the tensile force test indicator. (b) Influence of sample length (L) on the tensile force test indicator. (c) Influence of loading speed (V) on the tensile force test indicator. (d) Influence of sample diameter (D) on tensile strength test indicator. (e) Influence of sample length (L) on the tensile strength test indicator. (f) Influence of loading speed (V) on the tensile strength test indicator.
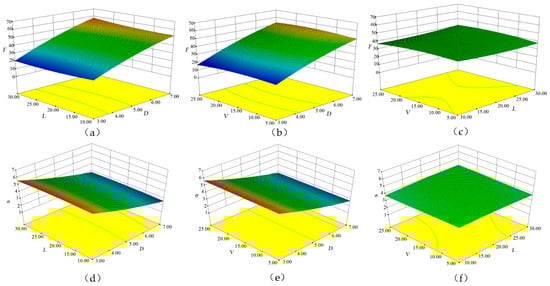
Figure 10.
Influence of interactive factors on tensile force test indicator and tensile strength test indicator. (a) Influence of sample diameter (D) and sample length (L) on the tensile force test indicator. (b) Influence of sample length (L) and loading speed (V) on the tensile force test indicator. (c) Influence of loading speed (V) and sample length (L) on the tensile force test indicator. (d) Influence of sample diameter (D) and sample length (L) on tensile strength test indicator. (e) Influence of sample length (L) and loading speed (V) on the tensile strength test indicator. (f) Influence of loading speed (V) and sample length (L) on the tensile strength test indicator.
To further explore the influence of individual factors, namely sample diameter (D), sample length (L), and loading speed (V), on the tensile strength (σ) test index, Figure 9d–f illustrates the effects of each single factor on the tensile strength (σ) of Codonopsis pilosula seedlings. Figure 10d–f the influence of interactive factors on the tensile strength test indicator. As evident from Figure 9d and Figure 10d,e the sample diameter (D) exerts a highly significant impact on the tensile strength (σ) of Codonopsis pilosula seedlings, with the tensile strength (σ) decreasing rapidly as the sample diameter (D) increases. Furthermore, as shown in Figure 9d,e and Figure 10f neither the sample length (L) nor the loading speed (V) has a significant effect on the tensile strength (σ) of Codonopsis pilosula seedlings, as the tensile strength (σ) remains almost constant with variations in sample length (L) and loading speed (V).
3.2. Tensile Verification Test
Based on the calibration results from the model development phase described above, which confirmed the model’s reliability in fitting the relationship between variables, we proceeded to the validation phase to further assess its predictive performance. Specifically, the calibration results indicated that the diameter of Codonopsis pilosula seedlings exhibited a highly significant impact on both tensile force and tensile strength, prompting the design of subsequent verification tests. Verification tests were conducted with a sample length (L) of 20 mm and loading speed (V) of 15 mm/min. Seedlings were divided into three segments—head, middle, tail—with two test points per segment (six points total). Specifically, head segment test points had diameters of 6.6 mm and 5.9 mm; middle segment, 5.0 mm and 4.6 mm; tail segment, 3.0 mm and 2.25 mm. Tensile force and strength were measured at these points (Table 6). For the head segment, measured tensile force ranged from 46.4 N to 52.0 N (theoretical vs. measured error: 0.75–1.16%), and tensile strength from 3.04 MPa to 3.39 MPa (error: 0.43–1.47%). The middle segment showed 35.4–38.8 N (error: 0.67–2.05%) for force and 3.95–4.26 MPa (error: 1.21–2.05%) for strength. The tail segment had 12.2–20.2 N (error: 1.02–3.84%) and 5.72–6.14 MPa (error: 0.21–4.72%). Overall, all measured-to-theoretical errors for tensile force and strength were <5%, confirming the regression model’s reliability.
Table 6.
Test results of tensile verification test.
As illustrated in Figure 11, the relationship between tensile strength and axial deformation is depicted for six test points. Within a deformation range of 2 mm, the head, middle, and tail segments of Codonopsis pilosula seedlings all exhibit elastic behavior. As the deformation extends to the range of 2–4 mm, they enter the yielding stage. Once the deformation surpasses 4 mm, the tensile strength progressively attains its peak value, indicating the onset of the failure stage.
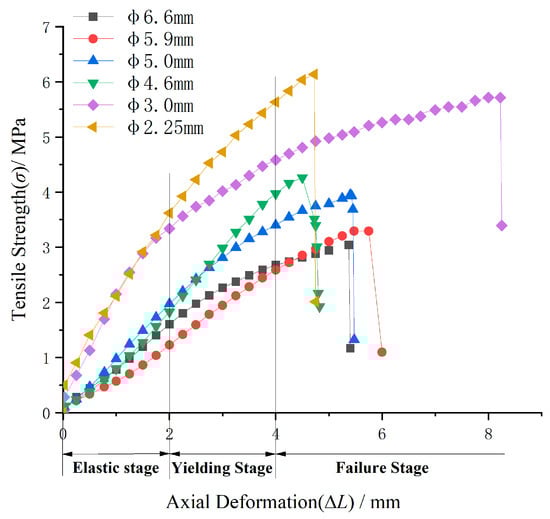
Figure 11.
Relationship between tensile strength and axial deformation of Codonopsis pilosula seedlings.
3.3. Young’s Modulus Parameter Test
The Young’s modulus was calculated based on the tensile strength values obtained at each test point for tensile deformations of 1 mm, 1.5 mm, and 2 mm. The calculation of Young’s modulus is presented in Formula (6).
In the formula:
—Tensile axial strain of Codonopsis pilosula seedlings
—Axial deformation of Codonopsis pilosula seedlings during tension, in mm
L—Tensile test length of Codonopsis pilosula seedlings, in mm
The test values of Young’s modulus for each test point are presented in Table 7. Notably, the Young’s modulus exhibits a gradual increase from the head to the tail of the Codonopsis pilosula seedlings. Specifically, the Young’s modulus at the head ranges from 11.41 MPa to 16.02 MPa, with an average value of 13.800 MPa. At the central part, it ranges from 15.89 MPa to 19.83 MPa, averaging 18.390 MPa. In contrast, the Young’s modulus at the tail ranges from 33.39 MPa to 43.01 MPa, with an average of 38.708 MPa. Overall, the average Young’s modulus of the Codonopsis pilosula seedlings is 23.633 MPa.
Table 7.
Young’s modulus test data of Codonopsis pilosula seedlings.
3.4. Poisson’s Ratio Parameter Test
A vernier caliper (with a precision of 0.01 mm) was employed to measure the diameter deformation of the seedlings at each test point corresponding to length elongations of 1 mm, 1.5 mm, and 2 mm during tensile testing. The calculation of Poisson’s ratio is presented in Formula (7).
In the formula:
—Poisson’s ratio of Codonopsis pilosula seedlings
—Transverse strain of Codonopsis pilosula seedlings under tension
—Diameter deformation of Codonopsis pilosula seedlings, in mm
D—Original diameter of Codonopsis pilosula seedlings, in mm
The Poisson’s ratio test values for each test point are presented in Table 8. Notably, the Poisson’s ratio remains approximately constant along the length of the Codonopsis pilosula seedlings, with average values of 0.468 at the head, 0.470 in the middle, and 0.463 at the tail. The overall average Poisson’s ratio for the seedlings is 0.467.
Table 8.
Poisson’s ratio test data of Codonopsis pilosula seedlings.
3.5. Shear Modulus Parameter Test
The shear modulus was calculated using the average values of Young’s modulus and Poisson’s ratio obtained from tensile deformations of 1 mm, 1.5 mm, and 2 mm at each test point. The calculation of the shear modulus is presented in Formula (8).
In the formula:
G—Shear modulus of Codonopsis pilosula seedlings
The shear modulus test values measured at each test point are presented in Table 9. Notably, there is a significant increase in the shear modulus from the head to the tail of the Codonopsis pilosula seedlings. Specifically, the average shear modulus is 4.698 MPa at the head, 6.254 MPa in the middle, and 13.228 MPa at the tail. The overall average shear modulus for the entire seedlings is 8.054 MPa.
Table 9.
Shear modulus test data of Codonopsis pilosula seedlings.
4. Discussion
In this study, we systematically investigated the physical and mechanical properties of Codonopsis pilosula seedlings to establish fundamental material mechanics datasets. This research is critical for deciphering the interaction mechanisms between seedlings and mechanical equipment during key agricultural processes, including harvest, single-plant separation, transportation, storage, and transplantation. By elucidating these dynamic interactions, we aim to address the persistent challenges of high seedling damage rates and low operational efficiency in mechanized farming, thereby providing a robust scientific basis for advancing agricultural mechanization technologies.
Through a series of tests, it was determined that the primary and secondary factors affecting tensile force (FN) and tensile strength (σ) were sample diameter (D), sample length (L), and loading speed (V). The sample diameter (D) exerted a highly significant impact on both the tensile force (FN) and tensile strength (σ) of Codonopsis pilosula seedlings. As the sample diameter increased, the tensile force (FN) exhibited a rapid upward trend, while the tensile strength (σ) decreased rapidly. This inverse relationship can be attributed to the fact that a larger diameter implies a greater cross-sectional area, which allows the seedling to withstand more force before breaking (increasing FN). However, as the diameter grows, internal structural inconsistencies or defects may become more pronounced, leading to a reduction in the overall strength per unit area (decreasing σ). In contrast, the sample length (L) and loading speed (V) had negligible effects on both tensile force (FN) and tensile strength (σ). The lack of significant change in these properties with variations in sample length and loading speed suggests that the mechanical behavior of Codonopsis pilosula seedlings is relatively insensitive to these factors within the tested ranges. This could be due to the uniform distribution of internal structures along the length of the seedling and the fact that the loading speed did not reach a threshold that would trigger significant changes in the material’s response.
The Young’s modulus and shear modulus are relatively low at the seedling head but relatively high at the tail, likely attributed to their inherent biological characteristics. The head has a comparatively high proportion of fleshy tissue on its surface, resulting in a limited capacity to withstand tensile and shear deformation and demonstrating greater elasticity. Conversely, the tail contains a relatively low proportion of fleshy parts, making it less susceptible to deformation under tensile and shear forces and displaying enhanced rigidity. A nearly constant Poisson’s ratio across the seedling’s head, middle, and tail sections suggests uniform transverse deformation behavior, likely reflecting consistent cellular structure and material composition throughout the seedling.
Interpreting these results within the broader context of previous studies and our working hypotheses, it becomes evident that the basic physical parameters and mechanical characteristics of the seedlings, particularly the diameter, play a pivotal role in determining their mechanical behavior during handling and processing. The insights gained from this study have significant implications for the design and optimization of transplanting equipment for Codonopsis pilosula cultivation. Given the crucial role of sample diameter in determining the mechanical behavior of seedlings, transplanting equipment should be designed to handle seedlings of varying diameters with care. For example, gripping mechanisms could be adjustable to accommodate various diameters, ensuring a firm but gentle hold to minimize damage. In conclusion, our study on the basic physical parameters and mechanical characteristics of Codonopsis pilosula seedlings has provided valuable insights into the factors influencing their mechanical behavior and their implications for mechanized cultivation.
5. Conclusions
Codonopsis pilosula seedlings can be classified into four distinct types, with the l-type accounting for the largest proportion at 80.95%. Their key physical characteristics include a median length of 270 mm, a median diameter of 5.0 mm, an average weight per seedling of 2.83 g, an initial moisture content of 75.26% in fresh seedlings (which decreases by 1.11% after 8 h), and an average density of 925 kg/m3. When comparing measured values of tensile force and tensile strength at the head, middle, and tail of the seedlings with theoretical predictions, discrepancies below 5%. Tensile force decreases from the head (ranging from 46.4 to 52.0 N) to the tail (ranging from 12.2 to 20.2 N), whereas tensile strength rises from the head (ranging from 3.04 to 3.39 MPa) to the tail (ranging from 5.72 to 6.14 MPa). In terms of mechanical properties, consistent trends are observed along the seedling axis: both Young’s modulus and shear modulus markedly increase from the head to the tail (with mean values spanning from 13.800 to 38.708 MPa for Young’s modulus and from 4.698 to 13.228 MPa for shear modulus), while Poisson’s ratio remains relatively constant (averaging 0.467).
These findings directly inform the optimization of transplanting machinery. Considering the varying diameters of seedlings and the longitudinal variations in mechanical properties, the gripping mechanism of the transplanter should be adjustable. This enables a secure yet gentle hold on seedlings of different sizes, minimizing damage during handling. Such a mechanism could adjust grip force and contact area based on real-time sensor data (e.g., diameter measurements at the seedling head/tail), ensuring a firm yet gentle hold to minimize physical damage. This adaptability aligns with precision agriculture objectives by improving seedling survival rates and reducing resource waste during transplanting.
This study was conducted under laboratory-controlled conditions; future work should validate mechanical properties under field environments (e.g., varying soil moisture, temperature). Additionally, the long-term effects of gripping force on seedling growth and root development warrant investigation. Expanding the analysis to include other species with similar morphological traits would further generalize the design principles for transplanting equipment.
Author Contributions
Conceptualization, Q.Y. and Y.G.; methodology, Y.W., Q.Y., and J.H.; software, Z.W. and Q.Y.; validation, X.C. and Y.G.; formal analysis, Q.Y., Y.W., X.C., J.H., and Z.W.; investigation, Q.Y. and Y.W.; resources, Y.G. and Q.Y.; data curation, Q.Y. and Y.W.; writing—original draft preparation, Q.Y. and J.H.; writing—review and editing, Q.Y., Y.W., and X.C.; visualization, Q.Y. and Y.W.; supervision, Z.W. and Y.G.; project administration, Q.Y. and J.H.; funding acquisition, Q.Y. and Y.G. All authors have read and agreed to the published version of the manuscript.
Funding
This research was supported by the Key Research and Development Program of the Xinjiang Uygur Autonomous Region, China (2023B02017), the China Agriculture Research System (CARS-25), the Special Fund for Basic Scientific Research of the Chinese Academy of Agricultural Sciences (S202101-03), and the Gansu Provincial Pilot Project for the Integration of Agricultural Machinery R&D, Manufacturing, Promotion, and Application—Lightweight and Simplified Traditional Chinese Medicinal Herb Film-Side Transplanter Maturation and Standardization Project (Project Nos. 9-1).
Data Availability Statement
The data presented in this study will be made available upon reason-able request.
Acknowledgments
We sincerely appreciate the careful and precise review by the anonymous reviewers and editors.
Conflicts of Interest
The authors declare that they have no competing interests.
References
- He, R.P.; Jin, Z.; Ma, R.Y.; Hu, F.D.; Dai, J.Y. Network pharmacology unveils spleen-fortifying effect of Codonopsis Radix on different gastric diseases based on theory of “same treatment for different diseases” in traditional Chinese medicine. Chin. Herb. Med. 2021, 13, 189–201. [Google Scholar] [CrossRef] [PubMed]
- Wang, H.Y.; Chen, Y.; Guo, F.X.; Liang, W.; Dong, P.B.; Cheng, J.L. Research progress on diversity of Codonopsis genus resources and innovation of medicinal germplasm. Chin. Tradit. Herb. Drugs 2024, 55, 978–988. [Google Scholar]
- Yu, Q.X.; Zhang, L.H.; Cai, Z.P.; Liu, Y.; Gong, Y.; Cao, G.Q. Present status and prospect of mechanized production of Rhizome Chinese herbal medicine in Gansu Province. J. Chin. Agric. Mech. 2023, 44, 29–36. [Google Scholar]
- Du, D.D. Research on mechanics properties of crop stalks: A review. Int. J. Agric. Biol. Eng. 2016, 9, 10–19. [Google Scholar] [CrossRef]
- Shah, D.U.; Reynolds, T.P.S.; Ramage, M.H. The strength of plants: Theory and experimental methods to measure the mechanical properties of stems. J. Exp. Bot. 2017, 68, 4497–4516. [Google Scholar] [CrossRef] [PubMed]
- Shen, C.; Li, X.W.; Tian, K.P.; Zhang, B.; Huang, J.C.; Chen, Q.M. Experimental analysis on mechanical model of ramie stalk. Trans. Chin. Soc. Agric. Eng. (Trans. CSAE) 2015, 31, 26–33. [Google Scholar]
- Fan, W.; Zhang, F.G.; Yan, J.W.; Feng, C. Experimental Study on Tensile Mechanical Properties of Mature White Radish Tassel. J. Agric. Mech. Res. 2023, 45, 137–143. [Google Scholar]
- Gao, W.S.; Song, W.D.; Wang, J.L.; Ding, T.H.; Wang, M.Y.; Wu, J.J. Study on the tensile test of Flammulina velutipes. J. Chin. Agric. Mech. 2020, 41, 106–111. [Google Scholar] [CrossRef]
- Sun, G.Q.; Pan, Y.F.; Wang, F.Y. Study on Physical and Mechanical Properties of Green Onion. J. Agric. Mech. Res. 2022, 44, 159–165, 172. [Google Scholar]
- Ahmad, J.; Yousef, A.; Mesri, T.G. Determination of physical and mechanical properties of carrot in order to reduce waste during harvesting and post-harvesting. Food Sci. Nutr. 2018, 6, 1898–1903. [Google Scholar] [CrossRef]
- Zheng, S.; He, M.; Jia, X.; Zheng, Z.; Wu, X.; Weng, W. Study on mechanical properties of tomatoes for the end-effector design of the harvesting robot. Agriculture 2023, 13, 2201. [Google Scholar] [CrossRef]
- Zhang, L.; Chen, C.; Wu, S. Mechanical testing of tomato plant stem in relation to structural composition. Agric. Res. 2016, 5, 236–245. [Google Scholar] [CrossRef]
- Yu, M.; Lgathinathane, C.; Hendrickson, J.; Sanderson, M.; Liebig, M. Mechanical shear and tensile properties of selected biomass stems. Trans. ASABE 2014, 57, 1231–1242. [Google Scholar] [CrossRef]
- Duval, A.; Bourmaud, A.; Augier, L.; Baley, C. Influence of the sampling area of the stem on the mechanical properties of hemp fibers. Mater. Lett. 2011, 65, 797–800. [Google Scholar] [CrossRef]
- DB62/T 2816-2017; Seedlings of Codonopsis pilosula for Traditional Chinese Medicine. Gansu Province Local Standard: Lanzhou, China, 2017.
- GB/T 3543.6-1995; Rules for Agricultural Seed Testing–Determination of Moisture Content. China National Standardization Administration: Beijing, China, 1995.
- The WDW-20 Microcomputer-Controlled Electronic Universal Testing Machine [Product Introduction]. Available online: http://www.jncbtest.com/show_8/55 (accessed on 15 July 2025).
- GB/T 1447-2005; Fiber-Reinforced Plastics Composites–Determination of Tensile Properties. China National Standardization Administration: Beijing, China, 2005.
Disclaimer/Publisher’s Note: The statements, opinions and data contained in all publications are solely those of the individual author(s) and contributor(s) and not of MDPI and/or the editor(s). MDPI and/or the editor(s) disclaim responsibility for any injury to people or property resulting from any ideas, methods, instructions or products referred to in the content. |
© 2025 by the authors. Licensee MDPI, Basel, Switzerland. This article is an open access article distributed under the terms and conditions of the Creative Commons Attribution (CC BY) license (https://creativecommons.org/licenses/by/4.0/).