Article

A Multi-Objective Genetic Algorithm for Retrieving the Parameters of Sweet Pepper (Capsicum annuum) from the Diffuse Spectral Response

by
Freddy Narea-Jiménez
1,*,
Jorge Castro-Ramos
2 and
Juan Jaime Sánchez-Escobar
3,*
1
Facultad de Ciencias de la Electrónica, Benemérita Universidad Autónoma de Puebla, Puebla C.P. 72570, Mexico
2
Coordinanción de Óptica, Instituto Nacional de Astrofísica, Óptica y Electrónica, Puebla C.P. 72840, Mexico
3
Subdirección de Investigación, Centro de Enseñanza Técnica Industrial, Guadalajara C.P. 44638, Mexico
*
Authors to whom correspondence should be addressed.
AgriEngineering 2025, 7(9), 284; https://doi.org/10.3390/agriengineering7090284
Submission received: 11 July 2025 / Revised: 20 August 2025 / Accepted: 26 August 2025 / Published: 2 September 2025
(This article belongs to the Section Sensors Technology and Precision Agriculture)

Abstract

In this paper, we present a set of experimental data (SESD) from Capsicum annuum with two different pigmentations, obtained using a self-made computed tomography spectrometer (CTIS), which adapt to the optical model of radiative transfer. An optical model is based on the directional-hemispheric reflectance and transmittance of a turbid medium with plane-parallel layers. To estimate the fruit’s primary pigments (Chlorophyll, Carotenoids, Capsanthin, and Capsorubin), we use the optical model combined with a numerical search and optimization method based on a robust and efficient multi-objective genetic algorithm (GA), allowing us to find the closest solution to the global minimum; and the inverse problem is solved by obtaining the best fit of the analytical function defined in the SESD optical model. Values of pigment concentrations retrieved with the proposed GA show a total difference of 2.51% for green pepper and 5.60% for red pepper compared with those reported in the literature.

Graphical Abstract

1. Introduction

Capsicum annuum, commonly known as sweet or bell pepper, is a species native to South America and widely cultivated worldwide [1,2,3]. In 2018, global production reached 716 thousand tons, with Mexico ranking ninth, producing 9 thousand tons and positioning itself among the 11 leading pepper-exporting countries [4]. Bell peppers exhibit significant genetic variability and a wide range of colors, determined by the concentration of natural pigments (Lutein, Violaxanthin, β-Carotene, Zeaxanthin, Antheraxanthin, Capsanthin, and Capsorubin), which are key indicators of ripeness and freshness in the agricultural sector [5,6,7]. From a nutritional perspective, the intake of this fruit provides essential compounds for the human body, directly associated with the concentration of the pigments responsible for its coloration [3].
Several studies have highlighted the functional health-promoting properties of Carotenoids in Capsicum, particularly due to their role as lipophilic antioxidants. Mohd Hassan et al. [8] describe their protective effects against degenerative diseases, supported by in vitro, in vivo, and clinical studies. Similarly, Villa-Rivera and Ochoa-Alejo [9] emphasize the nutraceutical benefits of these compounds, including anti-inflammatory, cancer-preventive, anti-obesity, and cardiovascular protective effects, underscoring the importance of accurately determining Carotenoid content in plant tissues.
Currently, pigment quantification is primarily performed using destructive techniques such as high-performance liquid chromatography (HPLC), which require complex and costly sample preparation procedures [6,10,11,12,13,14,15]. In response to these limitations, non-invasive optical methods have emerged, such as front-face fluorescence spectroscopy (FFFS) and spectral imaging (SI) techniques, which enable the evaluation of biophysical and biochemical characteristics of tissues without damaging the sample [5,16,17,18,19]. However, many of these techniques rely on specific instrumental configurations, temporal scanning, or narrowband filters, limiting their applicability in dynamic or field environments.
In this study, we propose an alternative methodology based on the use of a computed tomography imaging spectrometer (CTIS), which captures both spatial and spectral information in a single frame, without moving parts or narrowband filters, maximizing acquisition efficiency [20,21,22,23,24]. To interpret the spectral data obtained, plant tissue is considered as an optically complex system composed of scattering particles (e.g., cell membranes) and absorbing particles (e.g., pigments) [25]. Under this framework, we employ the PROSPECT radiative transfer model, originally designed for leaves [26], but here calibrated in the spectral range of 500 to 650 nm, where reflectance peaks associated with Chlorophyll and Carotenoids are most evident [27,28,29].
The model calibration is optimized using a multi-objective genetic algorithm (GA) strategy, which solves the inverse problem by finding the best fit between the calibrated PROSPECT model and the experimental spectral data (SESD) obtained from CTIS [30,31,32,33]. GA simultaneously estimates the concentrations of the main pigments present in fresh Capsicum annuum fruits of green and red coloration. The results obtained with this non-invasive methodology are comparable to the average pigment concentrations reported in the literature using destructive HPLC-based techniques [7,8]. Thus, we present an efficient, adaptable, and non-destructive approach for spectral characterization of plant tissues, with potential applications in precision agriculture.

2. Materials and Methods

2.1. Data Acquisition

We used our CTIS system, previously reported by Narea-Jiménez et al. [34], which captures SI instantaneously to obtain the experimental data. CTIS operation uses a bi-directional diffraction grating that allows the light reflecting from an object to be split into several spectral projections projected onto a single image plane [20,21,22]. In our case, we illuminated the samples with two 60-watt halogen bulbs placed behind diffuser screens to ± 45 from the optical axis, producing uniform illumination on samples placed at 63 cm from the objective lens CTIS, as shown in Figure 1a. To record the Capsicum annuum spectra samples in a raw image, a D5600 Nikon camera (Nikon Corporation, Tokyo, Japan) is used with an AF-S DX Micro NIKKOR imaging lens (Nikon Corporation, Tokyo, Japan) (see Figure 1b). Such images are processed using an iterative method of Maximization–Expectation (ME) optimized [34] and implemented in MATLAB® version R2024a (The MathWorks, Natick, MA, USA), which obtains a data cube of 250 × 250 pixels across 76 wavelength channels, containing the spectral intensity information of the sample f ^ m ( n x , n y , n λ ) over the 500–650 nm range with a spectral resolution of 2 nm, as shown in Figure 1c.
The information from the sample’s spectral intensity cube f ^ m ( n x , n y , n λ ) is transformed into a total reflectivity cube M ^ s ( n x , n y , n λ ) following the methodology proposed in the work of Narea-Jiménez et al. [34]. In this way, as shown in Figure 1, a diffuse reflectance spectral cube R D ( n z x , n z y , n λ ) is expressed as follows:
R D ( n x , n y , n λ ) = n λ = 1 76 M ^ s ( n x , n y , n λ ) M ^ O ( n x , n y , n λ ) M ^ B ( n x , n y , n λ ) M ^ O ( n x , n y , n λ ) ,
where M ^ s ( n x , n y , n λ ) is the total reflectivity cube of the sample [24], M ^ O ( n x , n y , n λ ) represents the reflectivity cube of a dark plate with a reflectivity of less than 2%, and M ^ B ( n x , n y , n λ ) is the spectral information cube of the reflectivity of a white reference plate reflecting 99% of the light, made with Barium sulfate ( B a S O 4 ) from MEYER® Chemical Reagents (Blue Springs, MO, USA).
The average diffuse reflectance R ¯ D ( λ ) is extracted from the data cube (Equation  (1)) by averaging a 5 × 5 voxel neighborhood, which provides a representative spectral reflectance signature of the bell pepper samples. From this R ¯ D ( λ ) , we construct the SESD, which we fit to the PROSPECT radiative transfer model calibrated to the experimental opacity conditions of the bell pepper tissues. We verified the spectral measurements using a commercial Ocean Optics® USB4000 spectrometer (Ocean Optics, Inc., Orlando, FL, USA) equipped with an integrating sphere for reflectance (ISP-R).

2.2. PROSPECT Radiative Transfer Model

PROSPECT is a radiative transfer model for individual leaves that considers directional hemispherical reflectance (DHR) and directional hemispherical transmittance (DHT) [35], which we will denote during the development of this paper by the variables R and T, respectively. PROSPECT is based on the extended multi-plate model of Allen’s single-plate model [36] using the system of Stokes equations. This model was initially employed to simulate the optical properties of the sheet [26]. Unlike the original model [37], instead of a single layer, a stack of N plates separated by N 1 air gaps forms one sheet in the multi-plate model. This model was initially employed to simulate the optical properties of the leaf [26].
PROSPECT considers the mesophyll structure parameter (N) that characterizes the number of homogeneous elemental layers constituting the leaf. Each basic layer is described by the refractive index of the material n ( λ ) and by an absorption coefficient μ a ( λ ) calculated as the sum of the specific absorption coefficients of each constituent weighted by its corresponding content (concentration).
PROSPECT model initially considered three groups of pigments that constitute the absorption coefficient of a leaf. Chlorophyll is associated with green coloration, Carotenoids are related to yellow–orange coloration, and Anthocyanin is related to red coloration. We adapted this model to the physicochemical conditions for Capsicum annuum, employing an absorption coefficient μ a ( λ ) based on its primary pigments: Chlorophyll, Carotenoids (Lutein, Violaxanthin, β-Carotene, Zeaxanthin, and Antheraxanthin), Capsanthin, and Capsorubin [8]. Thus, the following model is proposed:
μ a λ = w = 1 M C w ϵ w λ ,
where C w is the concentration [ μ g/cm3], ϵ w ( λ ) is the specific absorption coefficient [cm2/ μ g], and w = 1 , 2 , 3 , 4 represent each pigment associate with the Capsicum annuum, 1: Chlorophyll ( C a b ), 2: Carotenoids ( C a r ), 3: Capsanthin ( C a p 1 ), and 4: Capsorubin ( C a p 2 ). The specific absorption coefficients ϵ w ( λ ) for Chlorophyll and Carotenoids were obtained from reference [38], while the coefficients for Capsanthin and Capsorubin were taken from reference [6].
Capsicum annuum is a fruit formed by a pericarp constituted by three layers: exocarp, mesocarp, and endocarp. The mesocarp, the intermediate layer of the pericarp, is composed of parenchymatous tissue that originates from the mesophyll cells [39]. Our model does not consider the water absorption effects since the study is carried out in the visible spectral range, and water strongly influences the infrared’s spectral response [40,41,42]. The above statement allows us to continue considering the structure parameter (N), which is now associated with the mesocarp.
The PROSPECT model adapts to different experimental setups [32,43], so we calibrated the model to adjust to the response of diffuse reflectance of an opaque medium such as Capsicum annuum.
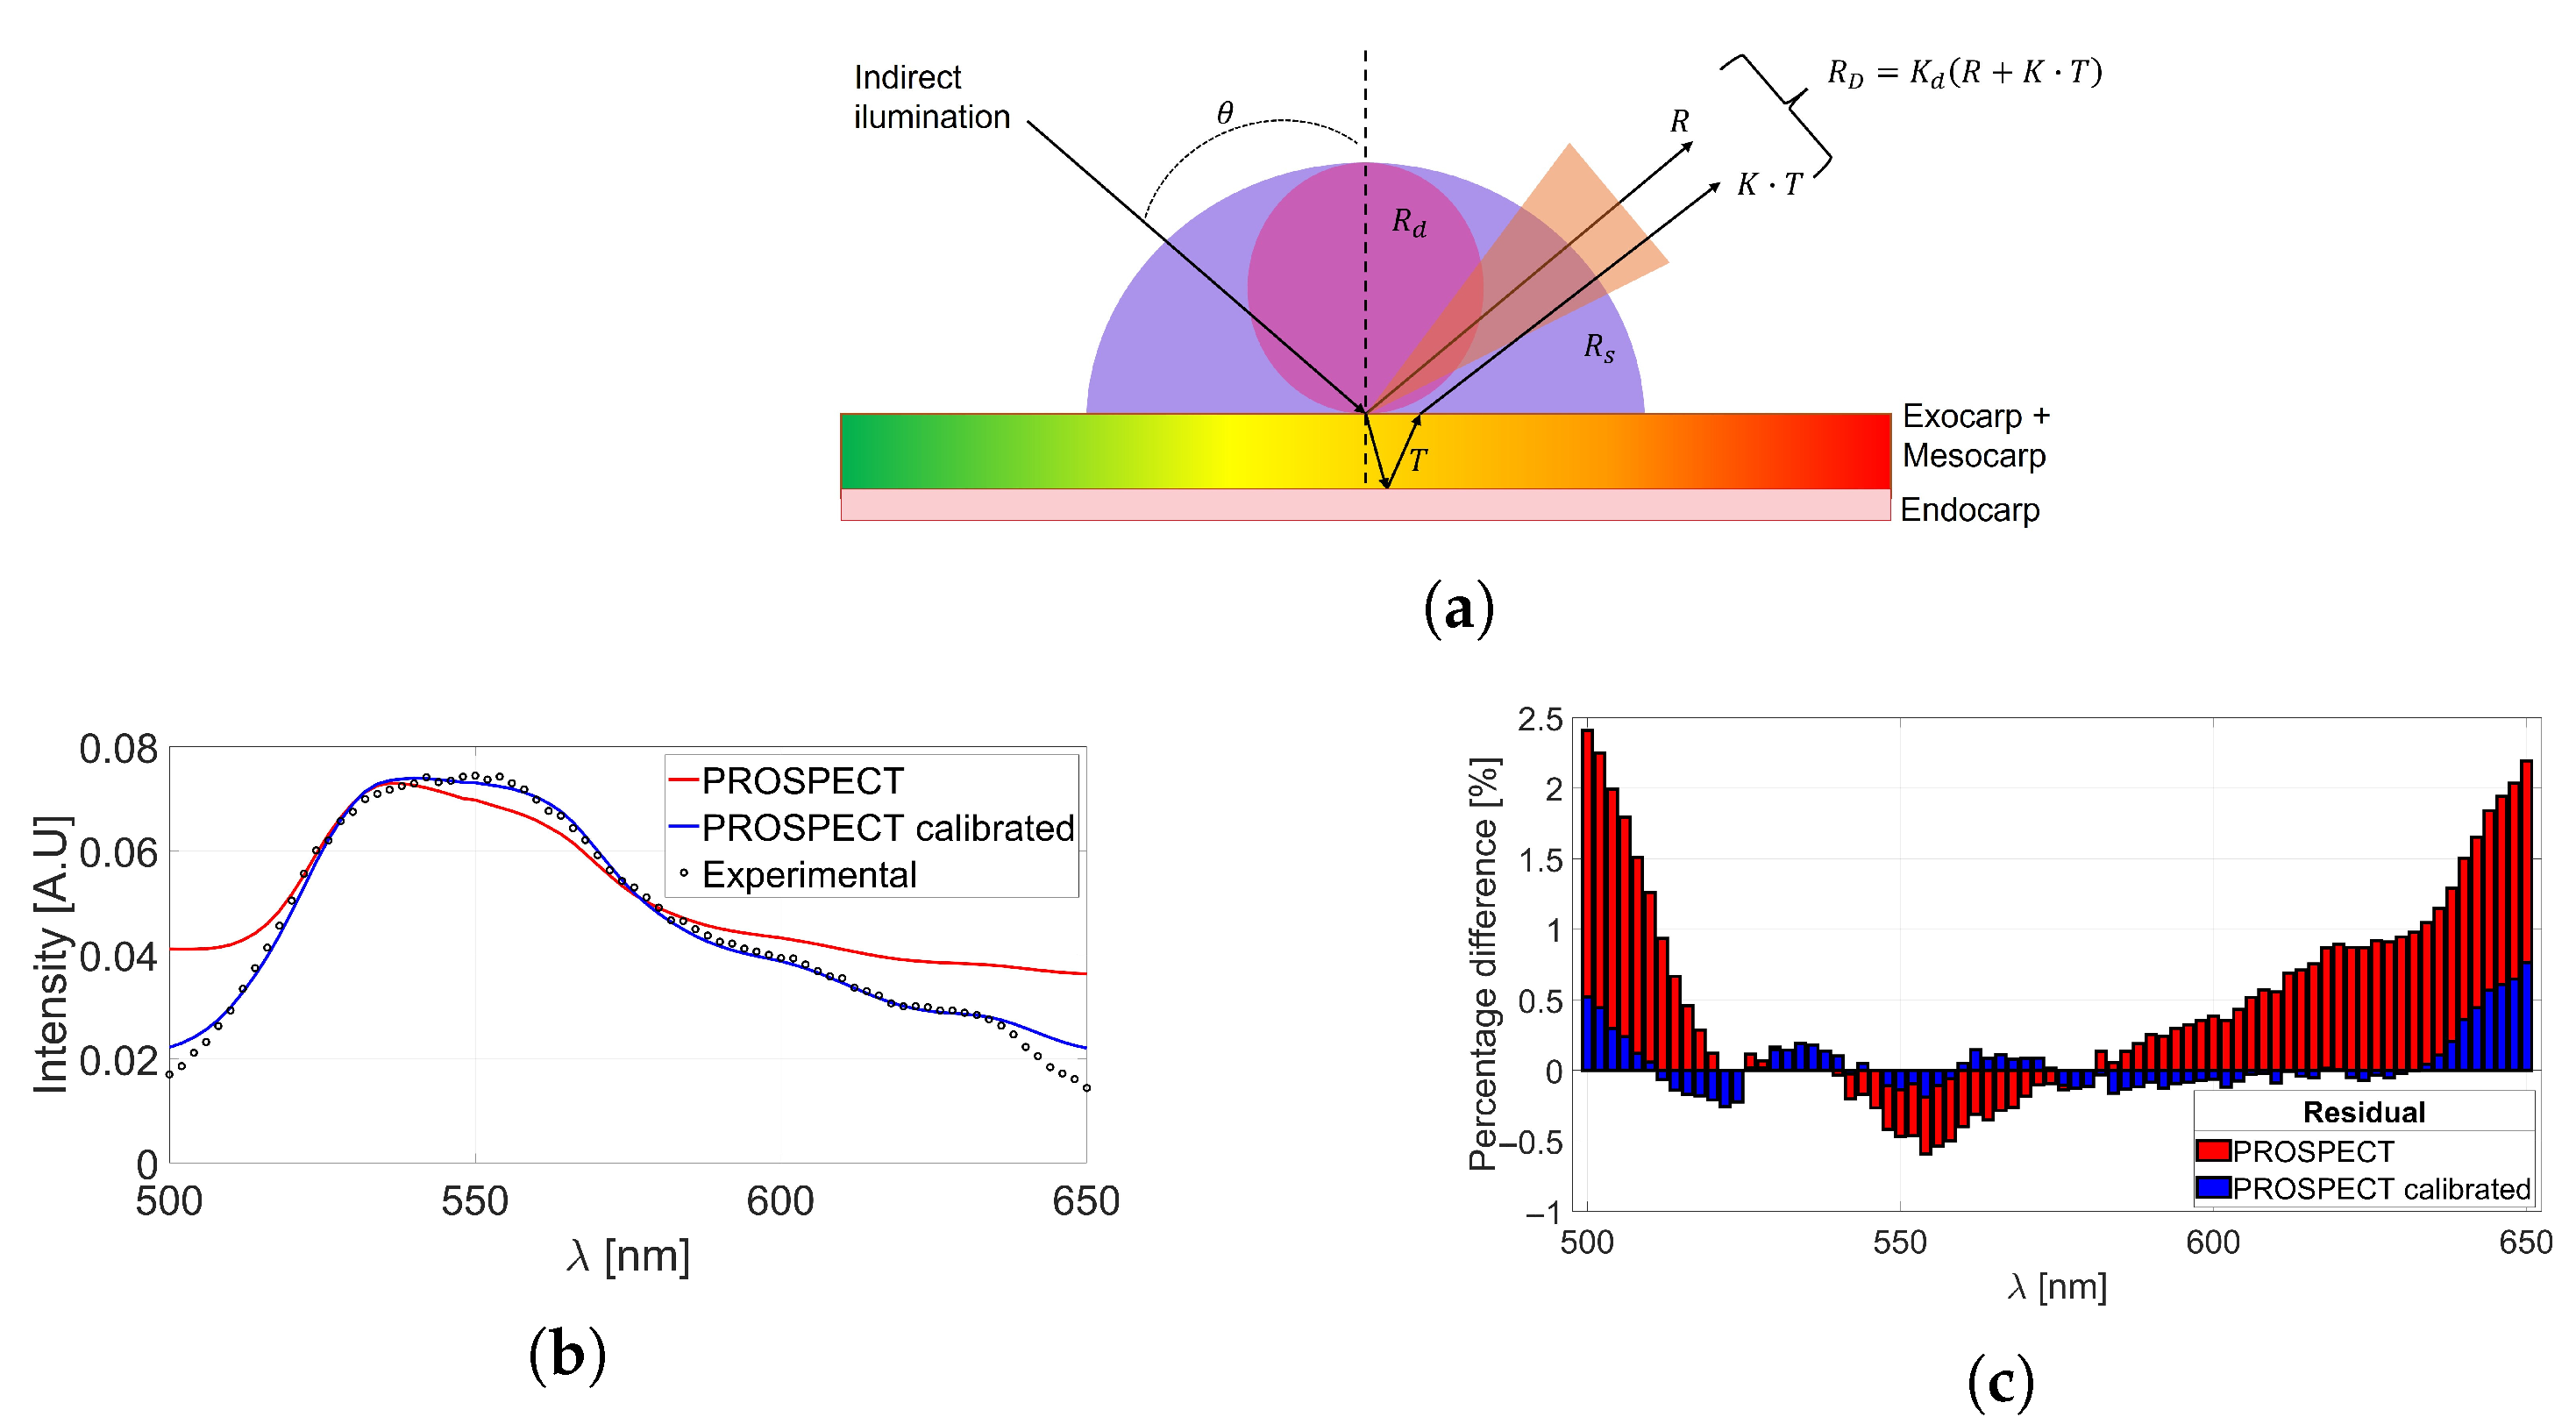
For that purpose, as shown in Figure 2a, we consider a two-layer optical model, the first layer consisting of the exocarp and mesocarp as a single homogeneous layer containing the pigment information responsible for coloration and the endocarp as a highly spreading dense layer that attenuates the effect of transmittance, causing the spectral data to return to the medium and re-emerge on the surface as a back reflection of the endocarp ( K · T ). When a beam of light strikes an angle θ concerning the normal of a surface with isotropic surface roughness, the beam produces an R that simultaneously possesses both specular ( R s ) and diffuse ( R d ) components. Thus, to calibrate PROSPECT, it is proposed to consider the diffuse reflectance R D ( λ ) recorded by the CTIS as a linear combination of R and T, as follows:
R D ( λ ) = K d · ( R ( μ a , N , n ) + K · T ( μ a , N , n ) ) ,
where it is clear that the absorption coefficient and refractive index n are wavelength dependent. Furthermore, R ( μ a , N , n ) and T ( μ a , N , n ) are determined with the PROSPECT model based on the average reflectivity and transmissivity calculated from the Fresnel equations, considering a partially isotropic light beam incident at an angle of 45°, K d represents a proportion ( 0 < K d < 1 ) of the total reflectance, and K is the ratio of T that contributes to the total reflectance bounded between 0 and 1 ( 0 < K < 1 ).
Equation (3) models the diffuse reflectance of Capsicum annuum, which presents a form similar to that offered by Merzlyak [44] to model the spectral reflectance of apple or that shown by Kumar et al. [37] to describe the effect of multiple layers of leaves on the effective reflectance of vegetation from linear combinations between reflectance, transmittance, and environment absorbance.
This calibration is used to fit the spectral signal of the bell pepper SESD obtained with Equation (1). Figure 2b shows an example of the uncalibrated PROSPECT (red line) and the improvement obtained by fitting the calibrated model (blue line), which shows a high correspondence of morphologies between the simulated and experimental spectral curves. Additionally, performing a residual analysis of the intensities as shown in Figure 2c, when using PROSPECT without calibration, a maximum residual intensity of 2.40% is obtained, which decreases to 0.77% when using the calibrated model.
Therefore, the calibrated PROSPECT model not only enables more accurate and consistent estimations of physicochemical and optical parameters from the SESD, but also significantly reduces the optimization time when integrated with the proposed GA. As described above and illustrated in Figure 3, the relationship between the input variables (independent) and the output variables (dependent) is governed by the residual R D of the calibrated PROSPECT model, as defined in Equation (3).

2.3. Genetic Algorithms

Genetic algorithms (GAs) belong to a class of search and optimization methods known as evolutionary algorithms (EAs), based on the notion of biological evolution by natural selection [45]. GAs apply widely in solving optimization problems in different areas of science and engineering because they are relatively insensitive to local optima and noise [45]. For these reasons, the numerical optimization method chosen in this work is based on GAs to calculate the concentrations of each pepper from the SESD given by Equation (1). For the execution of an iterative optimization process through a stochastic optimization algorithm based on a GA, an objective function ( FO ) or fitness function to be optimized is required. In the present work, we consider FO , in the first description, as an expression that indicates the measure of similarity φ between two signals. This is [46]
FO ( R D , R ¯ D ) = φ ,
where R D corresponds to the simulated spectral signal with Equation (3) in terms of the calibrated prospect model (see Figure 2b: blue line), while R ¯ D represents the experimental signal given in terms of Equation (1) (see Figure 2b: dotted line), and φ is a positive real number.
The optimization of Equation (4) initializes with a set of randomly generated solutions or individuals. Each individual is defined as the vector of an indexed set of elements or optimization variables expressed in real numbers. Figure 3 shows that our GA’s optimized variables (described in the next section) are N, C a b , C a r , C a p 1 , C a p 2 , K d , and K. The population size of individuals is kept constant in successive iterations of the optimization process. In addition, each simulated R D , from its corresponding individual, is evaluated using Equation (4) to generate its fitness value in terms of φ . Therefore, during each iteration of the process, those individuals with good fitness values have a higher probability that, in the next iteration, they will evolve towards better solutions by using the stochastic processes of recombination, mutation, and selection.
The optimization of Equation (4) is finished when, in a given iteration, an individual a o p t is found whose coefficients or optimization variables established in the calibrated PROSPECT model (see the diagram in Figure 3) define a fitness value φ o p t that corresponds to the closest solution to the global optimum; that is, R D o p t is obtained with an optimal similarity value φ o p t concerning R ¯ D . In this way, the signal R D o p t is adjusted to R ¯ D once Equation (4) is optimized for the individual a o p t found.
It is essential to point out that the reason why a GA, like the one used in the present work, finds the closest solution to a global optimum without being affected by noise is that, in each iteration, the algorithm executes in the space of sampling a parallel search for those solutions with the best fitness values [47,48,49]. Such a simultaneous search is carried out through probabilistic transition processes, which are previously mentioned as recombination, mutation, and selection processes [50,51,52].
Algorithm 1 presents the pseudocode describing the probabilistic transition processes that shape our stochastic optimization algorithm (GA). The population, at iteration or generation g, is represented by the variable P dependent on g, where P ( 0 ) is the initial population of randomly generated solutions or individuals. Our GA starts the optimization of FO , using the population P ( 0 ) , and implements a simultaneous search for potential solutions in regions of the sampling space, applying the stochastic processes of recombination, mutation, and selection to form a new population P ( g ) at g = g + 1 . Applying such processes in the following generations allows the GA to find new sets of individuals that correspond to better solutions within the sampling space. The optimization process finishes when a predetermined number of generations is obtained or when the objective function that is optimized by the individual a ι o p t , in P ( g ) , is equal to the predetermined objective value φ ι o p t , where a ι o p t corresponds to the near-optimal solution to the global optimum. A detailed description of our numerical optimization method is given in the next section.
Algorithm 1: Genetic Algorithm (GA)
Agriengineering 07 00284 i001

Proposed Stochastic Optimization Numerical Method

In this article, we identify the optimization variables N, C a b , C a r , C a p 1 and C a p 2 , K d , and K by minimizing an FO using a GA. The FO is computed by the Euclidean distance between R D and R ¯ D . For the implementation of the GA, we use the ga () function of the Global Optimization Toolbox of MATLAB® version R2024a [53]. We used vector programming (vectorization or array programming) in combination with the calculations performed by a GPU (Graphics Processing Unit) through an NVIDIA GeForce GTX 1650 graphics card (NVIDIA Corporation, Santa Clara, CA, USA), which allowed us to accelerate the convergence time of the stochastic optimization algorithm (GA). In general, the input data of the GA are defined by R ¯ D ( λ ) of the SESD, giving as output data the individual a ι o p t that best represents the parameters specified in the scheme in Figure 3 and Equation (3). The evaluation of the fitness φ of the individual members of a population is carried out with the FO given by the Euclidean distance (ED) between the experimental dataset R D and the signal obtained by the PROSPECT model calibrated for each individual R D ι that makes up the population, as follows:
FO ( R D ι , R ¯ D ) = E D = ( R D ι R ¯ D ) 2 .
In the following lines, we describe specifically the particular characteristics of its stochastic process in the minimization of Equation (5), as follows:
Step 1: An initial population P ( 0 ) of randomly generated individuals with uniform distribution are generated using the MATLAB function rand( ι ,k), where ι is the size of the population and k is the number of variables to optimize, as follows:
P ( 0 ) = { a ι , 1 ( 0 ) , , a ι , k ( 0 ) } = { N ( 0 ) , C a b ( 0 ) , C a r ( 0 ) , C a p 1 ( 0 ) , C a p 2 ( 0 ) , K d ( 0 ) , K ( 0 ) } ι ,
Each individual a ι , k is represented by the seven variables to be optimized and are randomly generated within an interval of real numbers ( N [ 1 , 5 ] , C w [ 0 , 2000 ] μ g/cm3, K [ 0 , 1 ] and K d [ 0 , 1 ] ).
Step 2: The fitness φ ι of each individual a ι , k is evaluated with the FO given in Equation (5).
Step 3: The best individuals of the current population are selected, where the aptitudes of all individuals are grouped in ascending order in a row vector, from the lowest value φ 1 to the highest value φ ι , as follows:
a p t i t u d e s = [ φ 1 , , φ ι ] ,
where φ 1 and φ ι represent the best and the worst individual, respectively, and the parents considered for the next step are those whose fitness values are defined in the interval from φ 1 to φ ι / 2 . The rest of the population is excluded from the optimization process.
Step 4: A roulette wheel approximation is applied to the resulting population P p a r e n t ( 0 ) = b 1 ( 0 ) , , b ι / 2 ( 0 ) . The number of pairs of randomly selected individuals is defined by ι / 4 . The process begins by spinning the roulette wheel on ι / 2 occasions. On each occasion, there is a high probability that an individual b ι / 2 ( 0 ) will be selected if its fitness value φ ι / 2 is good.
Step 5: The heuristic cross operator [54] is applied to determine a new offspring population from the couples selected in the previous step. The offspring population size corresponds to the same size as the matrix of the parents.
Step 6: If there are repeated offspring individuals, the adaptive mutation operator [55] is used to maintain the offspring population’s diversity.
Step 7: Elitism is applied to select from Equation (5) the best individuals from the set of parents and children. This population is included in the next generation g = g + 1 , returning to step 4. If the individual a ι o p t , k is obtained from the new population, then the near-optimal solution to the global minimum is found. Otherwise, the optimization process continues through the generation of new individuals, selecting those with the minimum error until a ι o p t , k is found, or the previously established number g of generations is reached.
For the selection of the selection, crossover, and mutation operators used in the GA, synthetic spectral data generated with the calibrated PROSPECT model are adjusted, considering values of the average concentrations ( μ g/cm3) of each pepper: green ( C a b = 416.60 , C a r = 186.79 , C a p 1 = 0.47 , C a p 2 = 2.33 ) and red ( C a b = 20.00 , C a r = 99.94 , C a p 1 = 224.98 , C a p 2 = 30.16 ) according to what is indicated in the literature [7,8,56,57]; reference values will be considered. The structure parameter N = 4.30 ranges from 4 to 5 due to the degree of complexity of the pepper’s cell structure, and the parameters K d and K are set to 0.50 and 1.00, respectively, allowing an ideal synthetic dataset to be created.
Because, experimentally, when obtaining a spectrum, the total absence of noise is an ideal that can never be realized in practice, the noise associated with a spectral signal profoundly affects its analysis [58]. There are numerous sources of noise arising from instrumentation, such as flicker noise, interference noise, thermal noise, shot noise, environmental noise, stray light, chemical noise, and white noise [59,60,61]. Of all these types of noise, white noise is the most difficult to eliminate since it is random and occurs at all frequencies of the spectrum [58]. Therefore, Gaussian white noise is added to the synthetic data obtained with the calibrated PROSPECT model, since it is the noise considered in a CTIS system [62].
We created a set of synthetic data for each color of the peppers, adding 20% white noise (mean zero and variance 0.2), given that the noise level of the spectra obtained with the CTIS system does not exceed 20%. With this set of synthetic data with added noise, the GA is implemented, using the genetic algorithm function ga() in the Global Optimization Toolbox of MATLAB® version R2024a [53], combining the selection operators (selectionroulette), crosses (crossoverheuristic), and mutation (mutationadaptfeasible) described in steps 4–6. We determined the appropriate values of the crossbreeding fraction at 0.8. The heuristic crossover rate at r = 0.9, applied to a population of 2000 individuals over 36 generations, enables the attainment of the best minimum value of FO (best fitness).
To validate the robustness of our genetic algorithm (GA)-based stochastic optimization method, we evaluate the standard deviation (STD) of the parameters retrieved from synthetic spectra after repeating the GA procedure 10 times with randomly generated initial populations. The STD converges to zero for all retrieved parameters. We then use the corresponding SESD values as input data to determine pigment concentrations in bell peppers of different colors. In this way, we solve the inverse problem by obtaining the best fit of the spectral response R D to SESD, given by R D , through the analytical function of the calibrated PROSPECT optical model. This approach enables the retrieval of multiple parameters associated with the color and structure of the peppers using a multi-objective genetic algorithm.

3. Results

Next, we present the results from pigment concentrations retrieved from synthetic data, which demonstrate the efficiency of the GA inversion, as well as from experimental spectra acquired with the CTIS system to estimate pigment concentrations in fresh bell pepper samples. Figure 4 shows a flowchart of the procedure, beginning with the acquisition of SESD values and a check for synthetic data. If the data are synthetic, noise is added and the GA processes them to evaluate the robustness of the method. If the data are experimental, the GA directly analyzes them to estimate pigment concentrations in green and red bell peppers. To assess the quality of the data fit, we compute several spectral similarity metrics, including linear correlation [63], root mean square error (RMSE) [64], Euclidean distance [65], and Fréchet distance [66]. Finally, the results are stored in a database to complete the procedure.

3.1. Evaluation of the GA Investment Algorithm

In order to verify the robustness and accuracy of the GA inversion model, we initially analyzed synthetic spectral data with added noise for both green and red peppers. The noise, modeled as a Poisson distribution and approximated as a Gaussian noise [67], was introduced to simulate realistic spectral measurement conditions. This approach, combined with the calibrated optical model, provides a close approximation to actual experimental scenarios. We select noise levels based on typical signal intensities recorded in moderate spectral scenes (ranging from 23 to 8 nW/cm2·sr·µm), corresponding to signal-to-noise ratios (SNRs) between 7% and 20%, as commonly observed in CTIS systems.
We benchmark the implemented GA against conventional numerical optimization methods, including Interior Point [68], Sequential Quadratic Programming (SQP) [69], and Active-Set methods [70], all executed with MATLAB’s fmincon() function, which minimizes constrained nonlinear multivariable functions. For each method, we apply the same realistic lower and upper bounds as in the GA to the k parameters, as detailed in step 1 of Section 2.3, thereby delimiting the feasible search space. No additional nonlinear constraints are imposed, so the algorithms freely explore the parameter space within these bounds. Each solver runs until convergence with a stringent numerical tolerance of 1.00 × 10 6 to find the closest solution to the global minimum.
As shown in Table 1, the GA consistently outperformed the other methods across all tested scenarios. For synthetic green pepper samples, the GA achieved the lowest Mean Absolute Percentage Error (MAPE) values: 3.89% with 7% noise and 8.46% with 20% noise. In contrast, the other methods presented errors greater than 21.94%. Similarly, for red pepper samples, the GA maintained superior accuracy with MAPE values of 3.14% (7% noise) and 5.38% (20% noise), significantly outperforming Interior-Point and Active-Set, while SQP showed the poorest performance. These results demonstrate the robustness, efficiency, and stability of the GA, particularly under high-noise conditions where traditional methods degrade significantly.
Figure 5a,b shows the results of the fit of the synthetic data with a noise level of 20% for the different varieties of peppers. The linear correlation coefficient, RMSE, Euclidean distance, and Fréchet distance assessed the quality of the fit. The linear correlation coefficients obtained were ρ = 0.99 for green peppers and ρ = 1.00 for red peppers, indicating a high correspondence between the fitted data and the synthetic reference values. Regarding the RMSE, a value of 7.75 × 10 4 was obtained for green peppers and 2.73 × 10 4 for red peppers, suggesting a higher accuracy of the fit.
Regarding the distance metrics, Euclidean distance was 6.83 × 10 3 for green peppers and 2.40 × 10 3 for red peppers, while Fréchet distance reached values of 2.00 × 10 3 and 6.00 × 10 4 for green and red peppers, respectively. We also performed a residual analysis of the fitted data. The average residuals were 3.16 × 10 4 for green peppers and 3.04 × 10 5 for red peppers, as shown in the residual graph in Figure 5c. These results demonstrate the ability of the GA to fit the data in the presence of noise.

3.2. Spectral Information of the Samples

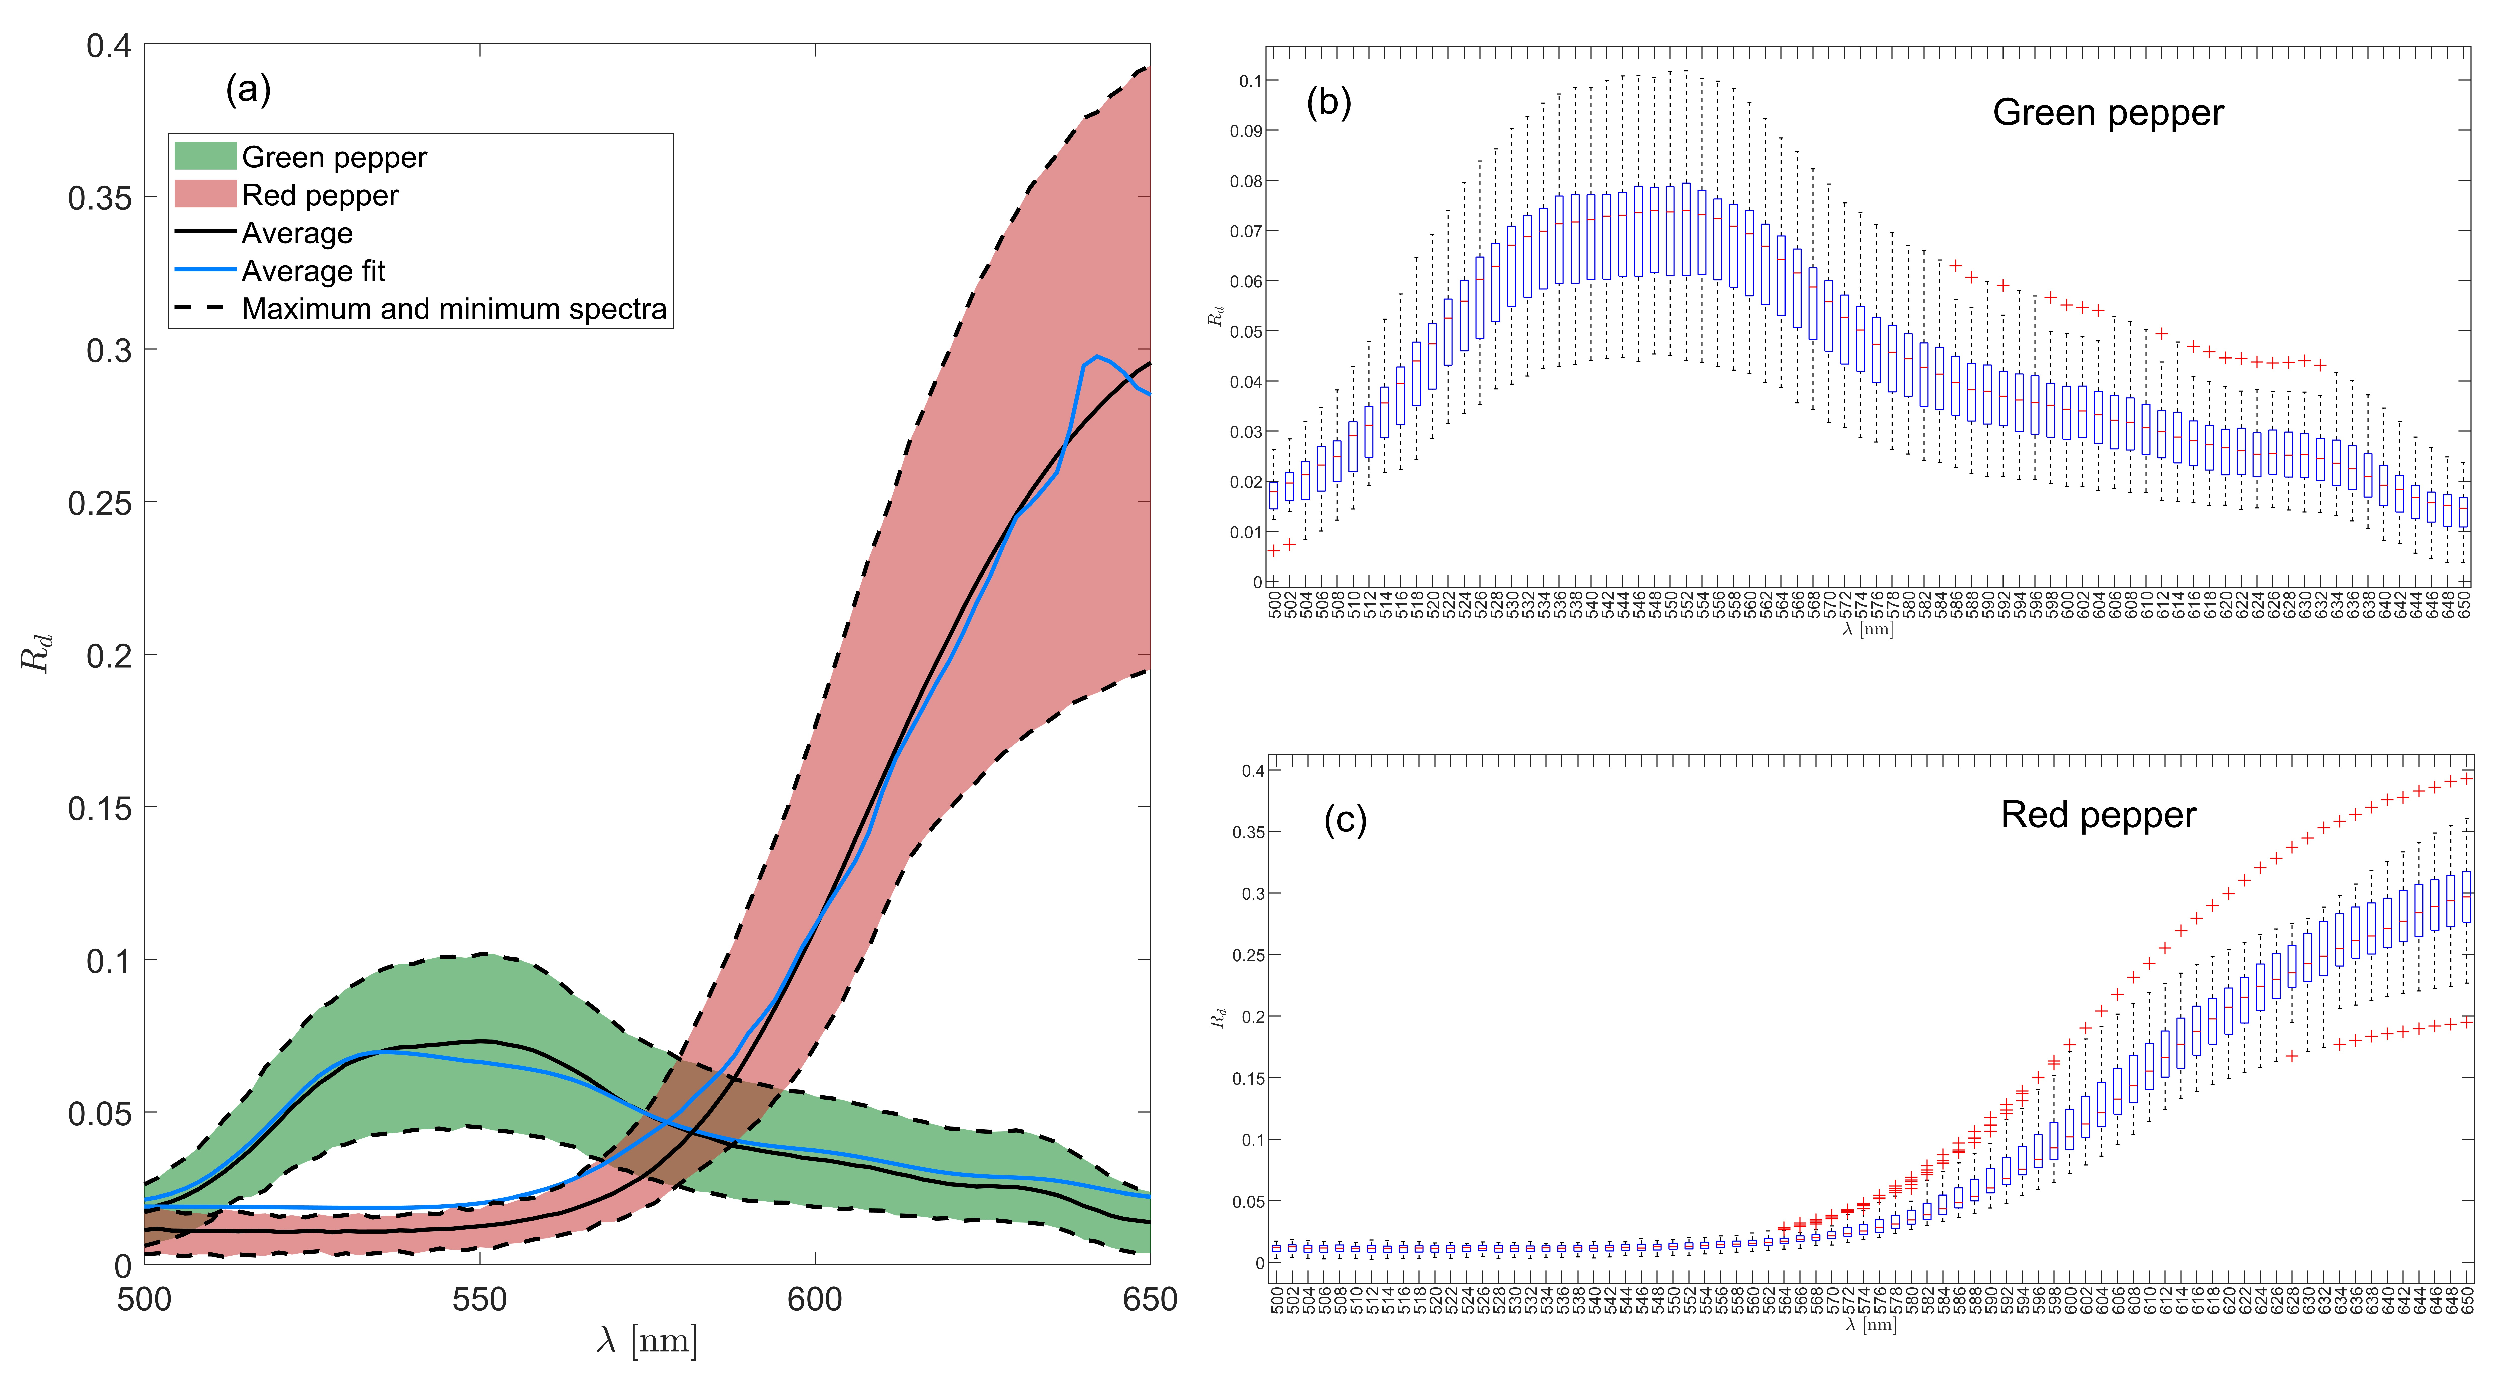
We use a total of 60 fresh peppers: 30 green and 30 red, without superficial defects such as bruises, with an average mass of 204 g, obtained from a local market. The peppers are photographed with the CTIS system under controlled environmental and lighting conditions, ensuring the absence of significant interference from external or instrumental noise (see Figure 1). The average spectral information is obtained for each pepper in the range of 500 to 650 nm (see Figure 6). Although the spectral sensitivity of the CTIS system in this study is limited to 500–650 nm, this restriction does not compromise the detection and analysis of key pigments in bell peppers. The main absorption features of Chlorophylls, Carotenoids, Capsanthin, and Capsorubin are concentrated within this spectral window. Thus, despite the limited spectral bandwidth, the system provides sufficient information to characterize the optical behavior of green and red peppers.
In Figure 6a, the experimentally obtained spectra of each of the different peppers are presented, where the black solid line represents the average value of the spectra and the black dashed lines the maximum and minimum values of the measured spectra. The experimental data were subsequently fitted using the calibrated PROSPECT model in combination with GA which largely describes the behavior of the diffuse reflection curves (light blue solid line). Figure 6b exhibits homogeneous intragroup dispersion where the highest reflectance is concentrated around 540–550 nm, a region typically associated with the presence of chlorophyll, which is consistent with the physiology of green pepper. In the case of red pepper, Figure 6c, low reflectance is observed in the spectral regions of 500–550 nm, with a progressive increase towards longer wavelengths, where a greater number of outliers (red crosses) are also present. This trend suggests greater variability in the optical response of the fruit at longer wavelengths, possibly associated with differences in maturity, pigment content or structural variations in the surface of the pepper. To validate the robustness of our genetic algorithm (GA)-based stochastic optimization method, we evaluate the standard deviation (STD) of the parameters retrieved from synthetic spectra after repeating the GA procedure 10 times with randomly generated initial populations. The STD converges to zero for all retrieved parameters. We then use the corresponding SESD values as input data to determine pigment concentrations in bell peppers of different colors. In this way, we solve the inverse problem by obtaining the best fit of the spectral response R D to SESD, given by R D , through the analytical function of the calibrated PROSPECT optical model. This approach enables the retrieval of multiple parameters associated with the color and structure of the peppers using a multi-objective genetic algorithm.
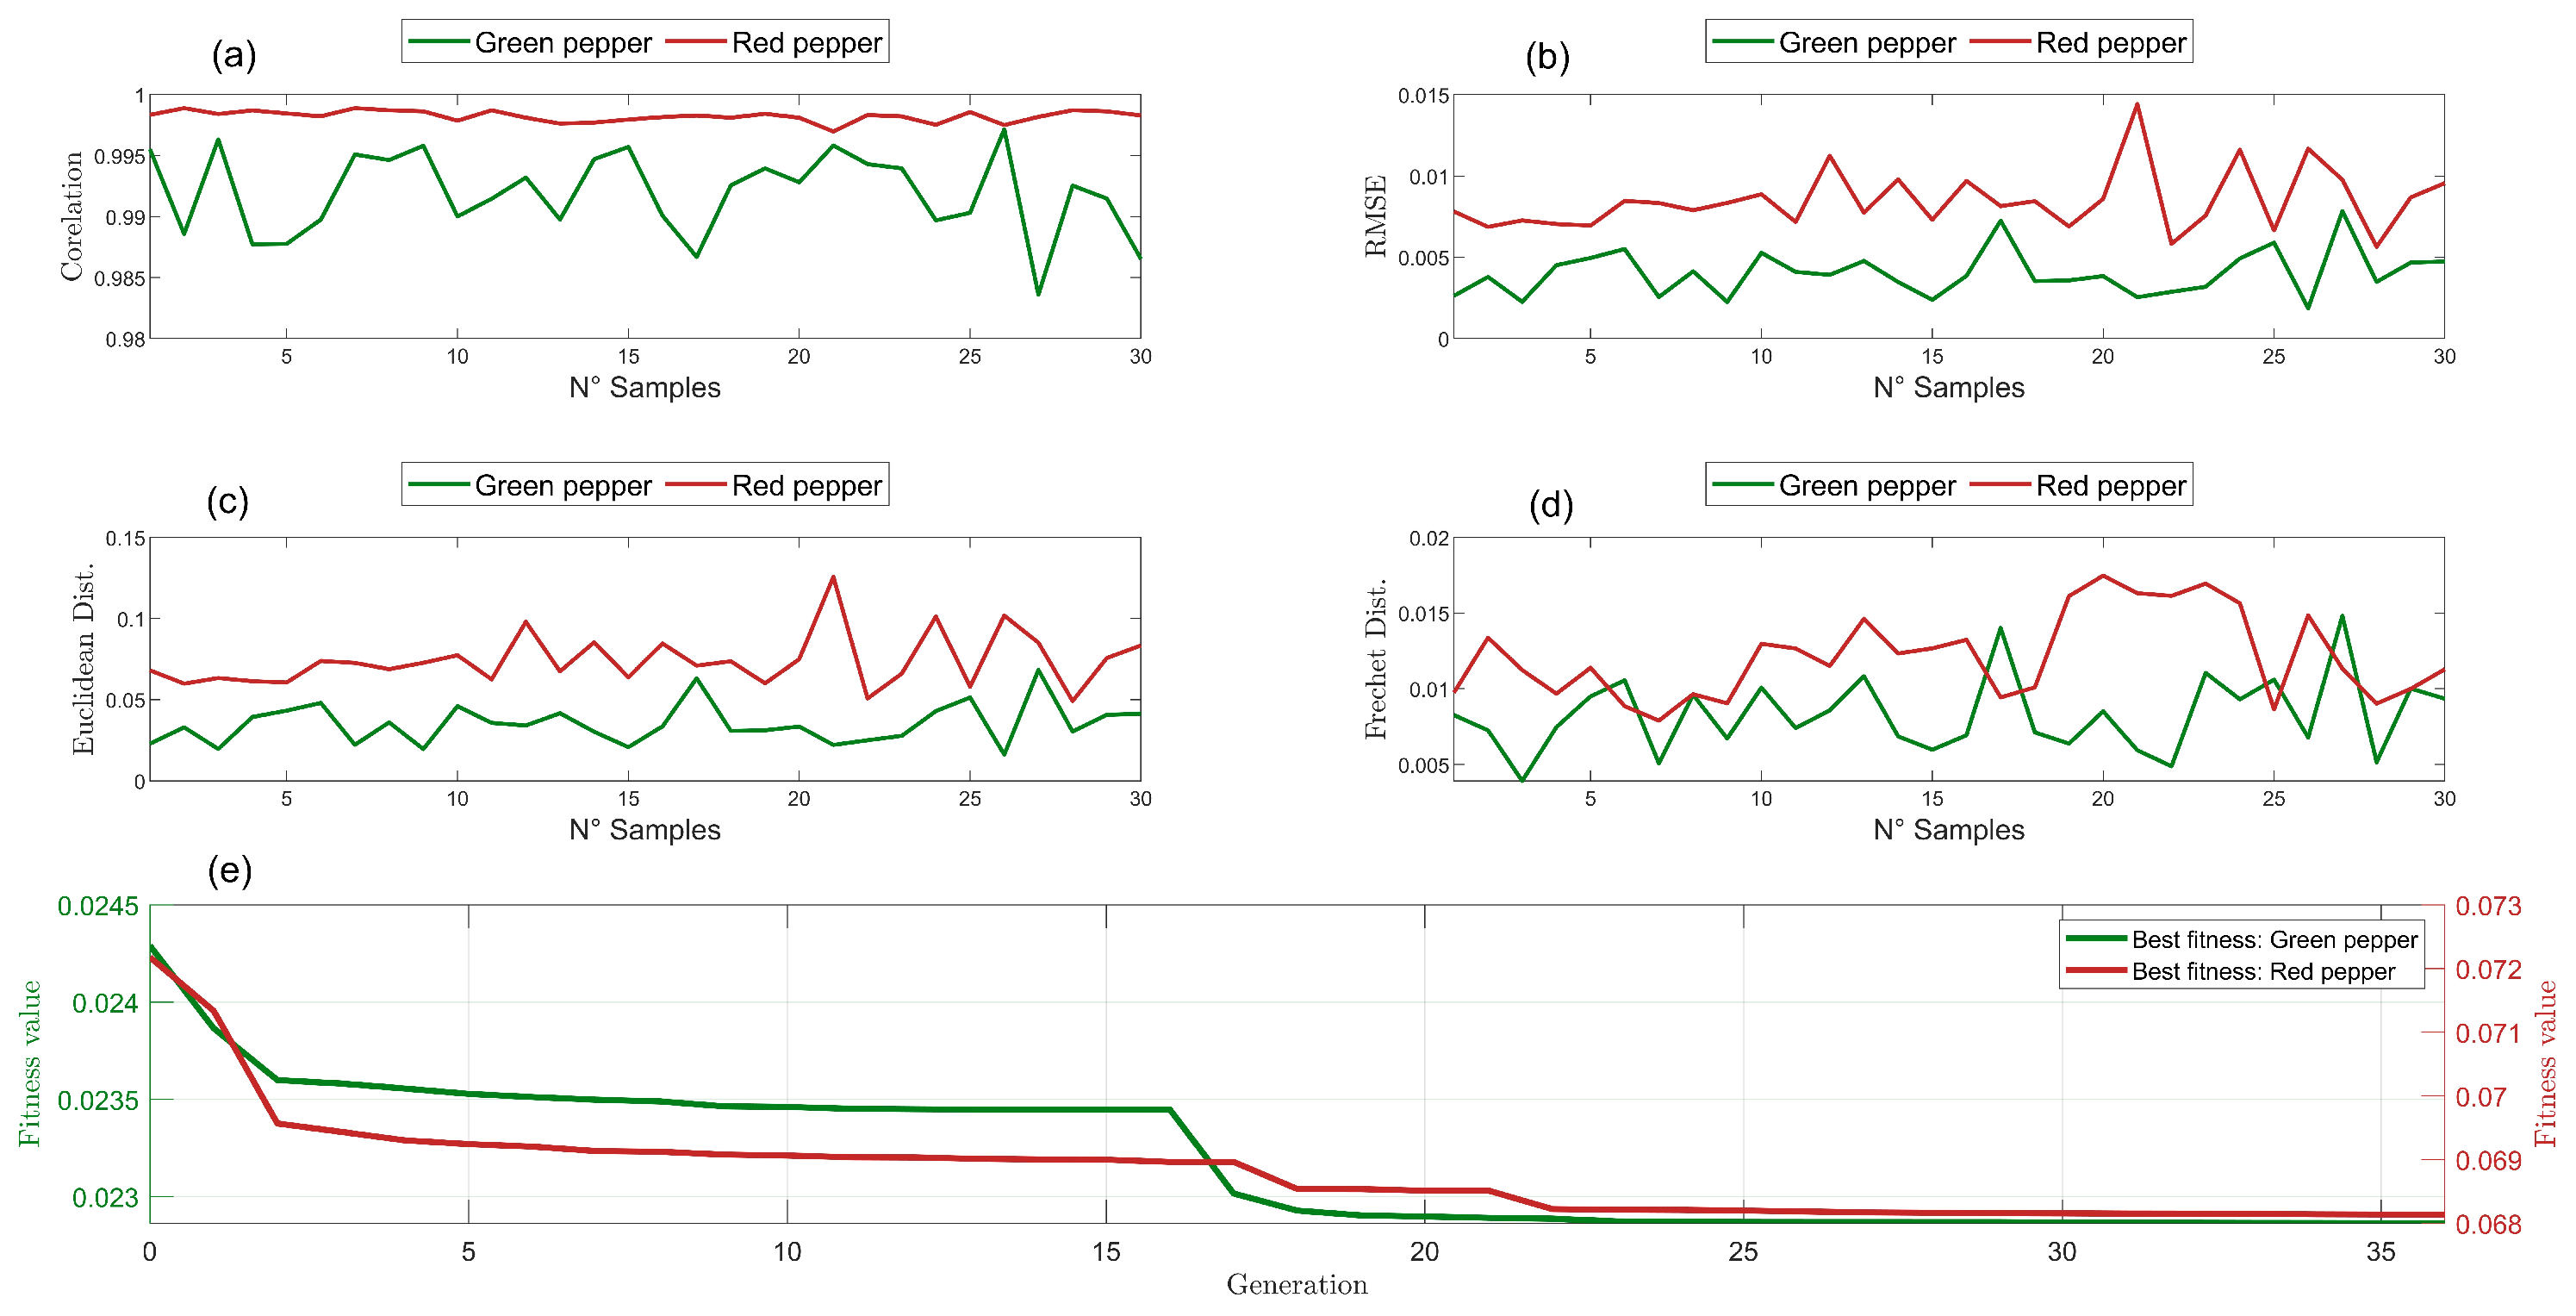
The quality of the fitted data is validated by measuring the similarity between the experimental data and the GA-optimized data using the metrics shown in Figure 7. In Figure 7a, the average correlation coefficient is ρ = 0.99 for green pepper and ρ = 1.00 for red pepper. Figure 7b shows an average RMSE of 3.83 × 10 3 and 8.34 × 10 3 for the green and red pepper cases, respectively (see Table 2). Since RMSE has the valuable property of being in the same units as the response variable, low RMSE values indicate a better fit and thus provide a reliable representation of the spectral behavior.
Similarly, in Figure 7c,d, the values of the Euclidean and Fréchet distances are shown, where the average values of these metrics were 3.50 × 10 2 and 8.30 × 10 3 for the green pepper case and 7.39 × 10 2 and 1.21 × 10 2 for the red pepper. These metrics indicate greater variability in the fit of the experimental data for the red pepper compared with the green pepper. Additionally, Figure 7e shows the evolution of the fitness value over 36 generations of our genetic algorithm, where a progressive decrease in the fitness value is observed as the evolutionary process progresses, which indicates an improvement in the quality of the solutions found by the algorithm.

3.3. Retrieving of Pigment Concentrations

Table 2 shows the average values of the estimated parameters of 30 green peppers and 30 red peppers, as well as the mean values and standard error associated with all the estimated parameters. In addition, columns 4, 6, 8, and 10 present the percentages of the estimated concentrations of each of the pigments considered. The same table reports the average reference values of the concentrations and their respective percentage distributions, taken from the literature, as indicated in Section 2.3. Consider that 1 μ g/cm3↔ 1 ppm ↔ 1 μ g/g are equivalent units [71,72,73].
The average differences ( Δ ) in concentrations are calculated with respect to those reported in the literature. For the main pigment C a b (Chlorophyll) in green pepper, the discrepancy is 31.03 μ g/cm3, representing a percentage difference of 7.45% with an associated standard error of 17.96 μ g/cm3. For the Carotenoid concentrations C a r , the residue is 3.68 μ g/cm3, corresponding to a difference of 1.97% with a typical error of 8.94 μ g/cm3. For the pigments C a p 1 (Capsanthin) and C a p 2 (Capsorubin), the differences concerning the reference values in the literature are 0.29 and 0.20 μ g/cm3, representing 61.70% and 8.58% differences, with typical errors of 0.04 and 0.12 μ g/cm3, respectively. These results demonstrate the sensitivity of the method to estimate the concentrations of the predominant pigments (Chlorophyll, Carotenoids, and Capsorubin), while showing lower precision for pigments with a reduced impact on the spectral response of green Capsicum (capsanthin). The difference in the percentage distribution shown in columns 4, 6, 8, and 10 is 2.51% compared with the values reported in the literature [8], which may be attributed to optical parameters such as the refractive index considered in the optical model, as well as to the intrinsic precision of the model in describing the physical phenomenon.
Likewise, Table 2 reports the average values of the parameters retrieved from fitting the spectral data presented in Figure 6 for red peppers. The Chlorophyll concentration shows an average difference of 6.42 μ g/cm3 (32.10%) compared with literature values, with a standard error of 1.76 μ g/cm3 for C a b . C a r exhibits a difference of 10.07 μ g/cm3 (10.08%) with an associated standard error of 2.50 μ g/cm3. The mean concentrations of the predominant pigments Capsanthin and Capsorubin in red peppers differ by 0.03 (0.01%) and 3.25 (10.78%) μ g/cm3, respectively, with standard errors of 7.11 μ g/cm3 for C a p 1 and 2.03 μ g/cm3 for C a p 2 . Regarding the distribution of retrieved concentration percentages, the total difference is 5.60% (columns 4, 6, 8, and 10) compared with the values reported by Mohd Hassan et al. [8].
The parameter N for the two colors of peppers is estimated in the range of 4.13 to 4.31. These values indicate the intercellular space of the peppers and, therefore, the degree of tissue complexity. Likewise, the retrieved range corresponds to the point where the model exhibits greater sensitivity to changes in reflectance and transmittance [26]. The value K d is retrieved in the interval [ 0.47 ; 0.48 ] , indicating that approximately 50% of the total reflectance energy contributes to the diffuse reflectance spectrum. Table 2 shows the RMSE values obtained by adjusting the SESD using our methodology with GA, which guarantees the parameter retrieval capacity.

3.4. Validation

To validate the results obtained with our methodology, we measure the spectral response of the same green and red pepper samples using a commercial Ocean Optics USB4000 spectrometer with a spectral range of 200 to 1100 nm.
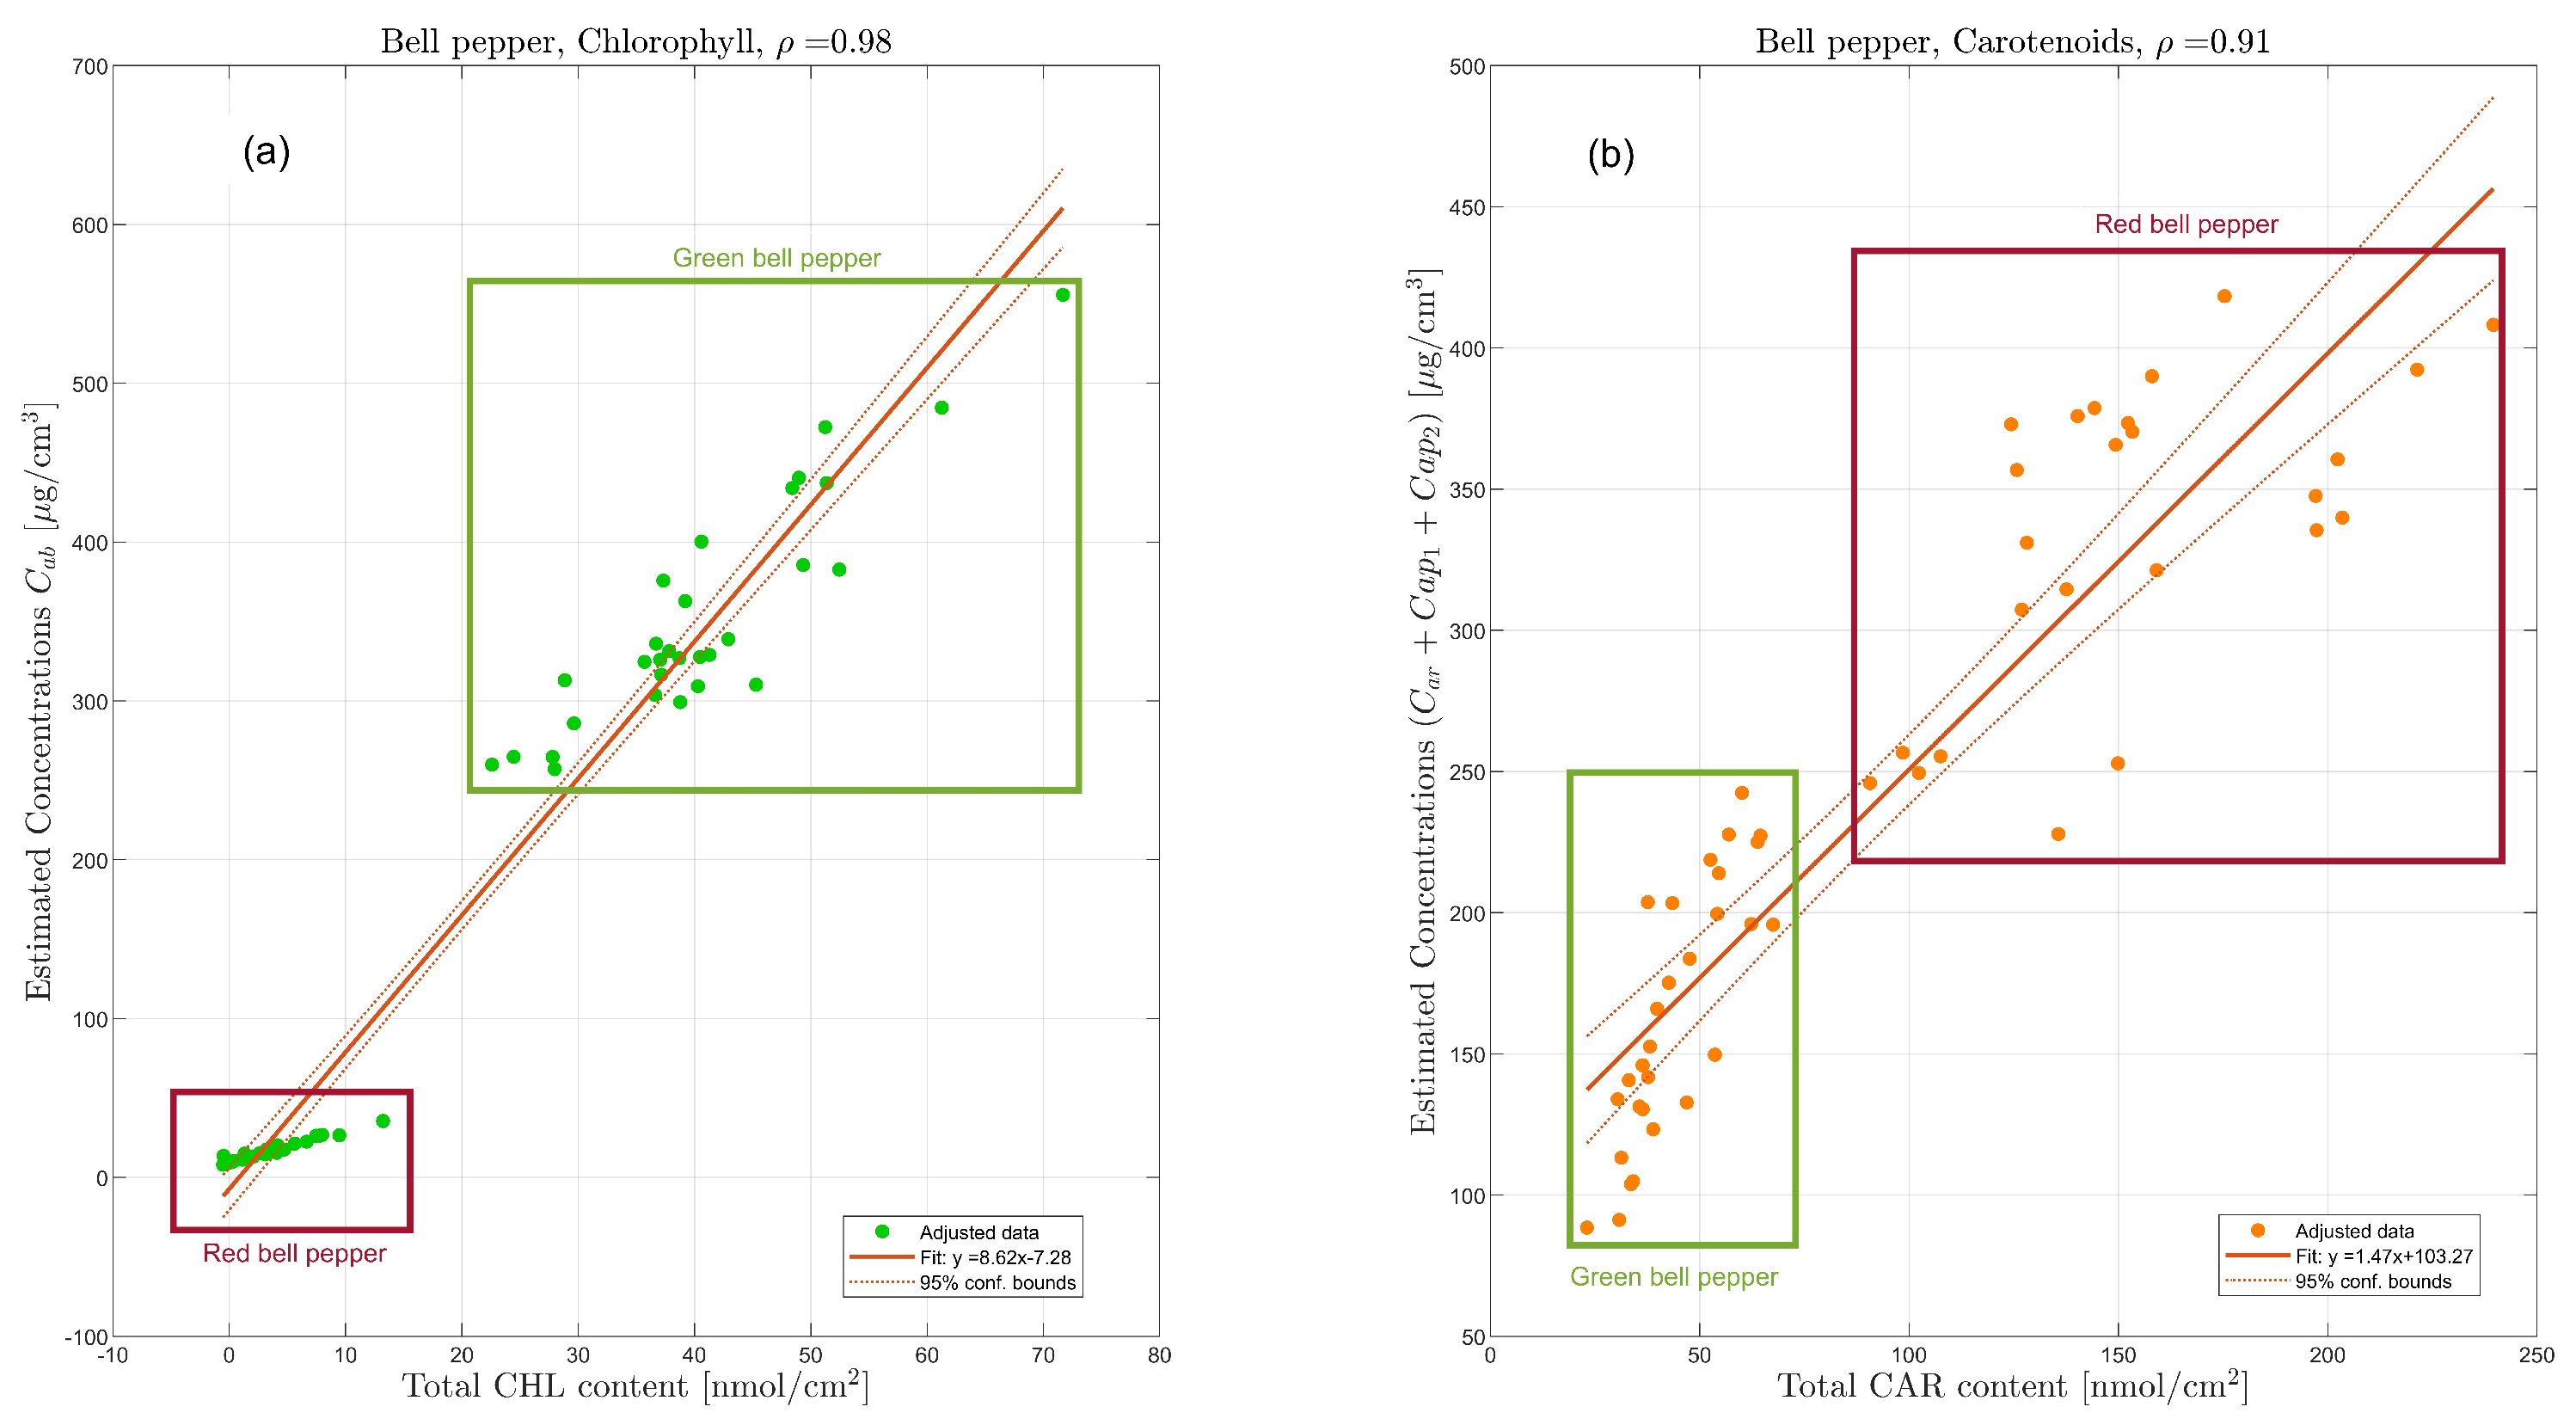
The spectral information allows us to calculate the total Chlorophyll ( C H L ) and Carotenoid ( C A R ) content in both groups of peppers using the methodology proposed by Gitelson et al. [74]. Since this methodology determines only the total contents of Chlorophyll and Carotenoids, we perform a linear combination of the estimated concentrations ( C a r + C a p 1 + C a p 2 ) associated with the Carotenoids present in bell peppers to compare them with the total C A R content. Finally, we plot the concentrations estimated by our methodology for this group of peppers as a function of the total C H L and C A R , as shown in Figure 8. The results show a high linear correlation between the values calculated using the methodology of Gitelson et al. [74] and those estimated by our approach, with correlation coefficients of ρ = 0.98 for Chlorophyll and ρ = 0.91 for Carotenoids. Even though both methodologies employ different concentration units, nmol/cm2 on the horizontal axis and μ g/cm3 on the vertical axis, the observed linear relationship indicates that the transformation between them is consistent and allows for direct conversion between estimates. The greater accuracy in Chlorophyll estimation compared with Carotenoids suggests that the spectral response of Chlorophyll is more stable. In contrast, the greater scatter in Carotenoid estimation may result from variations in their optical behavior. These results validate the applicability of our methodology as an alternative for the non-destructive estimation of pigments in green and red peppers, enabling its implementation in physiological monitoring studies and fruit quality assessment.

4. Discussion

These results evaluate the efficiency of using a CTIS system as a non-invasive technique to simultaneously retrieve the concentrations of Chlorophyll, Carotenoids, Capsanthin, and Capsorubin from fresh peppers. Due to the low spectral response of the camera used in the CTIS system, we evaluate the peppers in a spectral range where changes associated with pigment concentrations are more noticeable. The calibration of the PROSPECT model allows a better representation of the SESD, as presented in Figure 2, where the percentage residual difference is reduced to less than 1%.
The average concentration values for green and red peppers, as presented in Table 2, are comparable to those reported in various publications that employ destructive techniques, such as HPLC [7,8,56,57]. The concentrations of Capsanthin ( 0.18 ± 0.04 ) μ g/cm3 and Capsorubin ( 2.13 ± 0.12 ) μ g/cm3 obtained for green pepper with our method are justified by Deli et al. [7], where it indicates the presence of these pigments at low concentrations, reporting values of ( 0.47 ) μ g/cm3 and ( 2.33 ) μ g/cm3 for Capsanthin and Capsorubin at an immature stage of the pepper. Likewise, the determined concentration of Chlorophyll in red peppers ( 26.42 ± 1.76 ) μ g/cm3 indicates the low presence of this pigment as it is indicated by Luning et al. [56] and Moser and Matile [75], where they report concentrations <40 μ g/cm3 in a study of Capsicum annuum at different stages of repigmentation, which denotes the sensitivity of our method to retrieve these concentrations.
In Table 2, the values of the structure parameter N retrieved are additionally shown in the range of 4–5, indicating that the parenchymal cells present in the pepper mesocarp have large intercellular spaces, where, according to Féret et al. [76], high values of the structure parameter (N > 2) represent a more complex cellular structure. Hence, it contains more intercellular air spaces. A recent study by Tan et al. [16] uses FFFS as a non-invasive optical technique in conjunction with learning strategies to determine Capsanthin concentrations from different samples of pepper powder. However, diffuse reflectance spectra in conjunction with GA represent a potential technique to retrieve concentrations of fresh peppers simultaneously.
The proposed methodology demonstrates high accuracy in estimating Chlorophyll and Carotenoid concentrations in green and red bell peppers, evidenced by the strong linear correlation obtained compared with the reference method [74]. The consistency of this relationship, even considering the differences in the concentration units used by both approaches, supports the model’s reliability for pigment quantification. From an operational perspective, the combination of the calibrated PROSPECT optical model with a genetic algorithm (GA)-based inversion algorithm allows simultaneous retrieval of Chlorophyll, Carotenoid, Capsanthin, and Capsorubin concentrations in fresh bell pepper fruits from SESD obtained using a CTIS system. Unlike the approach proposed by Ignat et al. [77], which requires prior training of a support vector regression (SVR) model, our methodology does not rely on supervised learning processes, facilitating its rapid and adaptable implementation.
However, certain methodological limitations must be considered that could restrict the model’s applicability to other fruit varieties or environmental conditions. The PROSPECT model was initially developed for leaves as a radiative transfer model that estimates the spectral response of biological tissues using the parallel plane plate approximation. Therefore, its mathematical formulation assumes sample thicknesses comparable to those of leaf tissues. This structural difference concerning fruit tissue, characterized by greater density and optical complexity, motivates the need for specific calibration, adjusting the biophysical parameters to adequately represent the interaction of radiation with the interior of the fruit.
Like other radiative transfer models applied to the study of electromagnetic radiation propagation in material media, PROSPECT can be adapted to fruit tissues by incorporating biochemical and structural parameters relevant to their physiology. These include pigment concentrations, which are responsible for spectral absorption and fruit coloration, as well as tissue structure, which significantly influences light scattering behavior within the medium. Furthermore, environmental factors such as water stress can induce modifications in the fruit’s spectral response, particularly in the 970 to 1200 nm range, where alterations associated with water absorption are observed. Therefore, validating the model under conditions of water variability is essential to ensure its robustness. This validation requires spectral acquisition systems with an extended range, in contrast with the spectral window of the CTIS system used in this study.

5. Conclusions

In this numerical study, we propose a GA-based multi-objective stochastic optimization method to accurately retrieve the concentrations of Chlorophyll  C a b , Carotenoids C a r , Capsanthin C a p 1 , and Capsorubin C a p 2 with uncertainties of less than 2%. We also determine the mesocarp structure parameter N, the total reflectance fraction detected K d , the proportion of DHT that contributes to the total reflectance K, and the total absorption coefficient μ a of fresh pepper (Capsicum annuum) of two different pigmentations (green and red). By minimizing a Euclidean distance-based objective function using vectorization and GPU acceleration, our multi-objective GA efficiently obtains the best fit of the calibrated PROSPECT radiative transfer model to the spectral dataset given by its corresponding SESD.
The statistical analysis of the retrieved concentrations is comparable to the results reported in the literature, which correspond to techniques that require prior sample preparation and allow only individual estimation of concentrations. Thus, the proposed multi-objective GA exhibits promising potential for rapid and non-destructive quantitative analysis by simultaneously and accurately estimating physicochemical parameters. We successfully demonstrate that the application of the in-house CTIS system, combined with a GA and the calibrated PROSPECT model, is feasible for the rapid estimation of the physicochemical properties of fresh Capsicum fruit. Additionally, the proposed multi-objective GA inverse algorithm can be applied with different optical instruments that provide diffuse reflectance information in the visible range of various pepper samples, demonstrating its versatility for parameter estimation.
Although the calibrated model performs satisfactorily under the specific conditions of the samples analyzed, its extension to other cultivars, ripening stages, or agroclimatic environments requires recalibration, considering variations in the biochemical composition and internal structure of the fruit. This need for methodological adaptation represents an opportunity to develop more versatile spectral models capable of capturing the physiological diversity of fruit tissues in authentic and dynamic agricultural contexts.

Author Contributions

Conceptualization, F.N.-J. and J.C.-R.; methodology, F.N.-J.; software, F.N.-J. and J.C.-R.; validation, F.N.-J., J.C.-R. and J.J.S.-E.; formal analysis, F.N.-J., J.C.-R. and J.J.S.-E.; investigation, F.N.-J.; writing—original draft preparation, F.N.-J., J.C.-R. and J.J.S.-E.; writing—review and editing, F.N.-J., J.C.-R. and J.J.S.-E.; supervision, J.C.-R. All authors have read and agreed to the published version of the manuscript.

Funding

This research received no external funding.

Data Availability Statement

The raw data supporting the conclusions of this article will be made available by the authors on request.

Acknowledgments

We appreciate the support from Secretaría de Ciencia, Humanidades, Tecnología e Innovación (SECIHTI) from Mexico and Centro de Enseñanza Técnica Industrial CETI–Mexico.

Conflicts of Interest

The authors declare that there are no competing interests associated with this article.

Abbreviations

The following abbreviations are used in this manuscript:
SESDExperimental Spectral Data
CTISComputed Tomography Imaging Spectrometer
GAGenetic Algorithm
HPLCHigh-Performance Liquid Chromatography
FFFSFront-Facing Fluorescence Spectroscopy
SISpectral Images
MEMaximization–Expectation
DHRDirectional Hemispherical Reflectance
DHTDirectional Hemispherical Transmittance
GPUGraphics Processing Unit
EDEuclidean Distance
STDStandard Deviation
RMSERoot Mean Square Error
MAPEMean Absolute Percentage Error

References

  1. Sancho, J.; Navarro, F. Pimientos y Pimentón. Estudio Químico-Físico; Instituto de Orientación: Murcia, Spain, 1962. [Google Scholar]
  2. Monsurat, M.R.; Suraj, A.S.; Olumide, A.O. Physicochemical Properties and Mineral Composition of Capsicum annum and Capsicum frutescens Oils. IOSR-JAC 2014, 7, 112–116. [Google Scholar] [CrossRef]
  3. Batiha, G.E.-S.; Alqahtani, A.; Ojo, O.A.; Shaheen, H.M.; Wasef, L.; Elzeiny, M.; Ismail, M.; Shalaby, M.; Murata, T.; Zaragoza-Bastida, A.; et al. Biological Properties, Bioactive Constituents, and Pharmacokinetics of Some Capsicum spp. and Capsaicinoids. Int. J. Mol. Sci. 2020, 21, 5179. [Google Scholar] [CrossRef]
  4. Food and Agriculture Organization of the United Nations (FAO). FAOSTAT; FAO: Rome, Italy, 2021; Available online: https://www.fao.org/faostat/ (accessed on 21 March 2025).
  5. Paredes, A.; Peche, J.; León, N. Index of Carotenoids of Bell Pepper (Capsicum annuum) Based on Color Measurement, Using Hyperspectral and Digital Images. Sci. Agropecu. 2019, 10, 531–539. [Google Scholar] [CrossRef]
  6. Kim, J.-S.; An, C.G.; Park, J.-S.; Lim, Y.P.; Kim, S. Carotenoid Profiling from 27 Types of Paprika (Capsicum annuum L.) with Different Colors, Shapes, and Cultivation Methods. Food Chem. 2016, 201, 64–71. [Google Scholar] [CrossRef] [PubMed]
  7. Deli, J.; Molnár, P.; Matus, Z.; Tóth, G. Carotenoid Composition in the Fruits of Red Paprika (Capsicum annuum Var. Lycopersiciforme Rubrum) During Ripening; Biosynthesis of Carotenoids in Red Paprika. J. Agric. Food Chem. 2001, 49, 1517–1523. [Google Scholar] [CrossRef] [PubMed]
  8. Mohd Hassan, N.; Yusof, N.A.; Yahaya, A.F.; Mohd Rozali, N.N.; Othman, R. Carotenoids of Capsicum Fruits: Pigment Profile and Health-Promoting Functional Attributes. Antioxidants 2019, 8, 469. [Google Scholar] [CrossRef] [PubMed]
  9. Villa-Rivera, M.G.; Ochoa-Alejo, N. Chili Pepper Carotenoids: Nutraceutical Properties and Mechanisms of Action. Molecules 2020, 25, 5573. [Google Scholar] [CrossRef]
  10. Shim, Y.-S.; Kim, K.-J.; Seo, D.; Ito, M.; Nakagawa, H.; Arai, S.; Ha, J. Simultaneous Determination of Free Capsorubin and Capsanthin in Red Pepper Powder Using U-HPLC. J. AOAC Int. 2013, 96, 341–345. [Google Scholar] [CrossRef]
  11. Kim, J.-S.; Park, J.-T.; Ahn, J.; Ha, T.-Y.; Kim, S. Optimization of Accelerated Solvent Extraction of Capsanthin from Red Paprika (Capsicum annuum L.) Using Response Surface Methodology. Food Sci. Technol. Res. 2019, 25, 519–528. [Google Scholar] [CrossRef]
  12. Patsilinakos, A.; Ragno, R.; Carradori, S.; Petralito, S.; Cesa, S. Carotenoid Content of Goji Berries: CIELAB, HPLC-DAD Analyses and Quantitative Correlation. Food Chem. 2018, 268, 49–56. [Google Scholar] [CrossRef]
  13. Lozada, D.N.; Coon, D.L.; Guzmán, I.; Bosland, P.W. Heat Profiles of ‘Superhot’ and New Mexican Type Chile Peppers (Capsicum Spp.). Sci. Hortic. 2021, 283, 110088. [Google Scholar] [CrossRef]
  14. Guevara, L.; Domínguez-Anaya, M.Á.; Ortigosa, A.; González-Gordo, S.; Díaz, C.; Vicente, F.; Corpas, F.J.; Pérez del Palacio, J.; Palma, J.M. Identification of Compounds with Potential Therapeutic Uses from Sweet Pepper (Capsicum annuum L.) Fruits and Their Modulation by Nitric Oxide (NO). Int. J. Mol. Sci. 2021, 22, 4476. [Google Scholar] [CrossRef] [PubMed]
  15. Campmajó, G.; Rodríguez-Javier, L.R.; Saurina, J.; Núñez, O. Assessment of Paprika Geographical Origin Fraud by High-Performance Liquid Chromatography with Fluorescence Detection (HPLC-FLD) Fingerprinting. Food Chem. 2021, 352, 129397. [Google Scholar] [CrossRef]
  16. Tan, J.; Li, M.-F.; Li, R.; Jiang, Z.-T.; Tang, S.-H.; Wang, Y. Front-Face Synchronous Fluorescence Spectroscopy for Rapid and Non-Destructive Determination of Free Capsanthin, the Predominant Carotenoid in Chili (Capsicum annuum L.) Powders Based on Aggregation-Induced Emission. Spectrochim. Acta Part A Mol. Biomol. Spectrosc. 2021, 255, 119696. [Google Scholar] [CrossRef] [PubMed]
  17. Logan, R.D.; Scherrer, B.J.; Senecal, J.; Walton, N.S.; Peerlinck, A.; Sheppard, J.W.; Shaw, J.A. Hyperspectral Imaging and Machine Learning for Monitoring Produce Ripeness. In Sensing for Agriculture and Food Quality and Safety XII; Kim, M.S., Cho, B.-K., Chin, B.A., Eds.; SPIE: Bellingham, WA, USA, 2020; p. 25. [Google Scholar] [CrossRef]
  18. Schmilovitch, Z.; Ignat, T.; Alchanatis, V.; Gatker, J.; Ostrovsky, V.; Felföldi, J. Hyperspectral Imaging of Intact Bell Peppers. Biosyst. Eng. 2014, 117, 83–93. [Google Scholar] [CrossRef]
  19. Althaus, B.; Blanke, M. Non-Destructive, Opto-Electronic Determination of the Freshness and Shrivel of Bell Pepper Fruits. J. Imaging 2020, 6, 122. [Google Scholar] [CrossRef]
  20. Okamoto, T.; Takahashi, A.; Yamaguchi, I. Simultaneous Acquisition of Spectral and Spatial Intensity Distribution. Appl. Spectrosc. 1993, 47, 1198–1202. [Google Scholar] [CrossRef]
  21. Descour, M.R.; Dereniak, E.L.; Dubey, A.C. Mine Detection Using Instantaneous Spectral Imaging. In Detection Technologies for Mines and Minelike Targets; Dubey, A.C., Cindrich, I., Ralston, J.M., Rigano, K.A., Eds.; SPIE: Bellingham, WA, USA, 1995; Volume 2496, pp. 286–304. [Google Scholar] [CrossRef]
  22. Descour, M.R.; Volin, C.E.; Dereniak, E.L.; Thome, K.J.; Schumacher, A.B.; Wilson, D.W.; Maker, P.D. Demonstration of a High-Speed Nonscanning Imaging Spectrometer. Opt. Lett. 1997, 22, 1271. [Google Scholar] [CrossRef]
  23. Johnson, W.R.; Wilson, D.W.; Fink, W.; Humayun, M.; Bearman, G. Snapshot Hyperspectral Imaging in Ophthalmology. J. Biomed. Opt. 2007, 12, 014036. [Google Scholar] [CrossRef]
  24. Habel, R.; Kudenov, M.; Wimmer, M. Practical Spectral Photography. Comput. Graph. Forum 2012, 31, 449–458. [Google Scholar] [CrossRef]
  25. Lu, R.; Van Beers, R.; Saeys, W.; Li, C.; Cen, H. Measurement of Optical Properties of Fruits and Vegetables: A Review. Postharvest Biol. Technol. 2020, 159, 111003. [Google Scholar] [CrossRef]
  26. Jacquemoud, S.; Baret, F. PROSPECT: A Model of Leaf Optical Properties Spectra. Remote Sens. Environ. 1990, 34, 75–91. [Google Scholar] [CrossRef]
  27. Merzlyak, M.N.; Gitelson, A.A.; Chivkunova, O.B.; Solovchenko, A.E.; Pogosyan, S.I. Application of Reflectance Spectroscopy for Analysis of Higher Plant Pigments. Russ. J. Plant Physiol. 2003, 50, 704–710. [Google Scholar] [CrossRef]
  28. Merzlyak, M.N.; Solovchenko, A.E.; Gitelson, A.A. Reflectance Spectral Features and Non-Destructive Estimation of Chlorophyll, Carotenoid and Anthocyanin Content in Apple Fruit. Postharvest Biol. Technol. 2003, 27, 197–211. [Google Scholar] [CrossRef]
  29. Sonobe, R.; Yamashita, H.; Mihara, H.; Morita, A.; Ikka, T. Estimation of Leaf Chlorophyll a, b and Carotenoid Contents and Their Ratios Using Hyperspectral Reflectance. Remote Sens. 2020, 12, 3265. [Google Scholar] [CrossRef]
  30. Morales Cruzado, B.; y Montiel, S.V.; Atencio, J.A.D. Genetic Algorithms and MCML Program for Recovery of Optical Properties of Homogeneous Turbid Media. Biomed. Opt. Express 2013, 4, 433. [Google Scholar] [CrossRef]
  31. Mridha, N.; Sahoo, R.N.; Kumar, D.N.; Sehgal, V.K.; Pradhan, S.; Gupta, V.K. Genetic Algorithm Based Inversion Modelling of PROSAIL for Retrieval of Wheat Biophysical Parameters from Bi-Directional Reflectance Data. J. Agric. Phys. 2014, 14, 10. [Google Scholar]
  32. Jiang, J.; Comar, A.; Burger, P.; Bancal, P.; Weiss, M.; Baret, F. Estimation of Leaf Traits from Reflectance Measurements: Comparison between Methods Based on Vegetation Indices and Several Versions of the PROSPECT Model. Plant Methods 2018, 14, 23. [Google Scholar] [CrossRef]
  33. Berger, K.; Verrelst, J.; Féret, J.-B.; Hank, T.; Wocher, M.; Mauser, W.; Camps-Valls, G. Retrieval of Aboveground Crop Nitrogen Content with a Hybrid Machine Learning Method. Int. J. Appl. Earth Obs. Geoinf. 2020, 92, 102174. [Google Scholar] [CrossRef]
  34. Narea-Jiménez, F.; Castro-Ramos, J.; Sánchez-Escobar, J.J.; Muñoz-Morales, A. Assessment of a Computed Tomography Imaging Spectrometer Using an Optimized Expectation-Maximization Algorithm. Appl. Opt. 2022, 61, 6076–6085. [Google Scholar] [CrossRef]
  35. Boren, E.J.; Boschetti, L.; Johnson, D.M. Characterizing the Variability of the Structure Parameter in the PROSPECT Leaf Optical Properties Model. Remote Sens. 2019, 11, 1236. [Google Scholar] [CrossRef]
  36. Allen, W.A.; Gausman, H.W.; Richardson, A.J.; Thomas, J.R. Interaction of Isotropic Light with a Compact Plant Leaf. J. Opt. Soc. Am. 1969, 59, 1376. [Google Scholar] [CrossRef]
  37. Kumar, L.; Schmidt, K.; Dury, S.; Skidmore, A. Imaging Spectrometry and Vegetation Science. In Imaging Spectrometry: Basic Principles and Prospective Applications; van der Meer, F.D., de Jong, S.M., Eds.; Remote sensing and digital image processing; Springer: Dordrecht, The Netherlands, 2010; pp. 111–155. [Google Scholar]
  38. Clementson, L.A.; Wojtasiewicz, B. Dataset on the Absorption Characteristics of Extracted Phytoplankton Pigments. Data Brief 2019, 24, 103875. [Google Scholar] [CrossRef]
  39. Weryszko-Chmielewska, E.; Michałojć, Z. Anatomical Traits of Sweet Pepper (Capsicum annuum L.) Fruit. Acta Agrobot. 2012, 64, 181–188. [Google Scholar] [CrossRef]
  40. Jacquemoud, S.; Ustin, S.L.; Verdebout, J.; Schmuck, G.; Andreoli, G.; Hosgood, B. Estimating Leaf Biochemistry Using the PROSPECT Leaf Optical Properties Model. Remote Sens. Environ. 1996, 56, 194–202. [Google Scholar] [CrossRef]
  41. Govender, M.; Chetty, K.; Bulcock, H. A Review of Hyperspectral Remote Sensing and Its Application in Vegetation and Water Resource Studies. Water SA 2009, 33, 145–151. [Google Scholar] [CrossRef]
  42. Jurise, M.; Udal, A.; Kaugerand, J.; Sell, R. Easy to Use Empirical Model for Green Vegetation Reflection Spectrum in VIS-NIR Range. In Eighth International Conference on Remote Sensing and Geoinformation of the Environment (RSCy2020); Themistocleous, K., Michaelides, S., Ambrosia, V., Hadjimitsis, D.G., Papadavid, G., Eds.; SPIE: Paphos, Cyprus, 2020; p. 36. [Google Scholar] [CrossRef]
  43. Féret, J.-B.; Gitelson, A.A.; Noble, S.D.; Jacquemoud, S. PROSPECT-D: Towards Modeling Leaf Optical Properties through a Complete Lifecycle. Remote Sens. Environ. 2017, 193, 204–215. [Google Scholar] [CrossRef]
  44. Merzlyak, M.N. Modeling Pigment Contributions to Spectral Reflection of Apple Fruit. Photochem. Photobiol. Sci. 2006, 5, 748. [Google Scholar] [CrossRef]
  45. Gen, M.; Cheng, R. Genetic Algorithms and Engineering Optimization; Wiley Series in Engineering Design and Automation; John Wiley & Sons, Inc.: Hoboken, NJ, USA, 1999. [Google Scholar] [CrossRef]
  46. Sánchez Escobar, J.J.; Barbosa Santillán, L.I.; Ramos, J.C.; Barbosa Santillán, L.F. Reconstruyendo La Diferencia de Camino Óptico de Un Interferogram Real Degradado Por Ruido Mediante La Solución de Diferentes Problemas de Optimización. Rev. Mex. Fis. E 2021, 18, 020207. [Google Scholar] [CrossRef]
  47. Vázquez-Montiel, S.; Sánchez-Escobar, J.J.; Fuentes, O. Obtaining the Phase of an Interferogram by Use of an Evolution Strategy: Part I. Appl. Opt. 2002, 41, 3448–3452. [Google Scholar] [CrossRef]
  48. Sanchez-Escobar, J.J.; Magaña, P.A.; Vazquez-Montiel, S. Obtaining the Wavefront Aberrations of a Real Interferogram by Use of a Hybrid Genetic Algorithm. Opt. Eng. 2006, 45, 105605. [Google Scholar] [CrossRef]
  49. Sánchez-Escobar, J.J.; Santillán, L.I.B. Reconstruction of the Wavefront Aberration from Real Interferometric Data Using a Hybrid Evolutionary Optimization Algorithm with Zernike Polynomials. Opt. Eng. 2015, 54, 094102. [Google Scholar] [CrossRef]
  50. LLiu, X.; Li, Y. Optimal Design of DFG-Based Wavelength Conversion Based on Hybrid Genetic Algorithm. Opt. Express 2003, 11, 1677–1688. [Google Scholar] [CrossRef]
  51. Lara, A.; Sanchez, G.; Coello, C.A.C.; Schutze, O. HCS: A New Local Search Strategy for Memetic Multiobjective Evolutionary Algorithms. IEEE Trans. Evol. Comput. 2010, 14, 112–132. [Google Scholar] [CrossRef]
  52. Sindhya, K.; Miettinen, K.; Deb, K. A Hybrid Framework for Evolutionary Multi-Objective Optimization. IEEE Trans. Evol. Comput. 2013, 17, 495–511. [Google Scholar] [CrossRef]
  53. MathWorks. Global Optimization Toolbox; The MathWorks, Inc.: Carlsbad, CA, USA, 2019; Available online: https://www.mathworks.com/products/global-optimization.html (accessed on 21 March 2025).
  54. Ackora-Prah, J.; Gyamerah, S.A.; Andam, P.S. A Heuristic Crossover for Portfolio Selection. Appl. Math. Sci. 2014, 8, 3215–3227. [Google Scholar] [CrossRef]
  55. Marsili Libelli, S.; Alba, P. Adaptive Mutation in Genetic Algorithms. Soft Comput. 2000, 4, 76–80. [Google Scholar] [CrossRef]
  56. Luning, P.A.; de Rijk, T.; Wichers, H.J.; Roozen, J.P. Gas Chromatography, Mass Spectrometry, and Sniffing Port Analyses of Volatile Compounds of Fresh Bell Peppers (Capsicum annuum) at Different Ripening Stages. J. Agric. Food Chem. 1994, 42, 977–983. [Google Scholar] [CrossRef]
  57. Guzman, I.; Hamby, S.; Romero, J.; Bosland, P.W.; O’Connell, M.A. Variability of Carotenoid Biosynthesis in Orange Colored Capsicum Spp. Plant Sci. 2010, 179, 49–59. [Google Scholar] [CrossRef] [PubMed]
  58. Adams, M.J. Chemometrics in Analytical Spectroscopy, 2nd ed.; RSC analytical spectroscopy monographs; Royal Society of Chemistry: Cambridge, UK, 2004. [Google Scholar]
  59. Räty, J.; Peiponen, K.-E.; Asakura, T. UV-Visible Reflection Spectroscopy of Liquids; Springer: Berlin/Heidelberg, Germany, 2004. [Google Scholar]
  60. Mark, H.; Workman, J.L. Chemometrics in Spectroscopy; Academic Press: Cambridge, MA, USA, 2018. [Google Scholar]
  61. Mishra, P.; Karami, A.; Nordon, A.; Rutledge, D.N.; Roger, J.-M. Automatic De-Noising of Close-Range Hyperspectral Images with a Wavelength-Specific Shearlet-Based Image Noise Reduction Method. Sens. Actuators B Chem. 2019, 281, 1034–1044. [Google Scholar] [CrossRef]
  62. Garcia, J.P.; Dereniak, E.L. Mixed-Expectation Image-Reconstruction Technique. Appl. Opt. 1999, 38, 3745–3748. [Google Scholar] [CrossRef]
  63. Mukaka, M.M. Statistics Corner: A Guide to Appropriate Use of Correlation Coefficient in Medical Research. Malawi Med. J. 2012, 24, 69–71. [Google Scholar] [PubMed]
  64. Wang, W.; Lu, Y. Analysis of the Mean Absolute Error (MAE) and the Root Mean Square Error (RMSE) in Assessing Rounding Model. IOP Conf. Ser. Mater. Sci. Eng. 2018, 324, 012049. [Google Scholar] [CrossRef]
  65. Khan, S.S.; Madden, M.G. New Similarity Metrics for Raman Spectroscopy. Chemom. Intell. Lab. Syst. 2012, 114, 99–108. [Google Scholar] [CrossRef]
  66. Har-Peled, S.; Raichel, B. The Fréchet Distance Revisited and Extended. ACM Trans. Algorithms 2014, 10, 1–22. [Google Scholar] [CrossRef]
  67. Volin, C.E.; Descour, M.R.; Dereniak, E.L. Signal-to-Noise Ratio Analysis of the Computed Tomography Imaging Spectrometer. In Proceedings of the SPIE, San Diego, CA, USA, 16 October 1998; Volume 3438, pp. 68–77. [Google Scholar] [CrossRef]
  68. Hillier, F.S.; Lieberman, G.J. Introduction to Operations Research, 9th ed.; McGraw-Hill Higher Education: New York, NY, USA, 2010. [Google Scholar]
  69. Nocedal, J.; Wright, S.J. Numerical Optimization, 2nd ed.; Springer series in operations research; Springer: New York, NY, USA, 2006. [Google Scholar]
  70. Schittkowski, K. An Active Set Strategy for Solving Optimization Problems with up to 200,000,000 Nonlinear Constraints. Appl. Numer. Math. 2009, 59, 2999–3007. [Google Scholar] [CrossRef]
  71. Fowler, M.E.; Mikota, S.K. Appendix 4: Toxicology Terms, Abbreviations, and Equivalents. In Biology, Medicine, and Surgery of Elephants; Wiley: Hoboken, NJ, USA, 2006; pp. 497–498. [Google Scholar] [CrossRef]
  72. Yi, Q.; Jiapaer, G.; Chen, J.; Bao, A.; Wang, F. Different Units of Measurement of Carotenoids Estimation in Cotton Using Hyperspectral Indices and Partial Least Square Regression. ISPRS J. Photogramm. Remote Sens. 2014, 91, 72–84. [Google Scholar] [CrossRef]
  73. Tyner, T.; Francis, J. Useful Equations and Conversions; ACS Reagent Chemicals; American Chemical Society: Washington, DC, USA, 2017; pp. 1–2. [Google Scholar] [CrossRef]
  74. Gitelson, A.A.; Zur, Y.; Chivkunova, O.B.; Merzlyak, M.N. Assessing Carotenoid Content in Plant Leaves with Reflectance Spectroscopy. Photochem. Photobiol. 2002, 75, 272. [Google Scholar] [CrossRef]
  75. Moser, D.; Matile, P. Chlorophyll Breakdown in Ripening Fruits of Capsicum annuum. J. Plant Physiol. 1997, 150, 759–761. [Google Scholar] [CrossRef]
  76. Féret, J.-B.; Berger, K.; de Boissieu, F.; Malenovský, Z. PROSPECT-PRO for Estimating Content of Nitrogen-Containing Leaf Proteins and Other Carbon-Based Constituents. Remote Sens. Environ. 2021, 252, 112173. [Google Scholar] [CrossRef]
  77. Ignat, T.; Schmilovitch, Z.; Feföldi, J.; Bernstein, N.; Steiner, B.; Egozi, H.; Hoffman, A. Nonlinear Methods for Estimation of Maturity Stage, Total Chlorophyll, and Carotenoid Content in Intact Bell Peppers. Biosyst. Eng. 2013, 114, 414–425. [Google Scholar] [CrossRef]
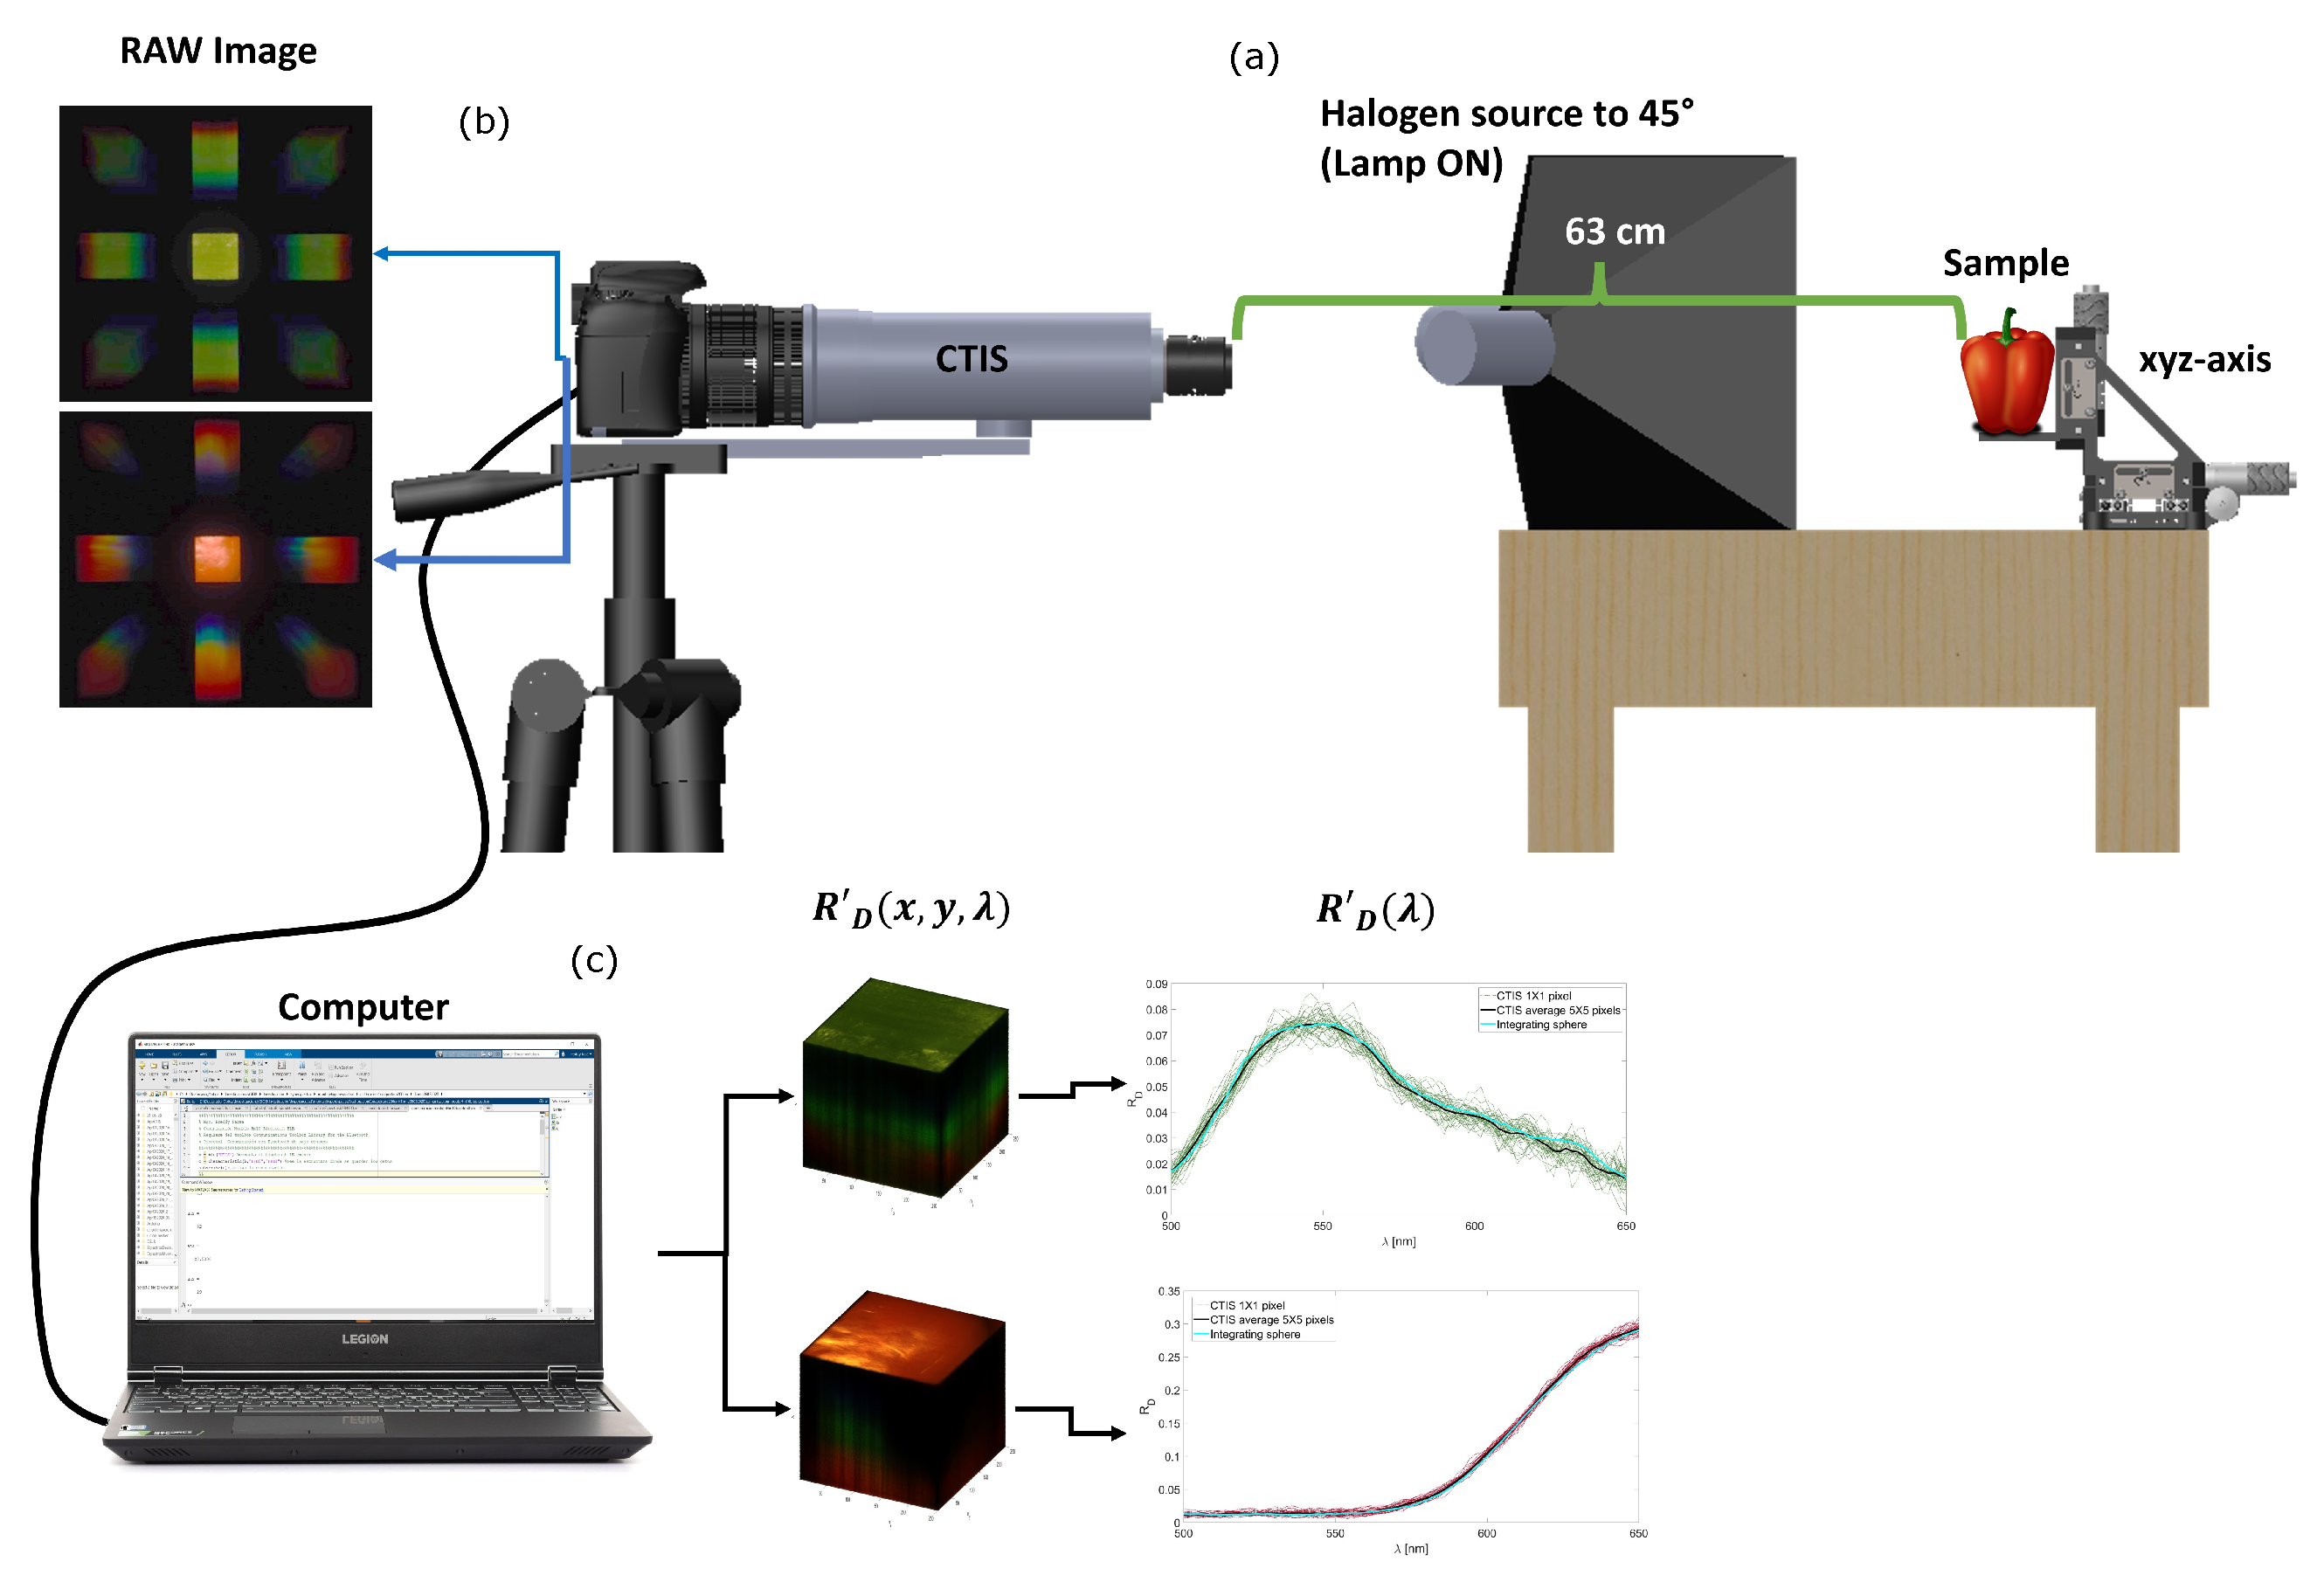
Figure 1. Experimental scheme of data acquisition SESD using a CTIS system. (a) Location of the samples and illumination with a halogen source. (b) Acquisition of CTIS images of the bell pepper samples and (c) processing of the CTIS images to obtain SESD information.
Agriengineering 07 00284 g001
Figure 2. Calibration of the PROSPECT model. (a) Schematic of the calibrated model. (b) Fits with the calibrated and uncalibrated PROSPECT model. (c) Residual of the fit with calibrated and uncalibrated PROSPECT, both referring to the spectral response of a green pepper.
Agriengineering 07 00284 g002
Figure 3. Representation of the input and output data of the calibrated PROSPECT model.
Agriengineering 07 00284 g003
Figure 4. Flowchart for estimating the different parameters of bell pepper using genetic algorithms.
Agriengineering 07 00284 g004
Figure 5. Synthetic data fit with 20% noise, using GA optimization method. (a) Synthetic data for green pepper. (b) Synthetic data for red pepper. (c) Average residual value.
Agriengineering 07 00284 g005
Figure 6. Experimental diffuse reflectance spectra. (a) Spectra of different peppers. (b) Green pepper (boxplot). (c) Red pepper (boxplot).
Agriengineering 07 00284 g006
Figure 7. Metrics for measuring similarity between curves: (a) correlation, (b) RMSE, (c) Euclidean distance, and (d) Fréchet distance. (e) Evolution of the fitness functions according to generations.
Agriengineering 07 00284 g007
Figure 8. Concentrations estimated with our method correlated with (a) total Chlorophyll content ( C H L ) and (b) Carotenoids ( C A R ). The solid line is the best fit function. The dotted lines represent the 95% confidence intervals.
Agriengineering 07 00284 g008
Table 1. Comparative analysis of MAPE (%) across optimization methods for synthetic green and red pepper samples with 7% and 20% added noise.
MethodsGreen PepperRed Pepper
Noise 7%Noise 20%Noise 7%Noise 20%
GA3.898.463.145.38
Interior-Point21.9434.423.979.57
SQP59.7655.9212.1634.93
Active-Set22.1333.848.359.44
Table 2. Estimated average parameters for 30 green and 30 red bell peppers.
Green Pepper
N C ab * [%] C ar * [%] Cap 1 * [%] Cap 2 * [%] K d K RMSE
Average4.31385.5767.53183.1132.070.180.032.130.370.480.88 3.83 × 10 3
Typical error0.0417.961.018.941.030.040.010.120.020.010.02 2.92 × 10 4
Reference-416.6068.72186.7930.810.470.082.330.38---
Δ -31.031.193.681.260.290.050.200.01---
Red pepper
N C a b * [%] C a r * [%] C a p 1 * [%] C a p 2 * [%] K d KRMSE
Average4.1326.426.6989.8722.78251.4063.7126.916.820.470.96 8.34 × 10 3
Typical error0.031.760.472.500.737.111.202.030.490.000.01 3.38 × 10 4
Reference-20.004.9899.9424.89251.4362.6230.167.51---
Δ -6.421.7110.072.110.031.093.250.69---
* Concentrations μ g / cm 3 .
Disclaimer/Publisher’s Note: The statements, opinions and data contained in all publications are solely those of the individual author(s) and contributor(s) and not of MDPI and/or the editor(s). MDPI and/or the editor(s) disclaim responsibility for any injury to people or property resulting from any ideas, methods, instructions or products referred to in the content.