Identification of Botanical Origin from Pollen Grains in Honey Using Computer Vision-Based Techniques
Abstract
1. Introduction
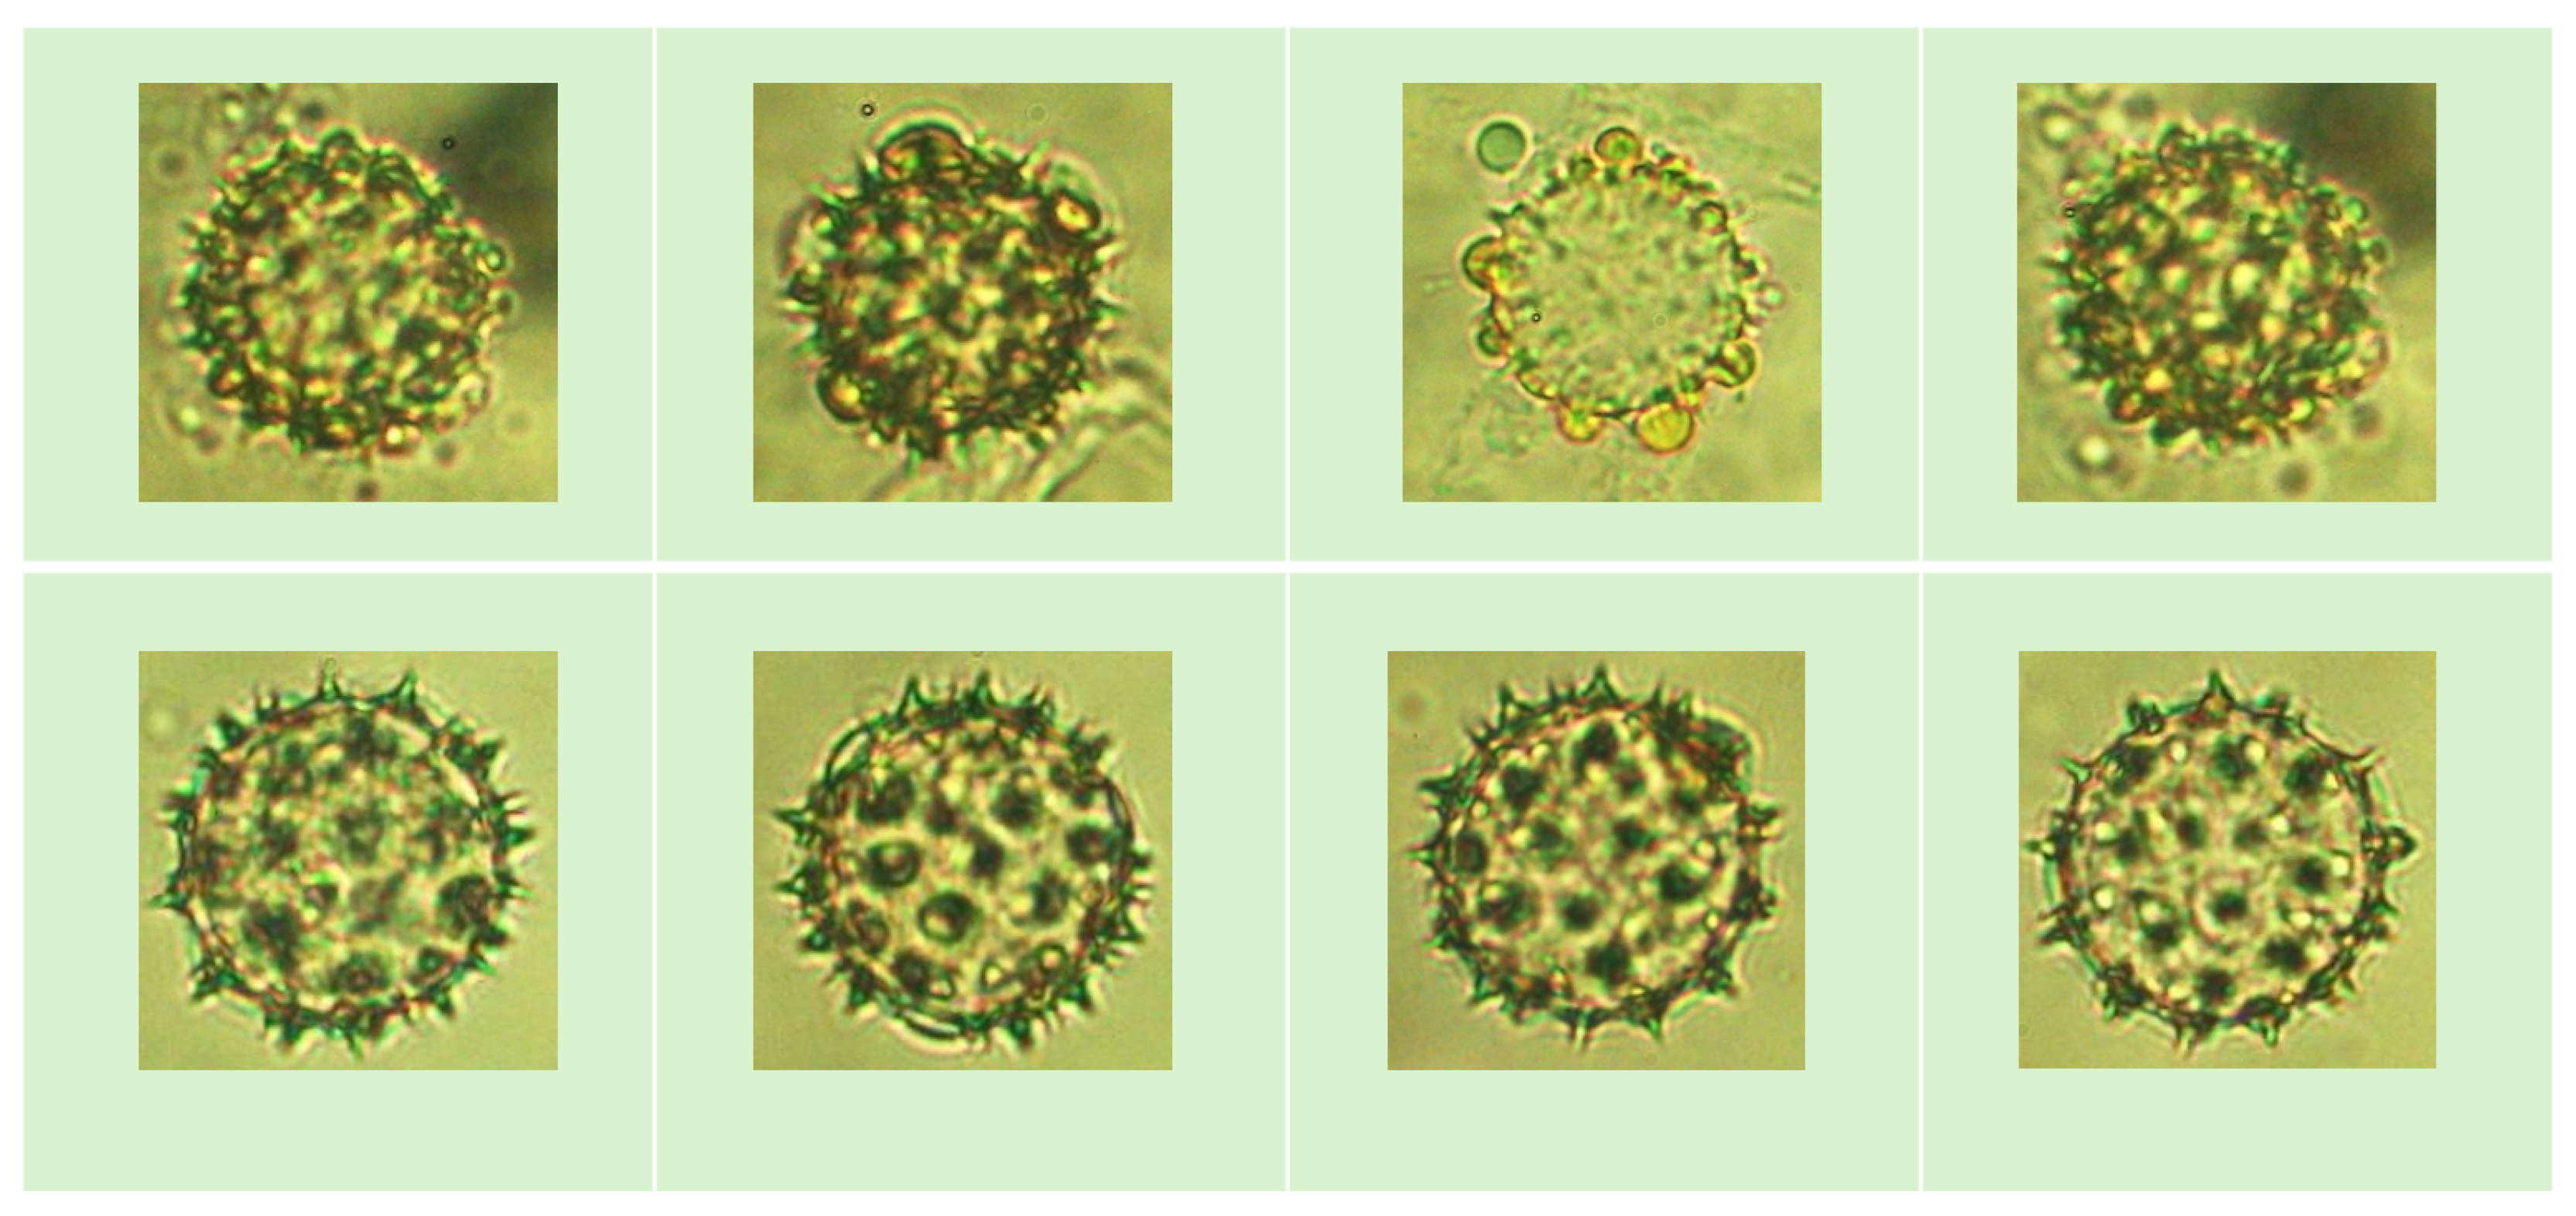
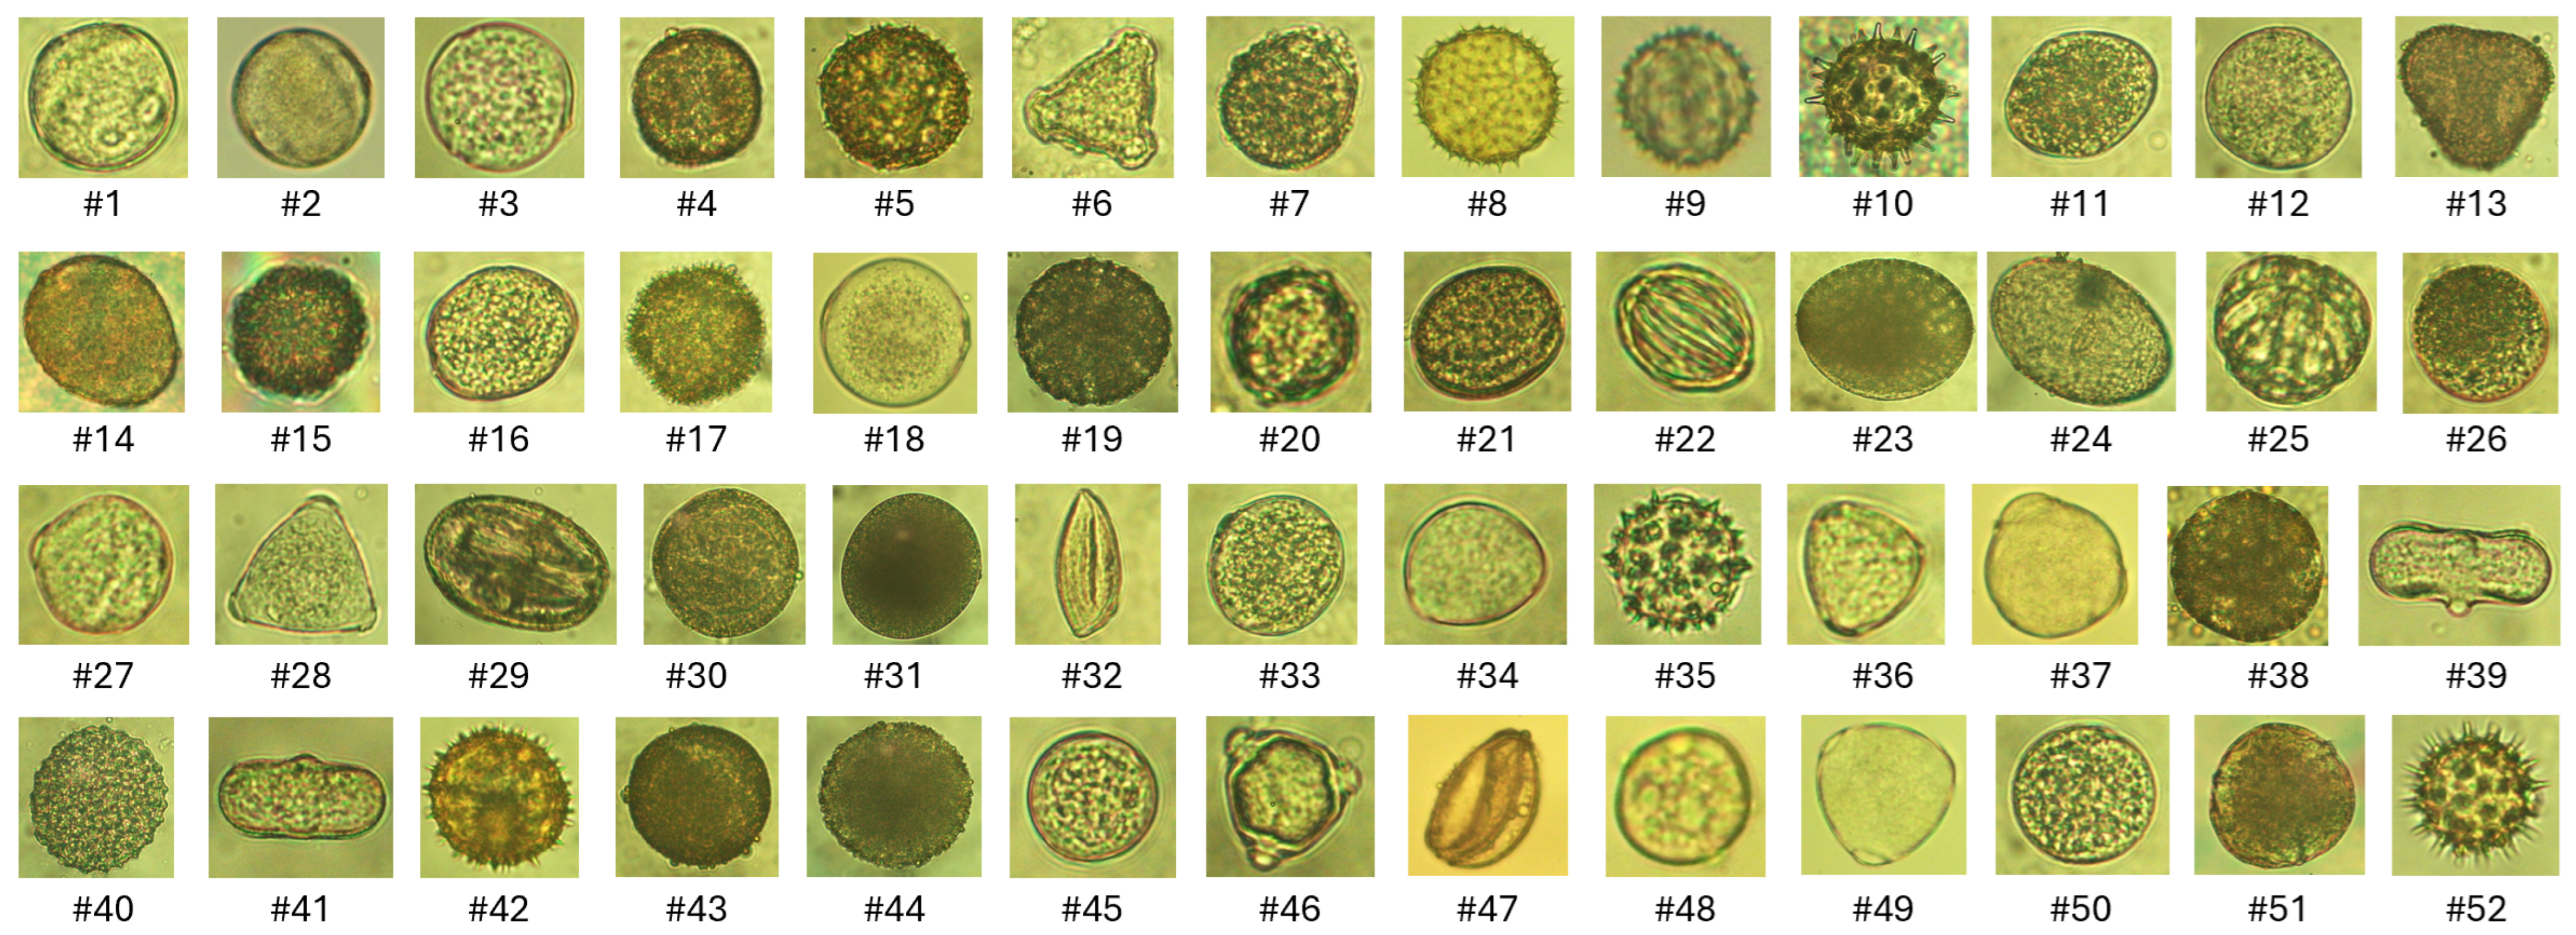
- We first introduce a new pollen grain dataset consisting of images of 52 pollen grains in an urban area of northern Vietnam.
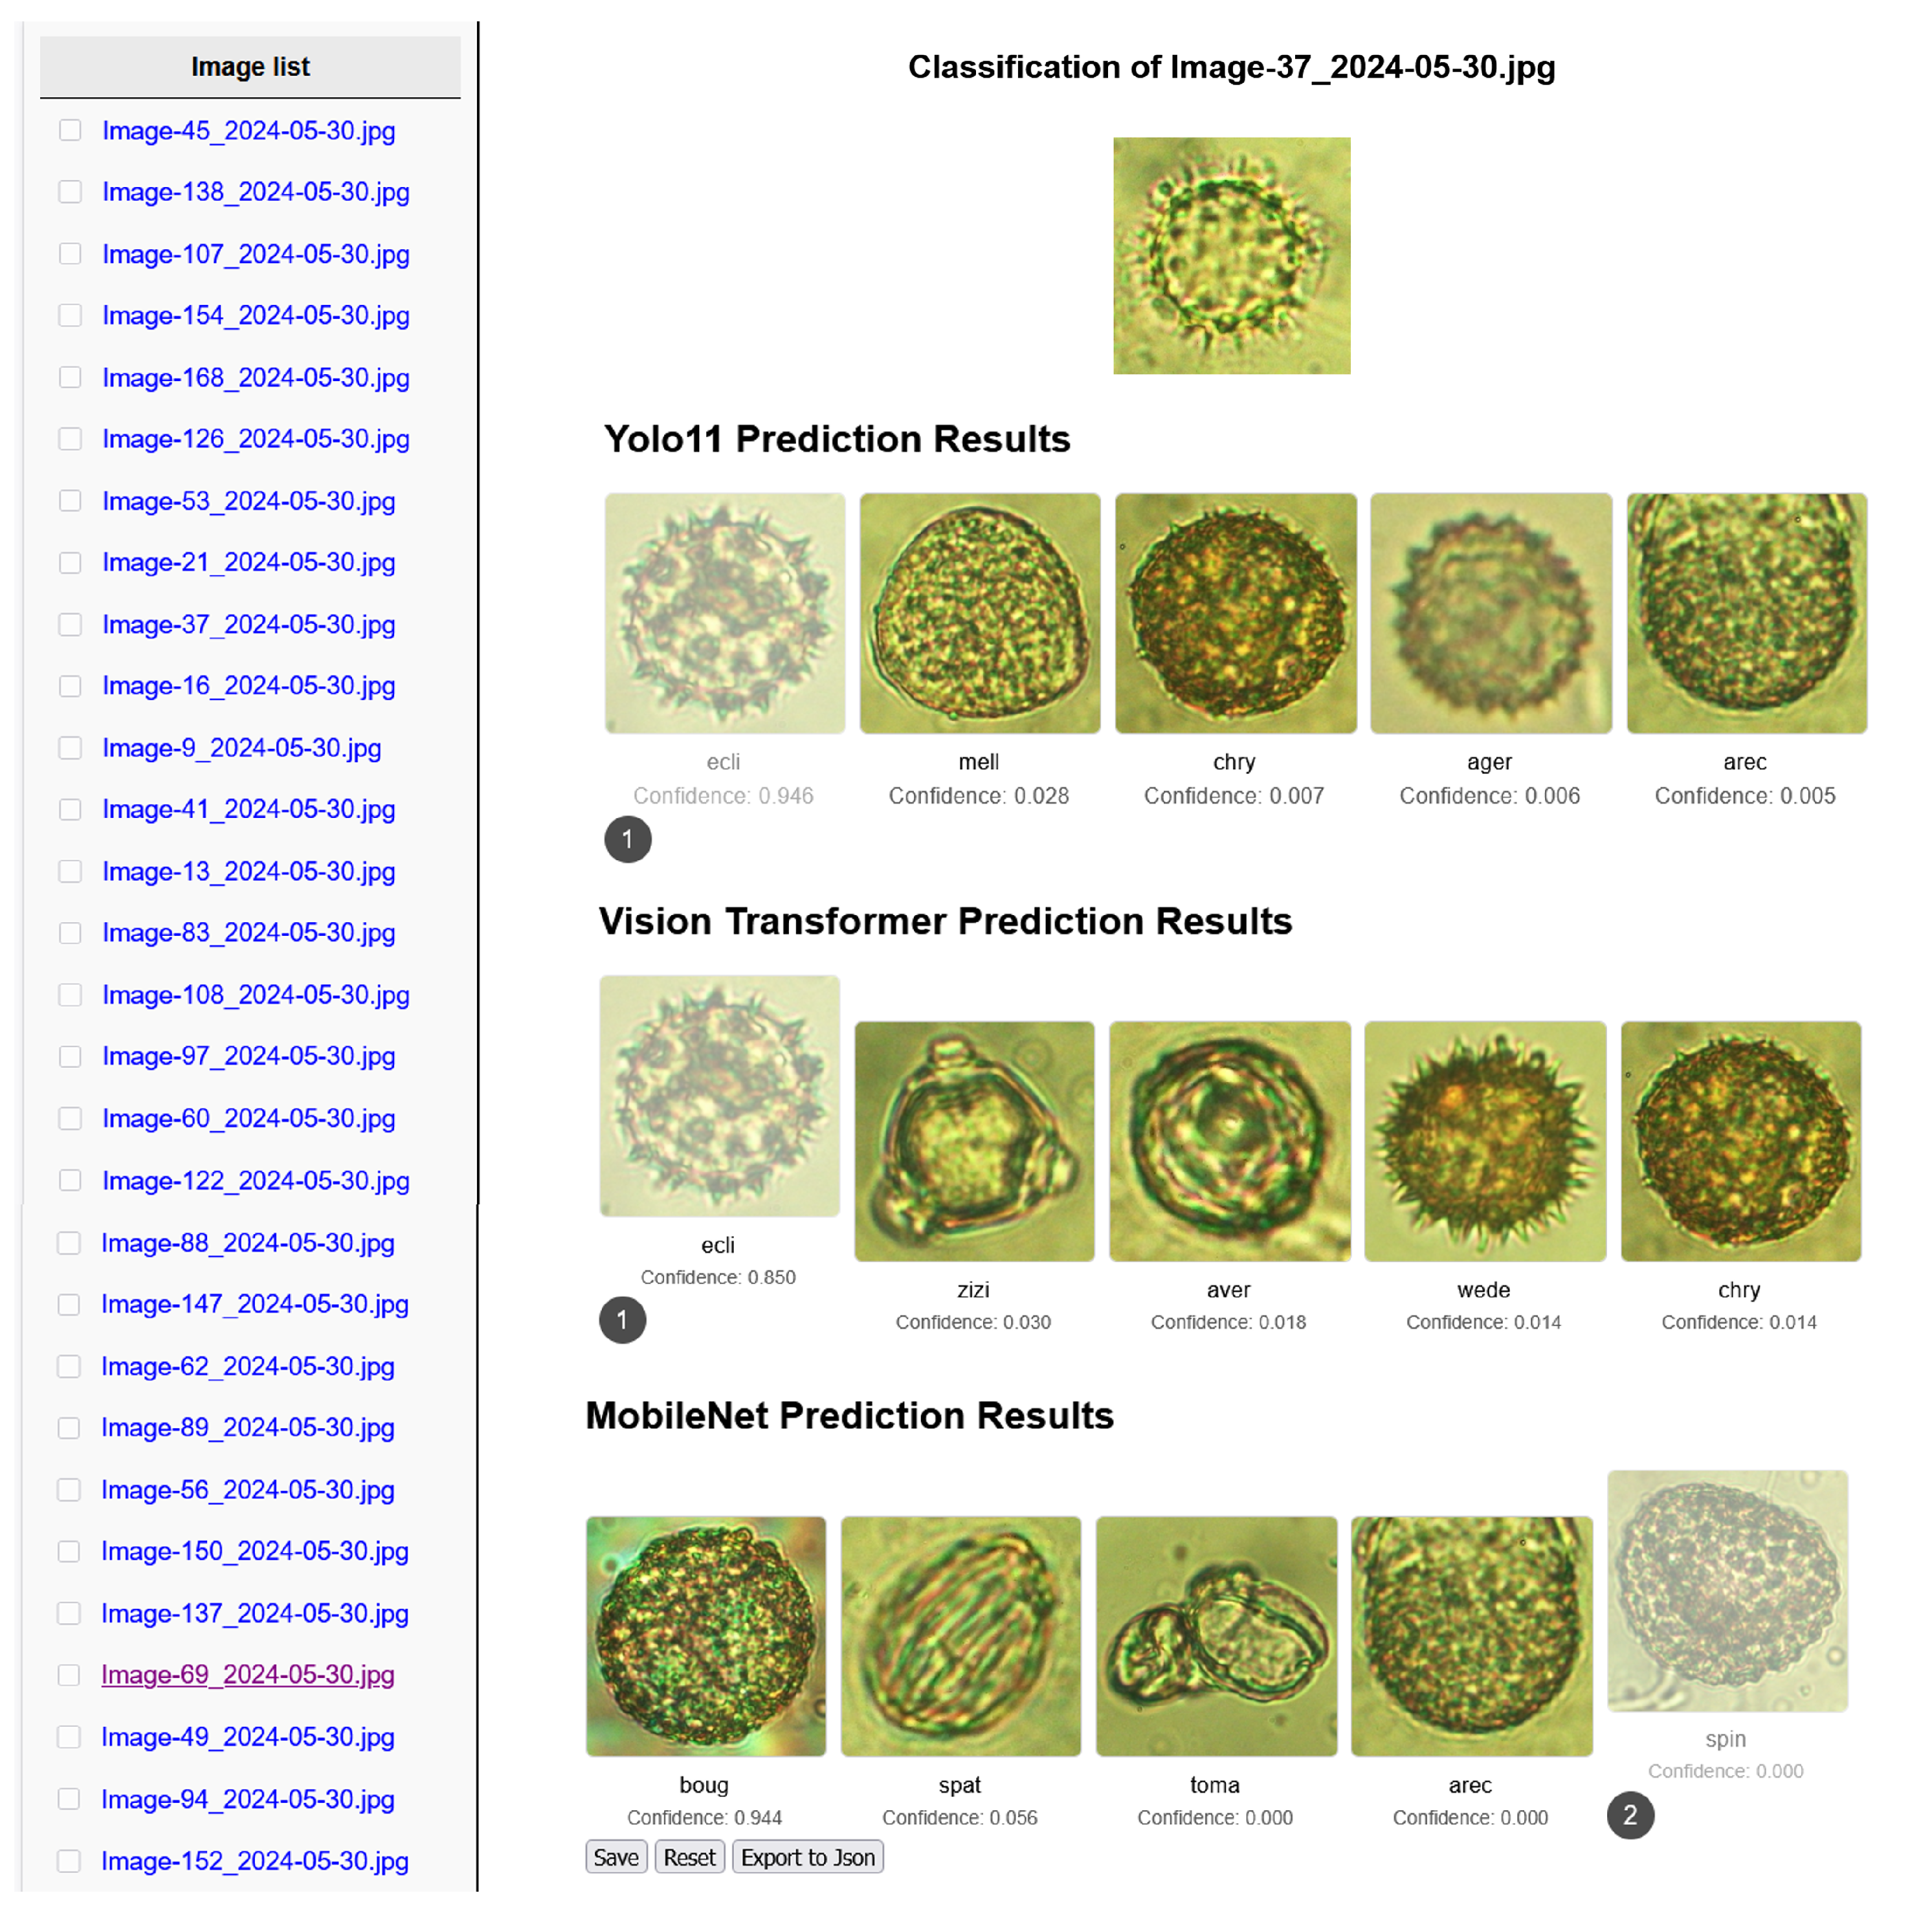
- We present the proposed augmentation data and the fusion schema, combining the results of YOLO11 and Vision Transformer, which helps to handle the data distribution shift problem of the pollen grain images.
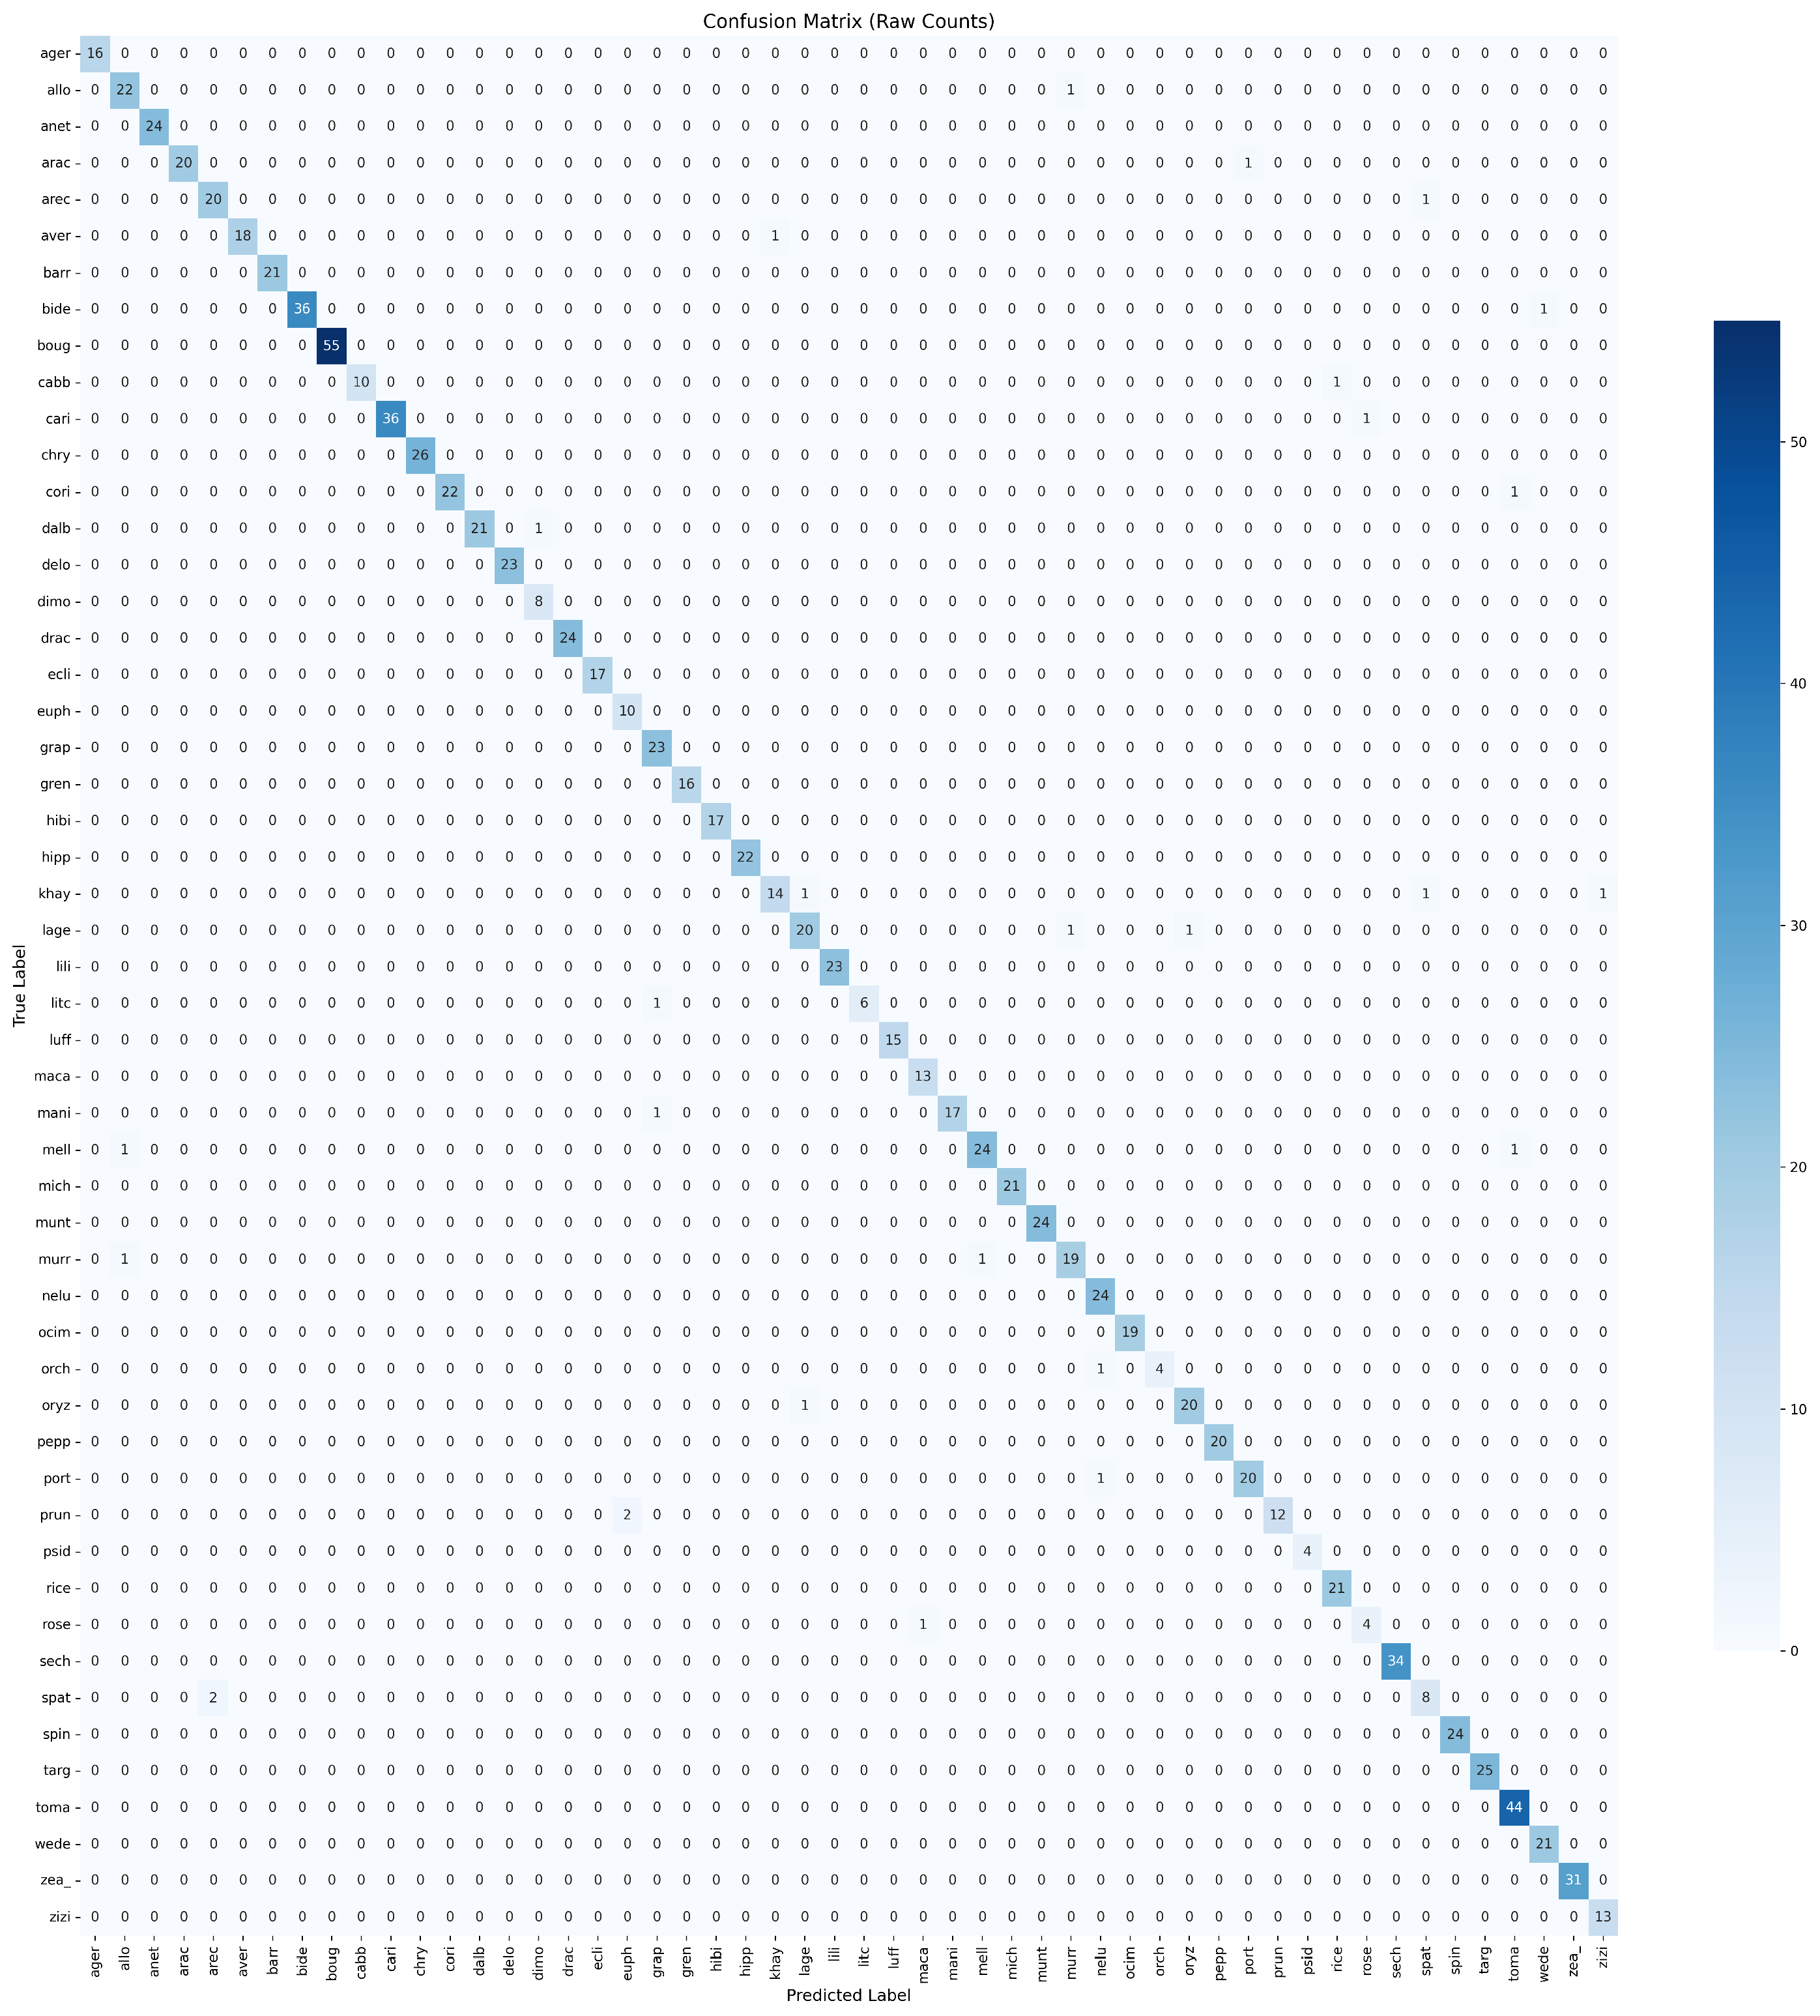
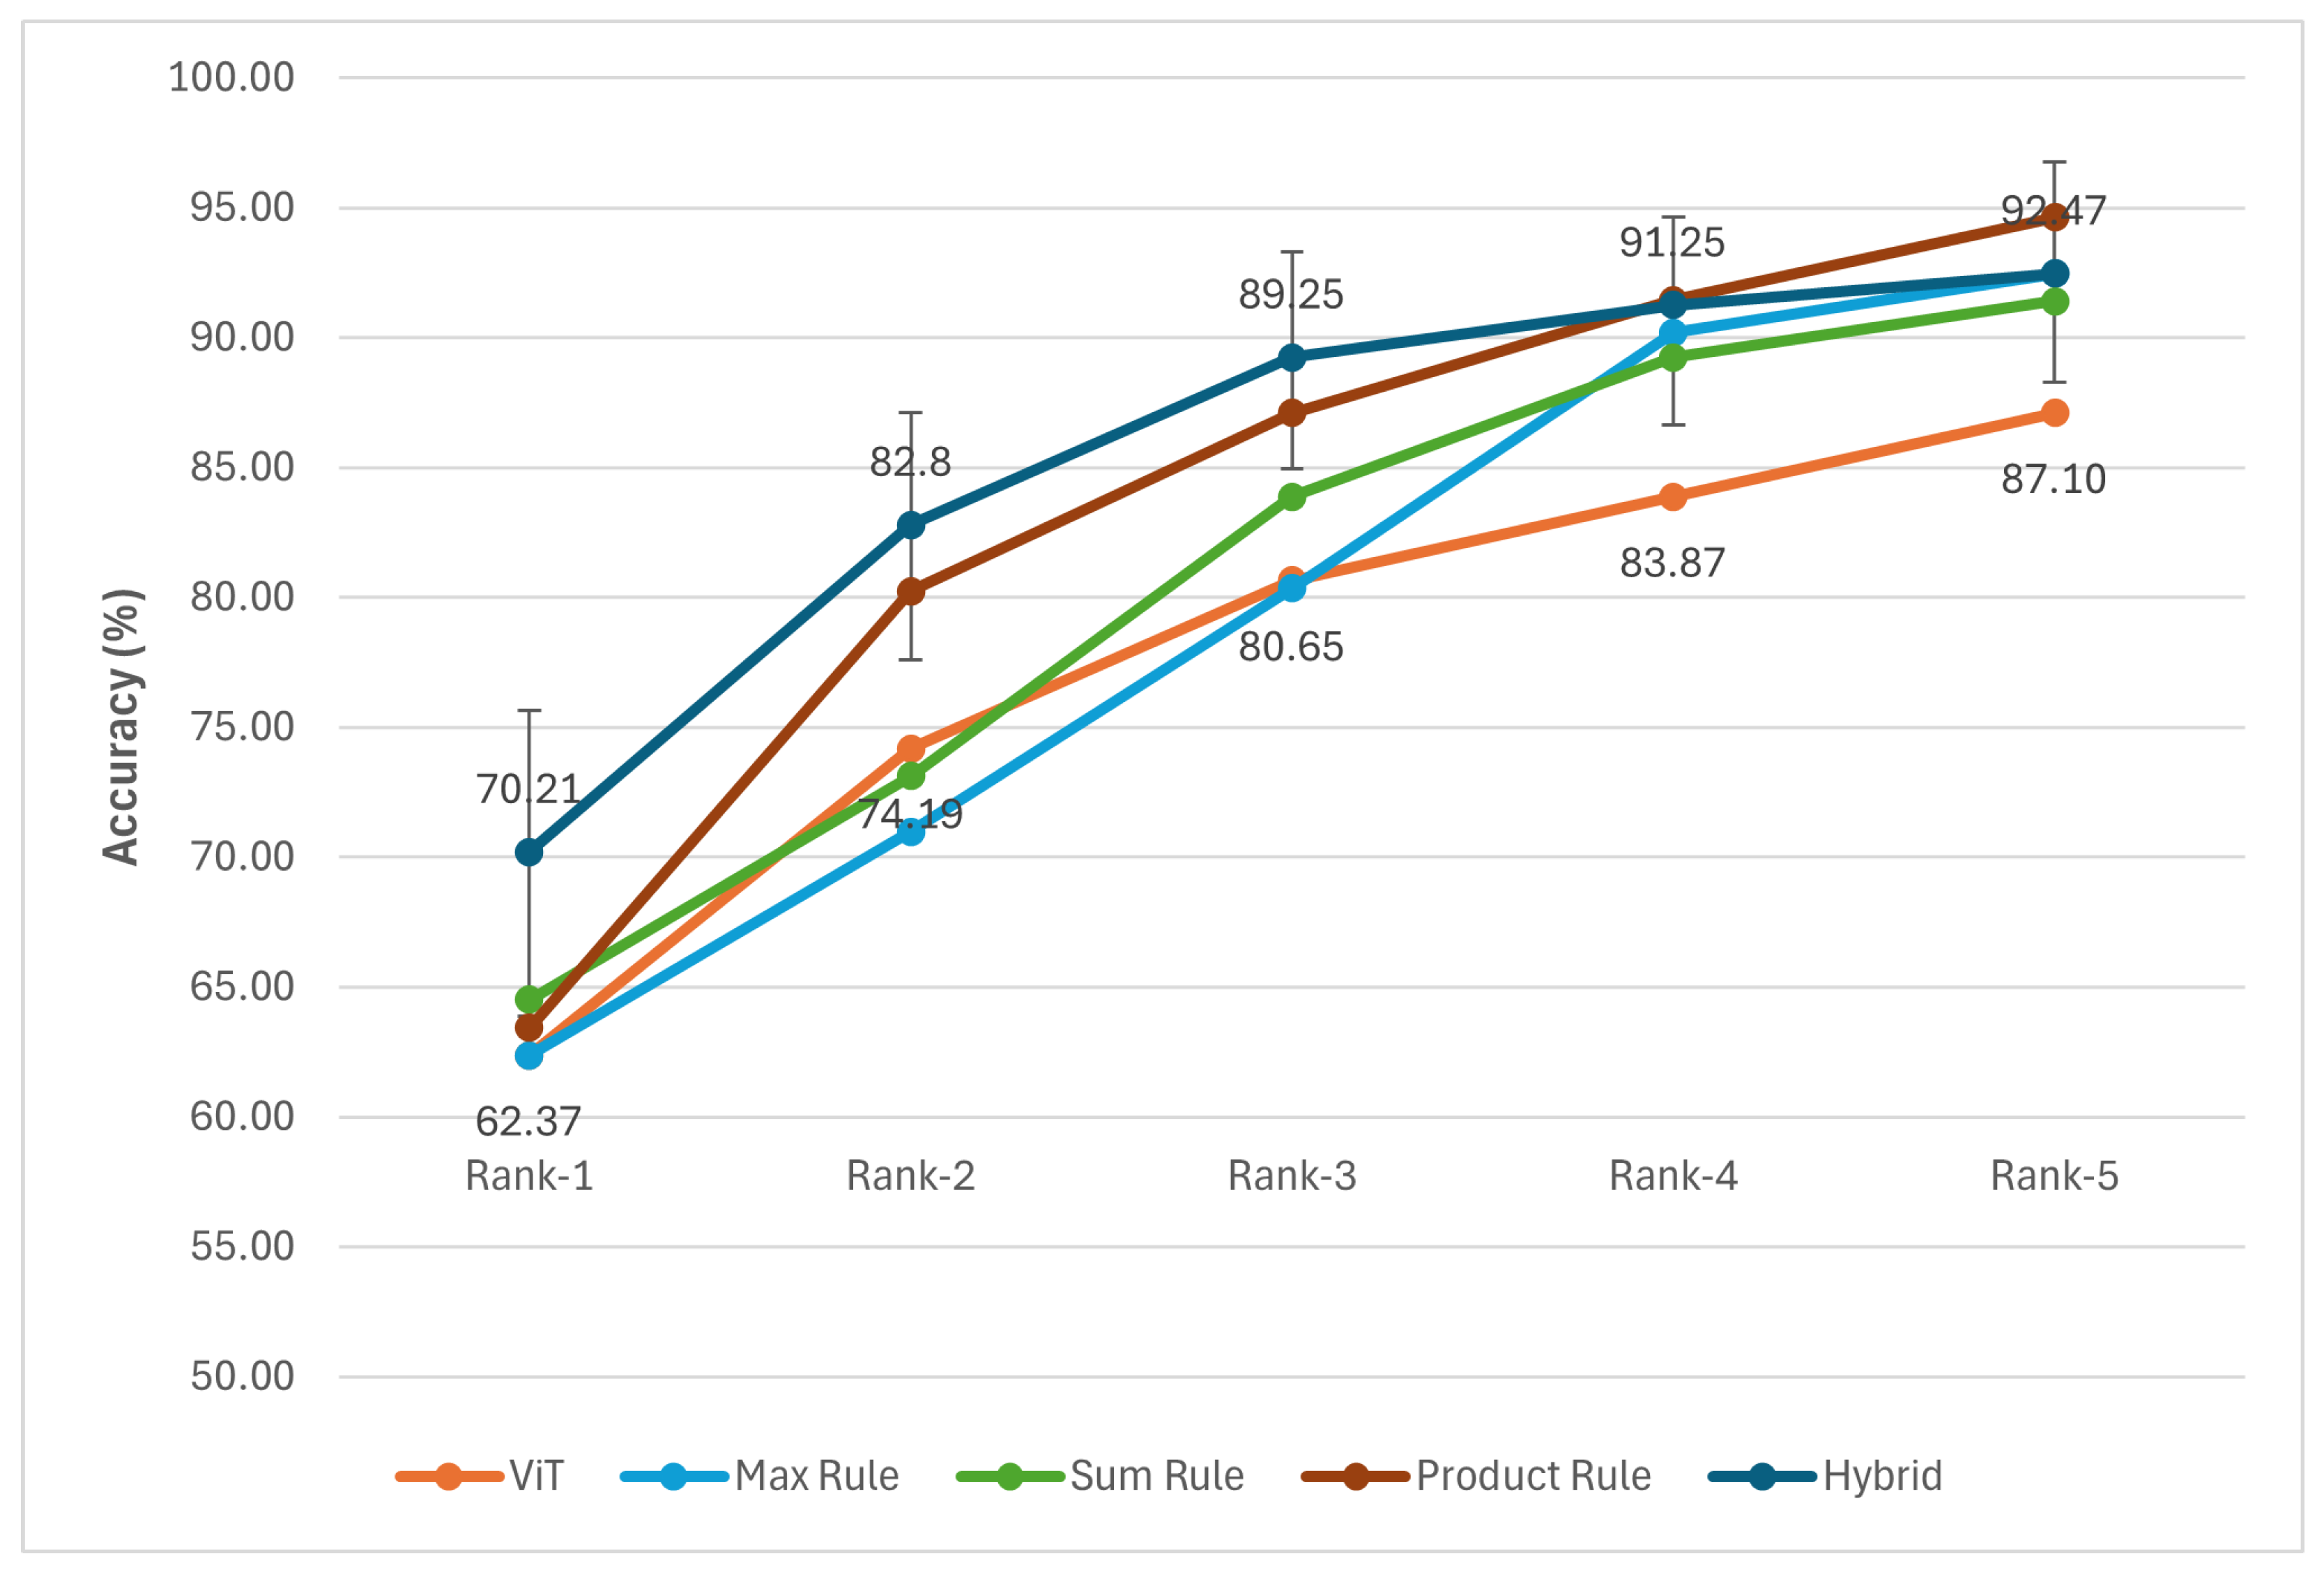
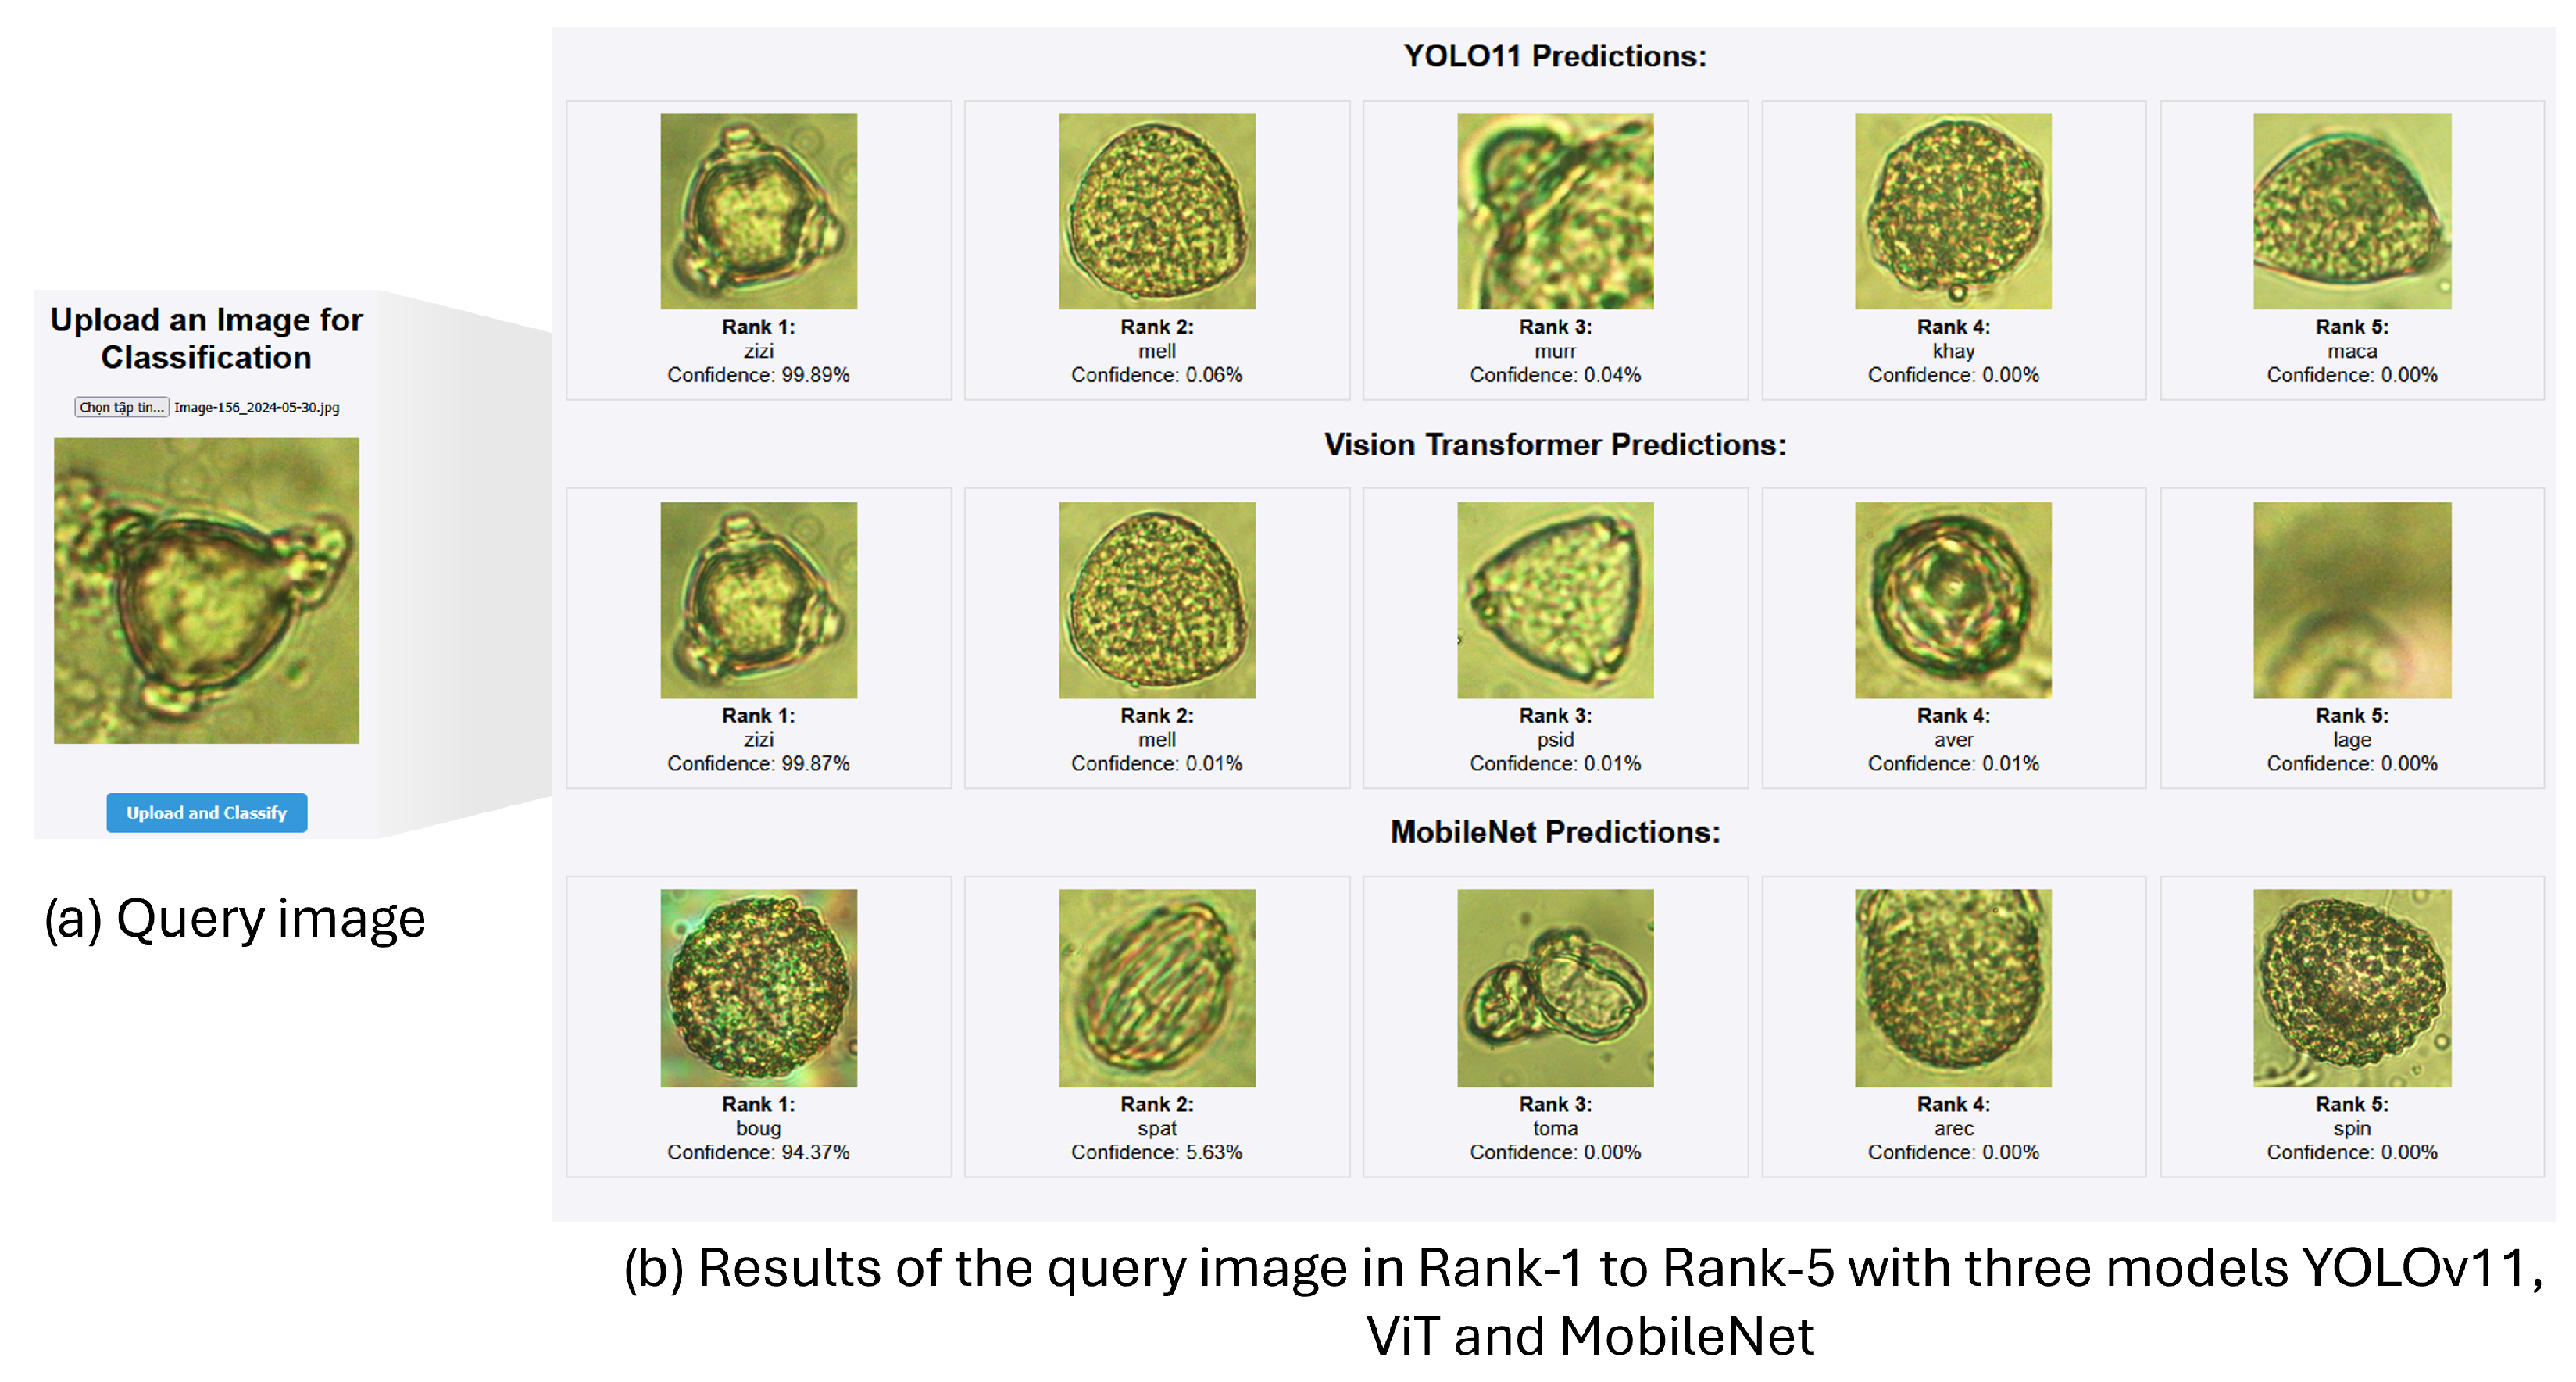
- The proposed classification allows us to trace the botanical origin of the pollen grains extracted from honey samples. The proposed method achieves an accuracy rate of 70.21% in rank 1 and 92.47% in rank 5. The ground-truth dataset is constructed on the basis of the consensus of the five botanical experts.
2. Related Work
3. Materials and Methods
- Collecting a pollen grain dataset around the honeybee farm. This dataset is named VNUA-pollen52. Panel (a) in Figure 2 illustrates the steps of dataset collection. More details are described in Section 3.1.
- Pollen grains are extracted from honey, as shown in panel (c) of Figure 2. The detailed procedure for extracting pollen grains from honey is described in Section 3.2.
- Developing the pollen grain classification and verification method, as shown in panel (b) and panel (d), respectively, in Figure 2. The VNUA-pollen52 dataset can be considered a reference image set of pollen grains from different plant species. To trace the botanical origin of honey, the extracted pollen grains from honey will be matched to the reference images. To address the data distribution drift problem, the schema for improving pollen grain classification is presented in Section 3.3. The procedure for identifying plant species of pollen grains extracted from honey is described in Section 3.4 to verify the results of the proposed method.
3.1. VNUA-Pollen52 Pollen Grains Dataset
3.2. Dataset of Pollen Grains Extracted from Honey for Botanical Origin Identification
- Calibrate the balance with a preweighed pipette placed on it.
- Use the pipette to extract exactly 10 g of honey from the sample.
- Dilute the honey sample with 20 mL of distilled water.
- Add 4 to 5 drops of 75% ethanol to the mixture and centrifuge it for 10 min.
- After centrifugation, let the sample rest for 8 min to allow a deposit to form at the bottom of the pipette.
- Once the sediment becomes visible, the supernatant is discarded, and the deposit is dissolved by mixing it with ethanol and distilled water.
- Transfer the resulting solution onto a microscope slide for observation.
- A digital camera is mounted on the microscope and connected to a computer to capture images of pollen grains.
- Finally, adjust the focus of the microscope until a sharp and well-defined pollen image is visible on the computer screen.
3.3. The Proposed Pollen Grain Classification Method
3.3.1. Architecture of Base Models
3.3.2. Augmentation Strategy
3.3.3. Fusion Schema
- Max Rule: This rule selects the highest confidence score from among the individual confidence scores provided by the base classifiers N, based on the intuition that the most confident prediction is the most representative of the species.
- Sum Rule: By summing the confidence scores from multiple classifiers, this rule takes advantage of their complementary strengths to improve the recognition accuracy for each species.
- Product Rule: Given the assumption of statistical independence among the classifiers, this rule computes the fused confidence score for each species by multiplying the corresponding confidence scores of all the classifiers.
- Hybrid fusion approach: This fusion utilizes the probability that a query image belongs to each species by a classifier. This probability is combined with the confidence score of each classifier. It is learned from a set of clean query images. To avoid the data shift problem, this clean set is constructed from images that have the same condition as the training images (to train the classifier ). Let us denote the probability that a query image is a true sample of the species by classifier .
3.4. Constructing a Subset of Data for Botanical Origin Identification
- : cumulative count of times experts identified an image as belonging to species from rank 1 to rank k.
- : weighting factor for the level of consensus in rank k to identify the image as belonging to species . Here, after considering various sets of values, we set the values of , and the weights , , , , and are assigned as 0.5, 0.3, 0.1, 0.05, and 0.05, respectively.
4. Results
4.1. Pollen Grain Classification Setting
4.2. Evaluation Metrics
- -
- Micro-averaged precision [23]: This metric measures the ratio of true positives to the total number of predicted positives, aggregated over all classes. It is calculated as follows:
- -
- Micro-averaged recall [23]: This metric measures the ratio of true positives to the total number of actual positives, aggregated over all classes. It is calculated as follows:
- -
- Micro-averaged F1-score [23]: This metric is the harmonic mean of precision and recall, providing a balanced measure of classification performance across all classes. It is calculated as follows:
- -
- Top-k accuracy [24]: This metric is commonly used to evaluate image classification models, especially in the ImageNet Large Scale Visual Recognition Challenge. Top-k accuracy considers a prediction correct if the true class appears among the k classes with the highest predicted probabilities. It is calculated as follows:Here, is the true label, is the set of the top-k predicted labels for the i-th sample, and is the indicator function (which returns 1 if the true label is in the top-k predictions , and 0 otherwise).
- -
- Macro-averaged accuracy [25]: This metric involves computing the accuracy of each class separately and then averaging the results of all classes. It is calculated as follows:where represents the best accuracy for class i.
4.3. Pollen Grain Classification Results
4.4. Identification of Pollen Grains Extracted from Honey
5. Discussion
5.1. Low Performances of the Classification at Top Ranks
5.2. Tracing Based on Geographical Information
6. Conclusions
Author Contributions
Funding
Institutional Review Board Statement
Informed Consent Statement
Data Availability Statement
Acknowledgments
Conflicts of Interest
Abbreviations
| YOLO11 | Yolo version 11 neural network |
| ViT | Vision Transformer neural network |
| MobineNetV3 | Mobinet Version 3 neuronal network |
References
- Prudnikow, L.; Pannicke, B.; Wünschiers, R. A primer on pollen assignment by nanopore-based DNA sequencing. Front. Ecol. Evol. 2023, 11, 1112929. [Google Scholar] [CrossRef]
- Viertel, P.; König, M. Pattern recognition methodologies for pollen grain image classification: A survey. Mach. Vis. Appl. 2022, 33, 18. [Google Scholar] [CrossRef]
- Battiato, S.; Guarnera, F.; Ortis, A.; Trenta, F.; Ascari, L.; Siniscalco, C.; De Gregorio, T.; Suárez, E. Pollen Grain Classification Challenge 2020. In Proceedings of the Pattern Recognition. ICPR International Workshops and Challenges, Virtual Event, 10–15 January 2021; Del Bimbo, A., Cucchiara, R., Sclaroff, S., Farinella, G.M., Mei, T., Bertini, M., Escalante, H.J., Vezzani, R., Eds.; Springer: Cham, Switzerland, 2021; pp. 469–479. [Google Scholar]
- Cao, N.; Meyer, M.; Thiele, L.; Saukh, O. Pollen video library for benchmarking detection, classification, tracking and novelty detection tasks: Dataset. In Proceedings of the Third Workshop on Data: Acquisition To Analysis, Virtual Event, 16–19 November 2020; pp. 23–25. [Google Scholar]
- Laube, I.; Hird, H.; Brodmann, P.; Ullmann, S.; Schöne-Michling, M.; Chisholm, J.; Broll, H. Development of primer and probe sets for the detection of plant species in honey. Food Chem. 2010, 118, 979–986. [Google Scholar] [CrossRef]
- Bodor, Z.; Kovacs, Z.; Benedek, C.; Hitka, G.; Behling, H. Origin Identification of Hungarian Honey Using Melissopalynology, Physicochemical Analysis, and Near Infrared Spectroscopy. Molecules 2021, 26, 7274. [Google Scholar] [CrossRef] [PubMed]
- Zhang, X.-H.; Gu, H.-W.; Liu, R.-J.; Qing, X.-D.; Nie, J.-F. A comprehensive review of the current trends and recent advancements on the authenticity of honey. Food Chem. X 2023, 19, 100850. [Google Scholar] [CrossRef] [PubMed]
- Holt, K.A.; Bebbington, M.S. Separating morphologically similar pollen types using basic shape features from digital images: A preliminary study1. Appl. Plant Sci. 2014, 2, 1400032. [Google Scholar] [CrossRef] [PubMed]
- Sevillano, V.; Holt, K.; Aznarte, J.L. Precise automatic classification of 46 different pollen types with convolutional neural networks. PLoS ONE 2020, 15, e0229751. [Google Scholar] [CrossRef] [PubMed]
- Astolfi, G.; Gonçalves, A.B.; Menezes, G.V.; Borges, F.S.B.; Astolfi, A.C.M.N.; Matsubara, E.T.; Alvarez, M.; Pistori, H. POLLEN73S: An image dataset for pollen grains classification. Ecol. Inform. 2020, 60, 101165. [Google Scholar] [CrossRef]
- Garga, B.; Abboubakar, H.; Sourpele, R.S.; Gwet, D.L.L.; Bitjoka, L. Pollen Grain Classification Using Some Convolutional Neural Network Architectures. J. Imaging 2024, 10, 158. [Google Scholar] [CrossRef] [PubMed]
- Geus, A.R.d.; Barcelos, C.A.; Batista, M.A.; Silva, S.F.d. Large-scale Pollen Recognition with Deep Learning. In Proceedings of the 2019 27th European Signal Processing Conference (EUSIPCO), A Coruna, Spain, 2–6 September 2019; pp. 1–5. [Google Scholar]
- Mahmood, T.; Choi, J.; Park, K.R. Artificial intelligence-based classification of pollen grains using attention-guided pollen features aggregation network. J. King Saud Univ.-Comput. Inf. Sci. 2023, 35, 740–756. [Google Scholar] [CrossRef]
- Yao, H.; Choi, C.; Cao, B.; Lee, Y.; Koh, P.W.W.; Finn, C. Wild-Time: A Benchmark of in-the-Wild Distribution Shift over Time. In Proceedings of the Advances in Neural Information Processing Systems, New Orleans, LA, USA, 28 November 2022; Koyejo, S., Mohamed, S., Agarwal, A., Belgrave, D., Cho, K., Oh, A., Eds.; Curran Associates, Inc.: New York, NY, USA, 2022; Volume 35, pp. 10309–10324. [Google Scholar]
- Cao, N.; Saukh, O. Mitigating Distribution Shifts in Pollen Classification from Microscopic Images Using Geometric Data Augmentations. In Proceedings of the In the proceeding of the 29th IEEE International Conference on Parallel and Distributed Systems, Ocean Flower Island, China, 17–21 December 2023. [Google Scholar]
- Gonçalves, A.B.; Souza, J.S.; Silva, G.G.d.; Cereda, M.P.; Pott, A.; Naka, M.H.; Pistori, H. Feature extraction and machine learning for the classification of Brazilian Savannah pollen grains. PLoS ONE 2016, 11, e0157044. [Google Scholar] [CrossRef] [PubMed]
- Battiato, S.; Ortis, A.; Trenta, F.; Ascari, L.; Politi, M.; Siniscalco, C. Pollen13k: A large scale microscope pollen grain image dataset. In Proceedings of the 2020 IEEE International Conference on Image Processing (ICIP), Abu Dhabi, United Arab Emirates, 25–28 October 2020; pp. 2456–2460. [Google Scholar]
- Khanam, R.; Hussain, M. YOLOv11: An Overview of the Key Architectural Enhancements. arXiv 2024, arXiv:2410.17725. [Google Scholar] [CrossRef]
- Dosovitskiy, A.; Beyer, L.; Kolesnikov, A.; Weissenborn, D.; Zhai, X.; Unterthiner, T.; Dehghani, M.; Minderer, M.; Heigold, G.; Gelly, S.; et al. An image is worth 16x16 words: Transformers for image recognition at scale. arXiv 2020, arXiv:2010.11929. [Google Scholar]
- Khan, S.; Naseer, M.; Hayat, M.; Zamir, S.W.; Khan, F.S.; Shah, M. Transformers in vision: A survey. ACM Comput. Surv. (CSUR) 2022, 54, 1–41. [Google Scholar] [CrossRef]
- Howard, A.G. Mobilenets: Efficient convolutional neural networks for mobile vision applications. arXiv 2017, arXiv:1704.04861. [Google Scholar] [CrossRef]
- Howard, A.; Sandler, M.; Chu, G.; Chen, L.C.; Chen, B.; Tan, M.; Wang, W.; Zhu, Y.; Pang, R.; Vasudevan, V.; et al. Searching for MobileNetV3. arXiv 2019, arXiv:1905.02244. [Google Scholar] [CrossRef]
- Takahashi, K.; Yamamoto, K.; Kuchiba, A.; Koyama, T. Confidence interval for micro-averaged F 1 and macro-averaged F 1 scores. Appl. Intell. 2022, 52, 4961–4972. [Google Scholar] [CrossRef] [PubMed]
- Terven, J.; Cordova-Esparza, D.M.; Romero-González, J.A.; Ramírez-Pedraza, A.; Chávez-Urbiola, E. A comprehensive survey of loss functions and metrics in deep learning. Artif. Intell. Rev. 2025, 58, 195. [Google Scholar] [CrossRef]
- Wang, G.; Lochovsky, F.H. Feature selection with conditional mutual information maximin in text categorization. In Proceedings of the Thirteenth ACM International Conference on Information and Knowledge Management, Washington, DC, USA, 8–13 November 2004; pp. 342–349. [Google Scholar]





| ID | Scientific Name | Number of Images |
|---|---|---|
| 1 | Lagerstroemia speciosa | 216 |
| 2 | Citrus maxima | 223 |
| 3 | Solanum lycopersicum | 489 |
| 4 | Brassica juncea | 69 |
| 5 | Chrysanthemum coronarium | 252 |
| 6 | Millettia speciosa | 275 |
| 7 | Areca catechu | 203 |
| 8 | Tagetes patula | 247 |
| 9 | Ageratum conyzoides | 189 |
| 10 | Hibiscus rosa-sinensis | 160 |
| 11 | Allospondias lakonensis | 223 |
| 12 | Carica papaya | 401 |
| 13 | Bombax ceiba | 210 |
| 14 | Prunus persica | 139 |
| 15 | Bougainvillea spectabilis | 593 |
| 16 | Rosa chinensis | 181 |
| 17 | Portulaca grandiflora | 206 |
| 18 | Manilkara zapota | 242 |
| 19 | Ocimum basilicum | 178 |
| 20 | Averrhoa carambola | 212 |
| 21 | Arachis hypogaea | 211 |
| 22 | Spathiphyllum patinii | 203 |
| 23 | Lilium longiflorum | 216 |
| 24 | Hippeastrum puniceum | 219 |
| 25 | Barringtonia acutangula | 207 |
| 26 | Oryza sativa | 221 |
| 27 | Punica granatum | 205 |
| 28 | Macadamia integrifolia | 249 |
| 29 | Bauhinia variegata | 50 |
| 30 | Luffa aegyptiaca | 144 |
| 31 | Zea mays | 302 |
| 32 | Michelia alba | 214 |
| 33 | Murraya paniculata | 210 |
| 34 | Dimocarpus longan | 225 |
| 35 | Eclipta alba | 204 |
| 36 | Psidium guajava | 221 |
| 37 | Capsicum frutescens | 226 |
| 38 | Delonix regia | 219 |
| 39 | Coriandrum sativum | 235 |
| 40 | Ipomoea aquatica | 235 |
| 41 | Anethum graveolens | 257 |
| 42 | Wedelia calendulacea | 208 |
| 43 | Nelumbo nucifera | 231 |
| 44 | Sechium edule | 341 |
| 45 | Dalbergia tonkinensis | 224 |
| 46 | Ziziphus mauritiana | 208 |
| 47 | Dracaena fragrans | 233 |
| 48 | Muntingia calabura | 253 |
| 49 | Litchi chinensis | 204 |
| 50 | Khaya senegalensis | 203 |
| 51 | Euphorbia millii | 90 |
| 52 | Bidens pilosa | 200 |
| Dataset | Number of Plant Taxa | Number of Images | Image Modality | Method | Performance |
|---|---|---|---|---|---|
| VNUA-Pollen52 | 52 species | 11,776 | Microscopy | YOLO11, Vision Transformer, MobileNetV3 | Precision: 93%, Recall: 93%, F1-score: 91%, Accuracy: 96% |
| Pollen23E [16] | 23 species | 805 | Microscopy | Transfer Learning + Feature Extraction + Linear Discriminant | Precision: 94.77%, Recall: 99.64%, F1-score: 96.69% |
| Pollen13K [17] | 3 plant taxa | 13,353 | Microscopy | RBF SVM + HOG features | Accuracy: 86.58%, F1-score: 85.66% |
| Pollen73S [10] | 73 pollen types | 2523 | Microscopy | DenseNet-201 | Precision: 95.7%, Recall: 95.7%, F1-score: 96.4% |
| New Zealand Pollen [9] | 46 pollen types | 19,500 | Microscopy | CNN | Precision: 97.9%, Recall: 97.8%, F1-score: 97.8% |
| Graz pollen [4] | 16 pollen types | 35,000 (per type) | Microscopy | MobileNet-v2, ResNet, EfficientNet, DenseNet | Mean Accuracy: 82–88% |
| Evaluation Metric | Model | ||
|---|---|---|---|
| YOLO11 | ViT | MobileNetV3 | |
| Micro-averaged precision ↑ | 0.90 | 0.93 | 0.89 |
| Micro-averaged recall ↑ | 0.92 | 0.93 | 0.91 |
| Micro-averaged F1-score ↑ | 0.89 | 0.91 | 0.88 |
| Top accuracy ↑ | 0.89 | 0.93 | 0.79 |
| Top-5 accuracy ↑ | 0.99 | 0.99 | 0.91 |
| Macro-averaged accuracy ↑ | 0.96 | 0.96 | 0.90 |
| Model size (MB) ↓ | 343.4 | 57.1 | 9.4 |
| Time (ms) ↓ | 379 | 215 | 173 |
| Model | Rank 1 | Rank 2 | Rank 3 | Rank 4 | Rank 5 |
|---|---|---|---|---|---|
| Single classification model without data augmentation | |||||
| YOLO11 | 52.31 | 73.42 | 80.02 | 83.02 | 86.10 |
| ViT | 55.37 | 72.41 | 78.15 | 85.22 | 87.80 |
| MobileNetV3 | 20.16 | 32.38 | 34.86 | 38.06 | 40.14 |
| Single classification model with data augmentation | |||||
| YOLO11 | 55.91 | 78.49 | 86.02 | 86.02 | 87.10 |
| ViT | 62.37 | 74.19 | 80.65 | 83.87 | 87.10 |
| MobileNetV3 | 22.58 | 35.48 | 40.86 | 45.16 | 45.16 |
| The fusion schema | |||||
| Max rule | 62.37 | 70.97 | 80.35 | 90.20 | 92.47 |
| Sum rule | 64.52 | 73.12 | 83.87 | 89.25 | 91.40 |
| Product rule | 63.44 | 80.25 | 87.10 | 91.45 | 94.62 |
| Hybrid | 70.21 | 82.80 | 89.25 | 91.25 | 92.47 |
Disclaimer/Publisher’s Note: The statements, opinions and data contained in all publications are solely those of the individual author(s) and contributor(s) and not of MDPI and/or the editor(s). MDPI and/or the editor(s) disclaim responsibility for any injury to people or property resulting from any ideas, methods, instructions or products referred to in the content. |
© 2025 by the authors. Licensee MDPI, Basel, Switzerland. This article is an open access article distributed under the terms and conditions of the Creative Commons Attribution (CC BY) license (https://creativecommons.org/licenses/by/4.0/).
Share and Cite
Le, T.-N.; Nguyen, D.-M.; Giang, A.-C.; Pham, H.-T.; Le, T.-L.; Vu, H. Identification of Botanical Origin from Pollen Grains in Honey Using Computer Vision-Based Techniques. AgriEngineering 2025, 7, 282. https://doi.org/10.3390/agriengineering7090282
Le T-N, Nguyen D-M, Giang A-C, Pham H-T, Le T-L, Vu H. Identification of Botanical Origin from Pollen Grains in Honey Using Computer Vision-Based Techniques. AgriEngineering. 2025; 7(9):282. https://doi.org/10.3390/agriengineering7090282
Chicago/Turabian StyleLe, Thi-Nhung, Duc-Manh Nguyen, A-Cong Giang, Hong-Thai Pham, Thi-Lan Le, and Hai Vu. 2025. "Identification of Botanical Origin from Pollen Grains in Honey Using Computer Vision-Based Techniques" AgriEngineering 7, no. 9: 282. https://doi.org/10.3390/agriengineering7090282
APA StyleLe, T.-N., Nguyen, D.-M., Giang, A.-C., Pham, H.-T., Le, T.-L., & Vu, H. (2025). Identification of Botanical Origin from Pollen Grains in Honey Using Computer Vision-Based Techniques. AgriEngineering, 7(9), 282. https://doi.org/10.3390/agriengineering7090282


