Abstract
The assessment of microplastics (MPs) in terrestrial ecosystems has garnered increasing global attention due to their accumulation and migration in soils, which may have potential impacts on soil health, biodiversity, and agricultural productivity. However, research on their distribution and interactions in soil remains limited, especially in tropical regions. This study aimed to characterize MPs extracted from tropical soil samples and relate their abundance to soil and terrain attributes under different land uses (forest, grassland, and agriculture). Soil samples were collected from an experimental farm in Lavras, Minas Gerais, Southeastern Brazil, to determine soil physical and chemical attributes and MP abundance in a micro-watershed. These locations were also used to obtain terrain attributes from a digital elevation model and the normalized difference vegetation index (NDVI). The majority of microplastics found in all samples were identified as polypropylene (PP), polyethylene (PE), polyethylene terephthalate (PET), and vinyl polychloride (PVC). The spatial distribution of MP was rather heterogeneous, with average abundances of 3826, 2553, and 3406 pieces kg−1 under forest, grassland, and agriculture, respectively. MP abundance was positively related to macroporosity and sand content and negatively related to clay content and most chemical attributes. Regarding terrain attributes, MP abundance was negatively correlated with plan curvature, convergence index, and vertical distance to channel network, and positively related to topographic wetness index. These findings indicate that continuous water fluxes at both the landscape and soil surface scales play a key role, suggesting a tendency for higher MP accumulation in lower-lying areas and soils with greater porosity. These conditions promote MP transport and accumulation through surface runoff and facilitate their entry into the soil.
1. Introduction
Microplastics (MPs) are plastic particles formed either directly during manufacturing or by the fragmentation of larger plastic products [] due to exposure to ultraviolet radiation, weathering, hydrolysis, mechanical abrasion, physicochemical processes, and microbial action in the environment [,,]. MPs can persist in soils for hundreds of years due to their chemical stability and physical resistance [], raising growing concerns about their potential impacts on the environment and human health [], and soil biological health []. The slow degradation of MP facilitates their dissemination across terrestrial and aquatic ecosystems [], leading to their recognition as a globally persistent pollutant [].
The scientific community and policymakers are increasingly concerned about the global contamination of soil by MPs, recognizing them as a marker of the Anthropocene. Over the past eight years, research has focused on understanding the magnitude and consequences of MP contamination [], both in ecosystems and human health [].
Early studies primarily quantified and characterized MP in soils. Since the 2020s, however, more systematic investigations have emerged that address the effects of land use and environmental factors on the spatial and temporal distribution of MP [], the influence of soil properties [], vertical migration [], terrain effects [], and interactions with soil flora and fauna [].
Agricultural soils have been identified as one of the ecosystems most susceptible to MP pollution [], originating from sources such as microfibers released from clothing, primary MPs discarded in their original forms, manufacturing of cosmetics and cleaning products [], and the degradation of plastic debris already present in the environment [,]. Air and rain can easily transport these particles to the soil [,,,] or runoff into aquatic environments []. Such sources significantly contribute to MP accumulation in agricultural soils, leading to their long-term buildup in soil profiles [,].
MP particles can act as carriers for other pollutants, such as heavy metals and persistent organic pollutants, posing substantial risks to organisms [] and increasing their environmental impacts []. Additionally, MPs may alter soil properties [], affecting soil structure and water dynamics []. These changes can have significant and lasting effects on soil carbon dynamics [], with yet unknown consequences for sustainability and food security []. The ubiquity of MP in the environment has led some authors to propose its use as a potential marker of the Anthropocene [].
The amount of MP in soil at a given location is influenced by various factors, including polymer type, land use, soil attributes [] the heterogeneity of soil mineral and organic components [], etc. Additionally, the separation and extraction of microplastics from soil remain challenging, requiring particular approaches for each type of soil analyzed [,]. Among the available extraction methods, density separation is the most widely employed. This technique typically involves the removal of organic matter, followed by the application of high-density solutions to isolate MPs based on their buoyancy differences [,,,], resulting in high recovery rates for MPs ranging in size from 40 μm to 5000 µm [], finishing with filtration and isolation of MPs [].
The quantification and characterization of MP in environmental samples are commonly carried out using microscopy for visual identification, combined with spectroscopic techniques for polymer identification [,,,,].
Recent studies have emphasized the urgent need to prioritize research on MP in agroecosystems [,]. Although previous investigations have documented the distribution and characterization of MPs in sediments from rivers, lakes, and Brazilian mangrove soils [,,], research on the relationship between MPs and soil attributes in tropical regions remains limited. This is particularly relevant given that these regions are characterized by highly weathered soils [,,,], an active bioclimate that promotes plastic biodegradation [], forests, which can act as natural filters retaining microplastics in the soil [], and distinctive relief features. Therefore, investigating the distribution, characterization, and interactions of MPs with land use and terrain characteristics in tropical soils is essential.
This study was based on the hypothesis that land use, soil attributes, and topography influence MP abundance in the topsoil. Therefore, the study aimed to quantify and characterize MPs extracted from the 0–20 cm soil layer under different land uses on a micro-watershed in Southeastern Brazil and to relate MP abundance to soil physical and chemical properties, terrain attributes, and the normalized difference vegetation index (NDVI).
2. Materials and Methods
2.1. Study Area
The study was conducted in a micro-watershed at the Muquém Experimental Farm of the Federal University of Lavras (UFLA), located in the municipality of Lavras, Minas Gerais state, Brazil. It is situated between latitude 21°12′0.37″ S and longitude 44°59′3.77″ W, WGS 84 UTM 23S. The area covers approximately 161 hectares and features a diversified land use system that includes forest, grassland, and agriculture (Figure 1). The farm lies within the geomorphological unit of the Atlantic Plateau, specifically in the Upper Rio Grande surface, a tributary of the Paraná River [].
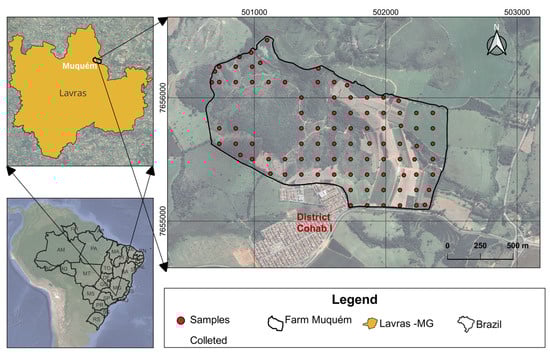
Figure 1.
Map of the study area and geographic position of the sampled points at the micro-watershed from Muquém farm, municipality of Lavras, Brazil.
The regional climate is classified as Cwb (subtropical highland) according to the Köppen climate classification system, mesothermic with dry mild winters and rainy warm summers [,]. The area receives an average annual rainfall of 1383.4 mm, concentrated during the rainy season from October to February. Predominant winds are easterly from March to September and northeasterly from November to February, with average wind speeds of 2.16 m s−1 and 1.64 m s−1, respectively, and a mean annual temperature of 20.6 °C. Data were obtained from a meteorological station of the National Institute of Meteorology (INMET) located near the study area.
The characteristics of the study site have already been detailed in []. Soil classification in the study area indicates that the major soil orders in the micro-watershed (Figure 2a), according to WRB-FAO [] correspond to Cambisols (CX), which occupy 18.84 ha (11,41% of the area), and Gleysols (GM), which occupy 1.92 ha (1.16% of the area). Ferralsols (LVA) occupy 63.60 ha (38.50%), Nitisols (NX) 8.30 ha (5.02%), Acrisols (PVA) 58.07 ha (35.15% of the area), and Leptsols (RL) 14.48 ha, representing 8.76% of the total area [].
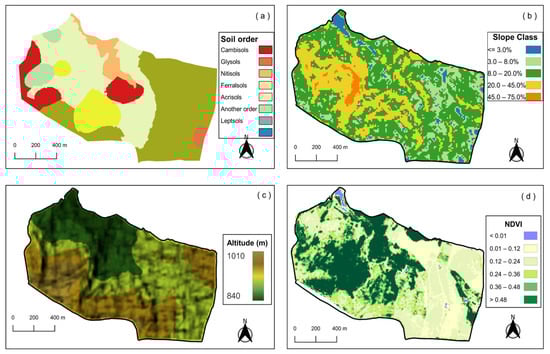
Figure 2.
Maps representing soil order (a), slope classes, (b), altitude (c), and NDVI (d) of the micro-watershed from Muquém Farm in Lavras, Southeastern Brazil. Note: reliefs associated with their respective slopes, namely flat (<3%), gently sloping (3–8%), strongly sloping to moderately steep (8–20%), steep to very steep (20–45%), and extremely steep (45–75%).
The altitude in the study area ranges from 877 to 1010 m (Figure 2c), encompassing a topographic gradient from flat to mountainous terrains. Flat areas (slope < 3%) represent approximately 2.7% of the total area, while gently undulating areas (3–8% slope) account for 17.8%. The majority of the landscape (58.8%) is classified as undulating, with slopes between 8% and 20%. Strongly undulating areas (20–45% slope) cover 20.1% of the area, and mountainous regions (slope > 45%) represent the remaining 0.6% (Figure 2b).
Land uses in the study area were classified as agriculture, grassland, and forest. Agricultural use is composed of annual crops that occupy 29.2% of the area, including corn (Zea mays), soybean (Glycine max (L.) Merrill), wheat (Triticum aestivum L.), common bean (Phaseolus vulgaris), sorghum (Sorghum bicolor L.), and rice (Oriza sativa L.), while perennial crops occupy 0.9% of the farm, mainly coffee (Coffea arabica). Grasslands are the most common land use, with 39.3% of the area corresponding to planted pastures (Brachiaria sp.) and 4.7% to native grassland. Forests occupy 24.4% of the area, and the remaining 1.5% corresponds to water reservoirs and buildings. The forests are dominated by planted eucalyptus forests (Eucalyptus esp.) and native forests.
2.2. Soil Sampling
Soil sampling was conducted from August 2022 to April 2023 using a predefined regular grid of 91 georeferenced points covering 161 ha, resulting in a sampling density of 1.77 ha per sample, with a resolution of 125 m × 125 m (Figure 1). Samples were collected from a 0 to 20 cm depth, with 100 g of soil stored in glass jars for microplastic analysis. This depth was chosen due to the importance of the topsoil layer in supporting plant growth. Additionally, most agricultural activities and the accumulation of MP typically occur in these upper layers, making them a key area for assessing MP contamination [,]. Additionally, disturbed samples were collected to assess the chemical attributes and texture of the soil. In these samples, the original structure is altered during collection, usually using hoes or shovels. Undisturbed samples were also collected to assess the physical attributes of the soil, preserving its original structure and properties as much as possible. The latter were obtained in appropriate cylinders using an Uhland sampler.
The analyzed physical properties included soil texture (clay, sand, and silt), determined by the pipette method []; aggregate stability (GMD), assessed using the wet sieving method, with mean weight diameter as the stability index [,]. Soil bulk density (Bd), total porosity (TP), macroporosity (pores > 0.05 mm diameter, Macro), and microporosity (Micro) were measured using the volumetric cylinder method, with microporosity determined under a suction of 6 kPa [].
Chemical properties of the fine earth fraction (< 2 mm) included pH (determined at a 1:2.5 soil: water ratio); organic carbon content (determined via wet oxidation with 0.0667 mol L−1 potassium dichromate and concentrated sulfuric acid); exchangeable divalent cations (Ca2+ and Mg2+) and exchangeable acidity (Al3+), extracted using 1 mol L−1 KCl and quantified via inductively coupled plasma optical emission spectrometry (ICP-OES). Exchangeable potassium (K+), available phosphorus (P), and sodium (Na) were extracted using Mehlich-1 solution and quantified by ICP-OES. Potential acidity (H + Al) was determined volumetrically using 0.5 mol L−1 calcium acetate at pH 7.0. Based on these results, the sum of exchangeable cation (SB), effective cation exchange capacity (eCEC), aluminum saturation (m), cation saturation (V), and total cation exchange capacity (tCEC) were calculated. Methods followed Brazilian standards [].
Sampling points were located using a Garmin Oregon 750 GPS with 3 m accuracy, using Garmin Express software 7.26.1. Auxiliary data such as altitude, surrounding vegetation type, and current land use were also recorded. Terrain attributes were derived from a digital elevation model with a spatial resolution of 12.5 m (high-resolution terrain corrected ALOS PALSAR scene ALPSRP243456750 from August 2010), data courtesy of JAXA/METI (2010). Terrain attributes were obtained from the basic terrain analysis in SAGA-GIS [] implemented into QGIS software version 3.36.3 [] and included slope, valley depth, distance to channel network, channel network base level, flat curvature, profile curvature, convergence index, topographic wetness index, relative slope position, and LS-factor. These values were extracted to the sampling grid by the Point Sampling Tool plugin using bilinear interpolation.
2.3. Extraction, Identification, and Quantification of Microplastics
Soil MP extraction and assessment followed a three-phase procedure: (1) pre-processing, (2) MP separation, and (3) MP identification and quantification [,,].
The first stage, pre-processing, involved digesting the organic matter present in the soil samples using 10 g of soil and 20 mL of an alkaline solution of KOH: NaClO 30%. This mixture was dispersed in an ultrasonic bath at 35 W and 40 kHz for 5 min. After dispersion, the samples were placed in an oven at 50–60 °C and manually stirred for 30 s every 4 h until reaching a constant mass.
During the second stage, MP separation, the samples were centrifuged in solutions of sequentially increasing density (ρ): distilled water (ρ = 1.00 g cm−3), saturated NaCl solution (5.33 mol L−1, ρ = 1.19 g cm−3), and ZnCl2 solution (5.06 mol L−1, ρ = 1.5 g cm−3). Saturated NaCl solution is considered a safe and environmentally friendly substance, capable of removing different types of low-density MPs, such as PA, PE, PS, and PP [], which are the objects of this study. Conversely, zinc chloride (ZnCl2) is employed for the recovery of high-density polymers, including PVC, PC, PET, and rubber [].
Soil samples treated with distilled water underwent ultrasound dispersion for 5 min to separate MhsP from soil aggregates. Subsequently, the solution was centrifuged at 2500 rpm for 5 min. The high speed allowed MP to float in the supernatant, which was then collected with a pipette and filtered using a vacuum pump and a 2 µm membrane filter. Next, 20 mL of saturated NaCl solution was added to the precipitated soil in the tube. Again, the material was subjected to ultrasound dispersion and centrifuged at 2700 rpm for 5 min, repeating the supernatant collection and filtration processes. The final density separation was conducted with a ZnCl2 solution, where 20 mL was added to the tube with soil. The suspension underwent ultrasound dispersion followed by centrifugation, and the supernatant was collected and filtered on a 2 µm membrane filter. The process was repeated until no particles were observed in the supernatant. The particles retained on the filter were air-dried at room temperature (approximately 23 °C) and stored in glass boxes.
In the third stage, MP identification and quantification, a Nikon Eclipse Ni microscope (10×magnification) was used. Images were captured using a Nikon DS-Fi3 digital camera, supported by NIS Elements software version 4.6 for data processing. MP abundance was quantified as the number of pieces kg−1 of dry soil based on the total count of MP pieces within the entire filter area. In terms of morphology, MPs were categorized into four types: fragments (irregular, angular particles), granules (rounded or semi-rounded particles), fibers (elongated, thread-like structures), and films (thin, soft, and often transparent flakes). Additionally, MP were categorized by color, with the most relevant colors being white, black, blue, red, yellow, green, brown, and transparent []. MP size was categorized into the following groups: group 1 (20 to 200 µm), group 2 (200 to 500 µm), group 3 (500 to 1000 µm), and group 4 (1000 to 3000 µm) [,].
Polymer identification was performed using spectral analysis with a Raman microscope model Alpha300 equipped with a 785 nm laser (Witec, GmbH, Ulm, Germany 2022). Spectra were measured in the range of 300–3500 cm−1 with an acquisition time of 1 s, 20 accumulations, and a power filter of 2 to 15% to avoid sample burning. Raman spectroscopy was used to identify types of polymers by comparing the spectral patterns of the samples with reference spectra of known polymers reported in the literature, provided the obtained spectrum has good quality, as suggested by Weber []. The analysis revealed the presence of polypropylene (PP), polyethylene (PE), polyvinyl chloride (PVC), polyethylene terephthalate (PET), polystyrene (PS), polyamide (PA), rubber, and acrylic. Finally, this database was compared with the spectra of the MP isolated from the soil and processed using OriginPro Lab [].
2.4. Laboratory Contamination Prevention and Recovery Tests
Field samples were stored in glass jars. To avoid contamination, all materials used in sample analysis were made of glass and rinsed with a disinfectant solution (filtered distilled water and 30% ethanol) during all steps. Nitrile gloves and cotton clothing were also worn during experiments, and access to the laboratory area was restricted to research personnel to prevent contamination from external sources. As a quality control measure, the same microplastic extraction procedure was applied to five blank control samples that did not contain any soil. These control samples were stored in petri dishes and examined at the end of the analysis to detect any potential contamination introduced during laboratory handling [,].
Recovery tests were also conducted to ensure methodological precision. These were performed on four clean soil samples from the study area, along with low-density polyethylene (LDPE) and polyvinyl chloride (PVC). In this context, recovery rates for LDPE particles ranged from 81.0% to 98.8%, while PVC recovery rates ranged from 59.7% to 75.2% [].
2.5. Statistical Analysis
Statistical analysis was performed on the abundance of MP isolated from soil sampling locations (pieces kg−1) in the 0–20 cm layer. After testing normality and heteroscedasticity, the data exhibited a non-normal distribution. Principal component analysis (PCA) and Spearman correlation were applied to examine relationships between land use (forest, grassland, and agricultural), soil physical and chemical properties, terrain attributes, and the normalized difference vegetation index (NDVI) for each sampling site. Multivariate analyses were conducted using R software version 4.4.0 []. Polymer graphs and spectra were generated using OriginPro Lab version 2024b [].
3. Results
3.1. Microplastic Abundance
Microplastics (MP) were detected in all soil samples collected from the study area. These samples were distributed across land uses as follows: 19 from forest, 27 from grassland, and 45 from agricultural areas. The mean MP abundance ± standard deviation was 3825.9 ± 338.5 pieces kg−1 for forest soils, 2552.6 ± 230.9 pieces kg−1 for grassland, and 3406.6 ± 231.2 pieces kg−1 for agricultural soils.
MP abundance was categorized into five groups (Figure 3) following the criteria proposed by Rafique, Weber, and Liu [,,]: very low (<1500 pieces kg−1); low (1500–3000 pieces kg−1); medium (3000–4500 pieces kg−1); high (4500–6000 pieces kg−1); and very high (>6000 pieces kg−1). Seven sampling points (8% of the total) were classified as having very high MP abundance, while 15 points (16%) fell into the high category. Medium abundance was the most frequent, observed in 32 points (35%), followed by low abundance in 27 points (30%), and very low abundance in 10 points (11%).
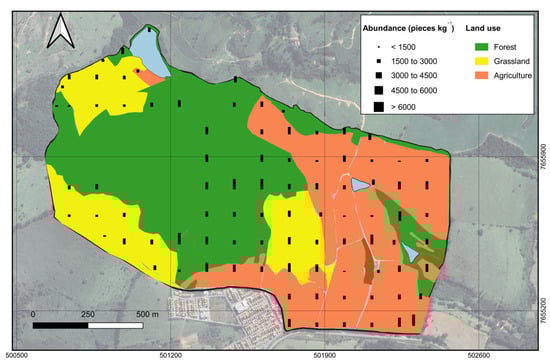
Figure 3.
Distribution of sampling points at the micro-watershed from Muquém Experimental Farm, Lavras, MG, Brazil, according to MP abundance and land use.
The point-based spatial distribution of MP abundance within the study area is shown in Figure 3. Overall, most points with high and very high MP abundance were located along the central strip and the eastern portion of the micro-watershed, particularly in the southern half, near an urban area and an intermunicipal road.
3.2. Microplastics Composition
In this study, eight polymer types were identified using Raman spectroscopy. Their relative abundances in the 0–20 cm soil layer were: polypropylene (PP) 33.3%, polyethylene terephthalate (PET) 22.2%, polyethylene (PE) 14.8%, polyvinyl chloride (PVC) 8.6%, polyamide (PA) 8.6%, polycarbonate (PC) 6.2%, rubber 3.7%, and polystyrene (PS) 2.5% (Figure 4a). The prevalence of polymer types varied according to land use. In forest soils, the predominant polymers were PP (43.8%), PET (25%), PVC (12.5%), and PE (9.4%) (Figure 4b). In grassland soils, seven polymer types were identified, with PP, PET, PE, and PC being the most common, each representing 18.2% (Figure 4c). For agricultural soils, the most abundant polymers were PP (28.9%), PET (21.1%), and PE (18.4%) (Figure 4d).
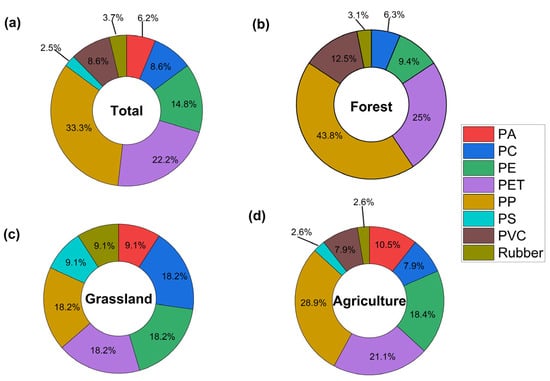
Figure 4.
Polymer types identified in soil MP from the 0–20 cm soil layer under different land uses. (a) Total MP found, (b) forest, (c) grassland, (d) agriculture. PA: polyamide; PC: polycarbonate; PE: polyethylene; PET: polyethylene terephthalate; PP: polypropylene; PS: polystyrene; PVC: polyvinyl chloride.
The most representative Raman spectra of polymers detected in soil samples from the study area corresponded to PP, PE, PET, and PVC (Figure 5). These spectra exhibited baseline shifts and variations in signal intensity; therefore, several corrections were applied, including noise removal, baseline adjustment, and normalization. In all cases, the processed spectra displayed characteristic peaks specific to each polymer type.
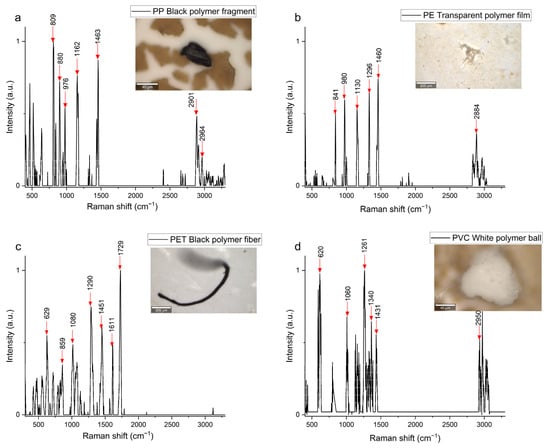
Figure 5.
Raman spectra and photographs of the most abundant microplastics found in the 0–20 cm soil layer (a) PP, (b) PE, (c) PET, and (d) PVC, observed using Raman spectroscopy.
For PP (Figure 5a), the Raman spectrum showed a characteristic peak around 2964 cm−1, attributed to the asymmetric CH stretching vibration. The peak at approximately 1463 cm−1 corresponded to asymmetric bending vibrations of the –CH3 group, while the peak near 1162 cm−1 was associated with C–C stretching. Another peak at 890 cm−1 represented vibrations of helicoidal molecular structures. For this polymer, slight shifts in peak positions and changes in intensity were observed. These phenomena indicated weathering-induced chemical modifications on the polymer structure [], suggesting oxidation, degradation, or cross-linking processes within the polymer chains.
In the PE spectrum (Figure 5b), characteristic peaks were observed in the regions 840–1450 cm−1 and 2884 cm−1. The most intense peaks occurred at 980 cm−1, 1130 cm−1, and 1450 cm−1, attributed to C-O stretching, symmetric C-C stretching, and symmetric CH2 deformation, respectively. These findings align with previous studies on PE plastic debris in other regions [,,].
On the PET Raman spectra (Figure 5c), two dominant peaks were observed at 1611 cm−1 and 1729 cm−1, corresponding to aromatic ring C-C stretching vibrations and carbonyl group stretching vibrations. Similar results were reported by González-Córdova et al., (2023) []. The PVC samples exhibited Raman spectra (Figure 5d) with high-intensity peaks at 620 cm−1, associated with C-Cl bond stretching vibrations. Peaks at 1281 cm−1 and 1340 cm−1 corresponded to CH and CH-Cl bending vibrations, respectively, while the peak at 1431 cm−1 was related to angular deformation of the CH2 group.
3.3. Color, Shape, and Size of Microplastics
A total of 3118 MP particles were analyzed for color, shape, and size (Figure 6). Nine colors were identified (Figure 6a), with the respective percentages: black (34.9%), transparent (24.7%), brown (13.7%), white (12.6%), blue (8.1%), and yellow, red, green, and gray collectively accounting for 6.0%. Black and transparent were the predominant colors in all land uses, followed by brown or white, depending on the land use.
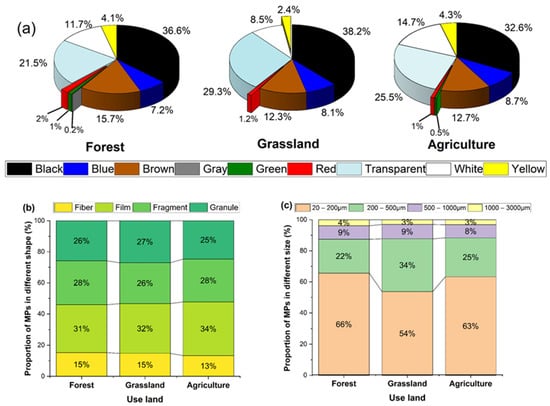
Figure 6.
Percentage of microplastics sorted by (a) color, (b) shape, and (c) size for forest, grassland, and agricultural uses.
Four MP shapes were recorded across all samples (Figure 6b): films (33%), fragments (28%), granules (25%), and fibers (14%). Generally, fibers were blue, films were transparent, and fragments and granules were black. Films were in the dominant shape, representing 31% in the forest, 32% in the grassland, and 34% in the agricultural uses. Fragments and granules were found in similar proportions across all land uses, while fibers had the lowest occurrence, at 15% in forest and grassland and 13% in agricultural.
MPs were categorized into four size groups: 20–200 µm, 200–500 µm, 500–1000 µm, and 1000–3000 µm. MPs in the smallest size category (20–200 µm) were most abundant (Figure 6c), particularly for fragments and granules, accounting for 66%, 54%, and 63% of MPs in the forest, grassland, and agricultural, respectively. MPs larger than 1000 µm, mostly fibers, were the least abundant across all land uses.
In the grassland, black granules and transparent films were the most common MPs, with average sizes of 112.4 µm and 282.2 µm, respectively. In the forest, transparent films, along with black fragments and granules, were the dominant forms, with average sizes of 207.6 µm, 151.1 µm, and 102.1 µm, respectively. For agricultural, transparent films and black fragments and granules were the most abundant, with average sizes of 220 µm, 143.3 µm, and 105.9 µm, respectively.
3.4. Relating Microplastics to Soil and Terrain Attributes
In the principal component analysis, the first two principal components (PCs) accounted for 46.1% of the total variance in soil attributes (Figure 7a) and 62.5% of the total variance in terrain attributes (Figure 7b). For the soil attributes, PC1 and PC2 seemed to represent soil chemical and physical, respectively. PC1 was more strongly related to SB, eCEC, Ca, tCEC, V, Mg, m, and SOM (see legend in Figure 7 for abbreviations), with correlation values of, respectively, 0.965, 0.963, 0.922, 0.892, 0.748, 0.725, −0.610, and 0.590. PC2 was more strongly defined by Pt, Bd, Clay, Sand, and Micro (correlations of −0.688, 0.611, −0.609, 0.526, −0.489) along with exchangeable and total acidity (correlations of 0.524 and −0.546 for Al3+ and H + Al, respectively). Although a clear trend regarding MP abundance was perceivable (correlations of −0.205 and 0.032 between MP abundance and PC1 and PC2 respectively), there was an evident trend regarding the effect of land use, with agri-culture points scattering towards lower values for PC2 (higher clay content) and higher values for PC1 (better fertility); and forest and grassland observations scattering towards higher values for PC2 (higher sand content and bulk density) and lower values for PC1. Significant negative correlations were observed between MP abundance and clay content, Ca, Mg, SB, eCEC, tCEC, and SOM (Figure 7c).
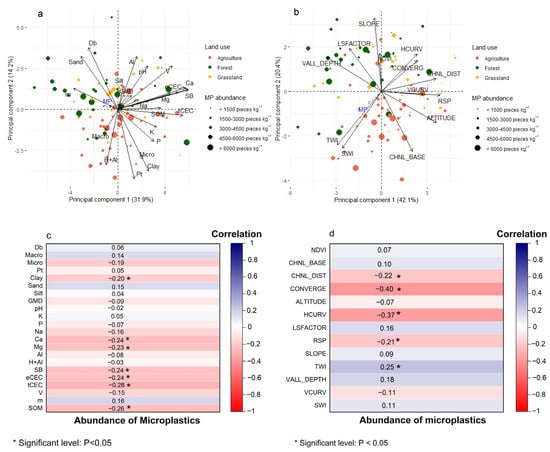
Figure 7.
Principal component analysis of (a) soil physical and chemical properties and (b) terrain attributes and NDVI. Spearman’s correlation between microplastic abundance and (c) soil physical and chemical properties and (d) terrain attributes and NDVI. Note: bulk density (Bd), macroporosity (Macro), microporosity (Micro), total soil porosity (TP), geometric mean diameter (GMD), exchangeable cations (SB), effective cation exchange capacity (eCEC), total cation exchange capacity (tCEC), total acidity (H + Al), cation saturation (V), aluminum saturation (m), soil organic matter (SOM), normalized difference vegetation index (NDVI), channel network base level (CHNL_BASE), channel network distance (CHNL_DIST), convergence index (CONVERG), altitude, plan curvature (HCURV), LS-factor, relative slope position (RSP), slope, topographic wetness index (TWI), valley depth (VALL_ DEPTH), profile curvature (VCURV), SAGA wetness index (SWI).
This segregation between agriculture and other land uses was more evident in the terrain attributes PCA (Figure 7b). The first PC represented the vertical position of the sampled points, reflecting measures of curvature, distance to the channel network, and altitude (correlations of 0.916, 0.861, 0.860 and 0.858 for relative slope position, altitude, valley depth and vertical distance to channel network, respectively), whereas the second PC was more strongly affected by slope (correlation of 0.788) and attributes related to flow accumulation (correlations of −0.642, −0.606, and −0.569 for channel network base level, SAGA wetness index, and topographic wetness index, respectively). In this case, the agri-culture land use points were scattered towards higher altitudes and greater distances to the valley bottoms, whilst forest and grassland observations were related to higher slopes. MP abundance was again poorly represented in the PCA, with correlations of −0.208 and −0.133 with PC1 and PC2, respectively, reflecting a weak trend of higher MP abundance at lower landscape positions (lower values for PC1) and higher flow accumulation (lower values for PC2). Significant negative correlations were observed between MP abundance and convergence index, horizontal curvature, vertical distance to the channel network, and relative slope position, and a significant positive correlation with the topographic wetness index (Figure 7d).
4. Discussion
4.1. Microplastic Abundance Across Land Uses
The abundance of MPs in soils from our study, presented at the top of Table 1, shows values for forest, grassland, and agricultural uses that illustrate their ubiquity and heterogeneity. For comparison, Table 1 also summarizes data reported by various authors for different conditions, such as geographical location, land uses, sampling depth, production systems employed, irrigation method, duration of plastic use, thickness, and type of plastic films used [,,]. This arrangement highlights our findings as the central reference while providing a broader context. Additionally, the lack of standardized methods for extracting MP from soils, along with variations in sampling methods, analysis techniques, and other natural or artificial factors, may influence MP abundance [].

Table 1.
Microplastic abundance (range, mean, and standard deviation) in soils according to location and land use as reported by various authors.
In our study, MP concentrations averaged 3826 ± 338 particles kg−1 in forests, 2553 ± 231 particles kg−1 in grasslands, and 3407 ± 231 particles kg−1 in agricultural soils. These values are within the wide range reported globally, from a few tens to hundreds of thousands of particles per kg of soil, but in several cases exceed those observed for similar environments (Table 1).
In forests, MP concentrations were similar to those in agriculture, despite minimal direct human activity. Our values were much higher than those reported in Yunnan, China (85 ± 22.9; []) and Seoul, Korea (1097; []), but lower than those in central China (410,000; []). This suggests atmospheric deposition as a key source [,,], with tree leaves acting as sinks for airborne MP (<500 μm) that eventually reach the soil. The presence of plastic debris from human activities on the soil surface along forest trails may also contribute [,].
Grassland soils showed lower MP abundance than agriculture and forest in our study, but still exceeded values from other grassland sites (mean 200 ± 228; [,]). This may reflect the selection of sampling areas with greater human presence and vehicle access, increasing MP inputs from tire debris, plastic waste, and road dust [,].
Agricultural soils presented higher MP levels than those reported in the Huangshui watershed, China (6–444, mean 86 particles kg−1; []) and in other Asian agricultural sites (2783–6366; []), but were lower than those found under intensive plastic film use in northern China (1600–36,200, mean 11,058; []). Comparable abundances have also been observed in Lahore, Pakistan (2200–6875, mean 3712; []). The relatively elevated values in our sites may be linked to previous use of plastic mulching, proximity to roads (tire wear particles, road dust), and irrigation water quality [,].
Overall, variations in MP abundance across land uses and regions result from a complex interplay between anthropogenic pressure, proximity to emission sources, and environmental mediators such as soil texture, organic matter content, vegetation cover, and topography. These patterns are attributed to soil heterogeneity, the diverse sources of MP, and the different natural processes of transport and accumulation. Notable examples include wind-driven transport, runoff caused by rainfall, the presence of natural or artificial obstacles in rural landscapes, the characteristics of the plastic, and direct deposition from human activities []. Collectively, these factors explain both the heterogeneity observed in our results and the variability reported worldwide.
4.2. Distribution of Microplastics in Soil
The spatial distribution of MP was irregular and highly heterogeneous in the study region, being present in all soil samples regardless of land use. The causes of this irregular distribution of MP abundance can be attributed to climatic factors, the use of MP-contaminated water for irrigation, agricultural activities, storms, and natural weathering processes [,,]. Figure 3 shows that the highest MP concentrations were detected in the southern part of the study area, adjacent to a residential zone and municipal roads. This proximity appears to be closely related to MP abundance, as concentrations tend to increase as the distance to these areas decreases.
This pattern has also been reported by other authors, who attribute higher soil contamination by MPs to urbanization and related anthropogenic activities []. Contributing factors include high population density, intensive use of textiles and cleaning products, dispersion of plastic waste from garbage, and the fragmentation of construction materials and furniture containing MP [,].
Furthermore, in this study, an area with high MP abundance was identified within the forest, where plastic residues deposited on the soil surface were displaced downslope by runoff or wind from higher altitudes, being intercepted by tree and shrub vegetation. This process promoted their deposition and high concentration, as also reported by other authors [,,]. Similar results were observed in northwestern Germany, where high MP abundance was linked to the elevated production of sewage sludge caused by high population density and intensive agricultural land use [].
However, some studies suggest that MP contamination in agricultural soils is independent of fertilizer or compost application, and that nearby roads and urban areas do not significantly contribute to soil MP pollution []. Therefore, it is necessary to investigate the actual effect of potential MP sources in the study area and to compare the findings with other research conducted in similar locations using comparable sampling methods and procedures. In this way, it will be possible to develop a more accurate modeling of MP transport and accumulation under different land uses [].
4.3. Visual Characterization and Composition of Microplastics
The physical attributes of MP—type, size, shape, and color—influence their interaction with soil physicochemical properties (e.g., pH, structure, hydrodynamics, aggregate stability) and can help trace their sources [,]. In our study, MP occurred in four main forms: films (32%), fragments (28%), fibers, and granules, with similar distributions across all land uses (Figure 6b). Films and fragments are often associated with polyethylene and polyester debris from mulching films, packaging, and woven sacks [,,]. Fiber–fragment predominance, observed here and in other works [,], suggests multiple degradation pathways from larger plastic residues.
Shape and size distributions indicate possible soil–MP interactions. Polyethylene fragments (43.6–2017 µm in our study) and polyester fibers (60.6–2752 µm in our study) can become embedded within the soil matrix, potentially affecting aggregate stability [,], while films (42.4–2345 µm) and granules (16.32–585 µm; Figure 6c) were also detected, which, due to their shape and geometry properties, may also interfere with soil structural stability, with granules additionally potentially influencing soil physical properties such as porosity and water dynamics.
MPs were classified into four size classes, with most particles falling between 20 and 200 µm (Figure 6c), similar to other research [,]. The analyzed MP covered a wide size range from 20 to 3000 µm, which may explain the higher abundance values compared to studies that only characterized MP larger than 1 mm []. Over 80% of particles measured <500 µm, in agreement with agricultural soil studies in China [,], supporting the hypothesis of intense fragmentation by physical forces like compaction, friction, and soil tillage or environmental influences such as weathering over a relatively brief time [,].
Color analysis identified with Raman spectroscopy revealed predominance of black, white, and transparent particles (Figure 6a), consistent with the findings of La et al. []. The color of MP particles can offer valuable indications of their potential sources and entry pathways into the soil environment []. Black particles are often associated with agricultural mulches and fertilizer bags, whereas white plastics are more common in greenhouse materials, such as white bags, transparent films, and packaging products [,]. In contrast, colored MPs are commonly derived from fragments of bottles, textiles, and packaging used in both daily life and agricultural production [].
The most prevalent polymers, in order of their abundance, were PP, PET, PE, PVC, PA, PS, and rubber (Figure 5a), similar to findings in a review of 177 articles on MP in agricultural soils []. The spectra of the polymers found in the samples for each land use (Figure 6) contained the most representative functional groups of the polymers identified in numerous studies []. Previous research has shown that agricultural soils mainly contain MP in the form of fibers and granules, with PS, PE, PP, and PET being the most common materials [].
Raman spectroscopy identified polypropylene (PP), polyethylene terephthalate (PET), and polyethylene (PE) as the most common polymers (73.3% of particles), consistent with global agricultural soil surveys using infrared spectroscopy []. PP is widely used in woven sacks and mulch films, PET in bottles and packaging, and PE in bags and agricultural films [,]. These polymers likely originate from the degradation of larger plastic residues contaminating the environment [].
Our results also revealed a wide diversity of MP polymers in terms of colors, size, and shapes across the study area, with comparable proportions observed among forest, grassland, and agricultural soils (Figure 4 and Figure 6). This pattern suggests a relatively homogeneous contamination process throughout the region. The consistent predominance of PE, PP, and PET across all land uses aligns with their extensive application in agricultural inputs [].
Similar trends have been reported in other terrestrial environments, where comparable polymer types and morphologies are found irrespective of land use, indicating that wind dispersal, surface runoff, and agricultural practices likely function as common transport pathways [,,]. A comparable case was also documented in two metropolitan cities, where MPs displayed consistent morphologies and characteristics linked to similar plastic consumption patterns and human activities [].
4.4. Relating Microplastic Abundance to Soil and Terrain Attributes
In the present study, the correlation results in Figure 7c suggested a weak positive relationship between MP abundance and sand content and a significant negative correlation with clay content and SOM. Similar behavior was reported, indicating that soils with higher sand content may facilitate MP accumulation, whereas clay-rich soils may retain less MP due to their structure and physical properties []. This observation regarding soil structure was also noted in the PCA (Figure 7a), where the variables clay and microporosity were positively correlated, while sand content and soil bulk density (Bd) were inversely correlated with these attributes.
In this context, several studies have reported that MPs can alter soil structure and microbial activity. The effects of microplastics (MPs) on soil attributes were observed, with findings indicating that different concentrations and types of MPs added to the soil may significantly alter soil Bd [], with statistically significant changes reported in some cases []. Additionally, MPs affect soil Bd, but these changes depend on the shape, type, and concentration of MPs []. These properties can influence water retention capacity and the adsorption of MPs by colloidal solids and soluble matter, thereby affecting soil aggregate formation [].
Our results indicated that the abundance of MP in agricultural soils exhibited a negative correlation with high Bd values and a positive correlation with high total porosity (TP) values (Figure 7a). This suggests that in compacted agricultural uses, MP abundance may be reduced, a trend also observed [].
A significant negative correlation was observed between MP abundance and soil chemical properties, such as Mg, Ca, tCEC, eCEC, SBT, and SOM (Figure 7a). The presence of MPs may alter cation exchange in the soil due to their large specific surface area and adsorption capacity [,], potentially reducing long-term soil fertility and crop health [].
Although a negative correlation between MP abundance and SOM was observed (Figure 7a), the literature presents varying conclusions regarding this relationship. A study found that MP abundance in soil was negatively correlated with SOM stability []. Others found that MP abundance was associated with a decrease in SOM quality, suggesting that MP may interfere with the relationship between organic matter and soil structure []. The MP weathering has the potential to directly and indirectly alter the molecular properties of organic matter [,]. These changes in MP properties can transform the composition of soil organic matter from simple structures to more complex and aromatic organic compounds, impacting microbial community structure, abundance, biomass, and microbial activity [,,].
It is important to emphasize that MP effects on soil can vary depending on soil properties (texture, mineralogy, acidity, CEC, among others). These attributes influence soil response mechanisms depending on MP concentration, shape, size, and type []. However, changes in soil attributes will only be gradual and significant when MP concentrations in soil are high, ranging between 0.5% and 2% [].
Few studies describe any relationship between MP abundance and terrain parameters or vegetation cover. The topography and slope can influence the movement and accumulation of MP in soil, related to areas with steeper slopes []. In our study, a significant negative relationship was observed between MP abundance and parameters such as the convergence index (CONVERG), plan curvature (HCURV), slope position (RSP), and channel network distance (CHNL_DIST), along with a significant positive correlation with the topographic wetness index (TWI) (Figure 7d). These variables are derived from the digital terrain model (Figure 2b). Thus, the TWI, which reflects the tendency of water to accumulate at lower positions of the landscape [], positively correlates with MP abundance (Figure 7d). Indeed, surface runoff can increase soil erosion and MP mobilization []. However, in areas with vegetative cover, erosion is generally reduced, which may limit MP mobilization [].
Additionally, parameters modeling terrain curvature (HCURV), slope position (RSP), and surface water dynamics (CONVERG) account for terrain slope and shape []. These parameters were highly correlated in the PCA (Figure 7b), indicating high susceptibility to soil erosion and MP transport. The negative correlations observed for these terrain attributes (Figure 7d) indicated lower MP abundance on convex slopes and higher positions, such as in summits and shoulders.
Our findings highlight the novel contribution of terrain variables in explaining MP distribution patterns, an aspect often underexplored in previous studies []. The significant correlations observed between MP abundance and terrain parameters (Figure 7d) indicate that topographic controls on water and sediment redistribution play a key role in MP transport and retention within the landscape, as also suggested by Leitão et al., 2024 []. These relationships demonstrate that terrain-derived predictors can be incorporated into spatial models of MP transport and accumulation, thereby strengthening the development of risk assessment frameworks for terrestrial environments. This integration is particularly relevant in tropical regions, where steep slopes, intense rainfall, and heterogeneous land-use patterns may intensify both the mobilization and deposition of microplastics in the soil.
Our study is among the first to establish a relationship between soil properties, the normalized difference vegetation index (NDVI), terrain characteristics, and land use (forest, grassland, and agriculture) with the abundance, distribution, and identification of MPs in tropical soils. The characterization of MPs, including shape, size, and polymer type, can provide insights into their migration mechanisms within the soil []. This migration is closely related to particle size, bulk density, and organic matter content, which affect the ability of MPs to move through soil pores, thereby altering soil hydrophysical properties []. In addition, vegetation type and density can act as barriers that limit the surface mobility of MPs [].
4.5. Limitations and Future Research
In this study, we quantified, characterized, and identified MPs in three tropical land uses. However, we found that the complexity of the analyzed soil matrix, where mineral components, organic matter, microfauna, and plastic residues interact, posed a significant challenge for MP extraction, quantification, and complete identification with Raman spectrometry. This complexity also affects their mobility and degradation []. In our study, three density separation solutions ranging from 1.0 to 1.5 g cm−3 were used, which means that MPs with higher densities were not considered or analyzed.
In addition, seasonal variation in the study area is another factor affecting the distribution and abundance of MPs in terms of land use and soil properties []. However, this study did not evaluate seasonal changes, particularly temperature variations, wind direction and speed, or soil erosion caused by rainfall, which can transport MP and alter their concentrations and spatial variability [,].
Future studies should focus on better understanding MP transport mechanisms via soil erosion and how different agricultural management practices might influence this process, requiring further evaluation of factors such as rainfall [] and atmospheric deposition [] to identify more relevant relationships explaining the influence of these characteristics on MP concentrations across different land uses.
5. Conclusions
Microplastic particles were found in all soil samples collected from a micro-watershed in a tropical zone, covering three land-use types: forest, grassland, and agriculture. Average MP abundances were 3825.9, 2552.6, and 3406.6 pieces kg−1 for forest, grassland, and agriculture, respectively. A wide variety of MP colors, sizes, shapes, and polymers were identified, with similar proportions across different land uses.
The spatial distribution of MP on the micro-watershed was rather heterogeneous, with somewhat higher concentrations in the forest and agricultural areas. Significant correlations between MP abundance and soil and terrain attributes were observed, with positive correlations for topographic wetness index, and negative correlations for clay and soil organic matter content, chemical properties (tCEC, eCEC, SB, Ca, Mg), convergence index, plan curvature, distance to channel network, and relative slope position.
This study provides detailed evidence of MP pollution in Brazilian soils under different land uses influenced by diverse agricultural activities, paving the way for future research on the effects of MP on these ecosystems and their relation to soil and terrain attributes.
Author Contributions
Conceptualization, J.J.A.-H. and M.L.N.S.; Methodology, J.J.A.-H., A.D.B.d.B. and M.L.N.S.; Formal analysis, J.J.A.-H. and A.D.B.d.B.; Investigation, J.J.A.-H., A.D.B.d.B. and M.L.N.S.; Writing—original draft, J.J.A.-H.; Writing—review and editing, A.D.B.d.B., E.M.S., D.T. and M.L.N.S.; Visualization, E.M.S. and D.T.; Supervision, M.L.N.S.; project administration, M.L.N.S.; Funding acquisition, A.D.B.d.B. and M.L.N.S. All authors have read and agreed to the published version of the manuscript.
Funding
This research was funded by the Coordination for the Improvement of Higher Education Personnel (CAPES) (code 001), the National Council for Scientific and Technological Development (CNPq) (processes: 307950/2021-2 and 307059/2022-7), and the Foundation for Research Support of the State of Minas Gerais (FAPEMIG) (processes: APQ 00802-18).
Data Availability Statement
The datasets generated and analyzed during this study are available from the corresponding author upon reasonable request. The data are not currently available to the public, as the research team has opted to retain access temporarily to support ongoing analyses and future publications.
Acknowledgments
This work was supported by the Surcolombiana University (USCO), the Federal University of Lavras (UFLA). The authors would like to thank the Laboratory of Electron Microscopy and Analysis of the Ultrastructural Federal University of Lavras.
Conflicts of Interest
The authors state that they have no financial interests or personal affiliations that could have inappropriately influenced the research presented in this manuscript.
Abbreviations
The following abbreviations are used in this manuscript:
| MP | Microplastics |
| NDVI | Normalized difference vegetation index |
| PCA | Principal component analysis |
| PP | Polypropylene |
| PE | Polyethylene |
| PET | Polyethylene terephthalate |
| PVC | Vinyl polychloride |
| PS | Polystyrene |
| LDPE | Low-density polyethylene |
| PC | Polycarbonate |
| Bd | Soil bulk density |
| TP | Total porosity |
| SOM | Soil organic matter |
| tCEC | Total cation exchange capacity |
| eCEC | Effective cation exchange capacity |
| CHNL_DIST | Channel network distance |
| CONVERG | Convergence index |
| HCURV | Altitude, plan curvature |
| TWI | Topographic wetness index |
| VCURV | Profile curvature |
| RSP | Slope position |
| SWI | SAGA wetness index |
| UFLA | Federal University of Lavras |
References
- Li, W.; Wufuer, R.; Duo, J.; Wang, S.; Luo, Y.; Zhang, D.; Pan, X. Microplastics in Agricultural Soils: Extraction and Characterization after Different Periods of Polythene Film Mulching in an Arid Region. Sci. Total Environ. 2020, 749, 141420. [Google Scholar] [CrossRef]
- Castelvetro, V.; Corti, A.; Biale, G.; Ceccarini, A.; Degano, I.; Nasa, J. La New Methodologies for the Detection, Identification, and Quantification of Microplastics and Their Environmental Degradation by-Products. Environ. Sci. Pollut. Res. 2021, 28, 46764–46780. [Google Scholar] [CrossRef]
- Orona, N.C.; García, M.R.; Loge, F.J.; Mahlknecht, J.; Aguilar-Hernández, I.; Ornelas-Soto, N. Microplastics in Latin America and the Caribbean: A Review on Current Status and Perspectives. J. Environ. Manage. 2022, 309, 114698. [Google Scholar] [CrossRef]
- Zhou, Y.; Jia, Z.; Zheng, G.; Chen, L.; Zhang, Q.; Su, B.; Zhou, S. Microplastics in Agricultural Soils on the Coastal Plain : Spatial Characteristics, Influencing Factors and Sources. Sci. Total Environ. 2023, 901, 165948. [Google Scholar] [CrossRef] [PubMed]
- Li, H.; Lu, X.; Wang, S.; Zheng, B.; Xu, Y. Vertical Migration of Microplastics along Soil Profile under Different Crop Root Systems. Environ. Pollut. 2021, 278, 116833. [Google Scholar] [CrossRef] [PubMed]
- Li, J.; Song, Y.; Cai, Y. Focus Topics on Microplastics in Soil: Analytical Methods, Occurrence, Transport, and Ecological Risks. Environ. Pollut. 2020, 257, 113570. [Google Scholar] [CrossRef] [PubMed]
- Sarkar, A.; Deb, S.; Ghosh, S.; Mandal, S.; Quazi, S.A.; Kushwaha, A.; Hoque, A.; Choudhury, A. Impact of Anthropogenic Pollution on Soil Properties in and around a Town in Eastern India. Geoderma Reg. 2022, 28, e00462. [Google Scholar] [CrossRef]
- Lwanga, E.H.; Beriot, N.; Corradini, F.; Silva, V.; Yang, X.; Baartman, J.; Rezaei, M.; van Schaik, L.; Riksen, M.; Geissen, V. Review of Microplastic Sources, Transport Pathways and Correlations with Other Soil Stressors: A Journey from Agricultural Sites into the Environment. Chem. Biol. Technol. Agric. 2022, 9, 20. [Google Scholar] [CrossRef]
- Munno, K.; De Frond, H.; O’Donnell, B.; Rochman, C.M. Increasing the Accessibility for Characterizing Microplastics: Introducing New Application-Based and Spectral Libraries of Plastic Particles (SLoPP and SLoPP-E). Anal. Chem. 2020, 92, 2443–2451. [Google Scholar] [CrossRef]
- He, D.; Luo, Y.; Lu, S.; Liu, M.; Song, Y.; Lei, L. Microplastics in Soils: Analytical Methods, Pollution Characteristics and Ecological Risks. TrAC Trends Anal. Chem. 2018, 109, 163–172. [Google Scholar] [CrossRef]
- Hu, J.; He, D.; Zhang, X.; Li, X.; Chen, Y.; Wei, G.; Zhang, Y.; Ok, Y.S.; Luo, Y. National-Scale Distribution of Micro(Meso)Plastics in Farmland Soils across China: Implications for Environmental Impacts. J. Hazard. Mater. 2022, 424, 127283. [Google Scholar] [CrossRef]
- Feng, S.; Lu, H.; Yao, T. Effects of Multiple Environmental Factors and Land Use Patterns on Microplastic Distribution in the Topsoil of the Qinghai and Sichuan Provinces of China. J. Environ. Chem. Eng. 2023, 11, 109657. [Google Scholar] [CrossRef]
- Zhang, F.; Yang, X.; Zhang, Z. Effects of Soil Properties and Land Use Patterns on the Distribution of Microplastics: A Case Study in Southwest China. J. Environ. Manage. 2024, 356, 120598. [Google Scholar] [CrossRef]
- Padha, S.; Kumar, R.; Dhar, A.; Sharma, P. Microplastic Pollution in Mountain Terrains and Foothills: A Review on Source, Extraction, and Distribution of Microplastics in Remote Areas. Environ. Res. 2022, 207, 112232. [Google Scholar] [CrossRef]
- Dogra, K.; Kumar, M.; Deoli Bahukhandi, K.; Zang, J. Traversing the Prevalence of Microplastics in Soil-Agro Ecosystems: Origin, Occurrence, and Pollutants Synergies. J. Contam. Hydrol. 2024, 266, 104398. [Google Scholar] [CrossRef]
- Akca, H.; Albayrak, R.; Onur, M.; Gündo, S. An Evaluation on Microplastic Accumulations in Turkish Soils under Different Land Uses. Sci. Total Environ. 2024, 911, 168609. [Google Scholar] [CrossRef]
- Machado, S.; Abel, A.; Hempel, S.; Rillig, M.C.; Kloas, W.; Zarfl, C. Microplastics as an Emerging Threat to Terrestrial Ecosystems. Glob. Chang. Biol. 2017, 24, 1405–1416. [Google Scholar] [CrossRef]
- Amjad, M.; Huang, Q.; Khan, S.; Wang, Q.; Huang, J.; Fahad, X.; Sajjad, M.; Liu, Y.; Mašek, O.; Li, X.; et al. Abundance, Spatial Distribution, and Characteristics of Microplastics in Agricultural Soils and Their Relationship with Contributing Factors. J. Environ. Manage. 2023, 328, 117006. [Google Scholar] [CrossRef]
- Piehl, S.; Leibner, A.; Löder, M.G.J.; Dris, R.; Bogner, C.; Laforsch, C. Identification and Quantification of Macro- and Microplastics on an Agricultural Farmland. Sci. Rep. 2018, 8, 17950. [Google Scholar] [CrossRef]
- Campanale, C.; Galafassi, S.; Savino, I.; Massarelli, C.; Ancona, V.; Volta, P.; Felice, V. Microplastics Pollution in the Terrestrial Environments : Poorly Known Diffuse Sources and Implications for Plants. Sci. Total Environ. 2022, 805, 150431. [Google Scholar] [CrossRef] [PubMed]
- Büks, F.; Kaupenjohann, M. Global Concentrations of Microplastics in Soils—A Review. Soil 2020, 6, 649–662. [Google Scholar] [CrossRef]
- Xiang, Y.; Jiang, L.; Zhou, Y.; Luo, Z.; Zhi, D.; Yang, J.; Lam, S.S. Microplastics and Environmental Pollutants: Key Interaction and Toxicology in Aquatic and Soil Environments. J. Hazard. Mater. 2022, 422, 126843. [Google Scholar] [CrossRef]
- Machado, S.; Abel, A.; Lau, C.W.; Kloas, W.; Bergmann, J. Microplastics Can Change Soil Properties and Affect Plant Performance. Environ. Sci. Technol. 2019, 53, 6044–6052. [Google Scholar] [CrossRef] [PubMed]
- Li, R.; Xi, B.; Tan, W.; Yuan, Y. Spatiotemporal Heterogeneous Effects of Microplastics Input on Soil Dissolved Organic Matter (DOM) under Field Conditions. Sci. Total Environ. 2022, 847, 157605. [Google Scholar] [CrossRef] [PubMed]
- Nizzetto, L.; Futter, M.; Langaas, S. Are Agricultural Soils Dumps for Microplastics of Urban Origin? Environ. Sci. Technol. 2016, 50, 10777–10779. [Google Scholar] [CrossRef]
- Weber, C.J.; Opp, C.; Prume, J.A.; Koch, M.; Andersen, T.J.; Chifflard, P. Deposition and In-Situ Translocation of Microplastics in Floodplain Soils. Sci. Total Environ. 2021, 819, 152039. [Google Scholar] [CrossRef]
- Guo, S.; Zhang, J.; Liu, J.; Guo, N.; Zhang, L.; Wang, S.; Wang, X.; Zhao, M. Organic Fertilizer and Irrigation Water Are the Primary Sources of Microplastics in the Facility Soil, Beijing. Sci. Total Environ. 2023, 895, 165005. [Google Scholar] [CrossRef]
- Fernandes, A.N.; Bertoldi, C.; Lara, L.Z.; Stival, J.; Alves, N.M.; Cabrera, P.M.; Grassi, M.T. Microplastics in Latin America Ecosystems: A Critical Review of the Current Stage and Research Needs. J. Braz. Chem. Soc. 2022, 33, 303–326. [Google Scholar] [CrossRef]
- Quinn, B.; Murphy, F.; Ewins, C. Validation of Density Separation for the Rapid Recovery of Microplastics from Sediment. Anal. Methods 2016, 9, 1491–1498. [Google Scholar] [CrossRef]
- Liu, M.; Song, Y.; Lu, S.; Qiu, R.; Hu, J.; Li, X.; Bigalke, M.; Shi, H.; He, D. A Method for Extracting Soil Microplastics through Circulation of Sodium Bromide Solutions. Sci. Total Environ. 2019, 691, 341–347. [Google Scholar] [CrossRef]
- Radford, F.; Zapata-Restrepo, L.M.; Horton, A.A.; Hudson, M.D.; Shaw, P.J.; Williams, I.D. Developing a Systematic Method for Extraction of Microplastics in Soils. Anal. Methods 2021, 13, 1695–1705. [Google Scholar] [CrossRef] [PubMed]
- Grause, G.; Kuniyasu, Y.; Chien, M.; Inoue, C. Separation of Microplastic from Soil by Centrifugation and Its Application to Agricultural Soil. Chemosphere 2022, 288, 132654. [Google Scholar] [CrossRef]
- Samanta, P.; Dey, S.; Kundu, D.; Dutta, D.; Jambulkar, R.; Mishra, R.; Ghosh, A.R.; Kumar, S. An Insight on Sampling, Identification, Quantification and Characteristics of Microplastics in Solid Wastes. Trends Environ. Anal. Chem. 2022, 36, e00181. [Google Scholar] [CrossRef]
- Thomas, D.; Schutze, B.; Heinze, W.M.; Steinmetz, Z. Sample Preparation Techniques for the Analysis of Microplastics in Soil—A Review. Sustainability 2020, 12, 9074. [Google Scholar] [CrossRef]
- Zhang, G.S.; Liu, Y.F. The Distribution of Microplastics in Soil Aggregate Fractions in Southwestern China. Sci. Total Environ. 2018, 642, 12–20. [Google Scholar] [CrossRef]
- Zhou, Y.; Jing, J.; Yu, R.; Zhao, Y.; Gou, Y.; Zhang, Z.; Tang, H.; Zhang, H.; Huang, Y. Microplastics in Plateau Agricultural Areas: Spatial Changes Reveal Their Source and Distribution Characteristics. Environ. Pollut. 2023, 319, 121006. [Google Scholar] [CrossRef]
- Guimarães, A.; Moraes, B.R.D.; Ando, R.A.; Perotti, G.F.; Sampaio, B.; Anna, S.; Hattori, G.Y.; Macrobrachium, O. Is the Shrimp Macrobrachium Amazonicum Sold in an Urban Center in the Central Brazilian Amazon Contaminated with Microplastics? Acta Amaz. 2024, 54, e54es24200. [Google Scholar] [CrossRef]
- Paes, E.d.S.; Gloaguen, T.V.; Silva, H.; dos, A.d.C.; Duarte, T.S.; de Almeida, M.d.C.; Costa, O.D.A.V.; Bomfim, M.R.; Santos, J.A.G. Widespread Microplastic Pollution in Mangrove Soils of Todos Os Santos Bay, Northern Brazil. Environ. Res. 2022, 210, 112952. [Google Scholar] [CrossRef] [PubMed]
- Sarti, F.M.E.; De Souza, G.A.; da Silva, B.R.; dos Santos, R.D. Municipal Park Grounds and Microplastics Contamination. J. Polym. Environ. 2022, 30, 5202–5210. [Google Scholar] [CrossRef]
- Gerolin, R.C.; Pupim, N.F.; Sawakuchi, O.A.; Grohmann, H.C.; Labuto, G.; Semensatto, D. Microplastics in Sediments from Amazon Rivers, Brazil. Sci. Total Environ. 2020, 749, 2016–2021. [Google Scholar] [CrossRef] [PubMed]
- Leitão, I.A.; van Schaik, L.; Ferreira, A.J.D.; Alexandre, N.; Geissen, V. The Spatial Distribution of Microplastics in Topsoils of an Urban Environment—Coimbra City Case-Study. Environ. Res. 2023, 218, 114961. [Google Scholar] [CrossRef]
- Silva, B.M.; Santos, W.J.R.; Marques, J.J. Detailed Soil Survey of Muquém Farm; Té, B., Ed.; UFLA: Lavras, Brazil, 2014. [Google Scholar]
- Alvares, C.A.; Stape, J.L.; Sentelhas, P.C.; De Moraes Gonçalves, J.L.; Sparovek, G. Köppen’s Climate Classification Map for Brazil. Meteorol. Z. 2013, 22, 711–728. [Google Scholar] [CrossRef]
- Dantas, A.A.A.; de Carvalho, L.G.; Ferreira, E. Classificação e Tendências Climáticas Em Lavras, MG. Ciênc. Agrotecnol. 2007, 31, 1862–1866. [Google Scholar] [CrossRef]
- Arevalo-Hernandez, J.J.; Barrera, D.B.A.; Avanzi, J.C.; Cirillo, M.A.; Silva, M.L.N. Plastic Debris in Agroecosystems : Distribution and Abundance Patterns, and Relationship with Terrain Characteristics in Southeastern Brazil. ACS Omega 2025, 10, 18457–18469. [Google Scholar] [CrossRef]
- IUSS Working Group WRB World Reference Base for Soil Resources. In International Soil Classification System for Naming Soils and Creating Legends for Soil Maps, 4th ed.; International Union of Soil Sciences (IUSS): Vienna, Austria, 2022; ISBN 9798986245119.
- Dane, J.H.; Topp, G.C. Methods of Soil Analysis: Physical Methods; Soil Science Society of America Inc.: Madison, WI, USA, 2002. [Google Scholar]
- Kemper, W.D.; Rosenau, R.C. Aggregate Stability and Size Distribution. In Methods of Soil Analysis: Part 1 Physical and Mineralogical Methods, 2nd ed.; Klute, A., Ed.; American Society of Agronomy, Inc.; Soil Science Society of America, Inc.: Madison, WI, USA, 1986. [Google Scholar]
- Da Silva, A.E.; Fontana, A.; Melo, A.d.S.; Martins, A.L.d.S.; Inda, A.V.; Santi, A.; Madari, B.E.; Mattos, B.B.; Almeida, B.G.d.; Alves, B.J.R.; et al. Manual de Métodos de Análise de Solo; Empresa Br.: Rio de Janeiro, Brazil, 2017. [Google Scholar]
- Teixeira, C.P.; Donagemma, G.K.; Fontana, A.; Teixeira, G.W. Manual de Métodos de Análise de Solo, 3rd. ed; Técnicos, E., Ed.; EMBRAPA: Brasilia, Brazil, 2017; ISBN 9788570357717. [Google Scholar]
- Conrad, O.; Bechtel, B.; Bock, M.; Dietrich, H.; Fischer, E.; Gerlitz, L.; Wehberg, J.; Wichmann, V.; Böhner, J. System for Automated Geoscientific Analyses (SAGA) v. 2.1.4. Geosci. Model Dev. 2015, 8, 1991–2007. [Google Scholar] [CrossRef]
- QGIS Development Team QGIS Geographic Information System; versão 3.28.2; QGIS: Firenze, Italy, 2024.
- Zhou, Y.; Liu, X.; Wang, J. Characterization of Microplastics and the Association of Heavy Metals with Microplastics in Suburban Soil of Central China. Sci. Total Environ. 2019, 694, 133798. [Google Scholar] [CrossRef]
- Arevalo-Hernandez, J.J.; Barrera, D.B.D.A.; Curi, N.; Avanzi, J.C.; Silva, N.L.M. A Method for the Extraction and Analysis of Microplastics from Tropical Agricultural Soils in Southeastern Brazil. Soil Syst. 2025, 9, 34. [Google Scholar] [CrossRef]
- Yang, J.; Li, R.; Zhou, Q.; Li, L.; Li, Y.; Tu, C.; Zhao, X. Abundance and Morphology of Microplastics in an Agricultural Soil Following Long-Term Repeated Application of Pig Manure. Environ. Pollut. 2021, 272, 116028. [Google Scholar] [CrossRef] [PubMed]
- Wang, J.; Li, J.; Liu, S.; Li, H.; Chen, X.; Peng, C.; Zhang, P.; Liu, X. Distinct Microplastic Distributions in Soils of Different Land-Use Types : A Case Study of Chinese Farmlands. Environ. Pollut. 2021, 269, 116199. [Google Scholar] [CrossRef]
- Yang, J.; Li, L.; Li, R.; Xu, L.; Shen, Y.; Li, S.; Tu, C.; Wu, L.; Christie, P.; Luo, Y. Microplastics in an Agricultural Soil Following Repeated Application of Three Types of Sewage Sludge : A Field Study. Environ. Pollut. 2021, 289, 117943. [Google Scholar] [CrossRef]
- OriginPro Lab Corporation. OriginPro 2024, version 2024b; OriginPro Lab Corporation: Northampton, MA, USA, 2024. [Google Scholar]
- Corradini, F.; Meza, P.; Eguiluz, R.; Casado, F.; Huerta-Lwanga, E.; Geissen, V. Evidence of Microplastic Accumulation in Agricultural Soils from Sewage Sludge Disposal. Sci. Total Environ. 2019, 671, 411–420. [Google Scholar] [CrossRef] [PubMed]
- R Core Team. R version 4.4.0: A Language and Environment for Statistical Computing; R Foundation for Statistical Computing: Vienna, Austria, 2024. [Google Scholar]
- Rafique, A.; Irfan, M.; Mumtaz, M.; Qadir, A. Spatial Distribution of Microplastics in Soil with Context to Human Activities: A Case Study from the Urban Center. Environ. Monit. Assess. 2020, 192, 671. [Google Scholar] [CrossRef] [PubMed]
- Weber, C.J.; Santowski, A.; Chifflard, P. Investigating the Dispersal of Macro- and Microplastics on Agricultural Fields 30 Years after Sewage Sludge Application. Sci. Rep. 2022, 12, 6401. [Google Scholar] [CrossRef] [PubMed]
- Liu, H.; Sun, K.; Liu, X.; Yao, R.; Cao, W.; Zhang, L.; Wang, X. Spatial and Temporal Distributions of Microplastics and Their Macroscopic Relationship with Algal Blooms in Chaohu Lake, China. J. Contam. Hydrol. 2022, 248, 104028. [Google Scholar] [CrossRef]
- Phan, S.; Padilla-Gamiño, J.L.; Luscombe, C.K. The Effect of Weathering Environments on Microplastic Chemical Identification with Raman and IR Spectroscopy: Part I. Polyethylene and Polypropylene. Polym. Test. 2022, 116, 107752. [Google Scholar] [CrossRef]
- Sobhani, Z.; Amin, A.; Naidu, R.; Megharaj, M.; Fang, C. Identification and Visualisation of Microplastics by Raman Mapping. Anal. Chim. Acta 2019, 1077, 191–199. [Google Scholar] [CrossRef]
- González-Córdova, J.A.; Ariza-flores, D.; Pérez-huerta, J.S.; Madrigal-melchor, J. Optical Anisotropy Raman Response of Polyethylene Terephthalate Strained Thin Films. Phys. B Condens. Matter 2023, 654, 414693. [Google Scholar] [CrossRef]
- Berenstein, G.; Córdoba, P.; Díaz, Y.B.; González, N.; Ponce, M.B.; Montserrat, J.M. Macro, Meso, Micro and Nanoplastics in Horticultural Soils in Argentina: Abundance, Size Distribution and Fragmentation Mechanism. Sci. Total Environ. 2024, 906, 167672. [Google Scholar] [CrossRef]
- Yoon, J.H.; Kim, B.H.; Kim, K.H. Distribution of Microplastics in Soil by Types of Land Use in Metropolitan Area of Seoul. Appl. Biol. Chem. 2024, 67, 15. [Google Scholar] [CrossRef]
- Corradini, F.; Casado, F.; Leiva, V.; Huerta-lwanga, E.; Geissen, V. Microplastics Occurrence and Frequency in Soils under Different Land Uses on a Regional Scale. Sci. Total Environ. 2021, 752, 141917. [Google Scholar] [CrossRef]
- Yu, L.; Zhang, J.D.; Liu, Y.; Chen, L.Y.; Tao, S.; Liu, W.X. Distribution Characteristics of Microplastics in Agricultural Soils from the Largest Vegetable Production Base in China. Sci. Total Environ. 2021, 756, 143860. [Google Scholar] [CrossRef] [PubMed]
- Wang, K.; Chen, W.; Tian, J.; Niu, F.; Xing, Y.; Wu, Y.; Zhang, R.; Zheng, J.; Xu, L. Accumulation of Microplastics in Greenhouse Soil after Long-Term Plastic Film Mulching in Beijing, China. Sci. Total Environ. 2022, 828, 154544. [Google Scholar] [CrossRef]
- Zhang, Y.; Wang, K.; Chen, W.; Ba, Y.; Khan, K.; Chen, W.; Tu, C. Effects of Land Use and Landscape on the Occurrence and Distribution of Microplastics in Soil, China. Sci. Total Environ. 2022, 847, 157598. [Google Scholar] [CrossRef]
- Klaus, J.; Seeger, M.; Bigalke, M.; Weber, C.J. Microplastics in Vineyard Soils: First Insights from Plastic-Intensive Viticulture Systems. Sci. Total Environ. 2024, 947, 174699. [Google Scholar] [CrossRef]
- La, Y.; Zhang, L.; Zhao, N.; Ye, H.; Zeng, Q.; Zhao, L.; Wang, Z.; Lin, D.; Wang, R. The Microplastics Distribution Characteristics and Their Impact on Soil Physicochemical Properties and Bacterial Communities in Food Legumes Farmland in Northern China. J. Hazard. Mater. 2024, 471, 134282. [Google Scholar] [CrossRef]
- Sunaga, N.; Okochi, H.; Niida, Y.; Miyazaki, A. Alkaline Extraction Yields a Higher Number of Microplastics in Forest Canopy Leaves : Implication for Microplastic Storage. Environ. Chem. Lett. 2024, 22, 1599–1606. [Google Scholar] [CrossRef]
- Falakdin, P.; Lopez-Rosales, A.; Andrade, J.; Terzaghi, E.; Di Guardo, A.; Muniategui-Lorenzo, S. Comparison of Microplastic Type, Size, and Composition in Atmospheric and Foliage Samples in an Urban Scenario. Environ. Pollut. 2024, 349, 123911. [Google Scholar] [CrossRef] [PubMed]
- Praveena, S.M.; Aiman, M.I.F.; Nafisyah, A.L. Microplastics Pollution in Agricultural Farms Soils : Preliminary Findings from Tropical Environment (Klang Valley, Malaysia). Environ. Monit. Assess. 2023, 195, 650. [Google Scholar] [CrossRef]
- Ling, Q.; Yang, B.; Jiao, J.; Ma, X.; Zhao, W.; Zhang, X. Response of Microplastic Occurrence and Migration to Heavy Rainstorm in Agricultural Catchment on the Loess Plateau. J. Hazard. Mater. 2023, 460, 132416. [Google Scholar] [CrossRef]
- Liu, Y.; Liu, Y.; Li, Y.; Bian, P.; Hu, Y.; Zhang, J.; Shen, W. Effects of Irrigation on the Fate of Microplastics in Typical Agricultural Soil and Freshwater Environments in the Upper Irrigation Area of the Yellow River. J. Hazard. Mater. 2023, 447, 130766. [Google Scholar] [CrossRef]
- Wang, X.; Feng, Q.; Yang, L.; Li, M.; Zhao, F.; Tang, J.; Bu, Q.; Zhang, Y.; Chen, L. Effect of Land Use on Occurrence and Spatial Variability of Soil Microplastics in Agricultural Watershed. Ecol. Front. 2025, 45, 497–506. [Google Scholar] [CrossRef]
- Prajapati, A.; Jadhao, P.S.; Khare, A.; Vaidya, A.N.; Kumar, A.R.; Das, S. Characterization of Microplastics and Associated Heavy Metals in Urban Soils Affected by Anthropogenic Littering: Distribution, Spatial Variation, and Influence of Soil Properties. Soil Sediment Contam. 2023, 33, 1018–1046. [Google Scholar] [CrossRef]
- Brandes, E.; Henseler, M.; Kreins, P. Identifying Hot-Spots for Microplastic Contamination in Agricultural Soils—A Spatial Modelling Approach for Germany. Environ. Res. Lett. 2021, 16, 104041. [Google Scholar] [CrossRef]
- Huang, D.; Wang, X.; Yin, L.; Chen, S.; Tao, J.; Zhou, W.; Chen, H.; Zhang, G.; Xiao, R. Research Progress of Microplastics in Soil-Plant System : Ecological Effects and Potential Risks. Sci. Total Environ. 2022, 812, 151487. [Google Scholar] [CrossRef]
- Xiaoting, Z.; Yingxin, C.; Xinyu, L.; Yalin, Z.; Wei, G.; Jie, J.; Aoyun, M.; Defu, H. Size_shape-Dependent Migration of Microplastics in Agricultural Soil under Simulative and Natural Rainfall. Sci. Total Environ. 2022, 815, 152507. [Google Scholar] [CrossRef]
- Machado, S.; Abel, A.; Lau, C.W.; Till, J.; Kloas, W.; Lehmann, A.; Becker, R.; Rillig, M.C. Impacts of Microplastics on the Soil Biophysical Environment. Environ. Sci. Technol. 2018, 52, 9656–9665. [Google Scholar] [CrossRef] [PubMed]
- Wang, W.; Ge, J.; Yu, X.; Li, H. Environmental Fate and Impacts of Microplastics in Soil Ecosystems : Progress and Perspective. Sci. Total Environ. 2020, 708, 134841. [Google Scholar] [CrossRef]
- Pérez, R.R.; Álvarez, M.S.J.; Kropp, R.M.; Perdomo, G.A.; Hernandez, B.J.; Díaz, F.J. Microplastics in Agricultural Systems: Analytical Methodologies and Effects on Soil Quality and Crop Yield. Agriculture 2022, 12, 1162. [Google Scholar] [CrossRef]
- Ding, F.; Jones, D.L.; Chadwick, D.R.; Kim, P.J.; Jiang, R.; Flury, M. Environmental Impacts of Agricultural Plastic Film Mulch: Fate, Consequences, and Solutions. Sci. Total Environ. 2022, 836, 155668. [Google Scholar] [CrossRef]
- Wen, X.; Yin, L.; Zhou, Z.; Kang, Z.; Sun, Q.; Zhang, Y. Microplastics Can Affect Soil Properties and Chemical Speciation of Metals in Yellow-Brown Soil. Ecotoxicol. Environ. Saf. 2022, 243, 113958. [Google Scholar] [CrossRef]
- Lincmaierova, K.; Botyanszk, L.; Lichner, L.; Toková, L.; Zafeiriou, I.; Bondarev, D.; Horák, J.; Šurda, P. Assessing Microplastic-Induced Changes in Sandy Soil Properties and Crop Growth. AgriEngineering 2023, 5, 1555–1567. [Google Scholar] [CrossRef]
- Liu, Z.; Cai, L.; Dong, Q.; Zhao, X.; Han, J. Effects of Microplastics on Water Infiltration in Agricultural Soil on the Loess Plateau, China. Agric. Water Manag. 2022, 271, 107818. [Google Scholar] [CrossRef]
- Ingraffia, R.; Amato, G.; Bagarello, V.; Carollo, F.G.; Giambalvo, D.; Iovino, M.; Lehmann, A.; Rillig, M.C.; Frenda, A.S. Polyester Microplastic Fibers Affect Soil Physical Properties and Erosion as a Function of Soil Type. SOIL 2022, 8, 421–435. [Google Scholar] [CrossRef]
- Zhou, J.; Gui, H.; Banfield, C.C.; Wen, Y.; Zang, H.; Dippold, M.A.; Charlton, A.; Jones, D.L. The Microplastisphere: Biodegradable Microplastics Addition Alters Soil Microbial Community Structure and Function. Soil Biol. Biochem. 2021, 156, 108211. [Google Scholar] [CrossRef]
- Huang, D.; Zhao, X.; Yin, Z.; Qin, W. Utilizing Geodetectors to Identify Conditioning Factors for Gully Erosion Risk in the Black Soil Region of Northeast China. Int. Soil Water Conserv. Res. 2024, 12, 808–827. [Google Scholar] [CrossRef]
- Rehm, R.; Zeyer, T.; Schmidt, A.; Fiener, P. Soil Erosion as Transport Pathway of Microplastic from Agriculture Soils to Aquatic Ecosystems. Sci. Total Environ. 2021, 795, 148774. [Google Scholar] [CrossRef]
- Huang, P.; Zhang, Y.; Hussain, N.; Lan, T.; Chen, G.; Tang, X.; Deng, O.; Yan, C.; Li, Y.; Luo, L.; et al. A Bibliometric Analysis of Global Research Hotspots and Progress on Microplastics in Soil-plant Systems. Environ. Pollut. 2024, 341, 122890. [Google Scholar] [CrossRef] [PubMed]
- Liu, S.; Bai, F.; Men, Z.; Gu, X.; Wang, F.; Li, Y.; Liu, Q. Spatial Distribution, Source Apportionment and Potential Ecological Risk Assessment of Suspended Atmosphere Microplastics in Different Underlying Surfaces in Harbin. Sci. Total Environ. 2023, 901, 166040. [Google Scholar] [CrossRef] [PubMed]
Disclaimer/Publisher’s Note: The statements, opinions and data contained in all publications are solely those of the individual author(s) and contributor(s) and not of MDPI and/or the editor(s). MDPI and/or the editor(s) disclaim responsibility for any injury to people or property resulting from any ideas, methods, instructions or products referred to in the content. |
© 2025 by the authors. Licensee MDPI, Basel, Switzerland. This article is an open access article distributed under the terms and conditions of the Creative Commons Attribution (CC BY) license (https://creativecommons.org/licenses/by/4.0/).