Abstract
Spatial variability in vine vigour and yield components is a major challenge for vineyard management and consistent grape quality, particularly in hilly landscapes. This study evaluates the impact of on-the-go variable-rate fertilisation (VRA) in reducing within-vineyard variability in an 8.5 hectares commercial vineyard in the Conegliano Valdobbiadene Prosecco DOCG region (Italy). Over two growing seasons, a proximal NDVI sensor (GreenSeeker) guided real-time fertiliser applications without prescription maps. Vine vigour, yield components, and grape quality were evaluated using geostatistical analysis and coefficient of variation (CV) metrics. VRA reduced total spatial variability (sill) by 55% and erratic variance (nugget effect) by 39% for NDVI measurements. Variability in yield components also decrease (−21.1% for cluster number, −6.25% for cluster weight), while grape composition parameters (total soluble solids, titratable acidity, and pH) was not significantly altered despite a slightly higher variability (in titratable acidity and pH), indicating that fertiliser modulation did not compromise grape quality. Nitrogen input was reduced by 50%, highlighting economic and environmental benefits (−302 kg CO2). These results show that simplified, sensor-based, on-the-go VRA is a practical and sustainable precision viticulture tool, even in small and heterogeneous vineyards typical of the Conegliano Valdobbiadene Prosecco DOCG area.
1. Introduction
Spatial variability in vine vigour and yield components is a well documented feature of vineyard systems and presents a significant challenge to the consistency of grape quality and resource efficiency [1,2,3]. In viticulture, this variability arises from complex interactions among topography, soil properties, microclimate, crop management, and tillage practices [4,5]. Large scale variability may reflect the terroir, where vine physiology is positively influenced by soil, water availability, climate, training systems, human labour and field management [6,7]. On the other hand, within-field variability is often greater in hilly landscapes, where differences in slope, elevation, and exposure can influence vine growth, nutrient uptake, grape composition, and soil compaction [8]. Managing within-field variability is essential to improve production uniformity, optimizing input use, and enhance the environmental and economic sustainability of vineyard operations.
In the Conegliano-Valdobbiadene Prosecco DOCG (protected denomination of origin, located in Northeast Italy) uniform vineyard is essential to meet the high-quality standards established across the 19 micro-zones within the denomination [9,10]. The main cultivar Vitis vinifera L. cv. Glera is particularly sensitive to alterations in soil, water availability, and nutrient levels, which directly influence yield and key oenological attributes [11,12]. To manage within-field variability, winegrowers commonly use agronomic practices to improve vineyard uniformity [13], such as controlling bud number per vine through pruning, cover cropping, or fertilisation [9,14]. Nevertheless, when spatial variability is pronounced, applying uniform management interventions cannot give the expected results [15].
In this context, winegrowers adopt precision viticulture (PV) to manage within-field variability. PV consists of applying precision agriculture principles to vineyard management by considering spatial and temporal variability. PV tools can detect spatial variability in yield components and the berry phenolic composition, using sensors for non-destructive grape composition estimation [16]. To facilitate broader adoption, several accessible and cost-effective PV tools have been developed [17]. Fertilisation, one of the key operations managed by PV, affects vineyard productivity and grape quality, with direct economic, energetic, and environmental implications [18,19,20]. Variable-rate application (VRA) of fertiliser tailored to plant needs and specific zone potential, can improve efficiency and reduce inputs [21]. Advances in spectral analysis for plant vigour assessment and vineyard yield or quality mapping [22] allow winegrowers to delineate homogeneous zones and create prescription maps for VRA of fertiliser, optimizing management practices according to site-specific conditions.
These advanced methods can be difficult for winegrowers to adopt due to the time, cost, and specialised data-analysis skills required. This is particularly significant in small-scale vineyards, such as those common in the Prosecco Conegliano-Valdobbiadene area. To overcome this limitation, simplified solutions for VRA have been developed. These solutions involve real-time, on on-the-go detection of field variability, using plant health indicators like the Normalised Difference Vegetation Index (NDVI), automatically adjust fertiliser application without prescription maps or GNSS [23]. This PV approach offers a practical and immediate solution that may improve both timing and sustainability.
Full VRA systems typically rely on detailed prescription maps generated from prior spatial data collection and analysis, often integrating multiple layers of information such as soil properties, yield maps, and remote sensing imagery. These systems offer high precision but require specialised equipment, advanced data processing, and greater technical expertise, which can limit adoption [24]. In contrast, simplified VRA approaches use real-time sensor data to adjust input rates on-the-go [23], eliminating the need for pre-mapped management zones. While they may lack the complexity and integration of full systems, simplified methods can provide substantial gains in input efficiency and spatial uniformity with lower cost and operational complexity.
This study investigates the effects of real-time VRA strategy on reducing within-vineyard spatial variability in an 8.5-hectare commercial vineyard block over two consecutive growing seasons. An NDVI sensor was used to guide fertiliser applications in real time, without prescription maps. The main objectives were to: (I) assess the effect of fertiliser VRA on vine vigour and yield component uniformity, (II) evaluate its impact on grape composition parameters, and (II) identify the agronomic benefits of input reduction. The aim is to demonstrate the practicality of on-the-go VRA as a tool for improving spatial uniformity and sustainability in complex vineyard systems.
2. Materials and Methods
2.1. Study Area Description and Climatic Profiles of the Experimental Site
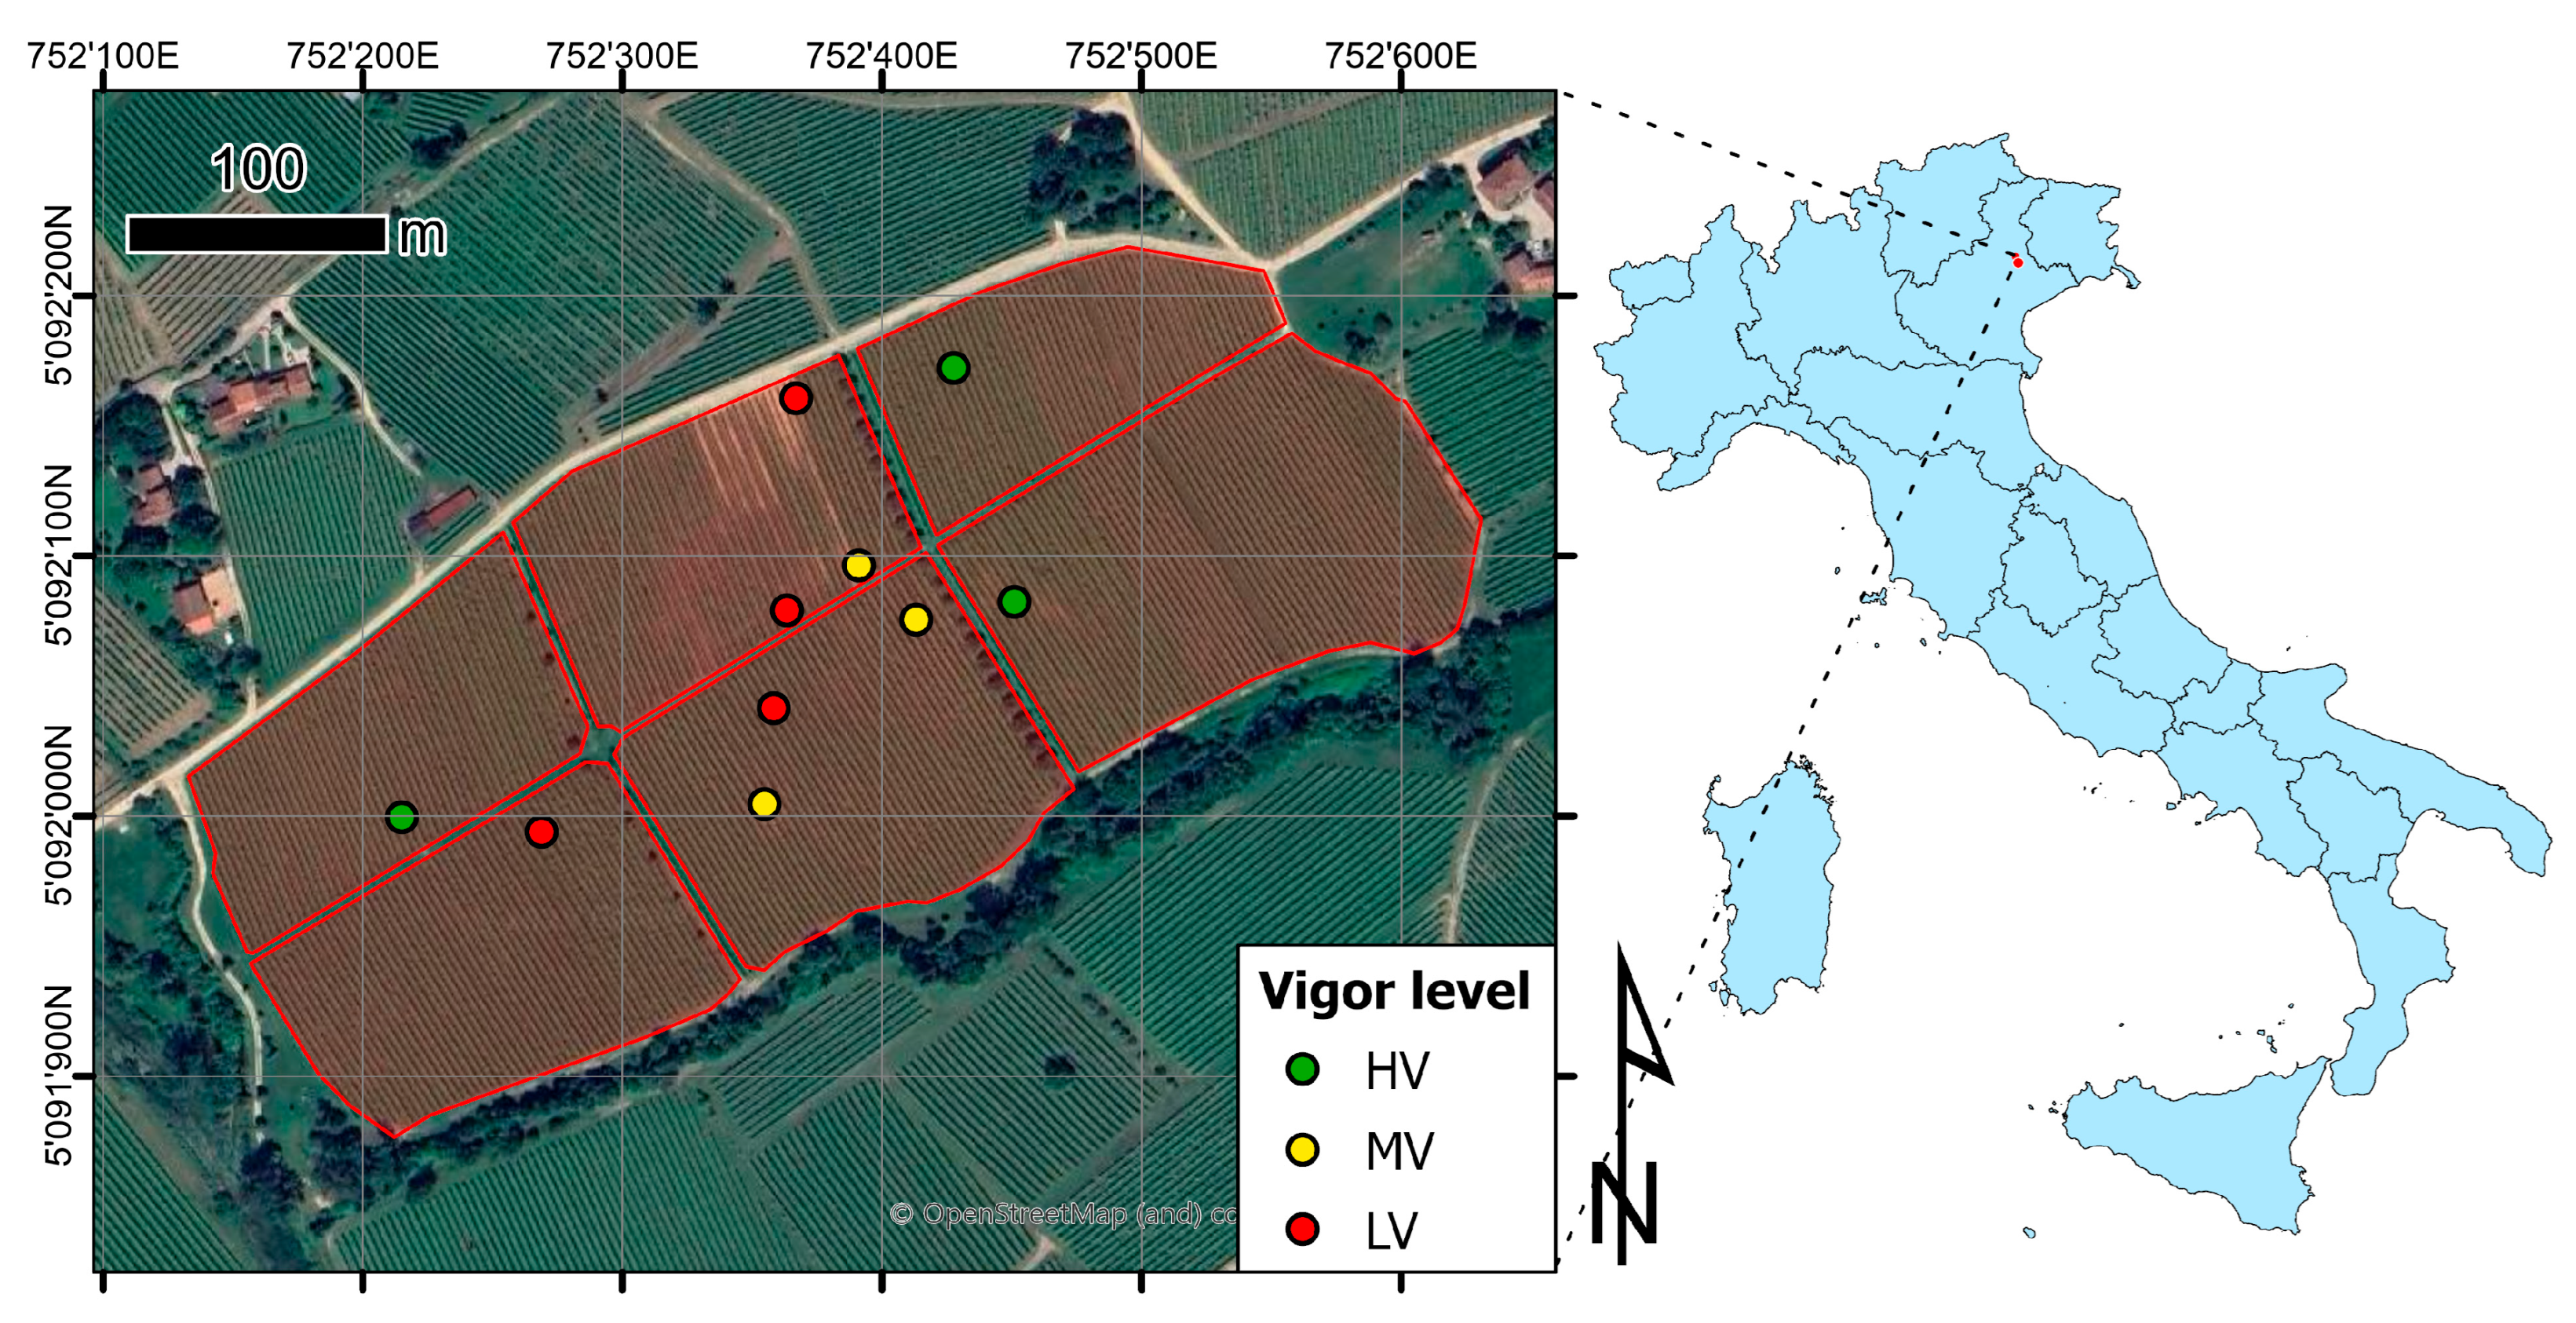
The study was conducted in an 8.5-hectare commercial vineyard block in the Conegliano Valdobbiadene Prosecco DOCG wine region (45.935789° N, 12.255311° E, Vittorio Veneto, Italy—Figure 1). The vineyard, planted in 2011 with Vitis vinifera L. cv. Glera, has 3.0 m row spacing, 1.1 m vine spacing, and a North-West/South-East orientation. Vines were trained to a vertical shoot positioning (VSP) system, specifically the Sylvoz technique. The site has an average slope of 10% with rows planted perpendicular to the slope direction. Field levelling and excavation before planting caused spatial variability in the topsoil. The vineyard is equipped with an underground irrigation system used for emergency irrigation (around 5 days/year).
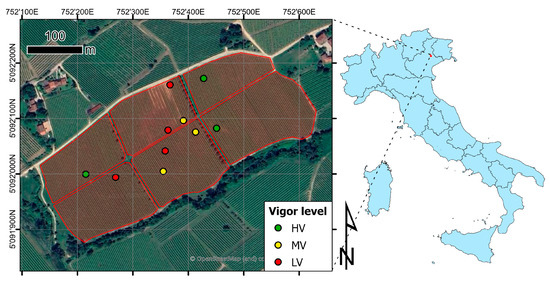
Figure 1.
The vineyard was located in the Northeast of Italy in the Conegliano Valdobbiadene Prosecco DOCG consortium area. Ten sampling point were selected according to NDVI and then classified according to vigour and grape quality.
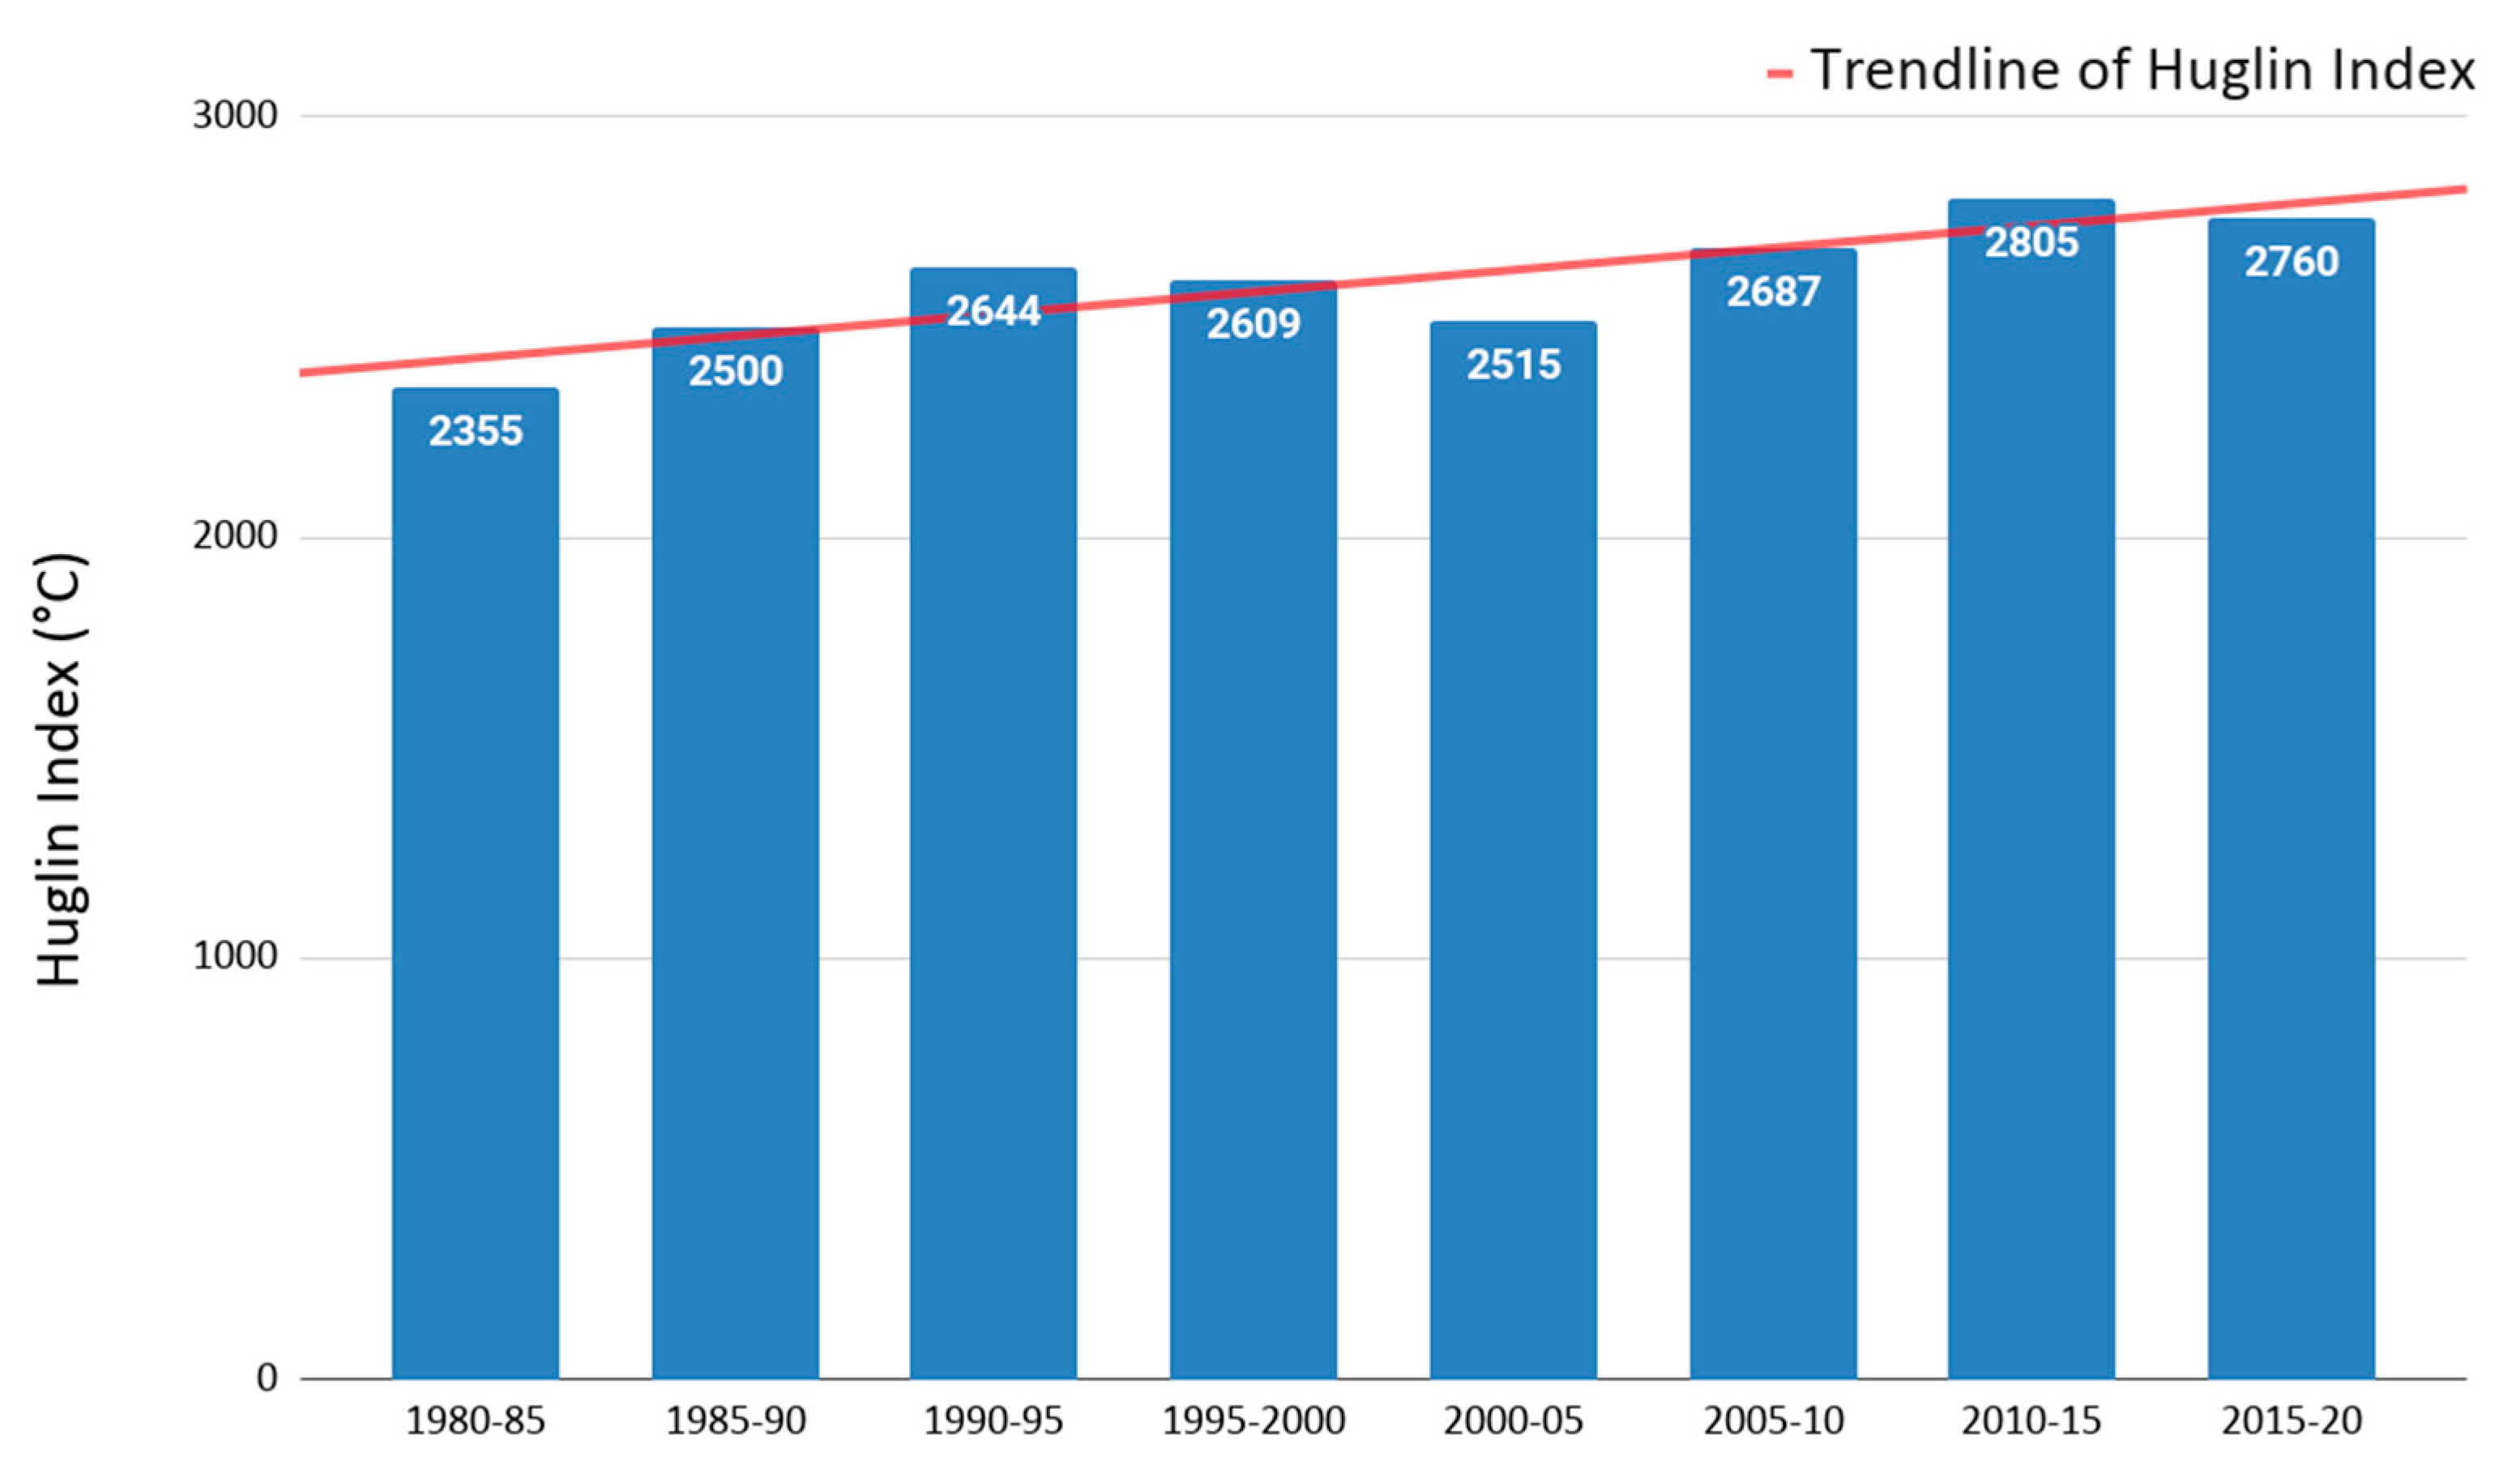
The study area has a humid subtropical climate (Cfa) according to the Köppen and Geiger classification. Weather data from a station near the experimental field for the two vintages are summarised in Table 1. During the growing cycle (April–September), the average temperature was 20.6 °C with an average rainfall of 797.3 mm, both higher than the historical averages for 1980–2018. In addition, the average temperature range, which is an indicator for the grape quality profiles (influencing especially colour, flavour and malic acid respiration) [25], calculated from August to September (veraison to harvest), indicates a higher temperature in the year 2020 than 2019. However, compared with historical data, this data is lower, suggesting that faster ripening of the vines characterises the area compared to the past. The Huglin heat sum index [26] was calculated between 1980 and 2020 (Figure 2). The Huglin Index was 2457 °C in 2020, showing an increase of over 15% compared to 1980. Such an increase identifies the effects of climate change at the field scale and the need for more efficient and sustainable agricultural practices.

Table 1.
Environmental profiles of the vine growth cycles in terms of average temperature, rainfall and average temperature range of the vintages considered in the study in comparison with average long-term data (1980–2018).
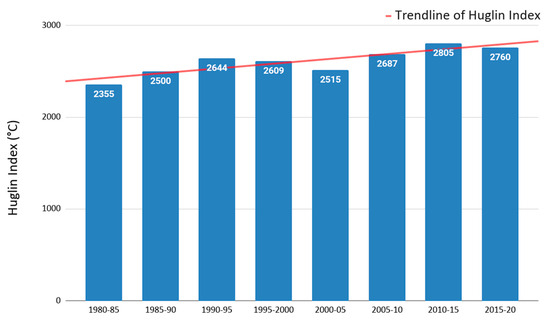
Figure 2.
Five-year average Huglin index of the Conegliano (6.4 km from the study area) meteorological station (45.88132477° N, 12.28232702° E). Over the last 40 years, the Huglin index has increased by more than 15%.
2.2. Fertiliser Management and Experimental Design
The selected block was uniformly managed until the end of the 2019 growing season with a fixed-rate fertiliser regimes of 60 kgN ha−1, 20 kgP ha−1, and 80 kgK ha−1 divided between two fertiliser applications in pre-blooming (BBCH 55) and post-harvest (BBCH 91). At the end of the 2019, a pre-harvest survey was conducted using the GreenSeeker sensor (Trimble Inc., Sunnyvale, CA, USA). This sensor was selected for its robustness, ease of use, and previous successful application in viticultural studies [23]. As an active sensor, it operates independently of ambient light conditions and measures canopy reflectance in the red (656 nm) and near-infrared (774 nm) bands, allowing for the calculation of the NDVI. These wavelengths are well suited for assessing chlorophyll content and canopy structure, making them appropriate for monitoring vine vigour and plant health. NDVI has been widely used in vineyards to estimate spatial variability in parameters such as yield potential, pruning weight, and spatial variability [27,28,29].
Ten sampling points were initially selected based on the spatial distribution of the pre-harvest NDVI map. Samples size was determined according to the Equation (1) [30]:
where n is the sample size assuming sample independence, ςα/2 (1.96) is the value of the standard normal variate for a 95% confidence (α = 0.05), CV is the Coefficient of Variation (9.5% in the present case) of first NDVI survey, and ER is the relative error assumed (6%). This stratified sampling approach ensured that the full range of conditions within the vineyard block was represented, with points deliberately placed across distinct zones (Figure 1). At each point, three vines were manually harvested to collect reference data before implementing VRA. To further characterise the variability among the sampling locations, a k-means clustering analysis [31] was subsequently performed using pre-harvest NDVI values, grape components, total soluble solids (TSS), titratable acidity, and pH measured at harvest. The k-means clustering algorithm, with Euclidean distance as the distance metric, was selected as an unsupervised classification method to group the sampling points into homogeneous vigour classes based on multiple variables (pre-harvest NDVI, yield components, TSS, titratable acidity, and pH). This method was chosen due to its simplicity, interpretability, and suitability for small datasets where distinct groups are expected. This analysis enabled the classification of the ten points into three vigour-based groups: high vigour (HV, 3 points), medium vigour (MV, 3 points), and low vigour (LV, 4 points). This stratification allowed evaluation of VRA effects across different vine performance profiles and grape quality levels. The same sampling points were monitored over two consecutive vintages to ensure consistency in spatial analysis. To assess the effects of vigour class, year, and their interaction, a factorial ANOVA with Tukey HSD was performed to evaluate the intra-variability of the data and among groups. This approach identified the individual and combined influences of temporal and spatial variability factors on yield and grape quality traits.
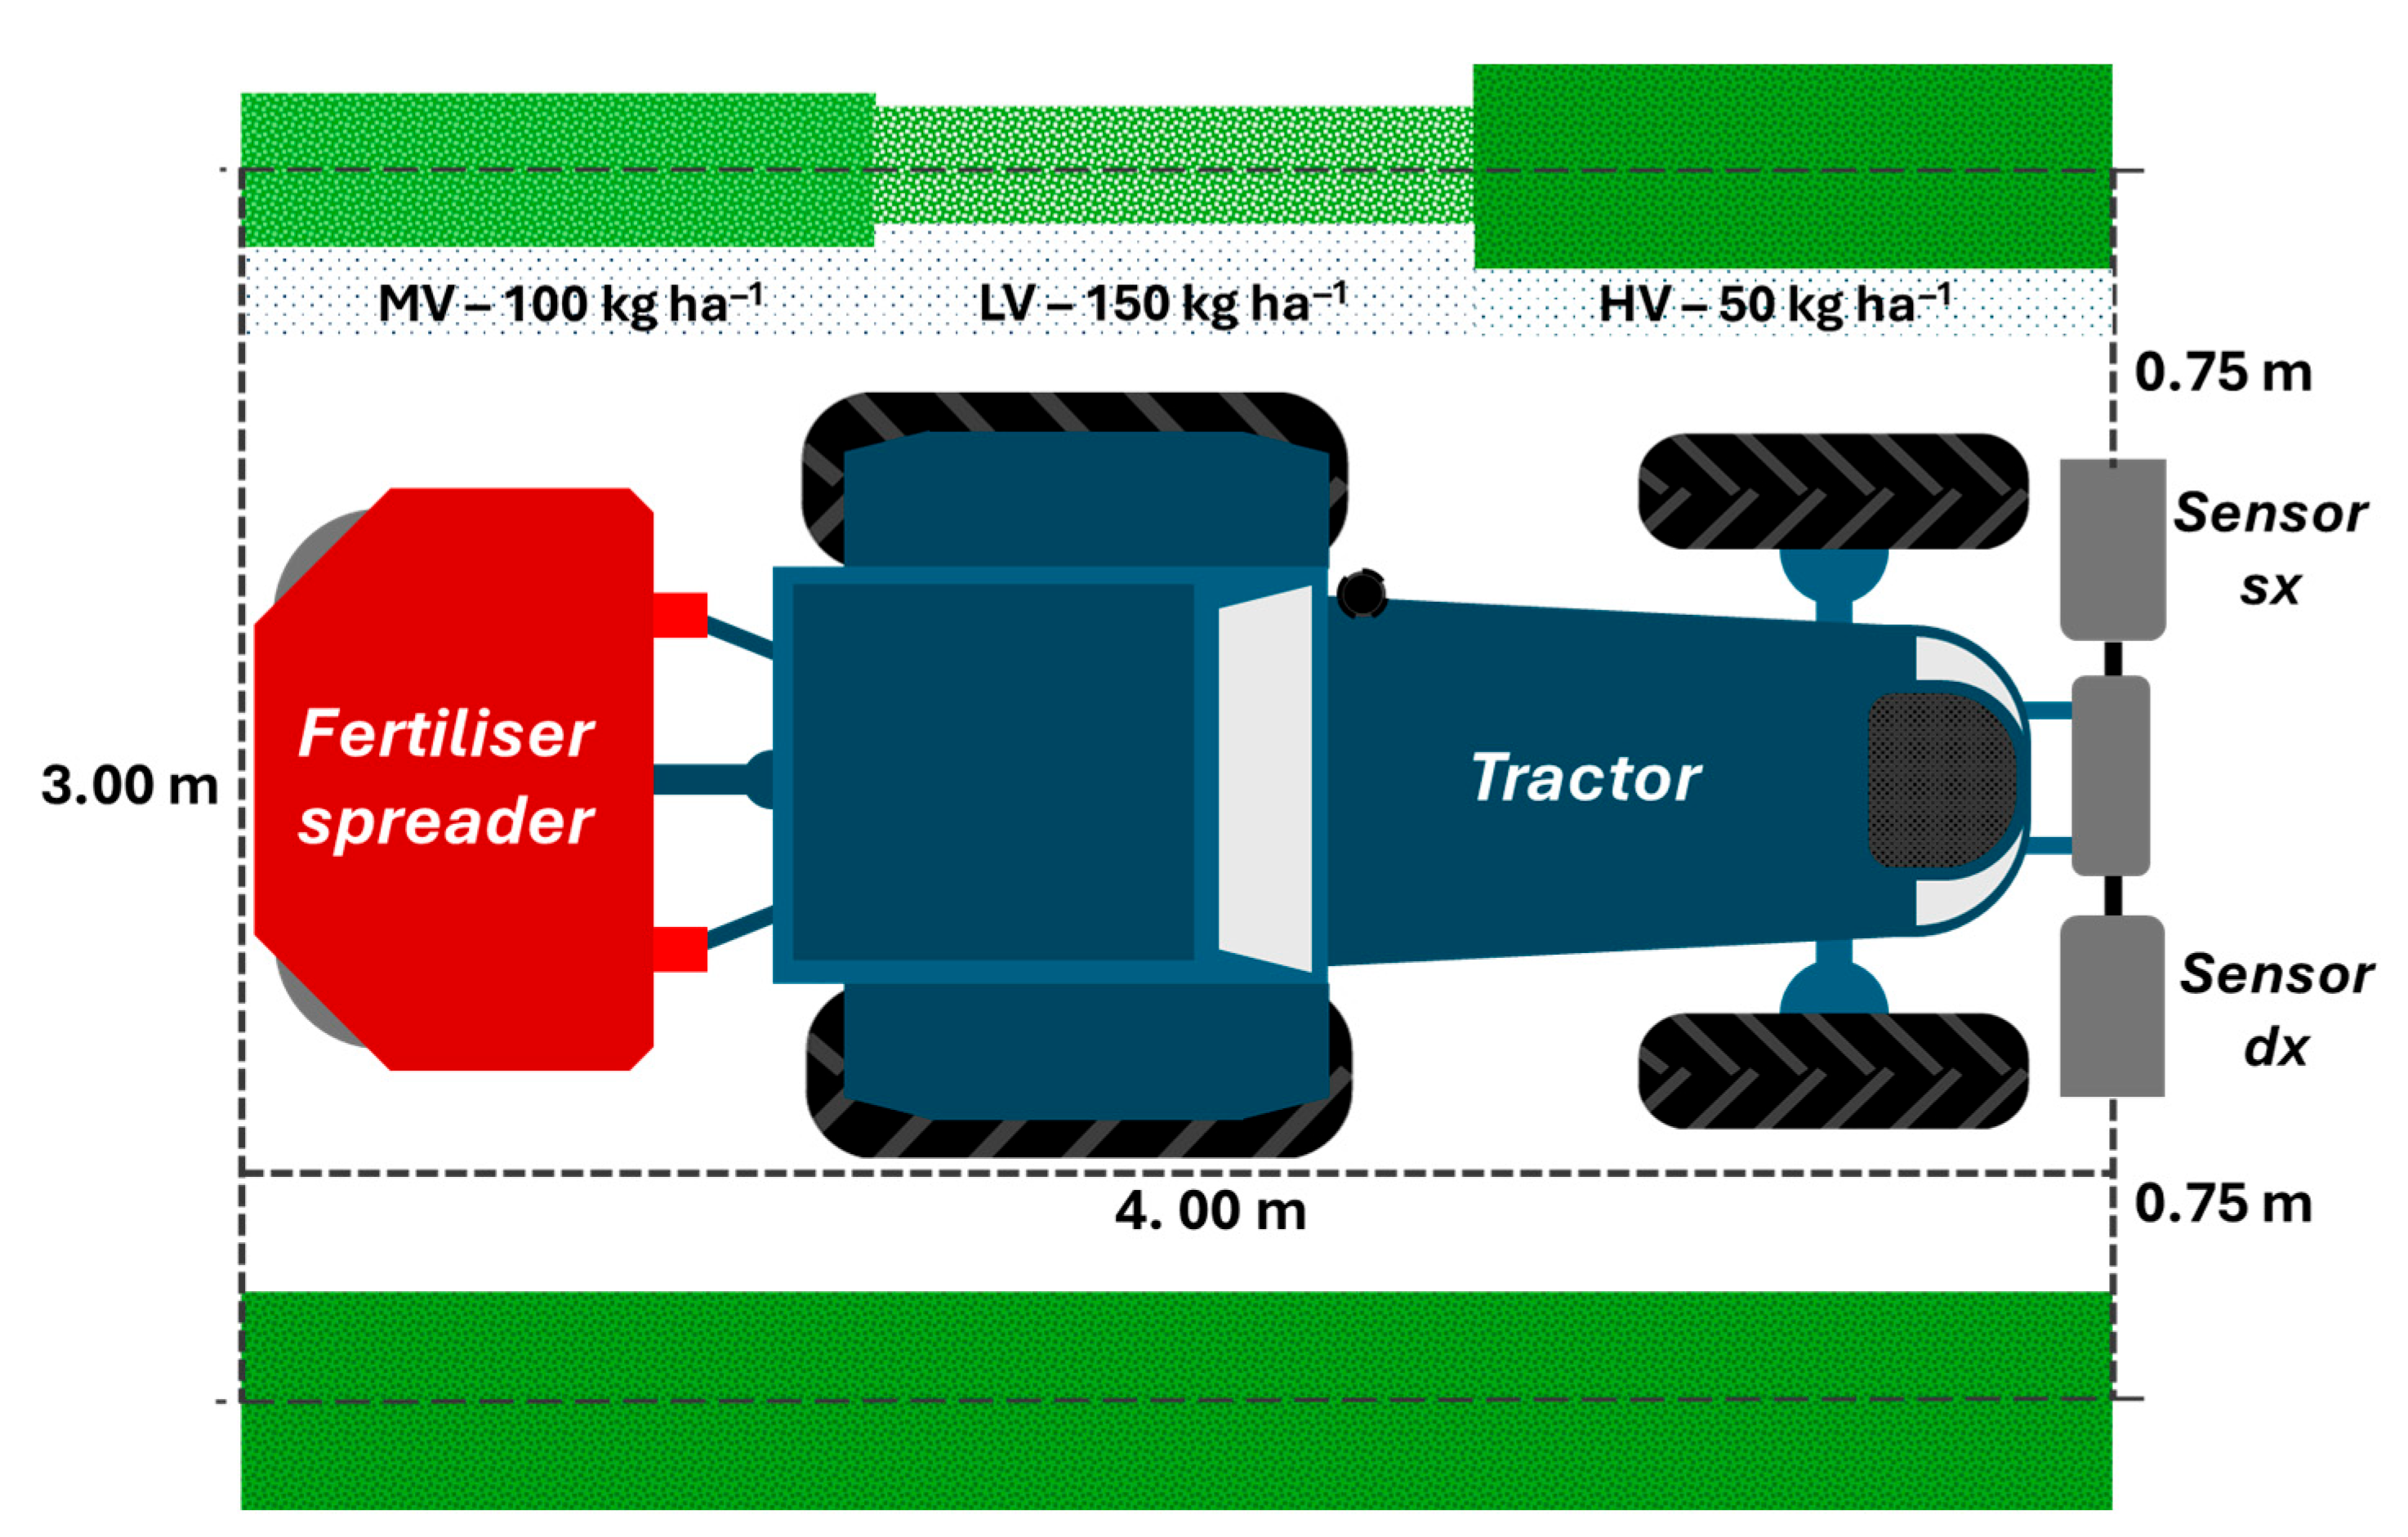
In the 2019 vintage post-harvest fertilization was performed with 30 t ha−1 of manure applied only in low and medium vigour areas (carried out in early 2020). Differently the post-harvest fertilization of 2020 vintage was based on 50–100–150 kg ha−1 of a complex fertiliser applied for HV, MV, and LV, respectively. Pre-blooming fertiliser application was performed using a sensor-driven spreader for 2020 and 2021 vintages, spreading 50–100–150 kg ha−1 of a complex fertiliser for HV, MV, and LV. This approach builds on previous studies that evaluated vegetative responses to differentiated fertiliser inputs [23]. The fertiliser thresholds were determined based on agronomic expertise and calibrated using a portable GreenSeeker sensor, which was employed to assess NDVI values representative of each vigour class. The fertiliser applications were carried out with a New Holland T4.110F tractor (CNH Industrial N.V., Amsterdam, The Netherlands) and a Kuhn MDS 12.1 Q fertiliser spreader (Kuhn SAS, Severe, France). The installation layout is illustrated in Figure 3. The sensors were mounted on a front frame at approximately 1.5 m above ground, oriented toward the upper portion of the canopy, specifically targeting the distal part of the growing shoots. This configuration increased the sensitivity of NDVI measurements to vigour differences, as shoot tips are highly responsive to growth conditions and nutrient availability, providing a more accurate assessment of spatial variability within the vineyard. Table 2 summarises sensor surveys and fertiliser application during the study.
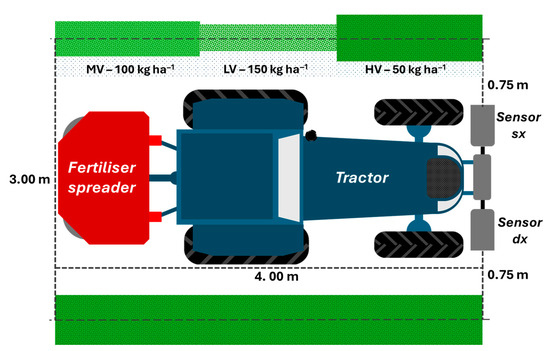
Figure 3.
Schematic representation of the sensor–tractor–spreader configuration, including the spatial offset.

Table 2.
Timesheet of surveys and fertiliser application.
Real-Time (On-the-Go) Variable-Rate Fertiliser Application Procedure
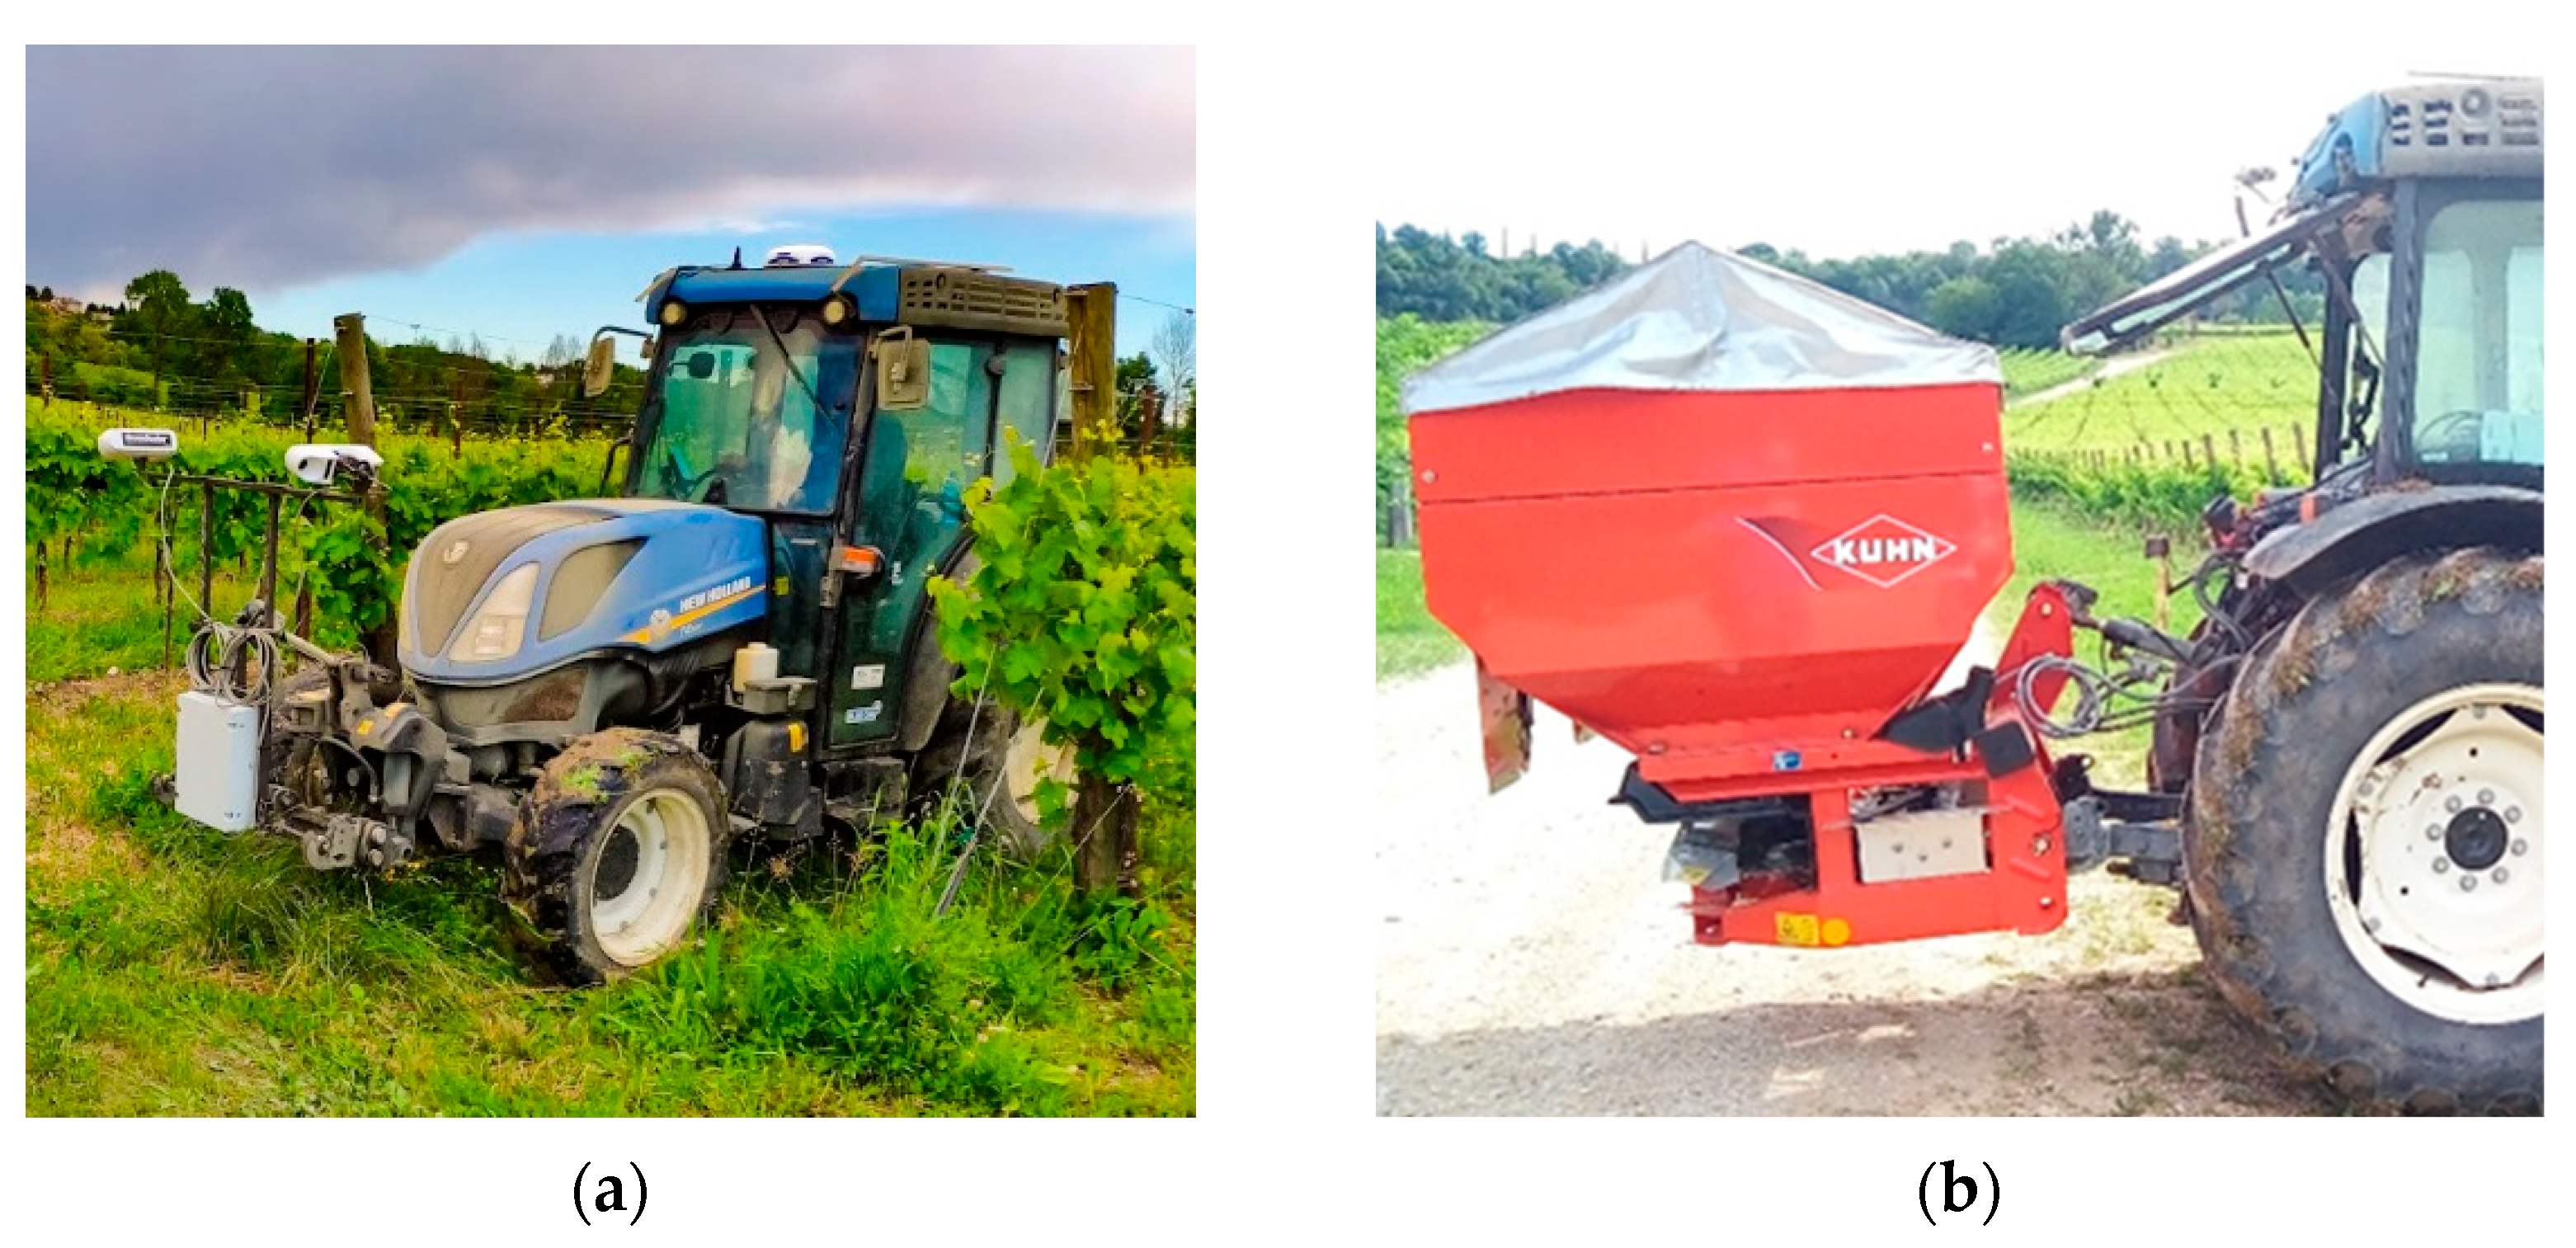
Two GreenSeeker sensors were mounted on a metal chassis in front of the tractor, while the rear linkage carried the fertiliser spreader (Figure 4). Both sensors and spreader were equipped with their respective control units, which were wired with a display located in the tractor cab (FM1000, Trimble Inc.). First, the relationship between the NDVI value and the fertiliser rate was manually defined based on the NDVI values measured beforehand in the 10 sampling points with different vigour levels. Then, the average NDVI values for each vigour zone (HV, MV, and LV) were entered into the display in the tractor cab, along with the corresponding levels of fertiliser (50–100–150 kg ha−1, respectively). Finally, the amount of fertiliser was chosen to rebalance the vine vigour, according to the methodology of Sozzi et al., 2020 [23].
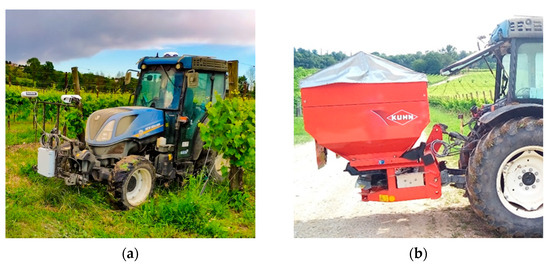
Figure 4.
Working configuration during the fertiliser application: (a) The GreenSeeker sensor system; (b) The fertiliser spreader.
2.3. Yield Components and Grape Composition
At each of the 10 sampling points, three vines were manually harvested at ripening stage in both 2019 and 2020. Grapes were weighted to obtain the average yield per vine. Juice was then extracted using a manual grape crusher and analysed for the main quality components. The TSS were quantified with a digital refractometer (PR-32, ATAGO Co., Ltd., Tokyo, Japan) and expressed in Brix (°Bx); in the same samples, the titratable acidity was measured using an automatic titrator (Crison micro TT 2022, Danaher Corporation, Washington, DC, USA) using 1N sodium hydroxide reagent (Honeywell International, Inc., Morristown, NJ, USA). Finally, the pH was measured with a FlushTrode P/N 238060/80 probe (Hamilton, Reno, NV, USA).
2.4. Statistical Analysis
As previously described data collected in 10 sampling points were analysed with a factorial ANOVA followed by Tukey HSD post-hoc test to evaluate intra-group and inter-group variability. Analyses were performed using the R software [31] and Python (version 3.12.11) packages (Pandas and Statmodels). The analysis included yield components (yield per plant, number of clusters per plant, and cluster weight), grape composition (TSS, titratable acidity, and pH), and pre-harvest NDVI. The CV was calculated for yield components, grape composition parameters, and NDVI for both 2019 and 2020. Geostatistical analysis was employed to evaluate how vine vigour was spatially distributed across the vineyard and to determine whether the variable-rate fertilisation produced measurable changes in this distribution. Unlike classical statistics, which assume independence between data points, geostatistics considers the spatial position of each measurement and quantifies the degree of correlation between neighbouring observations. NDVI from each of the four surveys (Table 2) was used to define the experimental variogram, from which the nugget, sill, and range were extracted. The sill describes the maximum variance achieved by the NDVI at a specific distance (the range), while the nugget describes the variance at zero distance, summarising unstructured variation [32]. These parameters were used to calculate indices that describe the spatial structure of the given variables. Experimental variograms were calculated using R software (version 4.3.0), with the autofitVariogram function of the Automap package and spherical models.
Data extracted from the NDVI experimental variogram were used to calculate the Nugget Effect Index (NE) [33] according to Equation (2) and the Mean Correlation Distance (MCD) [34] according to Equation (3). These indices were then used to compare spatial variability after the VRA in 2019 and 2020.
According to Cambardella and Karlen [35], NE indicates how the data are spatially arranged. Specifically, a NE < 25% describes a strong spatial dependence and small erratic variance; a NE between 25% and 75% describes a moderate spatial dependence, while a NE < 75% stands for random spatial distribution. MCD estimates at which distance NDVI and spatially structured factors (e.g., soil) are highly related while accounting for the nugget variability.
3. Results
3.1. Yield Components and Grape Composition Results
Data from the 10 sampling points examined in the two experimental years were clustered into three groups to define homogeneous zones representing three classes of vine vigour. Yield components and grape quality parameters for these classes are reported in Table 3a,b, respectively.

Table 3.
(a) Average yield components classified in three different zones and statistical grouping. (b) Average grape composition classified in three different zones and statistical grouping.
Across the two vintages, average yield per plant did not significantly differ between years (p = 0.802), indicating a stable overall production across seasons (Table 3a). However, significant variations were observed in both the number of clusters per plant and the average cluster weight. In 2019, vines produced about twice as many cluster as in 2020 (p < 0.01), while in 2020 the reduced cluster number was compensated by a significantly higher cluster weight (p < 0.01). A significant vigour × year interaction was also detected for cluster number (p = 0.019; ω2 = 0.840), suggesting that the influence of vigour on reproductive output varied between years. Grape composition (TSS, titratable acidity, pH) did not exhibit significant differences between vintages, indicating a stable grape composition profile despite inter-annual variation in yield components (Table 3b).
Yield per plant increased progressively with vigour class (p < 0.001; ω2 = 0.714), with Tukey HSD identifying statistically distinct groups for each vigour level. Average cluster weight also increased with vigour (p = 0.0002; ω2 = 0.832), and the number of clusters per plant showed a significant main effect of vigour (p = 0.032). For the number of clusters per plant, Tukey HSD detected significant differences among vigour classes only in 2019 vintage. Regarding grape composition, TSS was significantly lower in high-vigour zones compared to low-vigour zones (p = 0.0005; ω2 = 0.551), with Tukey HSD confirming a significant difference between Low and High vigour classes. Titratable acidity (p = 0.0011; ω2 = 0.556) and pH (p = 0.0015; ω2 = 0.391) were also affected by vigour, although the effect sizes were lower than other variables. In both titratable acidity and pH, Tukey HSD indicated significant differences between Low and High vigour classes in 2019, but no significant differences among vigour classes were detected in 2020.
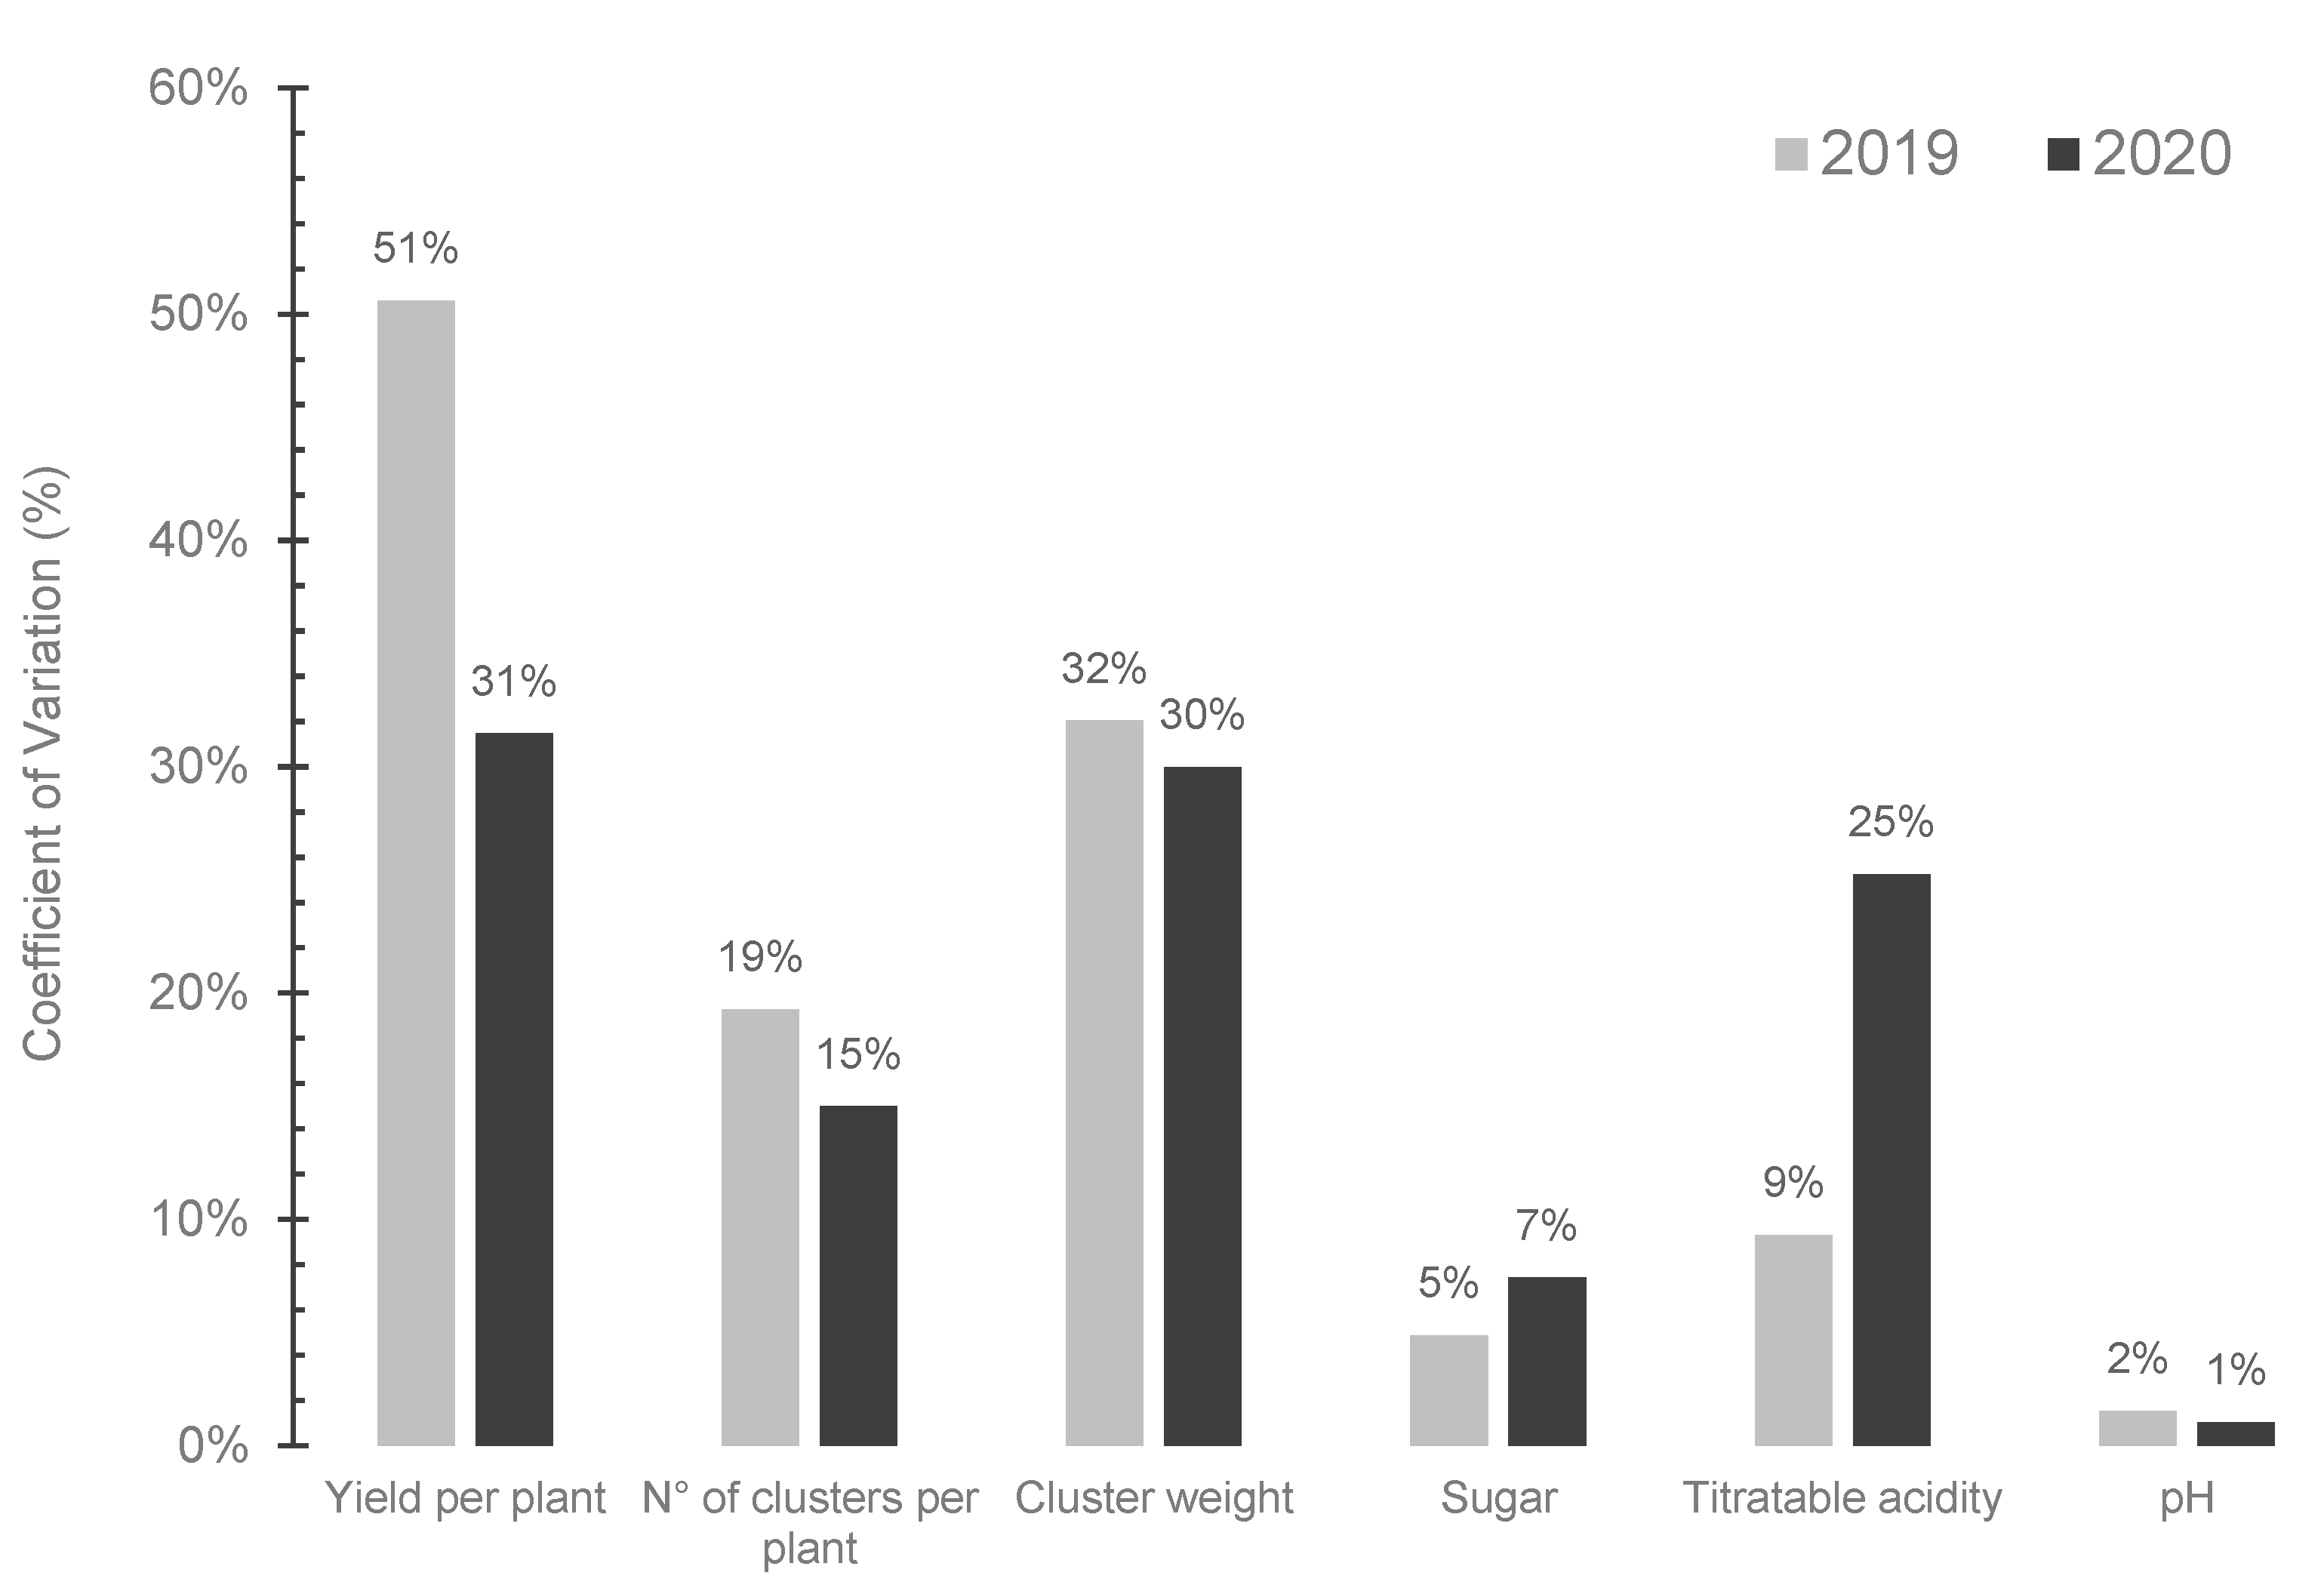
Spatial variability, assessed via CV, showed reductions for yield per plant (−39.2%), cluster number (−21.1%), cluster weight (−6.25%), and pH (−50.0%). In contrast, CV increased for TSS (+40%) and titratable acidity (+177%). Although mean values remained stables, these increases indicate greater dispersion of grape composition parameters within the vineyard, particularly for acidity (Figure 5).
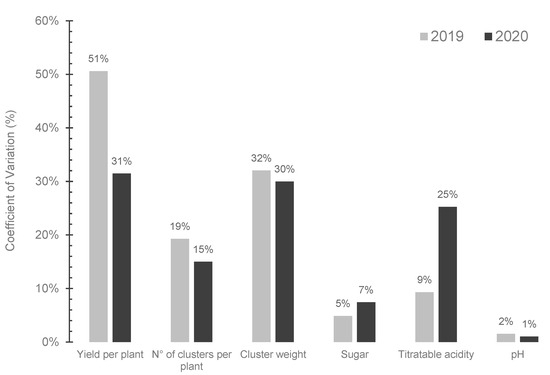
Figure 5.
Comparison between Coefficient Variation for yield components and grape composition in the 2019 and 2020 vintages.
3.2. Spatial Structure Analysis of NDVI
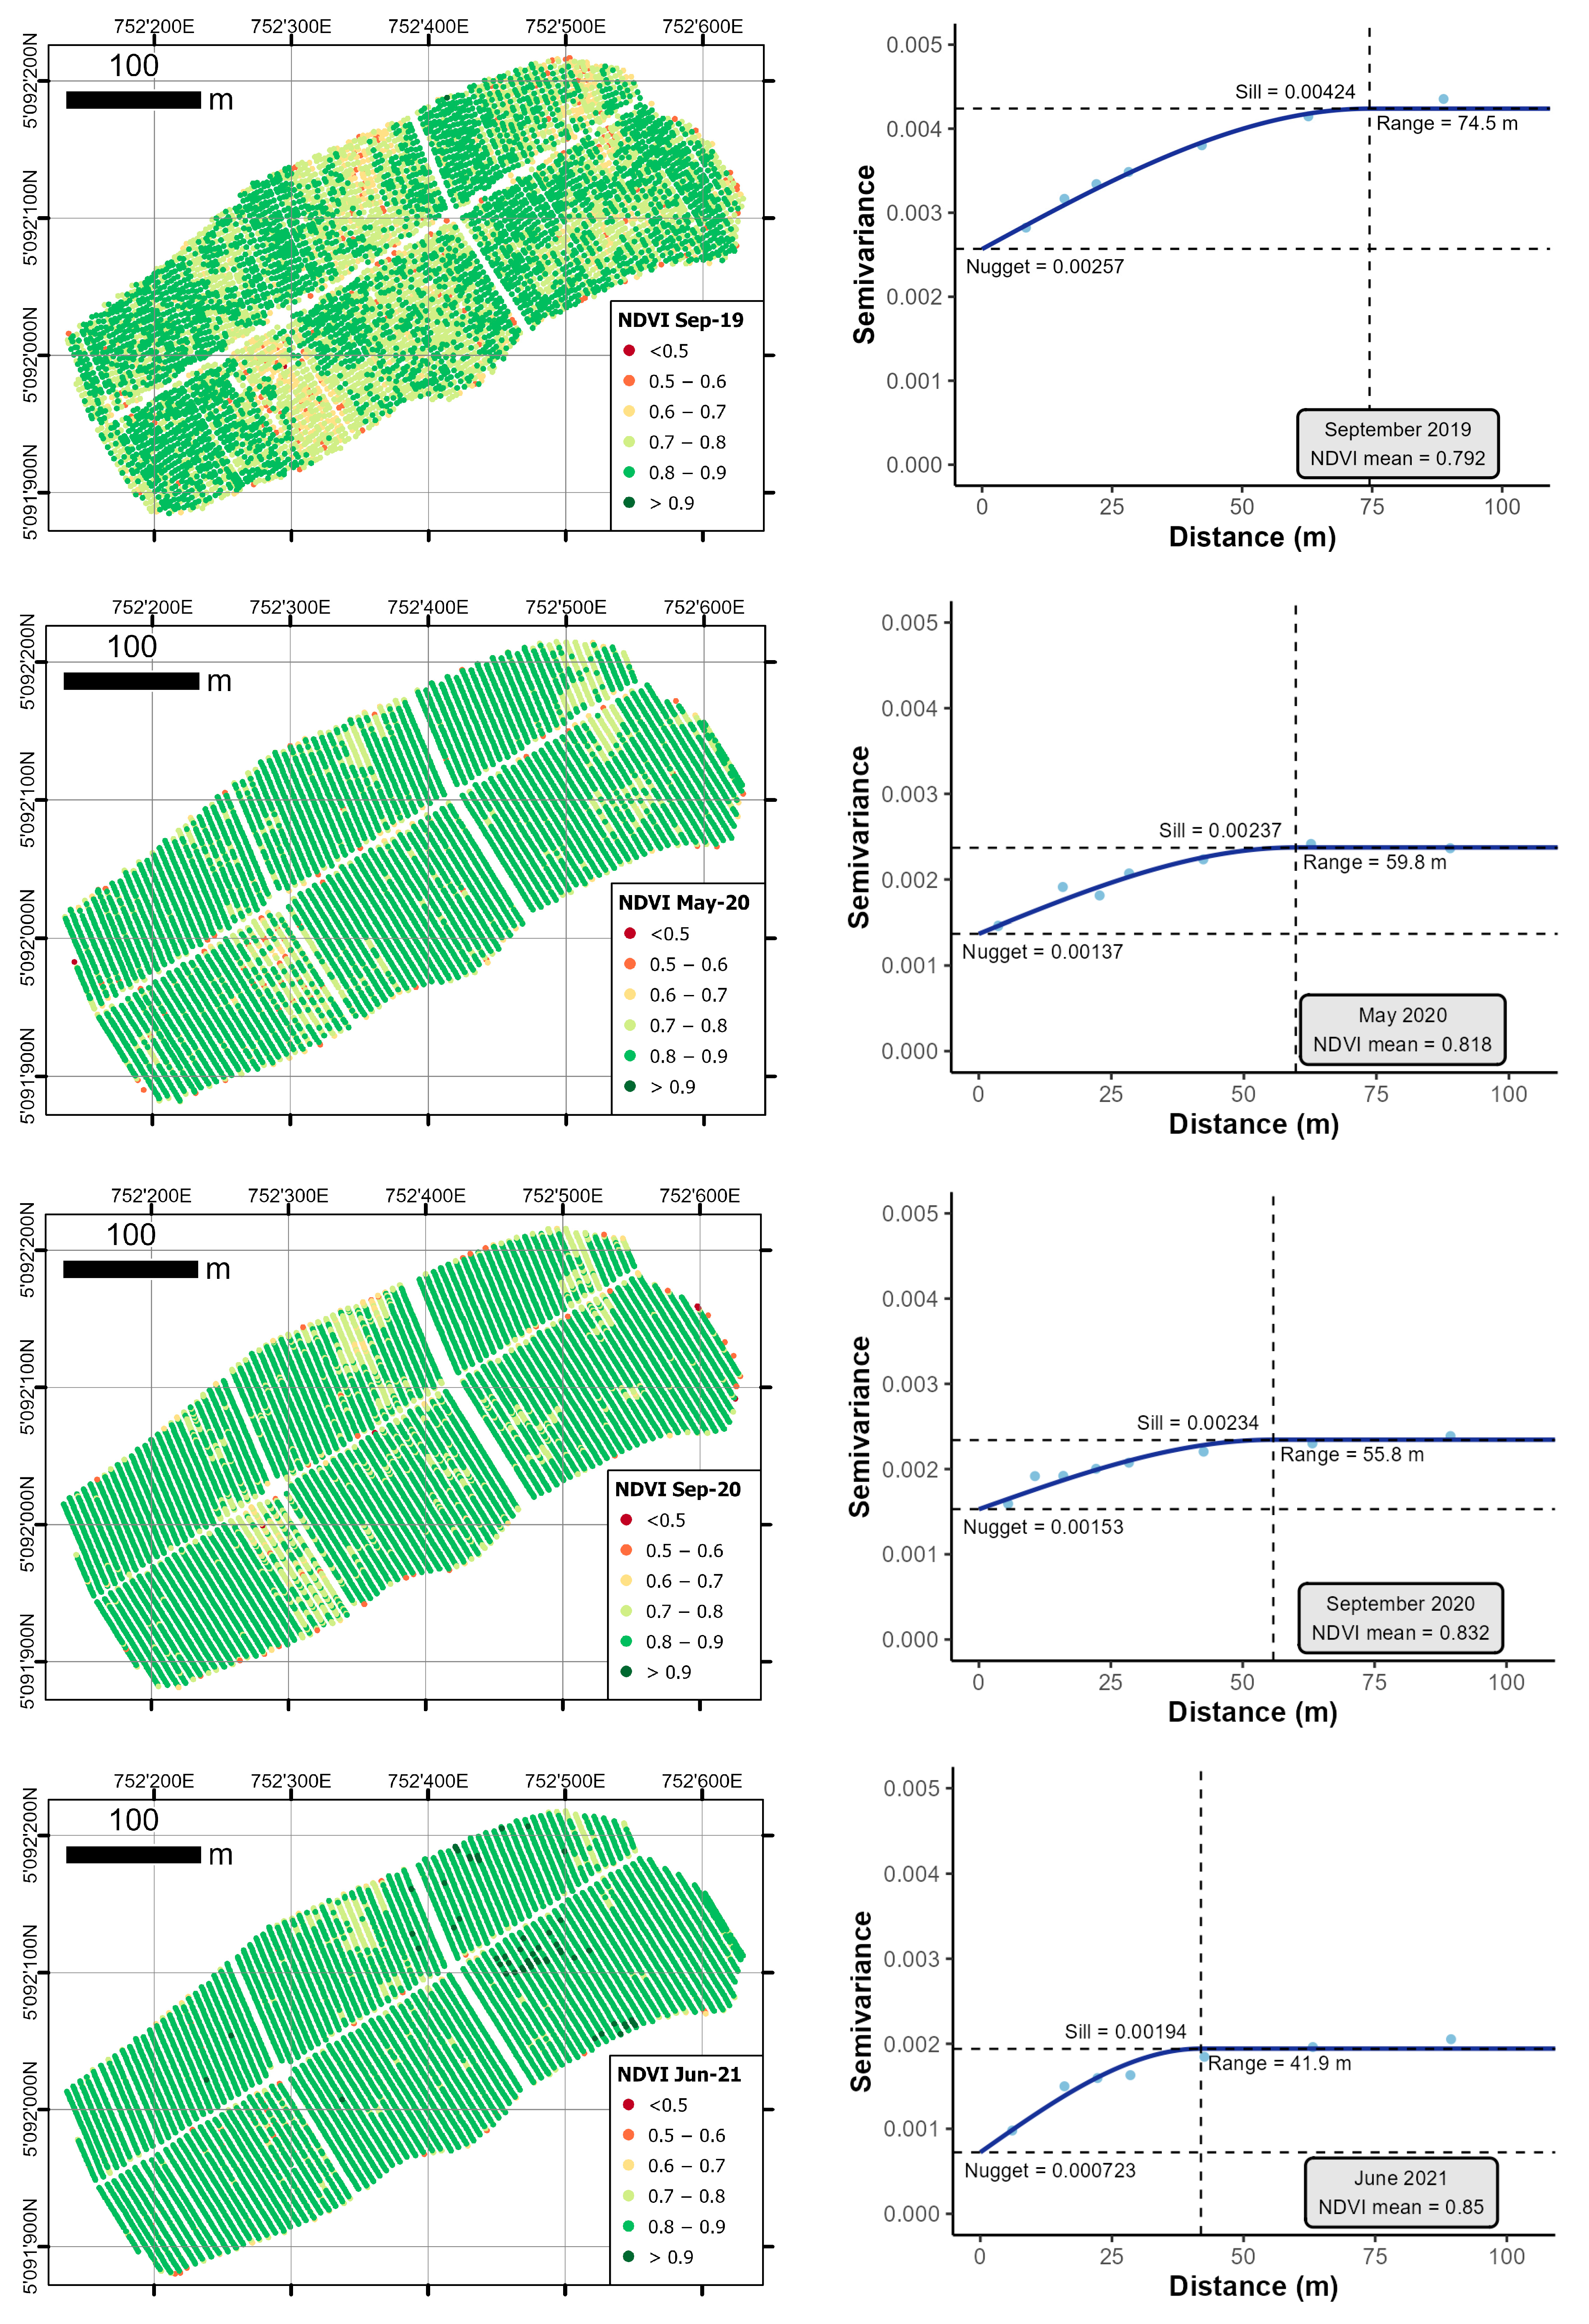
Experimental variograms obtained from the four NDVI surveys were analysed in nugget, sill, range, NE, MCD, and CV. NDVI maps and semi-variograms for each survey are shown in Figure 6. The mean NDVI value increased from 0.78 in September 2019 to 0.85 in June 2021. As shown in the maps in Figure 6, this increase in NDVI is primarily due to the reduction in points with low NDVI values.
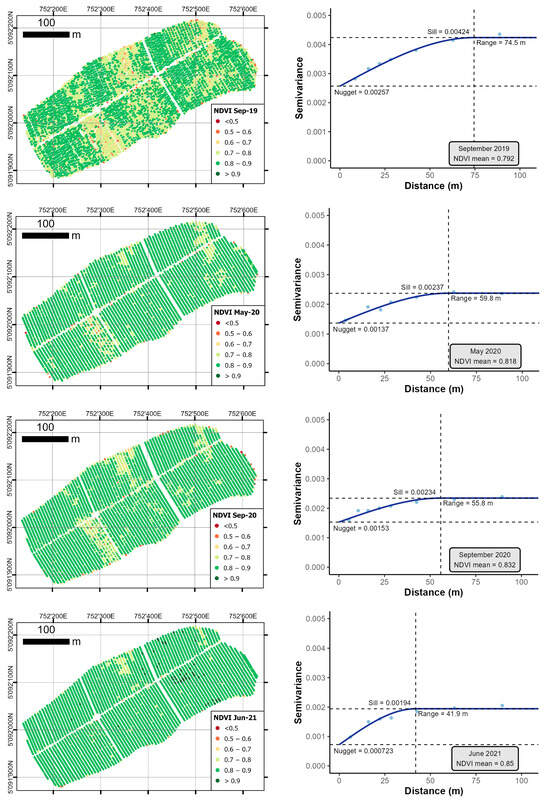
Figure 6.
On the right side, the NDVI maps for each survey are shown. On the left is the corresponding semi-variogram. The NDVI colour ramp remains constant within each map to highlight differences.
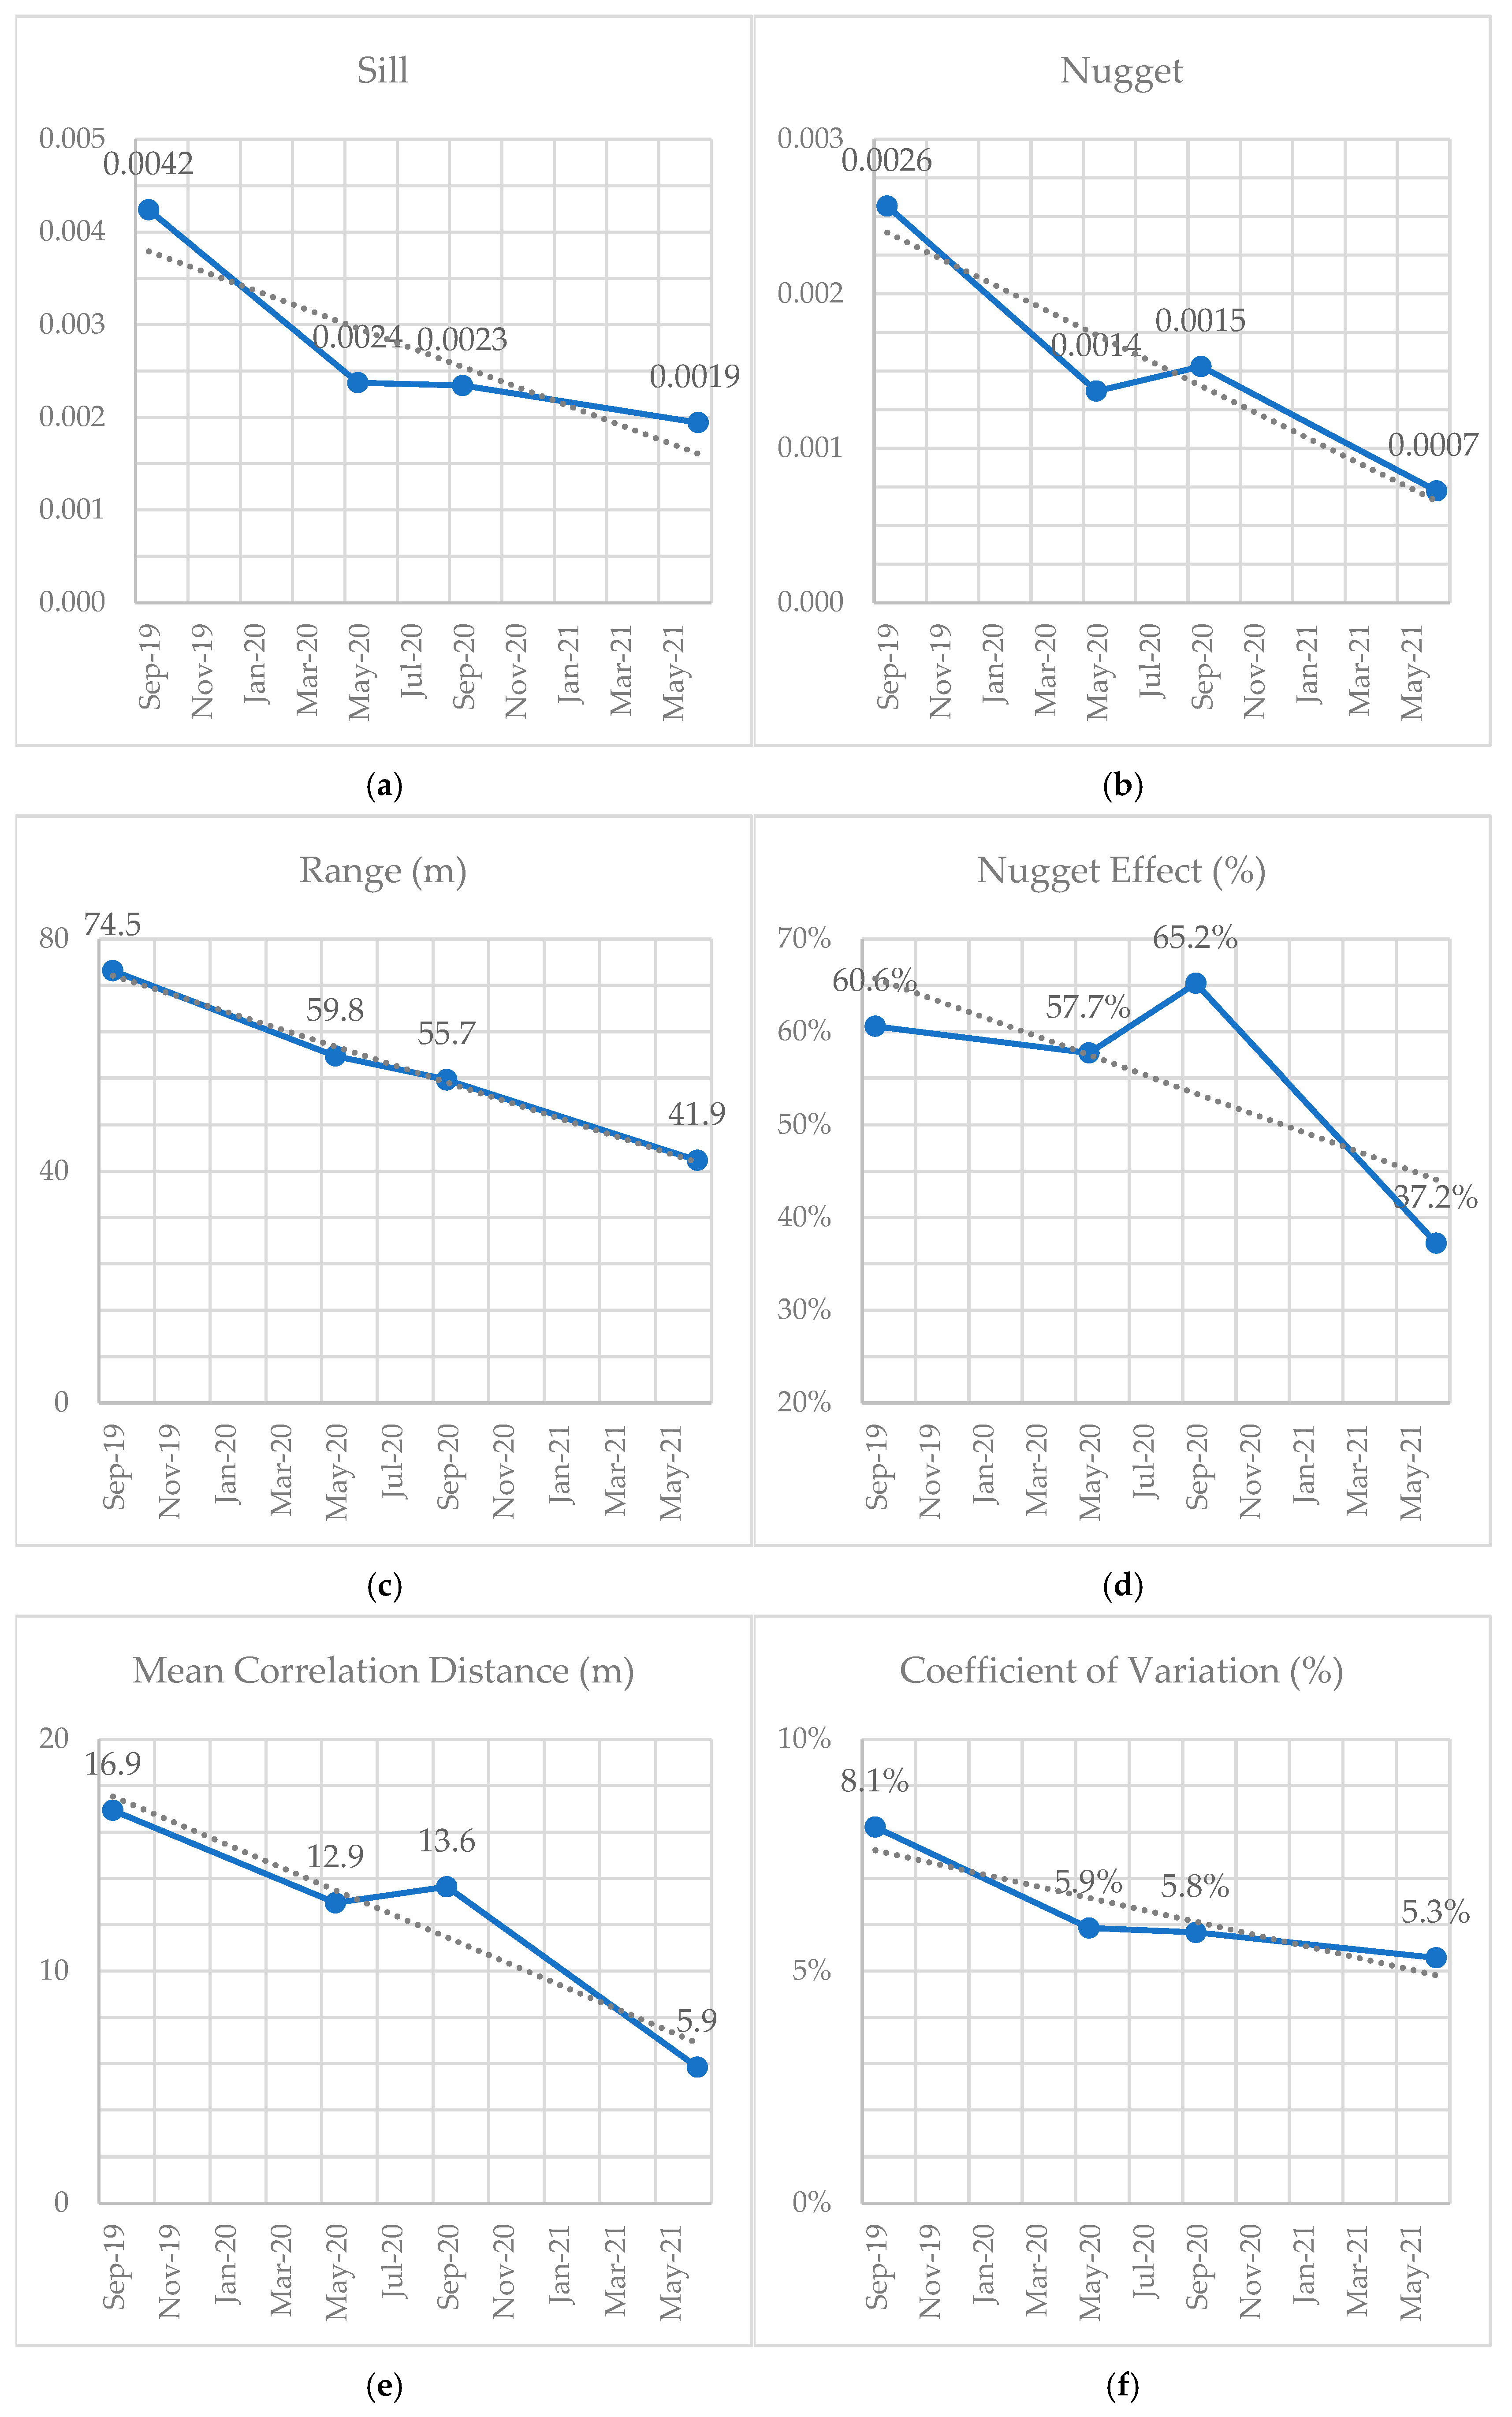
The maximum variability of the NDVI data is summarised as semi-variance in the sill graph (Figure 7a). The sill decreased from 0.0042 to 0.0019, with the highest step between September 2019 and May 2020. Similarly, the nugget and the range (Figure 7b,c) showed an overall reduction at the same time. The NE (Figure 7d) exhibited a general decrease, with a notable peak observed in September 2020, characterised by a higher nugget value and a similar sill. The MCD index, which compares the range to the NE, showed a linear reduction from 16.9 m to 5.9 m. Finally, the CV of the NDVI decreased from 8.1% to 5.9% between September 2019 and May 2020, and then it remained mainly stable at around 5%.
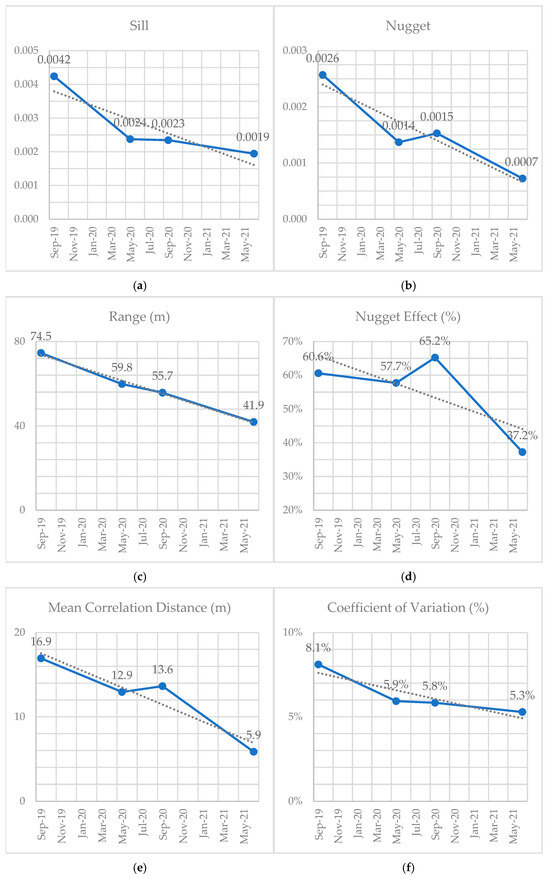
Figure 7.
Variation along the four NDVI surveys of Sill (a), Nugget (b), Range (c), Nugget Effect (d), Mean Correlation Distance (e) and Coefficient of Variation (f).
4. Discussion
The implementation of real-time (on-the-go) VRA in a block with high spatial variability affected yield components, grape composition, vigour spatial variability and system performance. The real-time VRA system used in this study represents a practical advancement over traditional prescription-based approaches, particularly in small-scale viticulture where resource limitations reduce the adoption of precision agriculture systems.
Geostatistical analysis confirmed the efficacy of the VRA application in reducing spatial variability: total variance (sill) decreased by 54.7%, random variability (nugget) by 73.1%, and the nugget-to-sill ratio (NE) by 38.6%. The Mean Correlation Distance (MCD) also decreased by 65.1%, indicating better spatial structure and autocorrelation in vine vigour following VRA application. The system responded to fine-scale variability, applying fertiliser at a resolution of about 1.82 m (small groups of vines). Similar results were found by Gatti et al. [36] using satellite NDVI and proximal sensing, with a reduction in CV from 8.20% to 1.42% after the introduction of VRA.
The results related to introduction of VRA methodology suggest both economic and environmental benefits. Nitrogen input was reduced from 60 kg N ha−1 to 30 kg N ha−1. These results were obtained because the amount of HV vines increased after every fertiliser application, as a higher amount of fertiliser was spread to MV and LV. Based on the nitrogen content of the fertiliser (15%) and an average market price of €0.275 per kg [37], this led to an estimated saving of €55 ha−1. Environmentally, this reduction in input translates to a decrease of approximately 302 kg CO2-equivalent per hectare, using an emission factor of 1.51 kg CO2-eq per kg of NPK fertiliser applied [38]. These results are comparable to those obtained by Balafoutis et al. [39], who stated that the introduction of precision viticulture leads to a 28.3% reduction in product carbon footprint, with fertilisers contributing 27.6% to this decrease. The reduction in spatial variability, fertiliser use, and CO2 emissions was achieved through a “Robin Hood” distribution strategy, directing more fertiliser to low-vigour zones to promote more uniform vine development. This approach contrasts with the “King’s approach”, where fertiliser is preferentially applied to high-vigour zones. The “Robin Hood” strategy is particularly advantageous in contexts where high-vigour areas already benefit from inherently fertile soils, while low-vigour zones face growth limitations due to factors such as poor soil structure [40].
Comparable findings were reported by Gatti et al. [41], where soil heterogeneity and vine vigour gradients were shown to drive dry matter and nutrient partitioning. In that study, while total biomass and yield were lower in low-vigour zones, organ-level nutrient concentrations remained relatively stable, indicating consistent sink strength. These observations align with the present results, where the targeted fertiliser application based on NDVI contributed to improved spatial homogeneity in vine development without negatively affecting physiological function. Unlike static prescription maps, which may generalise heterogeneous conditions into broad management zones, the real-time VRA system evaluated in this study enabled immediate, localised adjustment of fertiliser rates based on plant status (as confirmed by the reduction of range and MCD). This approach, preserved small-scale spatial nuances and allowed for targeted input management, supporting both agronomic and environmental objectives.
Vine vigour and its spatio-temporal variability are influenced by trellis system and pruning methods. Training systems differ in bud selection, especially when vines are hand pruned [42]. In spur pruning system, the number of buds can change slightly from year to year, while in the cane pruning system, hand-pruned, the number of buds can be adjusted according to vine vigour to preserve grape quality. Consequently, spur-pruned vineyard vine vigour is stable during years [43]. The block described in this study is characterised by Sylvoz trellis, where the number of buds chosen during hand pruning is limited. According to this, the results of this study suggest that the reduction of vine vigour variability was mainly due to the introduction of VRA.
Although the primary aim of the study was to assess variability reduction, the analysis of yield components and grape composition offered further insights into the effects of vine vigour and vintage. Yield per plant did not significantly differ between vintages. Glera cv. exhibited adaptive plasticity, maintaining stable yields through modulation of cluster size and number. Grape composition remained consistent across vintages but was significantly influenced by vigour. High-vigour zones exhibited greater yields but lower TSS, as confirmed by Tukey HSD comparisons. This supports the hypothesis that increased vegetative growth and crop load dilute sugar accumulation and delay ripening. In contrast, low-vigour zones produced fewer, smaller clusters with higher TSS. For base wines intended for traditional method sparkling, lower TSS coupled with higher acidity, as observed in HV zones, can be advantageous to preserve freshness. Conversely, LV zones with higher TSS may suit styles or cuvées targeting riper fruit expression. However, the TSS discrepancy between vigour classes highlights a limitation of VRA: while it reduced variability in yield components, it may not have homogenised grape quality traits. This pattern may reflect the study’s limited time frame and warrants multi-year verification. Coefficients of variation (CV) for TSS and acidity increased by 40% and 177%, respectively, between the two vintages. This suggests the need for integrated canopy management practices (e.g., shoot thinning, leaf removal, or regulated deficit irrigation) to complement fertilisation strategies. Such integrated approaches could help optimise the balance between yield and grape composition. The limited number of experimental units per group may have contributed to a more pronounced partitioning of variance among factors, potentially inflating effect size estimates (ω2). This likely reflects inter-annual climatic variation, emphasising the need for multi-year protocols. Future implementations of VRA should incorporate climatic data and additional vine performance metrics to refine fertilisation thresholds over time.
Given the hilly morphology and slope-vineyard configuration typical of the Conegliano-Valdobbiadene area, the observed high spatial dependence of vine vigour can be largely attributed to topographic influences [44]. In these landscapes, slope and exposure strongly affect soil depth, drainage, and thermal microclimate factors that shape plant performance and contribute to persistent vigour gradients across the block. Precision viticulture strategies designed for such landscapes should therefore account for these terrain attributes to maximise effectiveness.
Limitations and Future Research
This study demonstrated the potential of real-time, sensor-based VRA to reduce spatial variability in vine vigour and yield components in a hilly vineyard context. However, some limitations must be acknowledged.
First, the limited number of sampling points (n = 10) limited the statistical power of some analyses and may have amplified effect size estimates. Although the sampling design was stratified based on NDVI zones and maintained consistently across two vintages, increasing the number of monitored sites would improve the resolution and robustness of spatial trend assessments. Second, the study focused primarily on vegetative parameters and basic grape composition metrics (TSS, titratable acidity, and pH). Other quality-related traits, such as phenolic content or aromatic precursors, were not measured and could provide a more comprehensive view of VRA impacts on wine potential.
Furthermore, no soil analyses or direct measurements of microbial activity, organic matter, or water use efficiency were included. These factors are critical for evaluating the broader agronomic and environmental sustainability of VRA strategies and should be integrated in future work. Although a reduction in nitrogen input was observed, the absence of leaching or residual soil nitrogen data limits the ability to assess nutrient-use efficiency and potential environmental trade-offs.
Future studies should test multi-year VRA applications under variable climatic conditions, incorporating adaptive fertiliser thresholds and additional management practices such as canopy control or irrigation. The integration of topographic data, soil electrical conductivity, and high-resolution imagery (e.g., UAV or multispectral satellite data) may further improve site-specific recommendations and system responsiveness. Finally, the inclusion of economic performance indicators, such as labour efficiency, return on investment, and long-term yield stability, would support the broader adoption of real-time precision fertilisation in small-scale vineyards.
5. Conclusions
Spatial variability in vine vigour and yield components remains a major challenge in hilly vineyards, particularly in premium wine regions such as the Conegliano Valdobbiadene Prosecco DOCG. This study showed that real-time (on-the-go), NDVI-based VRA of fertiliser can effectively mitigate within-field variability. The proposed approach led to a significant reduction in both total spatial variability (−55% sill) and erratic variance (−73% nugget), effectively managing fine-scale vigour differences without pre-generated prescription maps. This makes the system practical and accessible for small- to medium-scale vineyards. From an agronomic perspective, the VRA strategy reduced variability in yield components such as cluster number and weight. However, grape composition parameters remained spatially heterogeneous, indicating the need for complementary practices (e.g., canopy management, regulated deficit irrigation) to achieve uniform fruit quality. The integration of proximal sensing with geostatistical analysis proved effective for assessing and comparing vineyard responses to site-specific management, offering a reproducible framework for future studies.
In conclusion, simplified sensor-based precision viticulture systems provide a scalable and sustainable tool to support input optimisation, yield homogeneity, and environmental goals in heterogeneous vineyards. With site-specific calibration of NDVI thresholds and application rules, this workflow is transferable to other wine regions, especially those with strong topographic heterogeneity, and to perennial row crops facing similar within-field variability.
Author Contributions
Conceptualisation, M.S. and D.T.; methodology, M.S., D.B. and D.T.; software, M.S. and A.Z.; formal analysis, M.S., D.B. and A.Z.; writing—original draft preparation, M.S. and D.B.; writing—review and editing, M.S., A.Z. and D.B.; supervision, F.M. and D.T. All authors have read and agreed to the published version of the manuscript.
Funding
This research activity by Francesco Marinello was funded by the Veneto Region, within the European Innovation Partnership for Agricultural Productivity and Sustainability (EIP-AGRI) OPERATIONAL GROUPS—(Reg. UE 2021/2115, art. 77) 2023–2027-DGR 1597, 19/12/2023, grant number 5836485. Project “InnoBioVit”.
Institutional Review Board Statement
Not applicable.
Informed Consent Statement
Not applicable.
Data Availability Statement
The original contributions presented in this study are included in the article. Further inquiries can be directed to the corresponding author.
Acknowledgments
The authors acknowledge the support of the Tarpasiodica farm, owned by Gianluigi Belloni and Raffaella Avesani (Vittorio Veneto, TV—Italy).
Conflicts of Interest
The authors declare no conflict of interest.
References
- Yu, R.; Brillante, L.; Martínez-Lüscher, J.; Kurtural, S.K. Spatial Variability of Soil and Plant Water Status and Their Cascading Effects on Grapevine Physiology Are Linked to Berry and Wine Chemistry. Front. Plant Sci. 2020, 11, 790. [Google Scholar] [CrossRef]
- Tardaguila, J.; Stoll, M.; Gutiérrez, S.; Proffitt, T.; Diago, M.P. Smart Applications and Digital Technologies in Viticulture: A Review. Smart Agric. Technol. 2021, 1, 100005. [Google Scholar] [CrossRef]
- Sassu, A.; Gambella, F.; Ghiani, L.; Mercenaro, L.; Caria, M.; Pazzona, A.L. Advances in Unmanned Aerial System Remote Sensing for Precision Viticulture. Sensors 2021, 21, 956. [Google Scholar] [CrossRef]
- Liu, K.; Sozzi, M.; Gasparini, F.; Marinello, F.; Sartori, L. Combining Simulations and Field Experiments: Effects of Subsoiling Angle and Tillage Depth on Soil Structure and Energy Requirements. Comput. Electron. Agric. 2023, 214, 108323. [Google Scholar] [CrossRef]
- Mania, E.; Petrella, F.; Giovannozzi, M.; Piazzi, M.; Wilson, A.; Guidoni, S. Managing Vineyard Topography and Seasonal Variability to Improve Grape Quality and Vineyard Sustainability. Agronomy 2021, 11, 1142. [Google Scholar] [CrossRef]
- Van Leeuwen, C.; Seguin, G. The Concept of Terroir in Viticulture. J. Wine Res. 2006, 17, 1–10. [Google Scholar] [CrossRef]
- Uzkuç, N.M.Ç.; Uzkuç, H.; Kavdır, Y.; Hamzaoğlu, F.; Toklucu, A.K. Soil-Driven Terroir: Impacts on Vitis vinifera L. “Karasakiz” Wine Quality and Phenolic Composition. J. Food Compos. Anal. 2025, 142, 107444. [Google Scholar] [CrossRef]
- Liu, K.; Benetti, M.; Sozzi, M.; Gasparini, F.; Sartori, L. Soil Compaction under Different Traction Resistance Conditions—A Case Study in North Italy. Agriculture 2022, 12, 1954. [Google Scholar] [CrossRef]
- Gaiotti, F.; Tomasi, D. I Terroirs Del Conegliano Valdobbiadene Prosecco: Studio Sull’origine Della Qualità Nelle Colline Patrimonio Unesco; Antiga Edizioni: Crocetta del Montello, Italy, 2020; ISBN 9788884352057. [Google Scholar]
- Belfiore, N.; Amato, A.; Gardiman, M.; Gaiotti, F.; Zenoni, S.; Tornielli, G.B.; Fasoli, M.; Bavaresco, L. The Role of Terroir on the Ripening Traits of V. vinifera Cv ‘Glera’ in the Prosecco Area. Plants 2024, 13, 816. [Google Scholar] [CrossRef]
- Pepi, S.; Sansone, L.; Chicca, M.; Vaccaro, C. Relationship among Geochemical Elements in Soil and Grapes as Terroir Fingerprintings in Vitis vinifera L. Cv. “Glera”. Chemie Erde 2017, 77, 121–130. [Google Scholar] [CrossRef]
- Alessandrini, M.; Gaiotti, F.; Belfiore, N.; Matarese, F.; D’Onofrio, C.; Tomasi, D. Influence of Vineyard Altitude on Glera Grape Ripening (Vitis vinifera L.): Effects on Aroma Evolution and Wine Sensory Profile. J. Sci. Food Agric. 2017, 97, 2695–2705. [Google Scholar] [CrossRef] [PubMed]
- Vine, R.P.; Harkness, E.M.; Linton, S.J. Viticulture (Grape Growing). In Winemaking; Springer: Berlin/Heidelberg, Germany, 2002; pp. 24–70. [Google Scholar]
- Silvestroni, O.; Dottori, E.; Pallotti, L.; Lattanzi, T.; Santilocchi, R.; Lanari, V. Using Legume-Enriched Cover Crops to Improve Grape Yield and Quality in Hillside Vineyards. Agronomy 2024, 14, 2528. [Google Scholar] [CrossRef]
- Bois, B.; Pauthier, B.; Brillante, L.; Mathieu, O.; Leveque, J.; Van Leeuwen, C.; Castel, T.; Richard, Y. Sensitivity of Grapevine Soil–Water Balance to Rainfall Spatial Variability at Local Scale Level. Front. Environ. Sci. 2020, 8, 110. [Google Scholar] [CrossRef]
- Tugnolo, A.; Oliveira, H.M.; Giovenzana, V.; Fontes, N.; Silva, S.; Fernandes, C.; Graça, A.; Pampuri, A.; Casson, A.; Piteira, J.; et al. Quantitative Prediction of Grape Ripening Parameters Combining an Autonomous IoT Spectral Sensing System and Chemometrics. Comput. Electron. Agric. 2025, 230, 109856. [Google Scholar] [CrossRef]
- Ferro, M.V.; Catania, P. Technologies and Innovative Methods for Precision Viticulture: A Comprehensive Review. Horticulturae 2023, 9, 399. [Google Scholar] [CrossRef]
- Keller, M. The Science of Grapevines: Anatomy and Physiology, 2nd ed.; Elsevier Inc.: Amsterdam, The Netherlands, 2015; ISBN 9780124199873. [Google Scholar]
- Recchia, L.; Boncinelli, P.; Cini, E.; Vieri, M.; Pegna, F.G.; Sarri, D. Multicriteria Analysis and LCA Techniques: With Applications to Agro-Engineering Problems; Green Energy and Technology; Springer: Berlin/Heidelberg, Germany, 2011; Volume 91. [Google Scholar] [CrossRef]
- Recchia, L.; Sarri, D.; Rimediotti, M.; Boncinelli, P.; Cini, E.; Vieri, M. Towards the Environmental Sustainability Assessment for the Viticulture. J. Agric. Eng. 2018, 49, 19–28. [Google Scholar] [CrossRef]
- Kazimierczuk, K.; Barrows, S.E.; Olarte, M.V.; Qafoku, N.P. Decarbonization of Agriculture: The Greenhouse Gas Impacts and Economics of Existing and Emerging Climate-Smart Practices. ACS Eng. Au 2023, 3, 426–442. [Google Scholar] [CrossRef]
- Taylor, J.A.; Sanchez, L.; Sams, B.; Haggerty, L.; Jakubowski, R.; Djafour, S.; Bates, T.R. Evaluation of a Commercial Grape Yield Monitor for Use Mid-Season and at-Harvest. J. Int. Sci. Vigne du Vin 2016, 50, 57–63. [Google Scholar] [CrossRef]
- Sozzi, M.; Bernardi, E.; Kayad, A.; Marinello, F.; Boscaro, D.; Cogato, A.; Gasparini, F.; Tomasi, D. On-The-Go Variable Rate Fertilizer Application on Vineyard Using a Proximal Spectral Sensor. In Proceedings of the 2020 IEEE International Workshop on Metrology for Agriculture and Forestry (MetroAgriFor), Trento, Italy, 4–6 November 2020; pp. 343–347. [Google Scholar]
- Ammoniaci, M.; Kartsiotis, S.P.; Perria, R.; Storchi, P. State of the Art of Monitoring Technologies and Data Processing for Precision Viticulture. Agriculture 2021, 11, 201. [Google Scholar] [CrossRef]
- Hunter, J.J.; Bonnardot, V. Suitability of Some Climatic Parameters for Grapevine Cultivation in South Africa, with Focus on Key Physiological Processes. S. Afr. J. Enol. Vitic. 2011, 32, 137–154. [Google Scholar] [CrossRef]
- Huglin, M.P. Nouveau Mode d’évaluation Des Possibilités Héliothermiques d’un Milieu Viticole. Comptes Rendus L’académie D’agriculture Fr. 1978, 64, 1117–1126. [Google Scholar]
- Taylor, J.A.; Bates, T.R. Comparison of Different Vegetative Indices for Calibrating Proximal Canopy Sensors to Grapevine Pruning Weight. Am. J. Enol. Vitic. 2021, 72, 279–283. [Google Scholar] [CrossRef]
- Dorin, B.; Reynolds, A.G.; Lee, H.S.; Carrey, M.; Shemrock, A.; Shabanian, M. Detecting Cool-Climate Riesling Vineyard Variation Using Unmanned Aerial Vehicles and Proximal Sensors. Drone Syst. Appl. 2024, 12, 1–18. [Google Scholar] [CrossRef]
- Kasimati, A.; Psiroukis, V.; Darra, N.; Kalogrias, A.; Kalivas, D.; Taylor, J.A.; Fountas, S. Investigation of the Similarities between NDVI Maps from Different Proximal and Remote Sensing Platforms in Explaining Vineyard Variability. Precis. Agric. 2023, 24, 1220–1240. [Google Scholar] [CrossRef]
- Uribeetxebarria, A.; Martínez-Casasnovas, J.A.; Escolà, A.; Rosell-Polo, J.R.; Arnó, J. Stratified Sampling in Fruit Orchards Using Cluster-Based Ancillary Information Maps: A Comparative Analysis to Improve Yield and Quality Estimates. Precis. Agric. 2019, 20, 179–192. [Google Scholar] [CrossRef]
- Lloyd, S.P. Least Squares Quantization in PCM. IEEE Trans. Inf. Theory 1982, 28, 129–137. [Google Scholar] [CrossRef]
- Leroux, C.; Tisseyre, B. How to Measure and Report Within-Field Variability: A Review of Common Indicators and Their Sensitivity. Precis. Agric. 2019, 20, 562–590. [Google Scholar] [CrossRef]
- Cambardella, C.A.; Moorman, T.B.; Novak, J.M.; Parkin, T.B.; Karlen, D.L.; Turco, R.F.; Konopka, A.E. Field-Scale Variability of Soil Properties in Central Iowa Soils. Soil Sci. Soc. Am. J. 1994, 58, 1501–1511. [Google Scholar] [CrossRef]
- Han, S.; Hummel, J.W.; Goering, C.E.; Cahn, M.D. Cell Size Selection for Site-Specific Crop Management. Trans. ASAE 1994, 37, 19–26. [Google Scholar] [CrossRef]
- Cambardella, C.A.; Karlen, D.L. Spatial Analysis of Soil Fertility Parameters. Precis. Agric. 1999, 1, 5–14. [Google Scholar] [CrossRef]
- Gatti, M.; Squeri, C.; Garavani, A.; Frioni, T.; Dosso, P.; Diti, I.; Poni, S. Effects of Variable Rate Nitrogen Application on Cv. Barbera Performance: Yield and Grape Composition. Am. J. Enol. Vitic. 2019, 70, 188–200. [Google Scholar] [CrossRef]
- Silc Informa. Quotazioni Nazionali. 2021. Available online: https://www.silcfertilizzanti.it/wp-content/uploads/2021/04/sett5.pdf (accessed on 24 August 2025).
- Wernet, G.; Bauer, C.; Steubing, B.; Reinhard, J.; Moreno-Ruiz, E.; Weidema, B. The Ecoinvent Database Version 3 (Part I): Overview and Methodology. Int. J. Life Cycle Assess. 2016, 21, 1218–1230. [Google Scholar] [CrossRef]
- Balafoutis, A.T.; Koundouras, S.; Anastasiou, E.; Fountas, S.; Arvanitis, K. Life Cycle Assessment of Two Vineyards after the Application of Precision Viticulture Techniques: A Case Study. Sustainability 2017, 9, 1997. [Google Scholar] [CrossRef]
- Zhao, M.; Guerrero, A.; Muhammad, M.A.; Lauwers, L.; Mouazen, A.M. Within-Field Spatial Variability and Potential for Profitability of Variable Rate Applications. Precis. Agric. 2023, 24, 2248–2263. [Google Scholar] [CrossRef]
- Gatti, M.; Garavani, A.; Squeri, C.; Diti, I.; De Monte, A.; Scotti, C.; Poni, S. Effects of Intra-Vineyard Variability and Soil Heterogeneity on Vine Performance, Dry Matter and Nutrient Partitioning. Precis. Agric. 2022, 23, 150–177. [Google Scholar] [CrossRef]
- Bramley, R.G.V.; Trought, M.C.T.; Praat, J.P. Vineyard Variability in Marlborough, New Zealand: Characterising Variation in Vineyard Performance and Options for the Implementation of Precision Viticulture. Aust. J. Grape Wine Res. 2011, 17, 83–89. [Google Scholar] [CrossRef]
- Bramley, R.G.V.; Ouzman, J.; Trought, M.C.T.; Neal, S.M.; Bennett, J.S. Spatio-Temporal Variability in Vine Vigour and Yield in a Marlborough Sauvignon Blanc Vineyard. Aust. J. Grape Wine Res. 2019, 25, 430–438. [Google Scholar] [CrossRef]
- Verdugo-Vásquez, N.; Villalobos-Soublett, E.; Gutiérrez-Gamboa, G.; Araya-Alman, M. Spatial Variability of Production and Quality in Table Grapes ‘Flame Seedless’ Growing on a Flat Terrain and Slope Site. Horticulturae 2021, 7, 254. [Google Scholar] [CrossRef]
Disclaimer/Publisher’s Note: The statements, opinions and data contained in all publications are solely those of the individual author(s) and contributor(s) and not of MDPI and/or the editor(s). MDPI and/or the editor(s) disclaim responsibility for any injury to people or property resulting from any ideas, methods, instructions or products referred to in the content. |
© 2025 by the authors. Licensee MDPI, Basel, Switzerland. This article is an open access article distributed under the terms and conditions of the Creative Commons Attribution (CC BY) license (https://creativecommons.org/licenses/by/4.0/).

