Abstract
Yield maps from combine harvesters are essential in precision agriculture for capturing within-field variability and guiding variable-rate input management. However, in large-scale systems such as those in the Brazilian Cerrado, these maps are often inconsistent due to calibration errors, use of multiple harvesters, and complex post-processing. Orbital remote sensing offers an alternative by providing consistent vegetation index (VI) data for crop monitoring and yield estimation. This study developed regression models relating Sentinel-2 VIs (EVI, TVI, NDVI, and NDRE) to cotton yield data obtained from combine harvesters across 30 commercial plots in Mato Grosso, Brazil, over six cropping seasons (2019–2024), totaling 76 plot-season datasets. Vegetation indices were grouped into 15-day intervals based on days after sowing, and a logistic growth function was applied in the regression modeling. Model performance evaluated using 15 independent plot-seasons showed good pixel-level accuracy, with RMSE of 0.695 t ha−1 and R2 of 0.78, with EVI performing slightly better. At the plot scale, mean yield predictions across all datasets achieved an RMSE of 0.41 t ha−1, reflecting the higher reliability of module-based yield measurements. These results demonstrate the potential of Sentinel-2 VIs combined with logistic regression to predict cotton yields in the Cerrado, complementing or replacing harvester-based monitoring.
1. Introduction
Crop yield maps provide farmers with valuable insights to optimize crop management, support decision making in agricultural practices, and enhance precision agriculture strategies []. These maps are particularly useful for implementing variable-rate applications of agricultural inputs, such as fertilizers, lime, seeds, growth regulators, and irrigation, tailored to site-specific needs []. When generated over multiple seasons, yield maps allow the identification of plots that consistently exhibit spatial variability in yield. This approach highlights opportunities for economic and environmental benefits by applying variable-rate inputs across distinct management zones within each plot [,,,].
Yield maps generated by combine harvesters equipped with yield monitors are a well-established and efficient tool for assessing crop performance and identifying areas with varying yield potential within a farm. However, these systems require accurate calibration before use to minimize errors and ensure data reliability. In addition, they require extensive data collection and substantial computational resources, which are often time-consuming and labor-intensive [].
In large-scale agricultural operations, such as those in the Brazilian Cerrado, multiple harvesters with different yield monitor brands and technologies pose additional challenges for ensuring yield map accuracy and consistency. Although yield monitors are common in soybean, corn, and cotton harvesters, producers’ skepticism regarding their benefits has persisted, often due to limited technical guidance on managing spatial variability and applying variable-rate inputs. The significant effort required to extract, process, and analyze the vast data from medium and large farms, often spanning thousands to tens of thousands of hectares, also contributes to hesitation in fully adopting this technology.
In contrast, orbital remote sensing offers a straightforward approach to monitoring crop development and yield prediction []. It enables the detection of key crop growth stages, such as emergence, maturation, and senescence, as well as within-season crop yield []. A variety of vegetation indices, including the Normalized Difference Vegetation Index (NDVI), Normalized Difference Red Edge Index (NDRE), Enhanced Vegetation Index (EVI), and Green Chlorophyll Vegetation Index (GCVI), among others, have been successfully employed in these applications []. However, the efficacy of orbital remote sensing in crop monitoring is influenced by several factors [], including the size of production plots relative to the spatial resolution of satellite imagery, revisit time, and local precipitation patterns, which can limit the availability of cloud-free satellite images during the crop production season [,].
Among the most widely used satellite products for agricultural monitoring are Landsat-8 (30 m resolution) and Sentinel-2 imagery (10 m for visible and NIR bands, 20 m for SWIR bands), which provide spatial detail suitable for assessing large production plots spanning hundreds of hectares, as commonly found in the Brazilian Cerrado, particularly in the states of Mato Grosso, Bahia, and Goiás. However, these resolutions may be unsuitable for smaller plots of few tens of hectares or less, which are more common in southern Brazilian states. In such cases, high spatial-resolution commercial satellite imagery from platforms such as SPOT, KOMPSAT, RapidEye, and PlanetScope, among others, may be required to effectively monitor crop yield variability within production plots. Additionally, the Brazilian Cerrado crop production systems, typically characterized by two crops per year (soybean in the spring-summer and corn or cotton in the summer-fall-winter) face challenges in monitoring crop development during the rainy season (first crop: soybean) due to frequent cloud cover. In contrast, the second crop (corn or cotton), typically planted at the onset of the rainy season and harvested during the dry season, provides a more favorable time window for acquiring cloud-free orbital images [], especially during its mid to late development stages. In this context, satellites with shorter revisit intervals, such as Sentinel-2 (5-day revisit time), are more suitable, as they provide the chance of obtaining a greater number of cloud-free images during the growing season compared to Landsat-8 (15-day revisit time), for instance.
Several studies have focused on predicting crop yield using satellite-based remote sensing, either in combination with crop models and climate data or through regression modeling, including machine learning approaches. These methods establish relationships between crop yield, vegetation indices, and covariates such as climate data and soil parameters []. Orbital remote sensing enables the prediction of average crop yield at the production-plot scale using lower spatial resolution imagery (e.g., 250 m) with high temporal frequency (daily), as provided by the MODIS sensors aboard NASA’s Terra and Aqua satellites [,,,]. Additionally, these approaches facilitate the assessment of within-plot yield variability through predicted yield maps, utilizing higher spatial resolution imagery, such as that from Sentinel-2 [,,,].
Regression models have been applied to estimate cotton yields using vegetation indices derived from orbital remote sensing, either alone or in combination with climatic, topographic, and soil data. Reported root mean square error (RMSE) values typically range from 0.2 to 1.0 t ha−1, depending on the scale and modeling approach []. Most of these approaches provide average yield estimates for entire plots.
Within-field yield maps have been generated for crops such as wheat, corn, soybean, sunflower, barley, canola, and triticale using vegetation indices derived from Sentinel [,,,,,,], Landsat [,], RapidEye [], PlanetScope, and WorldView []. In general, combine harvesters provide ground-truth yield data for training models, thereby enabling pixel-level yield predictions. The models reported RMSE values ranging from 0.5 to 1.0 t ha−1 for winter cereals (wheat, barley, and triticale), 0.7 to 1.1 t ha−1 for corn, 0.4 to 0.5 t ha−1 for soybean, and 0.3 to 0.5 t ha−1 for sunflower.
Regression models have been developed to predict cotton yield in the Brazilian Cerrado using MODIS Terra and Aqua data, demonstrating the relevance of vegetation indices such as EVI, TVI, NDVI, and NDRE for yield estimation []. While effective at larger scales, these approaches are constrained by the coarse spatial resolution of MODIS, which limits their capacity to capture within-field yield variability.
Despite these advances, research focused on generating within-field cotton yield maps in the Brazilian Cerrado remains limited, particularly approaches that rely exclusively on time series of vegetation indices under realistic production and harvesting conditions. The central hypothesis is that Sentinel-2 vegetation index time series are capable of capturing the spatial and temporal variability of cotton growth with sufficient accuracy to predict within-field yield patterns. Accordingly, the objective was to develop and evaluate regression models for predicting spatially explicit cotton yield maps using Sentinel-2 vegetation indices calibrated with yield monitor data from commercial production fields in the Cerrado.
2. Materials and Methods
2.1. Experimental Area
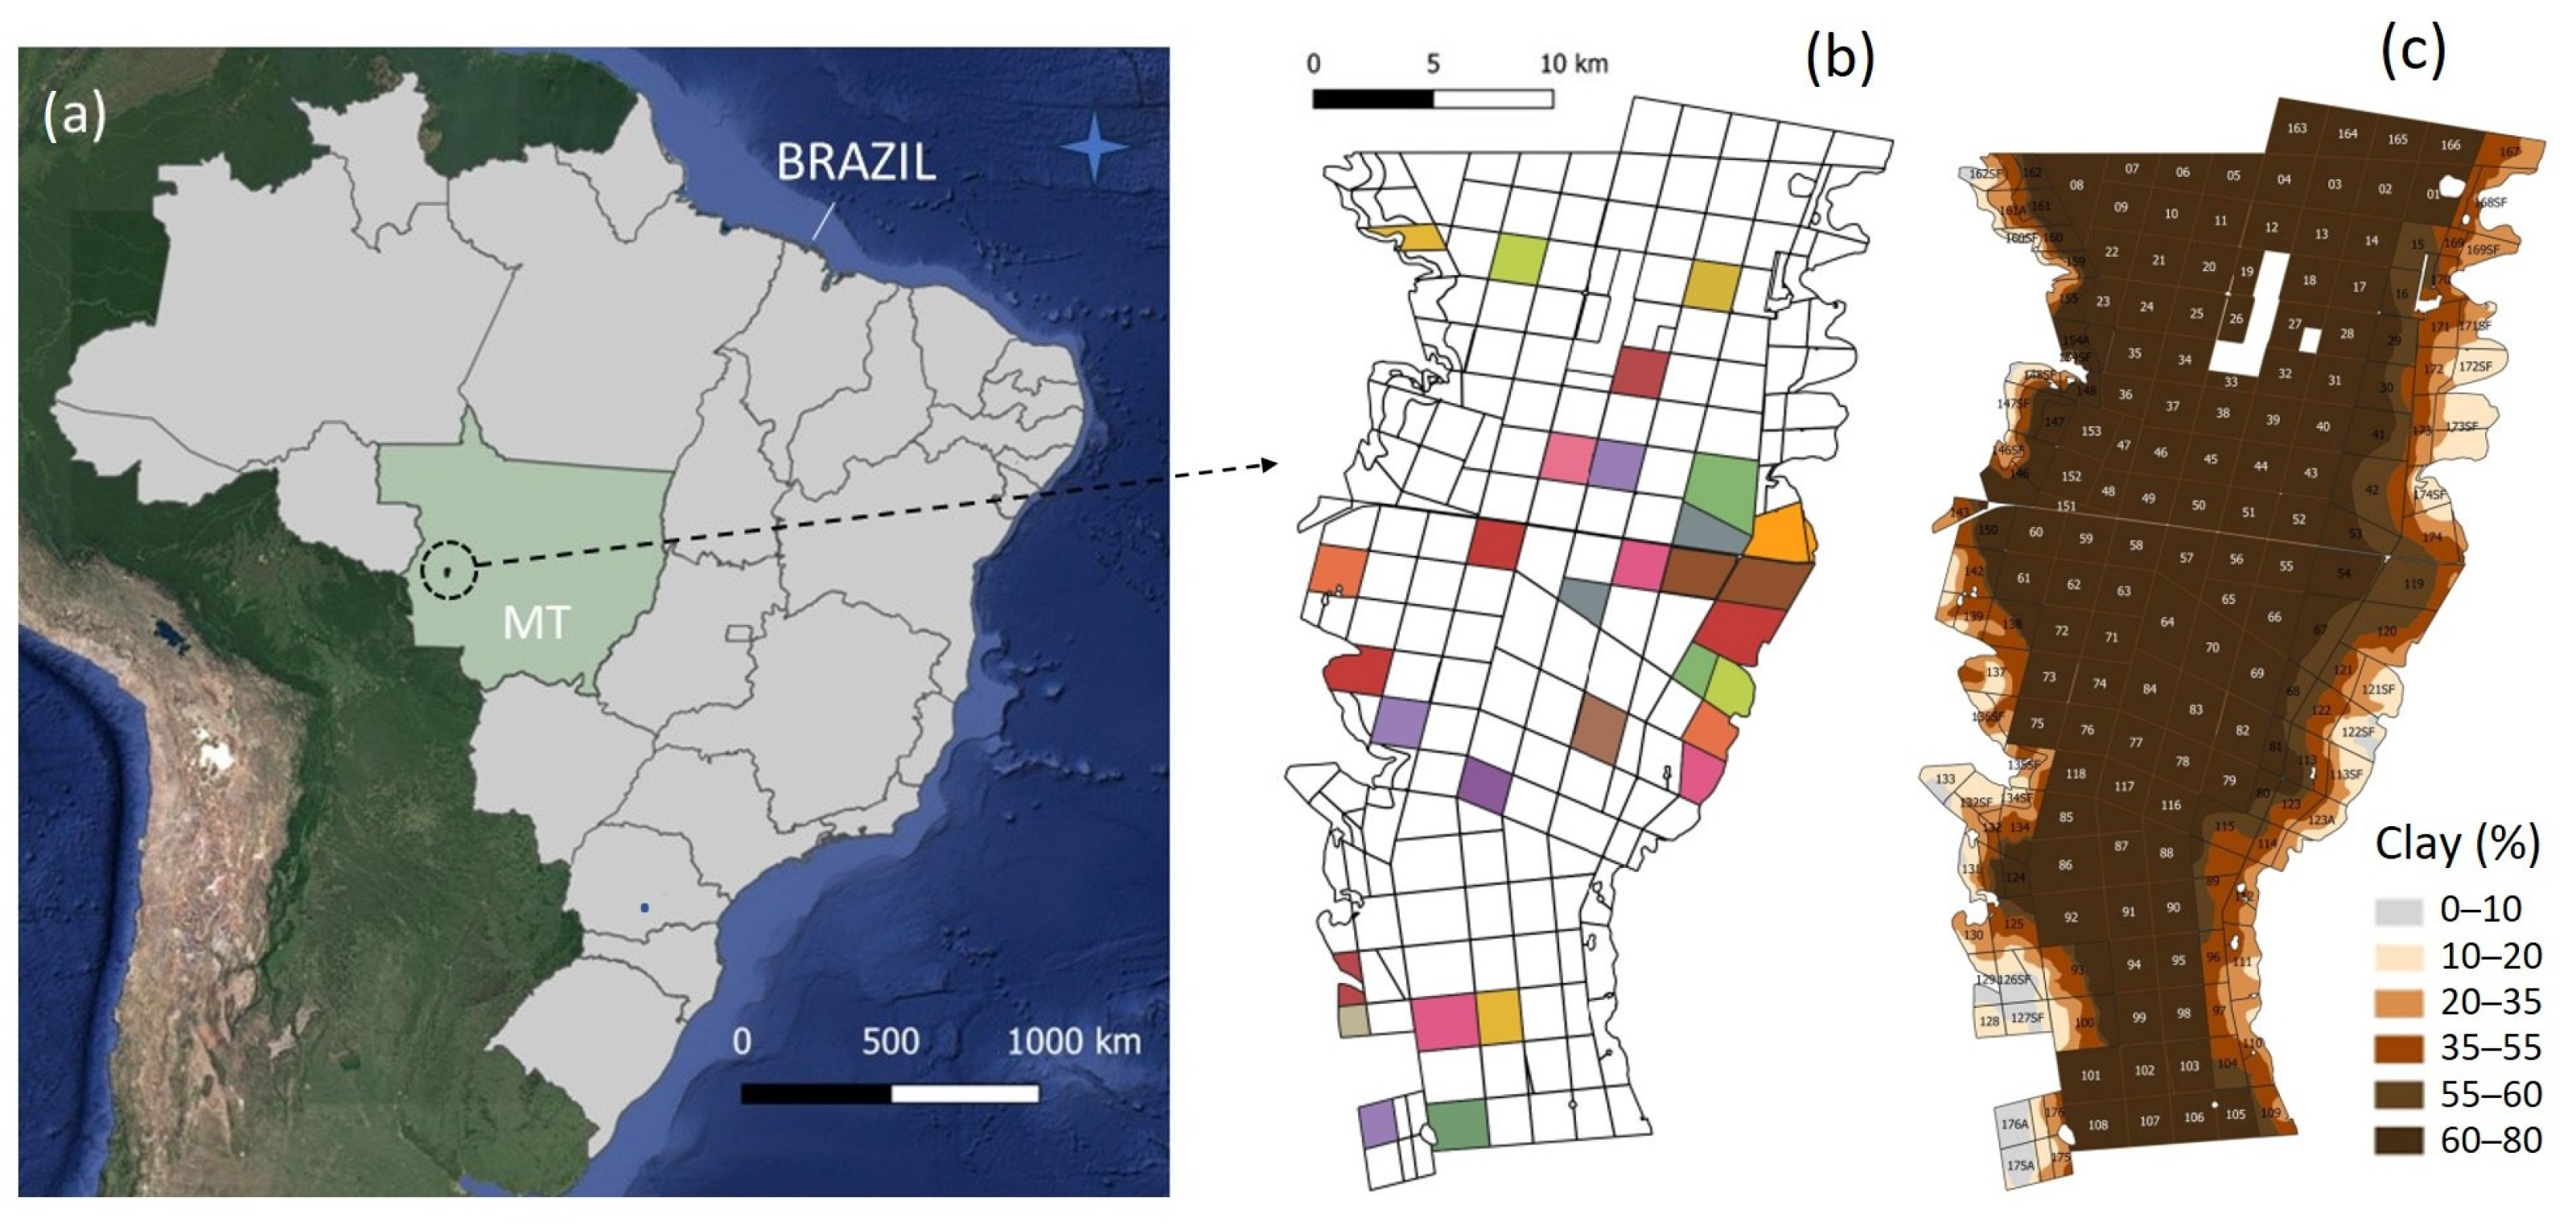
The study area is located in the municipality of Sapezal, Mato Grosso (MT), Brazil (Figure 1a), within the Cerrado biome. The region is characterized by a relatively flat relief, an average annual precipitation of 1750 mm, and 30-year average maximum temperatures ranging from 28 °C to 32 °C, while average daily minimum temperatures vary between 18 °C and 22 °C. Cotton is typically cultivated as a second crop under rainfed condition, sown between December and February after soybean harvest (crop succession management).
Figure 1.
Study area and production plots: (a) Sapezal, Mato Grosso State (MT), Brazil; (b) polygonal map of the study plots (colored) on Tucunaré Farm; (c) clay content of the plots on Tucunaré Farm.
This study involved 30 commercial production plots (colored polygons in Figure 1b) on Tucunaré Farm (Amaggi Group) across six cropping seasons (2019–2024). After removing plot-season combinations affected by harvester issues in yield measurement, 76 plot-season data instances remained. For each plot-season, average cotton yield as well as sowing and harvest dates were recorded.
Although the geographical position of each plot remained constant across seasons, management practices, selected cultivar, climatic conditions, and biotic stressors varied substantially from one season to another, exerting significant impacts on yield. The longitudinal variation across seasons was therefore considered the main source of independence among plot-season combinations. Consequently, each plot-season combination was treated as an independent instance.
Fertilizer, lime, herbicide, insecticide, fungicide, and growth regulator applications, as well as seed density and cultivar selection, were determined by the farm’s technical team and varied among plots according to soil analyses, soil texture, location, and field monitoring, following technical recommendations. For the late-cycle cultivars, seed densities ranged from 6 to 9 seeds per meter, while the medium and early-cycle cultivars had densities between 8 and 11 seeds per meter. Cotton rows were spaced 36 inches (91.4 cm) apart, and no-till management was applied for both the first crop (soybean) and the second crop (cotton) across all plots and seasons. Under these conditions, this study represents a typical on-farm research experiment.
2.2. Satellite Data and Processing
Based on de Siqueira et al. [], Sentinel-2 vegetation indices (EVI, TVI, NDVI, and NDRE; Table 1) were retrieved as raster images (GeoTIFF) using a JavaScript code implemented in the Google Earth Engine (GEE) platform. Data were obtained from the Level-2A orthorectified atmospherically corrected surface reflectance product (COPERNICUS/S2_SR_HARMONIZED), available since 2017, with a 5-day revisit period, 10 m spatial resolution for visible and NIR bands, and 20 m for SWIR bands.
Table 1.
Vegetation indices used in this study. Bands from Sentinel-2 used were: G (green): B03; R (red): B04; NIR: B08; B: (blue): B02; RE: (red edge): B8A.
Shapefile-format plot contours were provided for all 30 plots included in this study. Using sowing and harvesting dates, cloud-free vegetation index images for each growing season were downloaded from the GEE platform and systematically organized with file names incorporating the plot identifier, acquisition date, season, and days after sowing (DAS) (e.g., Plot-17, 05-25-2021, 2021-S, 104-DAS). For each plot-season, all cloud-free images acquired between plant emergence and harvest were downloaded and recorded for subsequent analysis (model training or testing), which typically spans the period from January to August.
The DAS variable was adopted as the time scale instead of the day of the year (DOY). Vegetation indices were averaged in regular 15-day intervals, which were then used to construct the regression models for predicting cotton yield maps, following an approach similar to that of de Siqueira et al. [].
The geographical information system (GIS) software QGIS (version 3.22.7) was used to process vegetation index images and cotton yield maps. Since the target variable (cotton yield, provided by combine harvesters) and the predictors (vegetation indices from Sentinel-2) had different spatial resolutions and formats, both datasets were resampled to a common spatial grid for modeling. Yield maps generated by combine harvesters have high data density (typically one acquisition per second), but often display spatial irregularities due to variations in harvester speed, intermittent signal loss from communication or electronic issues, and the use of multiple machines within each plot. In contrast, satellite imagery such as Sentinel-2 provides spatially consistent measurements with uniformly spaced 10-m pixels.
To ensure comparability and optimize model accuracy, both datasets were resampled to a common, appropriately defined grid. Grid sizes ranging from 10 × 10 m to 70 × 70 m were tested on a subset of eight plot-season combinations from the testing dataset. The grid size that produced the highest correlation between the EVI and cotton yield was selected for model training across all VI’s and DAS intervals. Vegetation index raster images were resampled to the selected grids by averaging pixel values using the Raster Zonal Statistics tool in the QGIS Processing Toolbox, with the plot grid vector shapefile used as the input layer. The resulting data were exported as CSV files and subsequently converted to Excel® format for further analysis.
All spatial datasets were projected or re-projected into a common coordinate reference system (CRS), specifically EPSG:32721–WGS 84/UTM zone 21 S, to ensure spatial compatibility and enable accurate comparison and analysis.
2.3. Yield Mapping Data from Combine Harvesters
Cotton harvesting was performed using John Deere cotton pickers, models CP690 and CP770 (Moline, IL, USA). The number of harvesters per plot ranged from 6 to 18, depending on plot size and logistical requirements for each season. Combine harvester monitors were calibrated at the beginning of the harvest season, and yield data were exported as shapefiles after field operations. The raw yield maps obtained from the combine harvester monitors (Ycombine) were normalized using the total weight of harvested round cotton modules (Yweight) recorded for each plot-season. A correction factor (f) was computed for each plot-season as: f = Yweight/Ycombine. All yield values from the combine harvester maps were then multiplied by this factor to adjust the data and ensure equivalence between the average monitor-derived yield and the actual harvested yield. This normalization improves the consistency between harvester-based measurements and the reference yield determined from the total weight of harvested modules. However, this procedure corrects only systematic bias at the plot scale and does not compensate for measurement differences among multiple combines operating within the same plot-season, which in this study ranged from 6 to 18 machines per field. As a result, some residual machine-specific errors may persist in the normalized yield maps.
Yield values lower than 0.1 t ha−1 or higher than 7 t ha−1 were excluded as outliers. These thresholds were established based on historical production records from the entire Tucunaré farm and were defined in consultation with the farm data manager.
Cotton yield maps (shapefiles) were resampled to the grids by averaging vector point data using the Spatial Join function in the QGIS Processing Toolbox, with the plot grid vector shapefile as the base layer. The resampled data were then exported as CSV files and subsequently converted to Excel format for further analysis.
2.4. Regression Modeling Approach
The vegetation indices (EVI, TVI, NDVI and NDRE) and cotton yield data, resampled to the selected grid, were organized and grouped into 15-day DAS intervals. In general, cloud-free images were only available from approximately 75 DAS onwards. Consequently, regression models were developed for intervals ranging from 75–89 DAS to 165–179 DAS. For each DAS interval, the selected regression function was the Slogistic1 from the OriginPro 2015 software library (OriginLab) (Equation (1)). This function belongs to the logistic family, characterized by an S-shaped curve. Data were fitted using OriginPro with the Levenberg–Marquardt algorithm, employing the software’s default initialization parameters for a, k, and xc. These parameters were iteratively optimized by the algorithm to minimize the sum of squared residuals. Model performance was assessed using the coefficient of determination (R2), root mean square error (RMSE), mean absolute error (MAE), and Bias.
where a (upper asymptote), k (growth rate), and xc (inflection point) are free parameters (fitting coefficients), x represents the Sentinel-derived vegetation indices (EVI, TVI, NDVI or NDRE), and Y (t ha−1) denotes cotton yield.
The logistic regression function was selected to model cotton yield because of its superior flexibility in capturing both the growth dynamics and the saturation behavior of VIs across different DAS intervals. Extensive preliminary testing had discarded alternative functional forms, including power, exponential, logarithmic, linear, and polynomial models with two or three parameters. Furthermore, it offers an advantage over the linear model previously used by de Siqueira et al. [], as it prevents unrealistic negative yield predictions, particularly under extremely low VI values measured at field borders or under conditions of disease incidence or severe climatic stress.
Of the 76 observations (plot-season) in the dataset (30 plots spanning the 2019 to 2024 growing seasons), complete combine-harvester yield maps were available for 50 plot-season combinations, while only average yield values were reported for the remaining 26 plots. Consequently, regression model training and testing for different DAS intervals were conducted using only the 50 plot-season with yield maps, with 35 observations allocated for training and 15 for testing. The train-test split was performed at the plot-season level to ensure independence between training and testing samples and to prevent temporal or spatial leakage. The split was defined prior to any data processing or analysis. Specifically, for plots with 5, 4, 3, or 2 growing-season observations, one observation per plot was randomly allocated to the test dataset, and the remaining observations were assigned to the training dataset. For the five plots with only a single growing-season observation, three were randomly assigned to the training dataset and two to the test dataset.
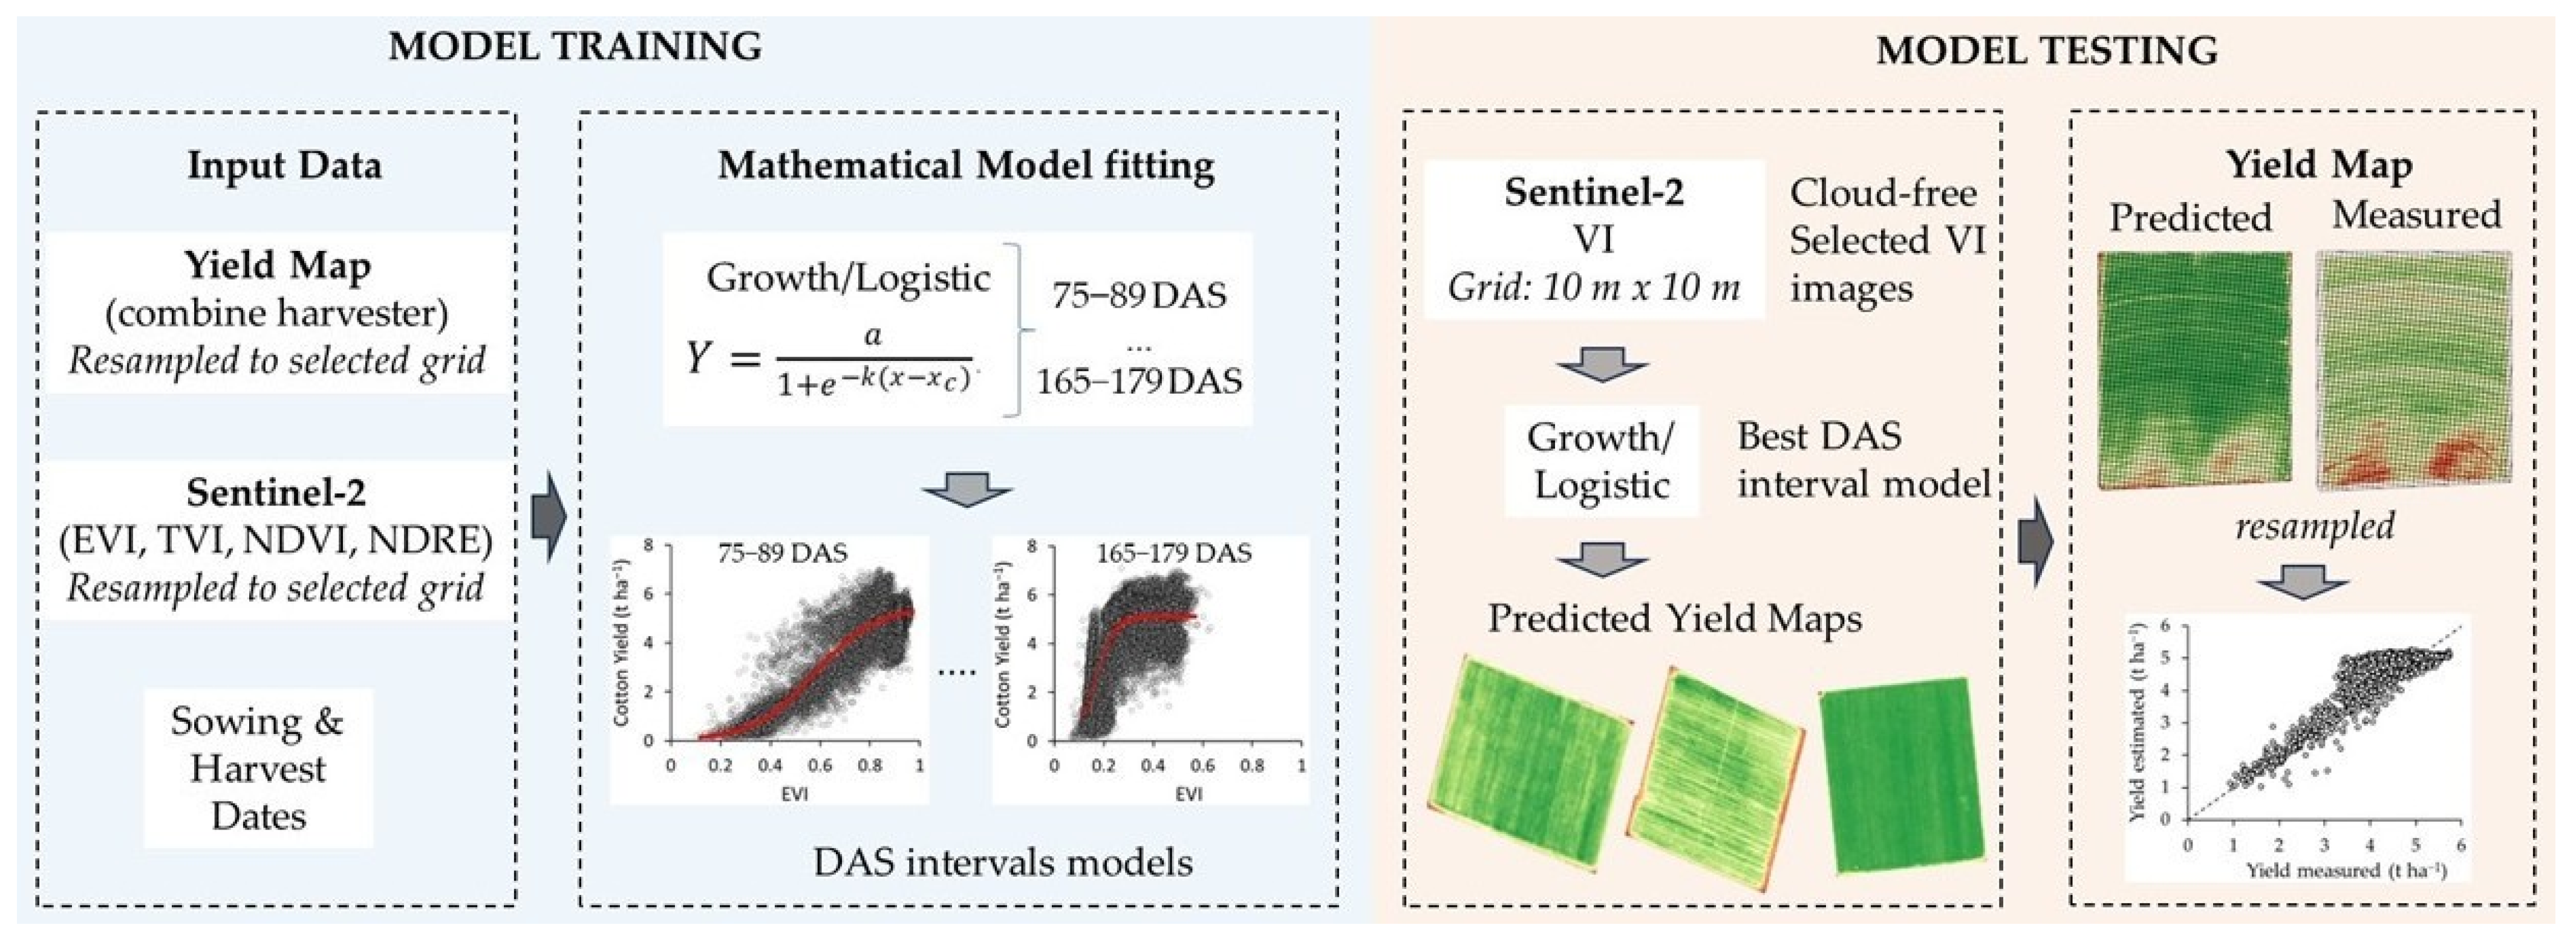
Figure 2 illustrates the model training and testing procedures. During the training phase, resampled yield data and Sentinel-2 vegetation index (VI) data are fitted using the Slogistic1 regression function, generating seven 15-day DAS intervals regression equations (75 to 179 DAS). The VI and DAS intervals models with the highest R2 are selected for yield map prediction using cloud-free VI images acquired within these selected DAS intervals.
Figure 2.
Schematic representation of the model training and testing approaches used for regression model training and testing.
During the model testing phase, predicted yield maps were generated using the vegetation indices EVI, TVI, NDVI, and NDRE. A single cloud-free Sentinel-2 image corresponding to the DAS interval with the highest model performance was selected to produce the predicted yield map. This map was then compared to the combine harvester-measured yield map using the best-performing resampled grid. Pixel-level cotton yield accuracy was assessed using the RMSE between the predicted and measured values for the selected grid and vegetation index. Additionally, plot-level yield predictions were obtained by averaging the predicted values, for each of the 76 plot-season combinations (30 plots unevenly distributed over six growing seasons) and compared to the corresponding measured yields obtained by weight of harvested round cotton modules to assess accuracy at the plot scale.
3. Results and Discussion
3.1. Dataset Evaluation
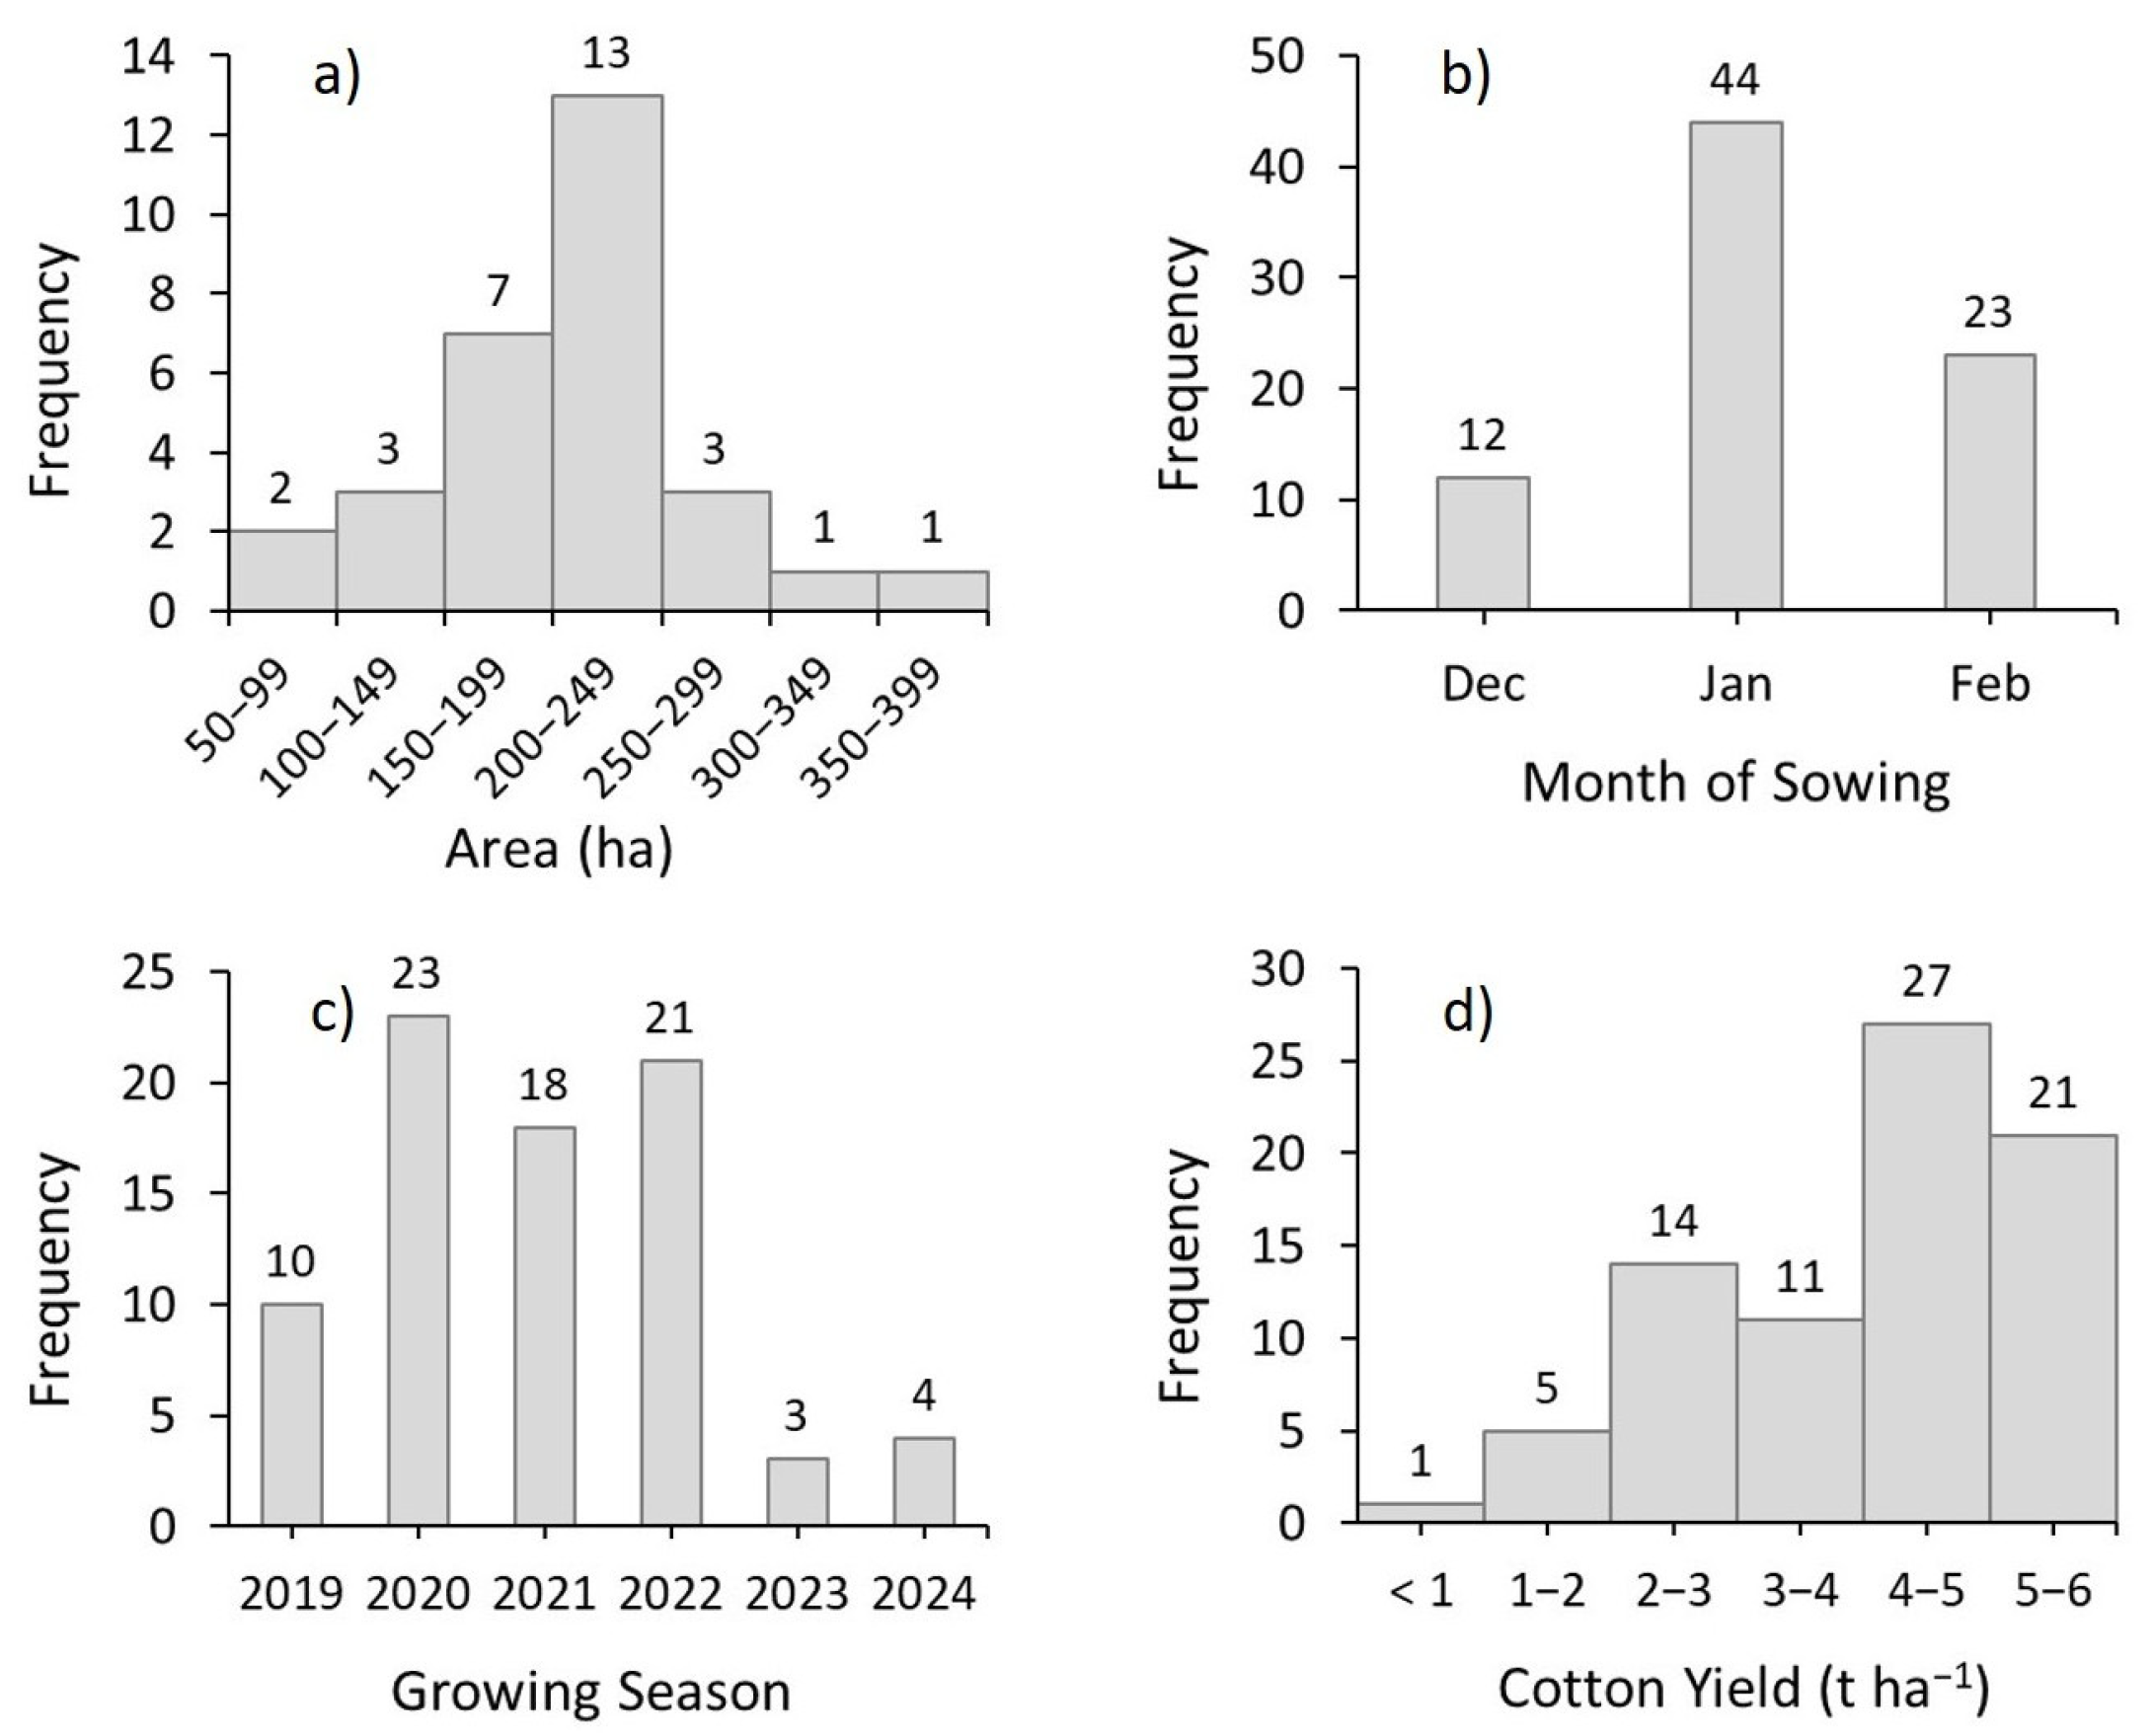
Figure 3 presents the frequency distributions of key features of the cotton production dataset, including plot area, growing season, sowing month, and cotton yield. The average plot size was 202 ha, with a mean cotton yield of 3.995 t ha−1. Most plots were sown in January and February, accounting for 85% of the dataset. The lowest yields were recorded in plots with clay content ranging from 10% to 25%, which are typically sown in December and often managed as single-crop systems due to their low water-holding capacity. In contrast, the highest yields were measured in fields with clay content above 35%, which offer greater water and nutrient retention throughout the growing season. Notably, yields during the 2022 growing season were significantly reduced, falling below 3.5 t ha−1 across all plots, due to highly irregular rainfall distribution. These observations are consistent with previous studies that evaluated the influence of soil attributes and environmental variables on cotton yield in the state of Mato Grosso [,,], which identified soil texture, altitude, precipitation and temperature patterns, and management practices as the most influential factors.
Figure 3.
Frequency distribution of plot-season data for plot area (a), sowing month (b), cropping season (c), and cotton yield (d).
Low- and high-yield observations (Figure 3d) are essential for developing robust regression models for crop yield prediction [,,]. Including the full range of yield variability ensures that the model is trained on both extreme and intermediate conditions, rather than being biased toward average cases. Likewise, capturing broad variability in vegetation indices (VIs) and other explanatory variables enables the model to learn the complete input-output relationships across different crop growth conditions. This diversity in the training data reduces overfitting, prevents bias, and ultimately improves model accuracy and generalization.
3.2. Cloud-Free VI Images Evaluation
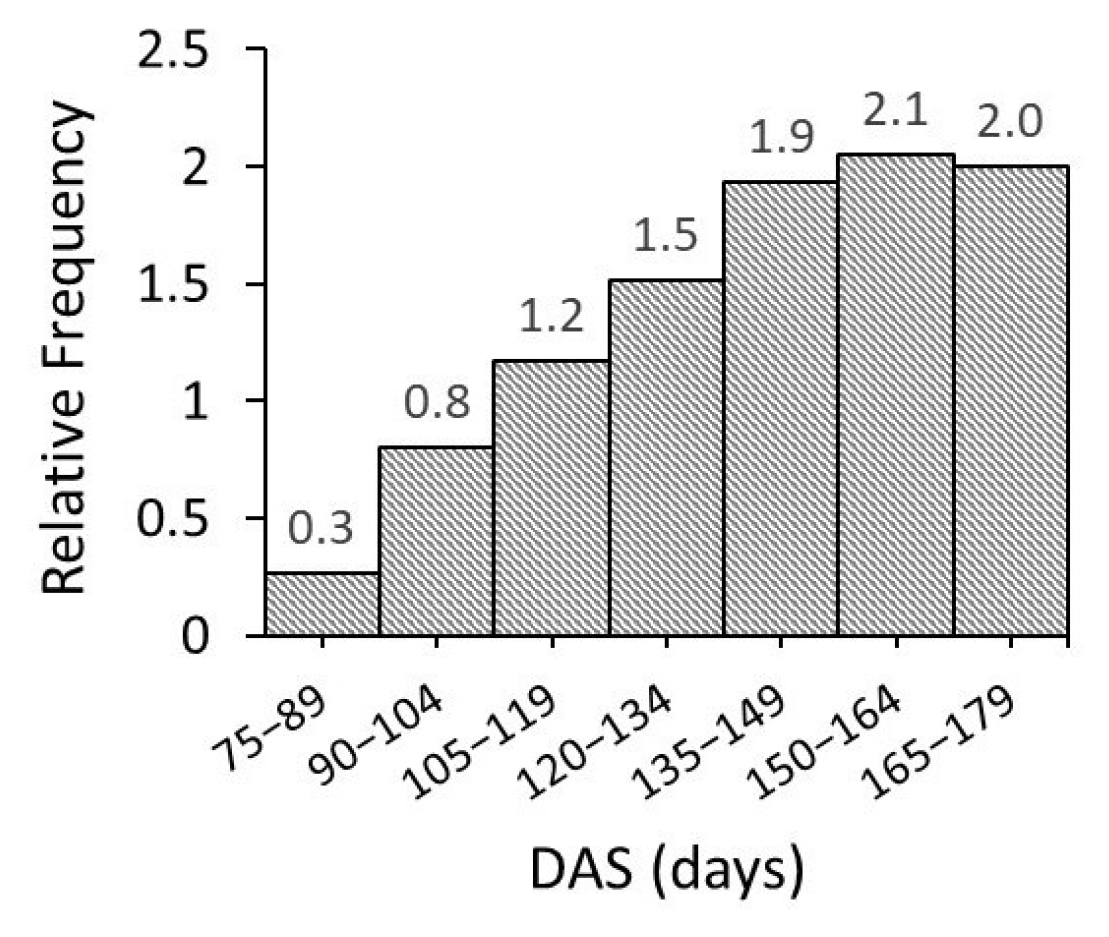
The availability of cloud-free VI images during the 90–150 DAS period has been critical for achieving good yield prediction accuracy for cotton cultivated in Brazil’s Cerrado region []. Among the 50 plot-season datasets used to train and test the models, the number of cloud-free images acquired for the period of 75–179 DAS ranged from 4 to 16, with an average of 9 images. In contrast, cloud-free imagery was scarce from sowing to 74 DAS. Figure 4 shows the number of free-cloud images in 15-day intervals, normalized by the total of plot-season (50). From 75 to 149 DAS, the availability of cloud-free images steadily increased and then stabilized through 135–179 DAS. For the 105–119 DAS interval, at least one cloud-free image was available on average. Prior to this interval, the average number of cloud-free images per plot-season was less than one, whereas after this point, the average exceeded one image per interval. Therefore, in terms of data availability for the regression models, the period from 105 to 179 DAS provides the most consistent and abundant source of valid input data. These findings are consistent with the seasonal cloud patterns reported for the Brazilian Cerrado biome [], where periods with lower cloud cover, and thus higher availability of cloud-free satellite scenes, are predominantly observed from May to September (mid-autumn to late spring). As shown in Figure 3b, most sows were performed in January and February.
Figure 4.
Frequency distribution of cloud-free images (number of images normalized by the total number of plot-season; 50) from 75 to 179 DAS in 15-day intervals.
3.3. Resampling Grid for Yield and VI Maps
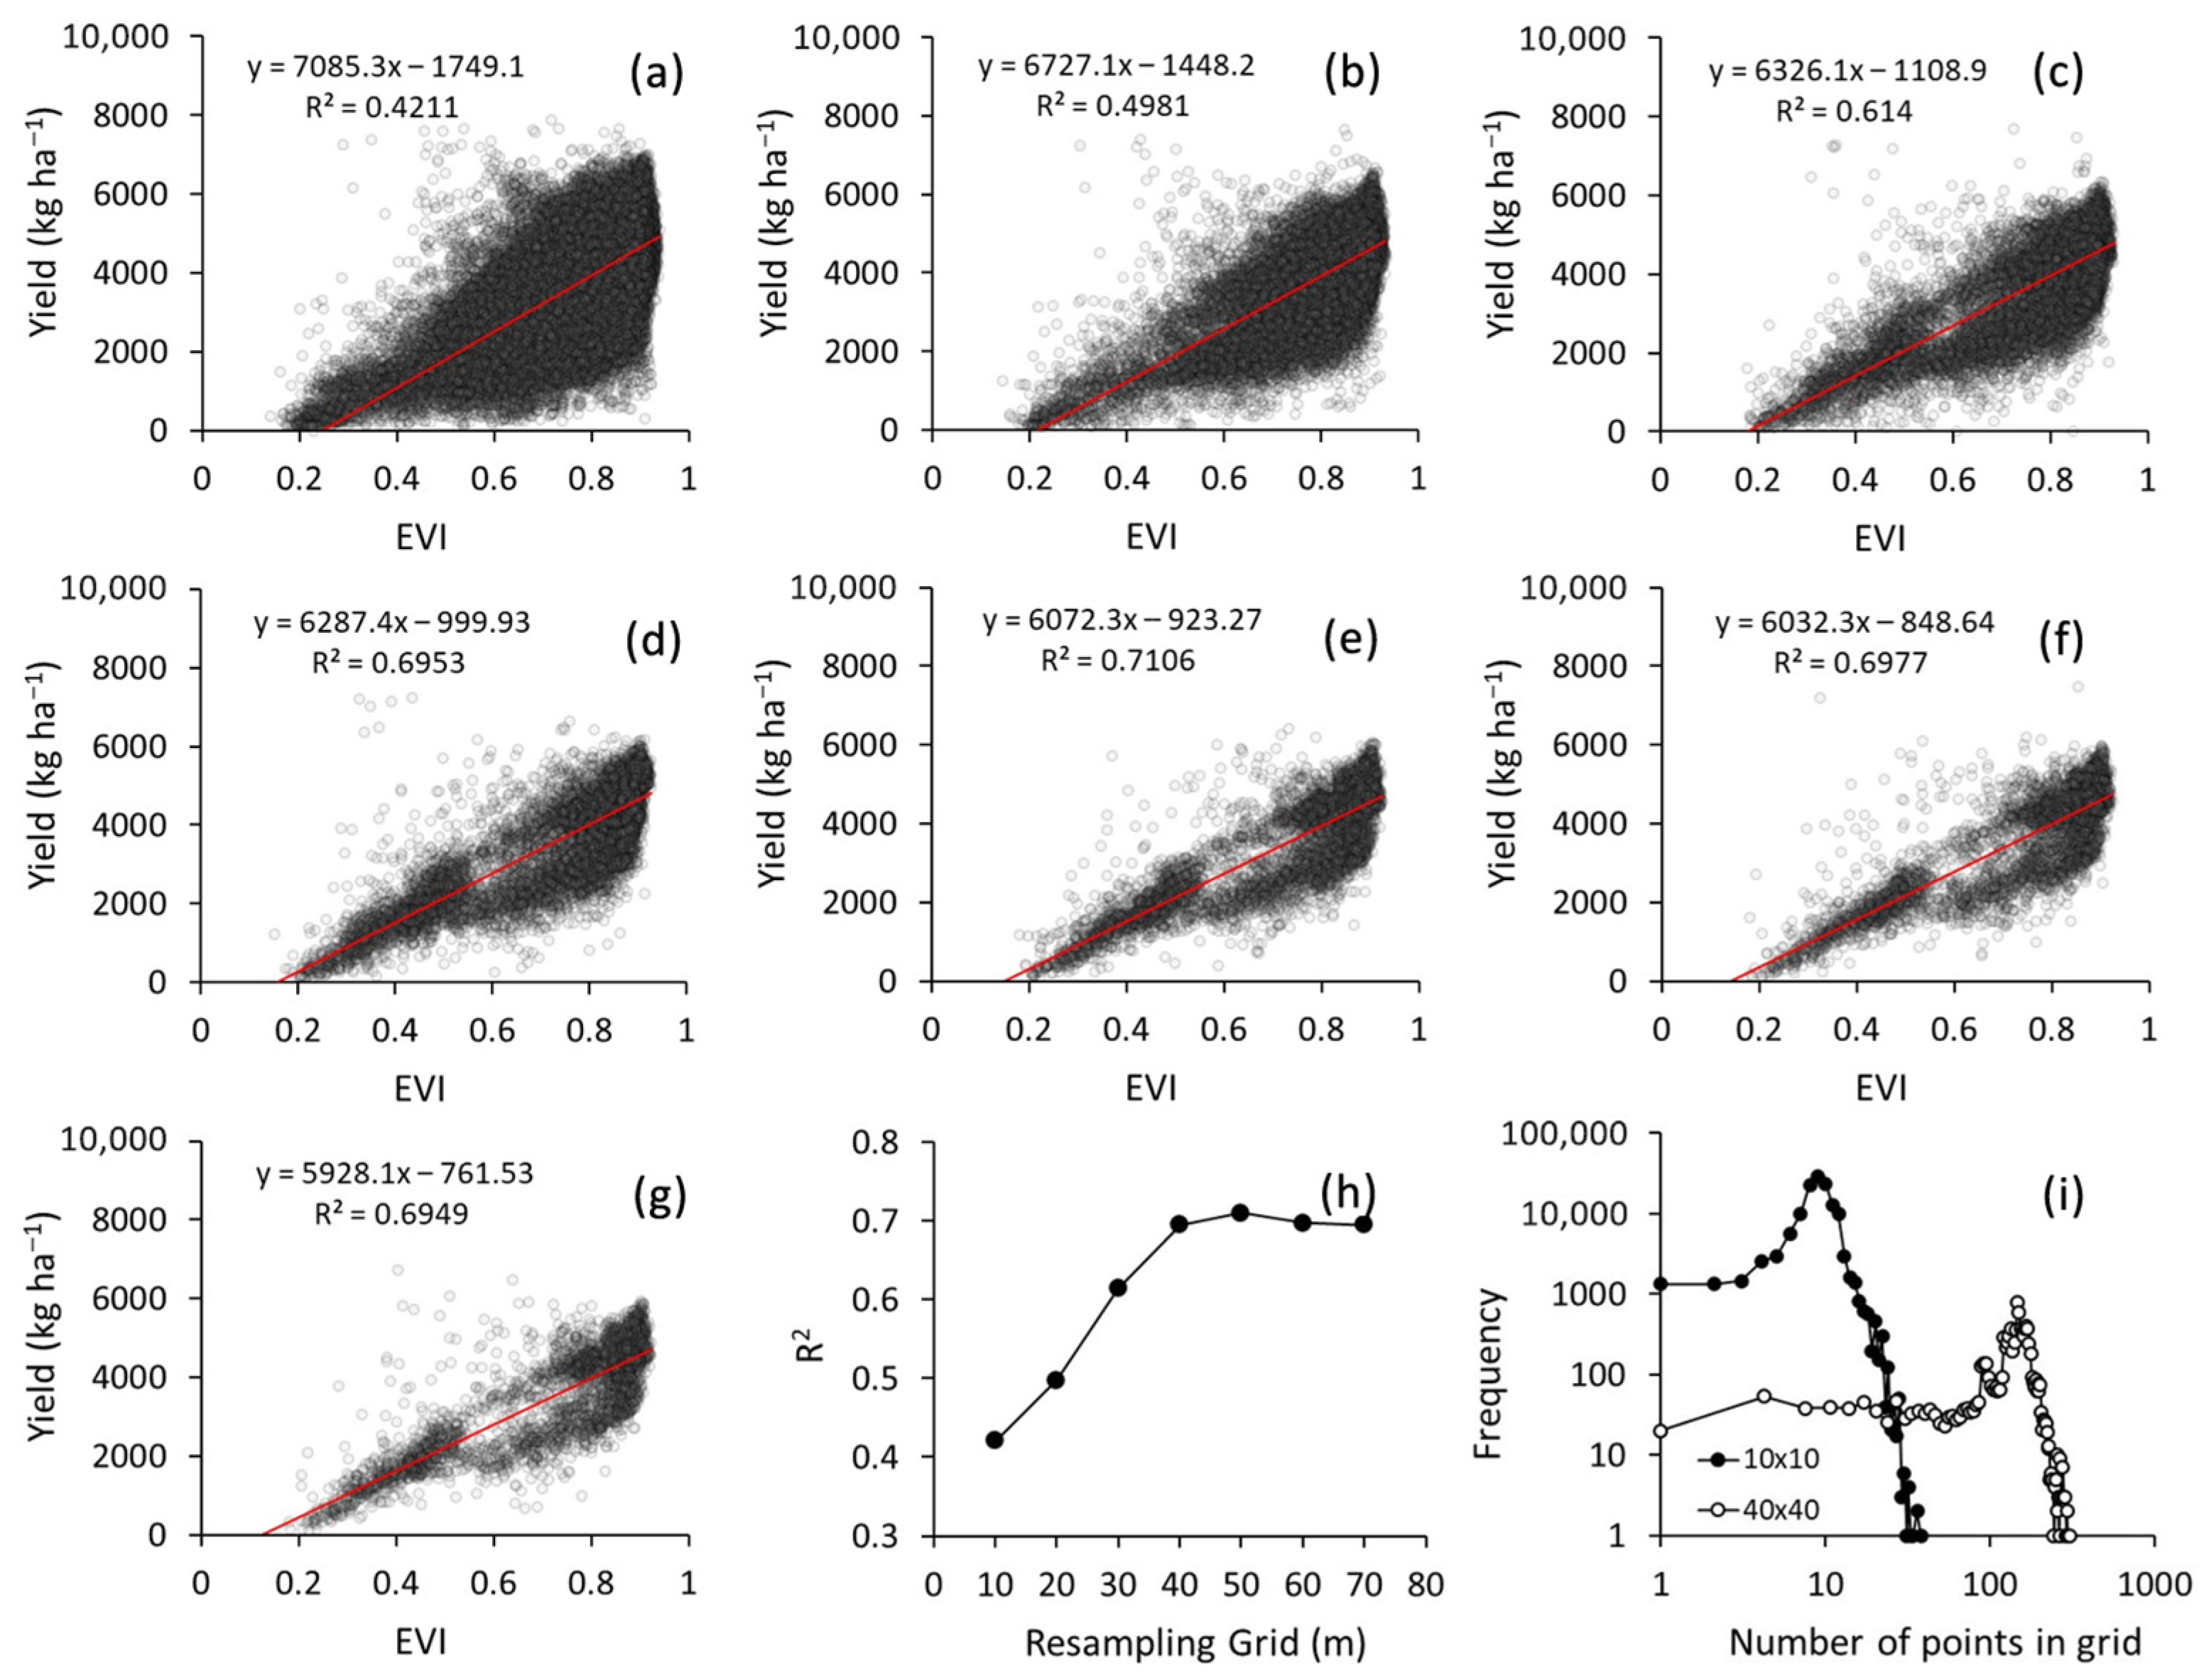
Figure 5 shows that the relationship between EVI and yield improved with increasing grid size, with R2 values rising up to the 40 × 40 m resolution and stabilizing thereafter (Figure 5h). A similar pattern was observed for the other vegetation indices. This trend suggests the presence of noise in the original yield data, which effect is progressively reduced as grid size increases due to the averaging of more measurements within each cell. This effect is further illustrated in Figure 5i, which shows the frequency distribution of yield points per grid cell for the 10 × 10 m and 40 × 40 m grids. While approximately 1300 pixels in the 10 × 10 m grid contained only a single yield measurement, this number dropped to just 20 pixels in the 40 × 40 m grid, demonstrating the improved robustness and spatial coherence provided by the larger grid size. Comparable findings were reported in a large-scale wheat yield prediction study in Sweden, where the best model performance using Sentinel imagery was obtained after resampling the yield maps to 40 m resolution [].
Figure 5.
Relationships between EVI and yield for eight plot-seasons using grids of 10 × 10 m (a), 20 × 20 m (b), 30 × 30 m (c), 40 × 40 m (d), 50 × 50 m (e), 60 × 60 m (f), 70 × 70 m (g); coefficient of determination (R2) between EVI and yield across grid sizes (h); and frequency distribution of yield data points per pixel for the 10 × 10 m and 40 × 40 m grids (i).
Based on these findings, the 40 × 40 m grid was selected for subsequent model training and testing. This result aligns with previous studies that emphasize the importance of post-processing yield maps acquired by sensors mounted on combine harvesters to improve their correlation with vegetation index images derived from satellite data for yield prediction modeling []. Although several strategies exist to detect and eliminate anomalous yield data, such as geostatistical filtering, Moran’s spatial autocorrelation, and simple thresholding methods that exclude values beyond the mean ± n × SD (standard deviation), this study adopted a resampling-based approach.
The resampling method proved effective in reducing noise and enhancing the correlation between yield and VI data. The use of this simple yet robust approach is justified by the complex sources of error inherent to large-scale commercial cotton production systems in the Brazilian Cerrado, where multiple combine harvesters are often used simultaneously, leading to inconsistencies in yield data acquisition. Furthermore, studies addressing yield map filtering strategies under these specific production conditions are still limited and warrant further investigation in future research [].
3.4. Model Training and Testing
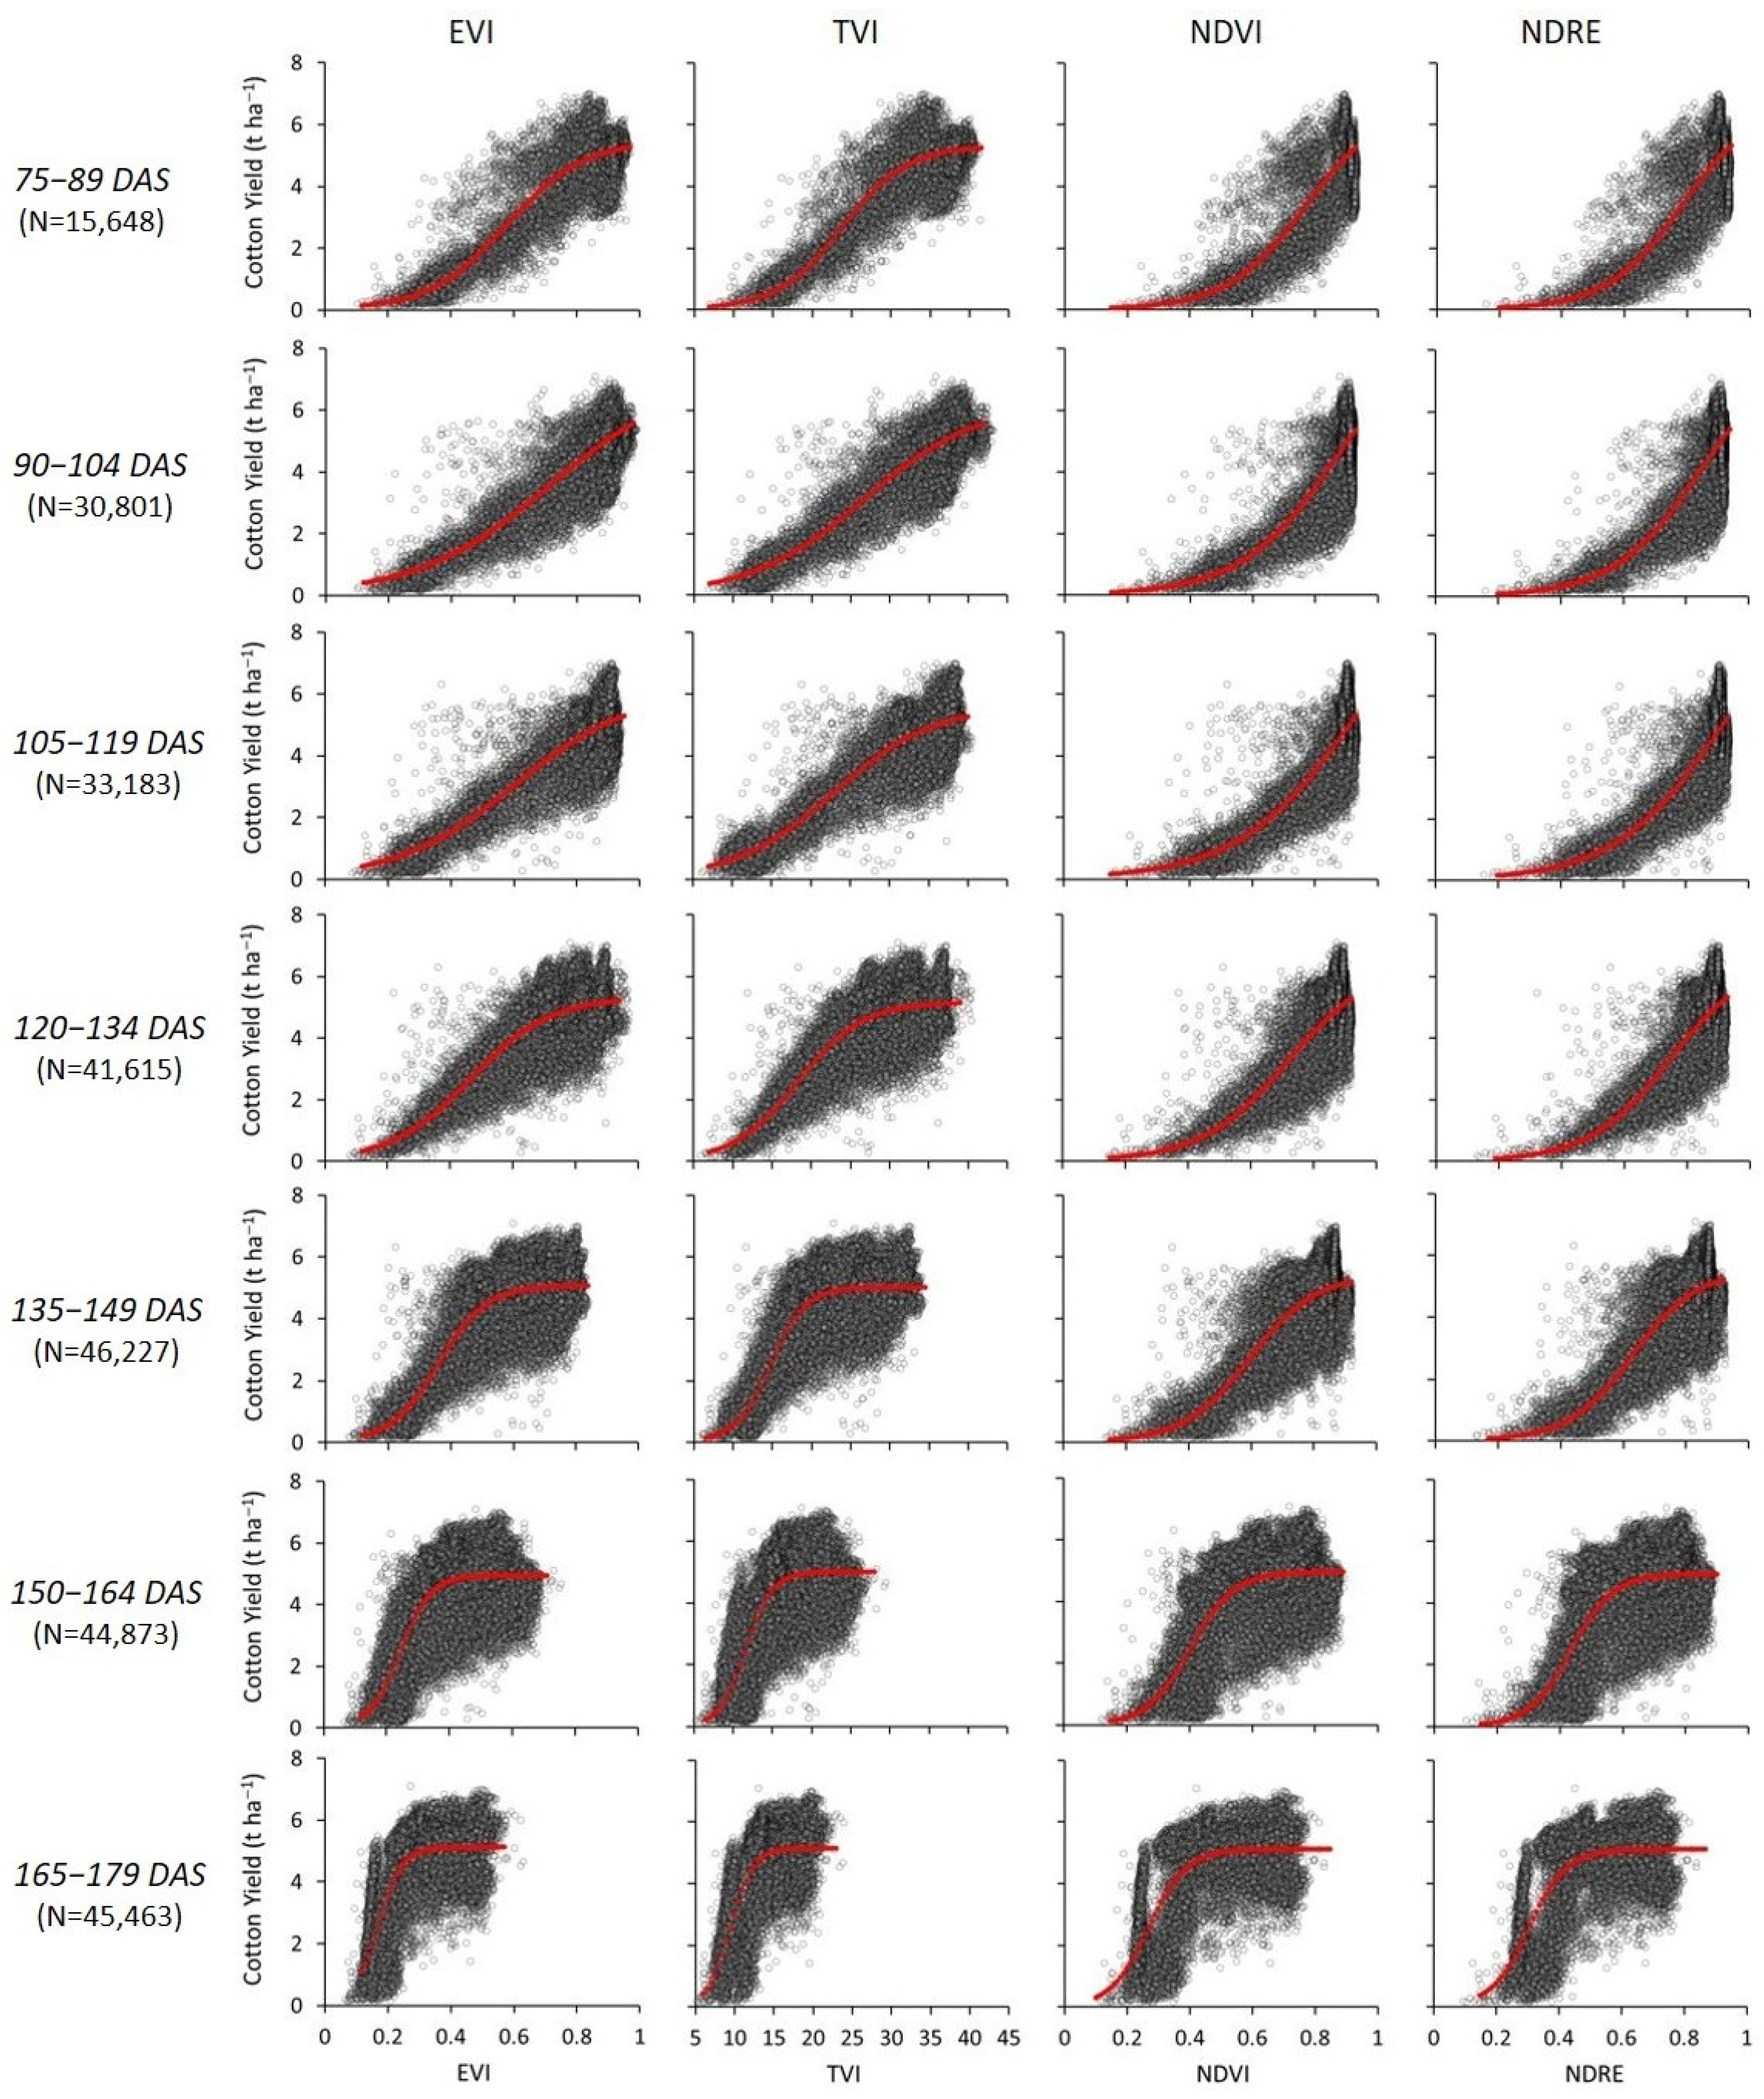
Figure 6 shows the correlations between cotton yield measured by combine harvesters and the vegetation indices EVI, TVI, NDVI, and NDRE across seven DAS intervals, using a 40 × 40 m grid, for the training dataset. The figure also presents the fitted growth/logistic model (Equation (1)), with corresponding coefficients provided in Table 2. Residuals from the fitted models were visually inspected using residuals versus fitted values plots, which revealed no obvious patterns of heteroscedasticity.
Figure 6.
Correlations between cotton yield and vegetation indices (EVI, TVI, NDVI, and NDRE) across seven DAS intervals, using a 40 × 40 m grid for the training dataset. The fitted growth/logistic model coefficients and R2 values are detailed in Table 2.
Table 2.
Fitting coefficients (a, xc and k) of Equation (1) derived from the training dataset to describe the relationships between cotton yield and vegetation indices (VI) across DAS intervals (Figure 6).
Differences in fitting performance based on R2 were relatively small, with EVI and TVI performing slightly better []. This is likely due to the growth/logistic function, which is versatile for modeling sigmoid-shaped relationships, effectively capturing phases of growth and stabilization [], making it particularly suitable for modeling the seasonal dynamics of VIs in relation to crop yield.
The best performances were observed for 75–89, 90–104, and 105–119 interval. When selecting the best DAS interval model, the number of points per interval (Table 2) should be considered alongside R2. The lower number of points in the 75–89 DAS interval, compared to the subsequent intervals, is explained by the high incidence of cloud cover during this period (Figure 4), which reduced the availability of usable satellite images [,].
Between 75 and 120 DAS, cotton typically transitions from late vegetative growth to the main reproductive phase. For most medium-cycle cultivars cultivated in tropical environments such as the Brazilian Cerrado, this period corresponds to peak flowering (R1–R2), boll formation (R2–R3), and boll filling/early boll opening (R3–R4) [,]. These stages are physiologically critical for yield determination, which explains the strong relationships observed between vegetation indices and final yield in this period.
Analysis of cloud-free images (Figure 4) and sowing date distributions (Figure 3d) across all plot-season combinations indicates that mid- and late-season cotton sowing (January and February) provides a high probability of obtaining cloud-free images within the most favorable DAS window, where the models achieved their best performances. In contrast, early sowing (December) presents a slightly less optimal scenario due to a lower likelihood of acquiring cloud-free images during the same DAS period. Since the model-testing approach requires choosing a single satellite image to estimate the yield map (although multiple images could be used and then averaged for a more refined estimate, the simpler approach with one image was adopted here). One cloud-free image was selected as the first available for each of the 15 plot-season (test dataset) according to the following DAS priority order: 90–104, 105–119, 75–89, 120–134, and 135–149. This strategy is consistent with previous studies demonstrating that yield prediction models can achieve high accuracy using a single vegetation index image acquired at key phenological stages [,]. When combined with the resampling grid approach and the logistic growth model, this procedure resulted in high coefficients of determination (R2 ≈ 0.80) for the 75–119 DAS intervals using EVI and TVI, which is in line with the average R2 of 0.77 reported in a recent review evaluating 32 crop yield prediction studies [].
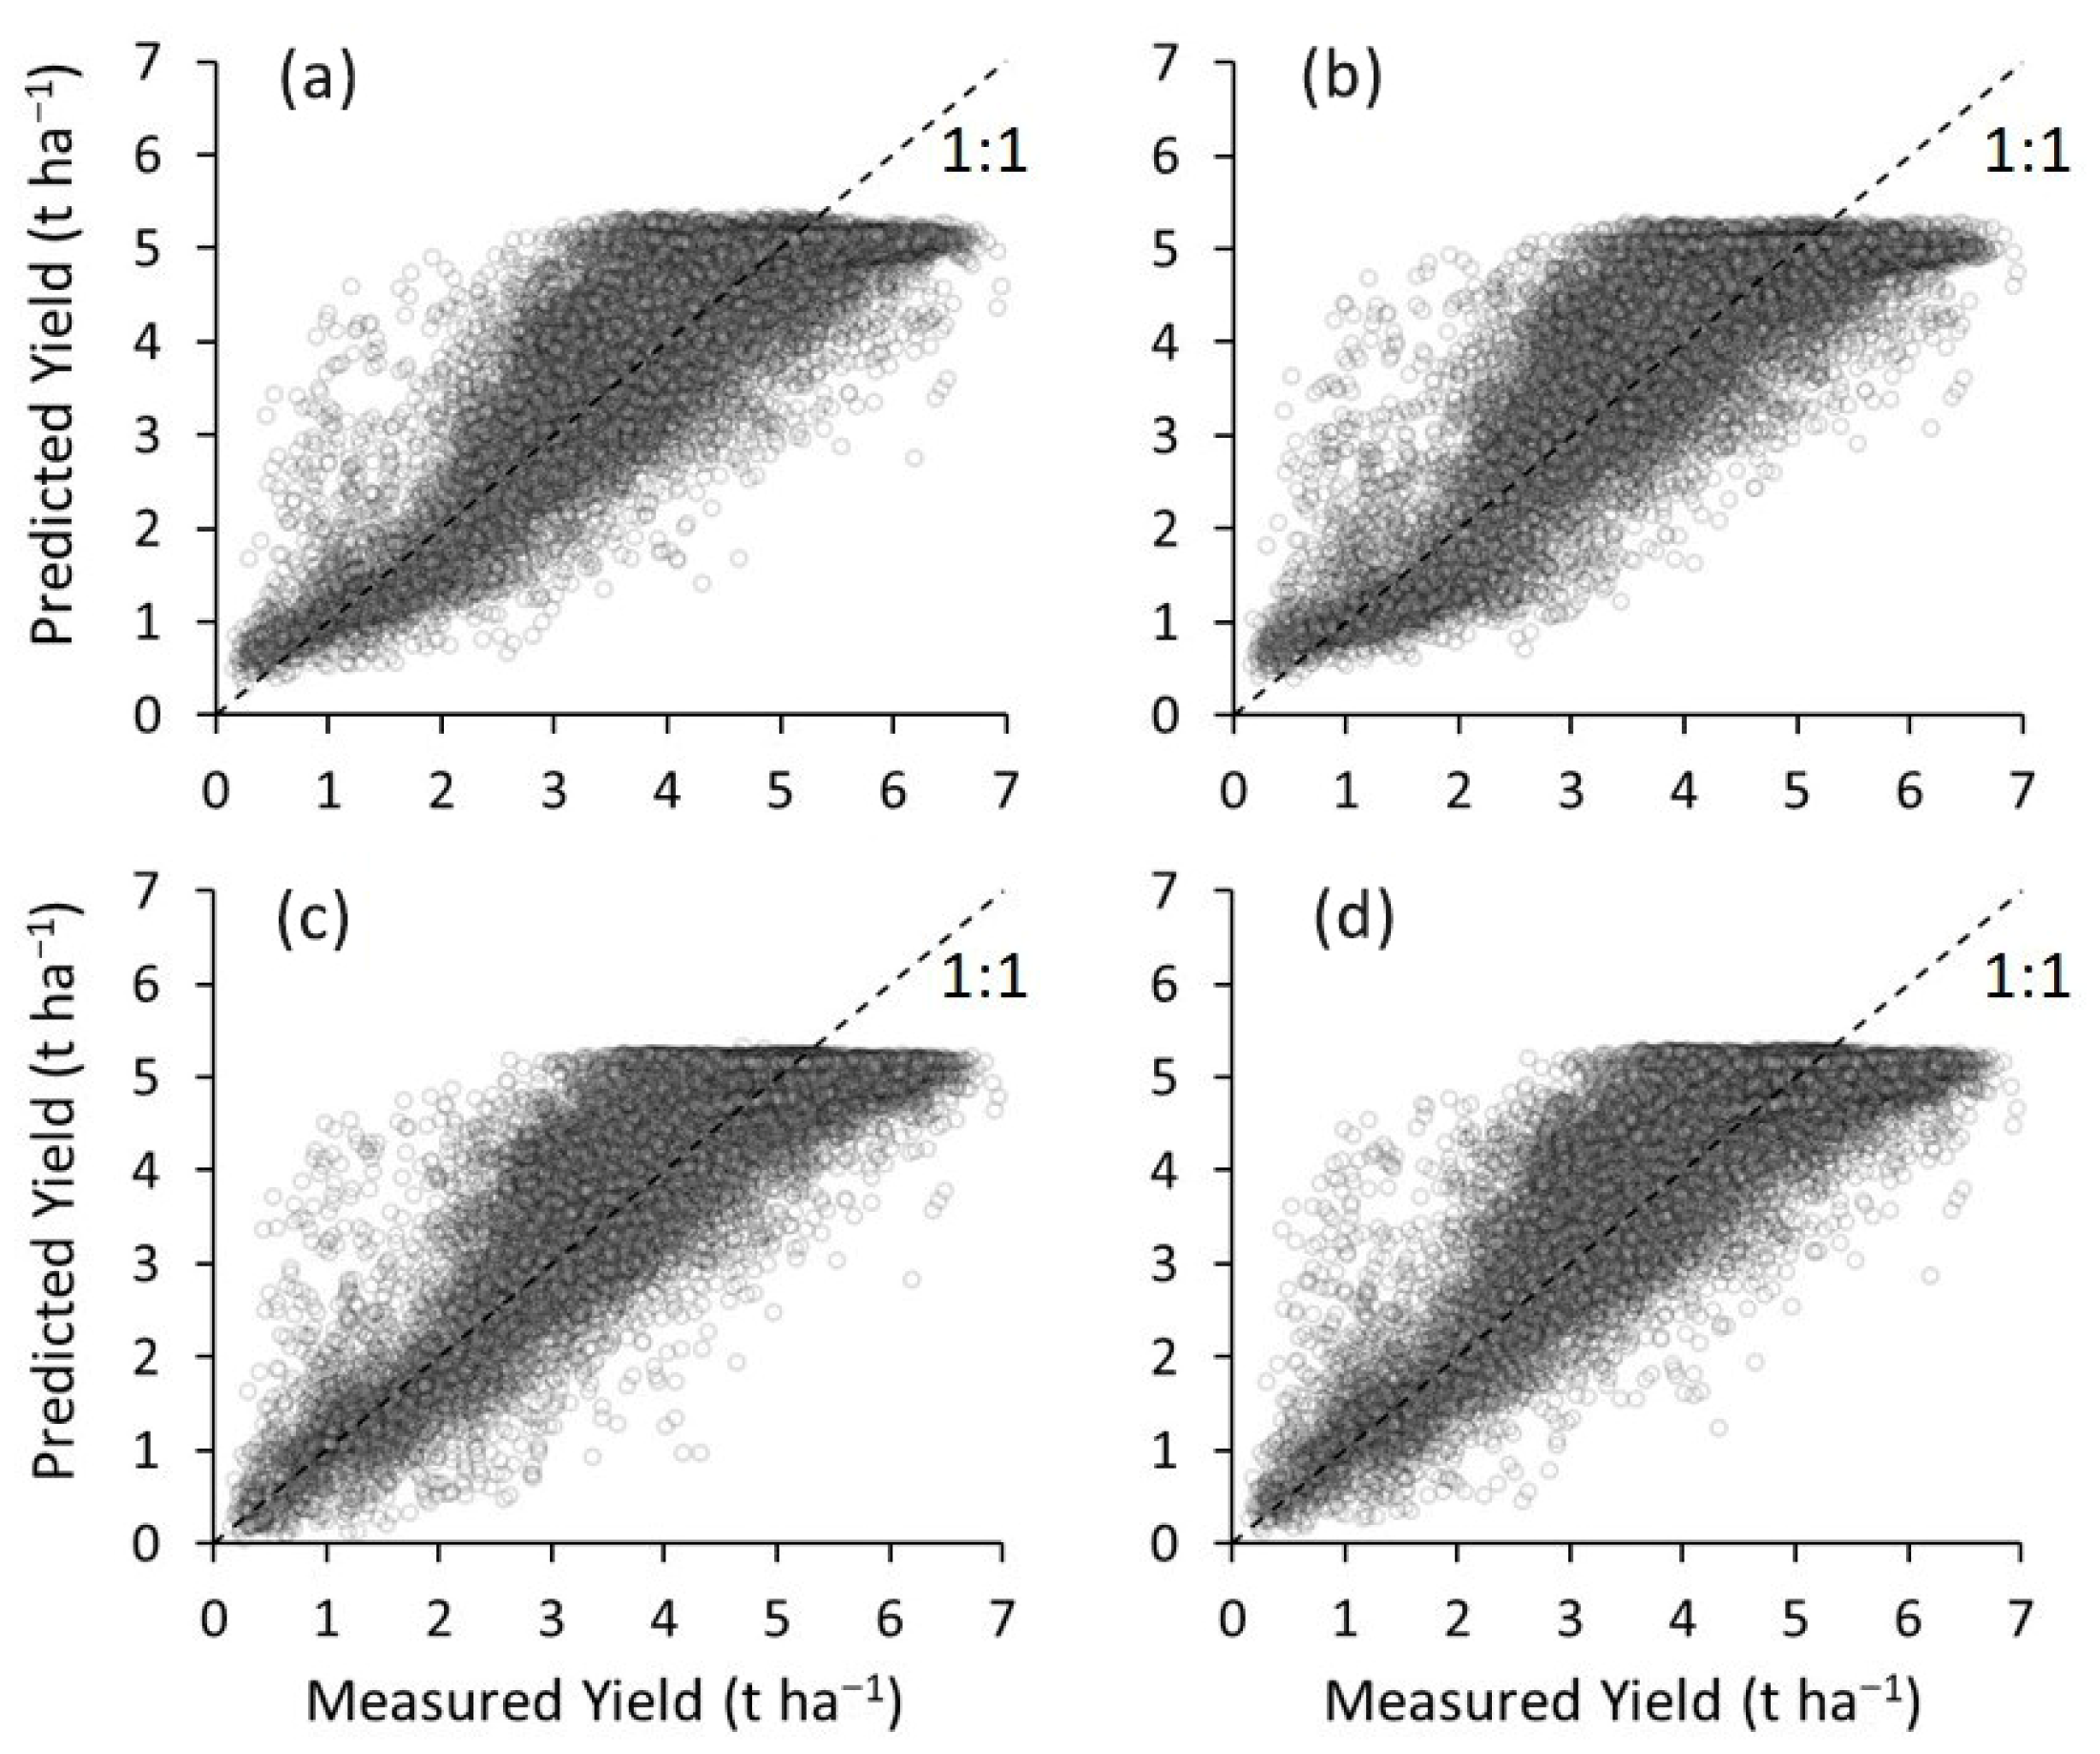
The comparison between measured and predicted cotton yield for the test dataset (15 plot-seasons), based on the selection of one cloud-free image per plot-season from the DAS models (Table 2), is shown in Figure 7. The performance metrics (RMSE, MAE, Bias, and R2) for each VI are summarized in Table 3. The EVI achieved the best performance, with RMSE, MAE, and Bias values of 0.695, 0.542, and 0.03 t ha−1, respectively, and R2 of 0.78, although differences with the other VIs were relatively small. The strong performance observed across all VIs highlights both the robustness of the growth/logistic regression model and the effectiveness of selecting appropriate satellite acquisition dates and DAS interval models.
Figure 7.
Comparison between measured and predicted cotton yield using EVI (a), TVI (b), NDVI (c), and NDRE (d), based on one selected cloud-free image for each plot-season in the test dataset (n = 15), following the DAS model priority order: 90–104, 105–119, 75–89, 120–134, and 135–149. All VI image data were resampled to 40 × 40 m.
Table 3.
Performance metrics (RMSE, MAE, Bias, and R2) for pixel-level cotton yield prediction using EVI, TVI, NDVI, and NDRE in the test dataset (15 plot-seasons).
This pixel-level yield prediction, with an RMSE of approximately 0.7 t ha−1, is consistent with values reported in other studies for soybean and corn [], wheat [,,], and cotton [], which used regression modeling based on VIs alone or combined with environmental and soil covariates at similar spatial scales. Although substantially lower RMSE values have been reported in some studies [,,], these typically correspond to relatively small study areas, where the higher precision of combine harvester yield maps, often generated using a single machine, and the use of high spatial resolution imagery reduce prediction uncertainty. Consequently, these lower RMSE values are not directly comparable to those obtained in broader, more heterogeneous production areas.
The prediction accuracy of yield maps regression models at the pixel scale is highly dependent on the quality of the combine harvester yield maps, which served as the geospatial ground-truth reference for model training and testing []. During the training and testing stages, yield maps of varying quality were identified when processing the data in QGIS. Lower-quality maps were primarily associated with multiple harvesters operating simultaneously, nighttime harvesting under high humidity, and missing sensor calibrations [,].
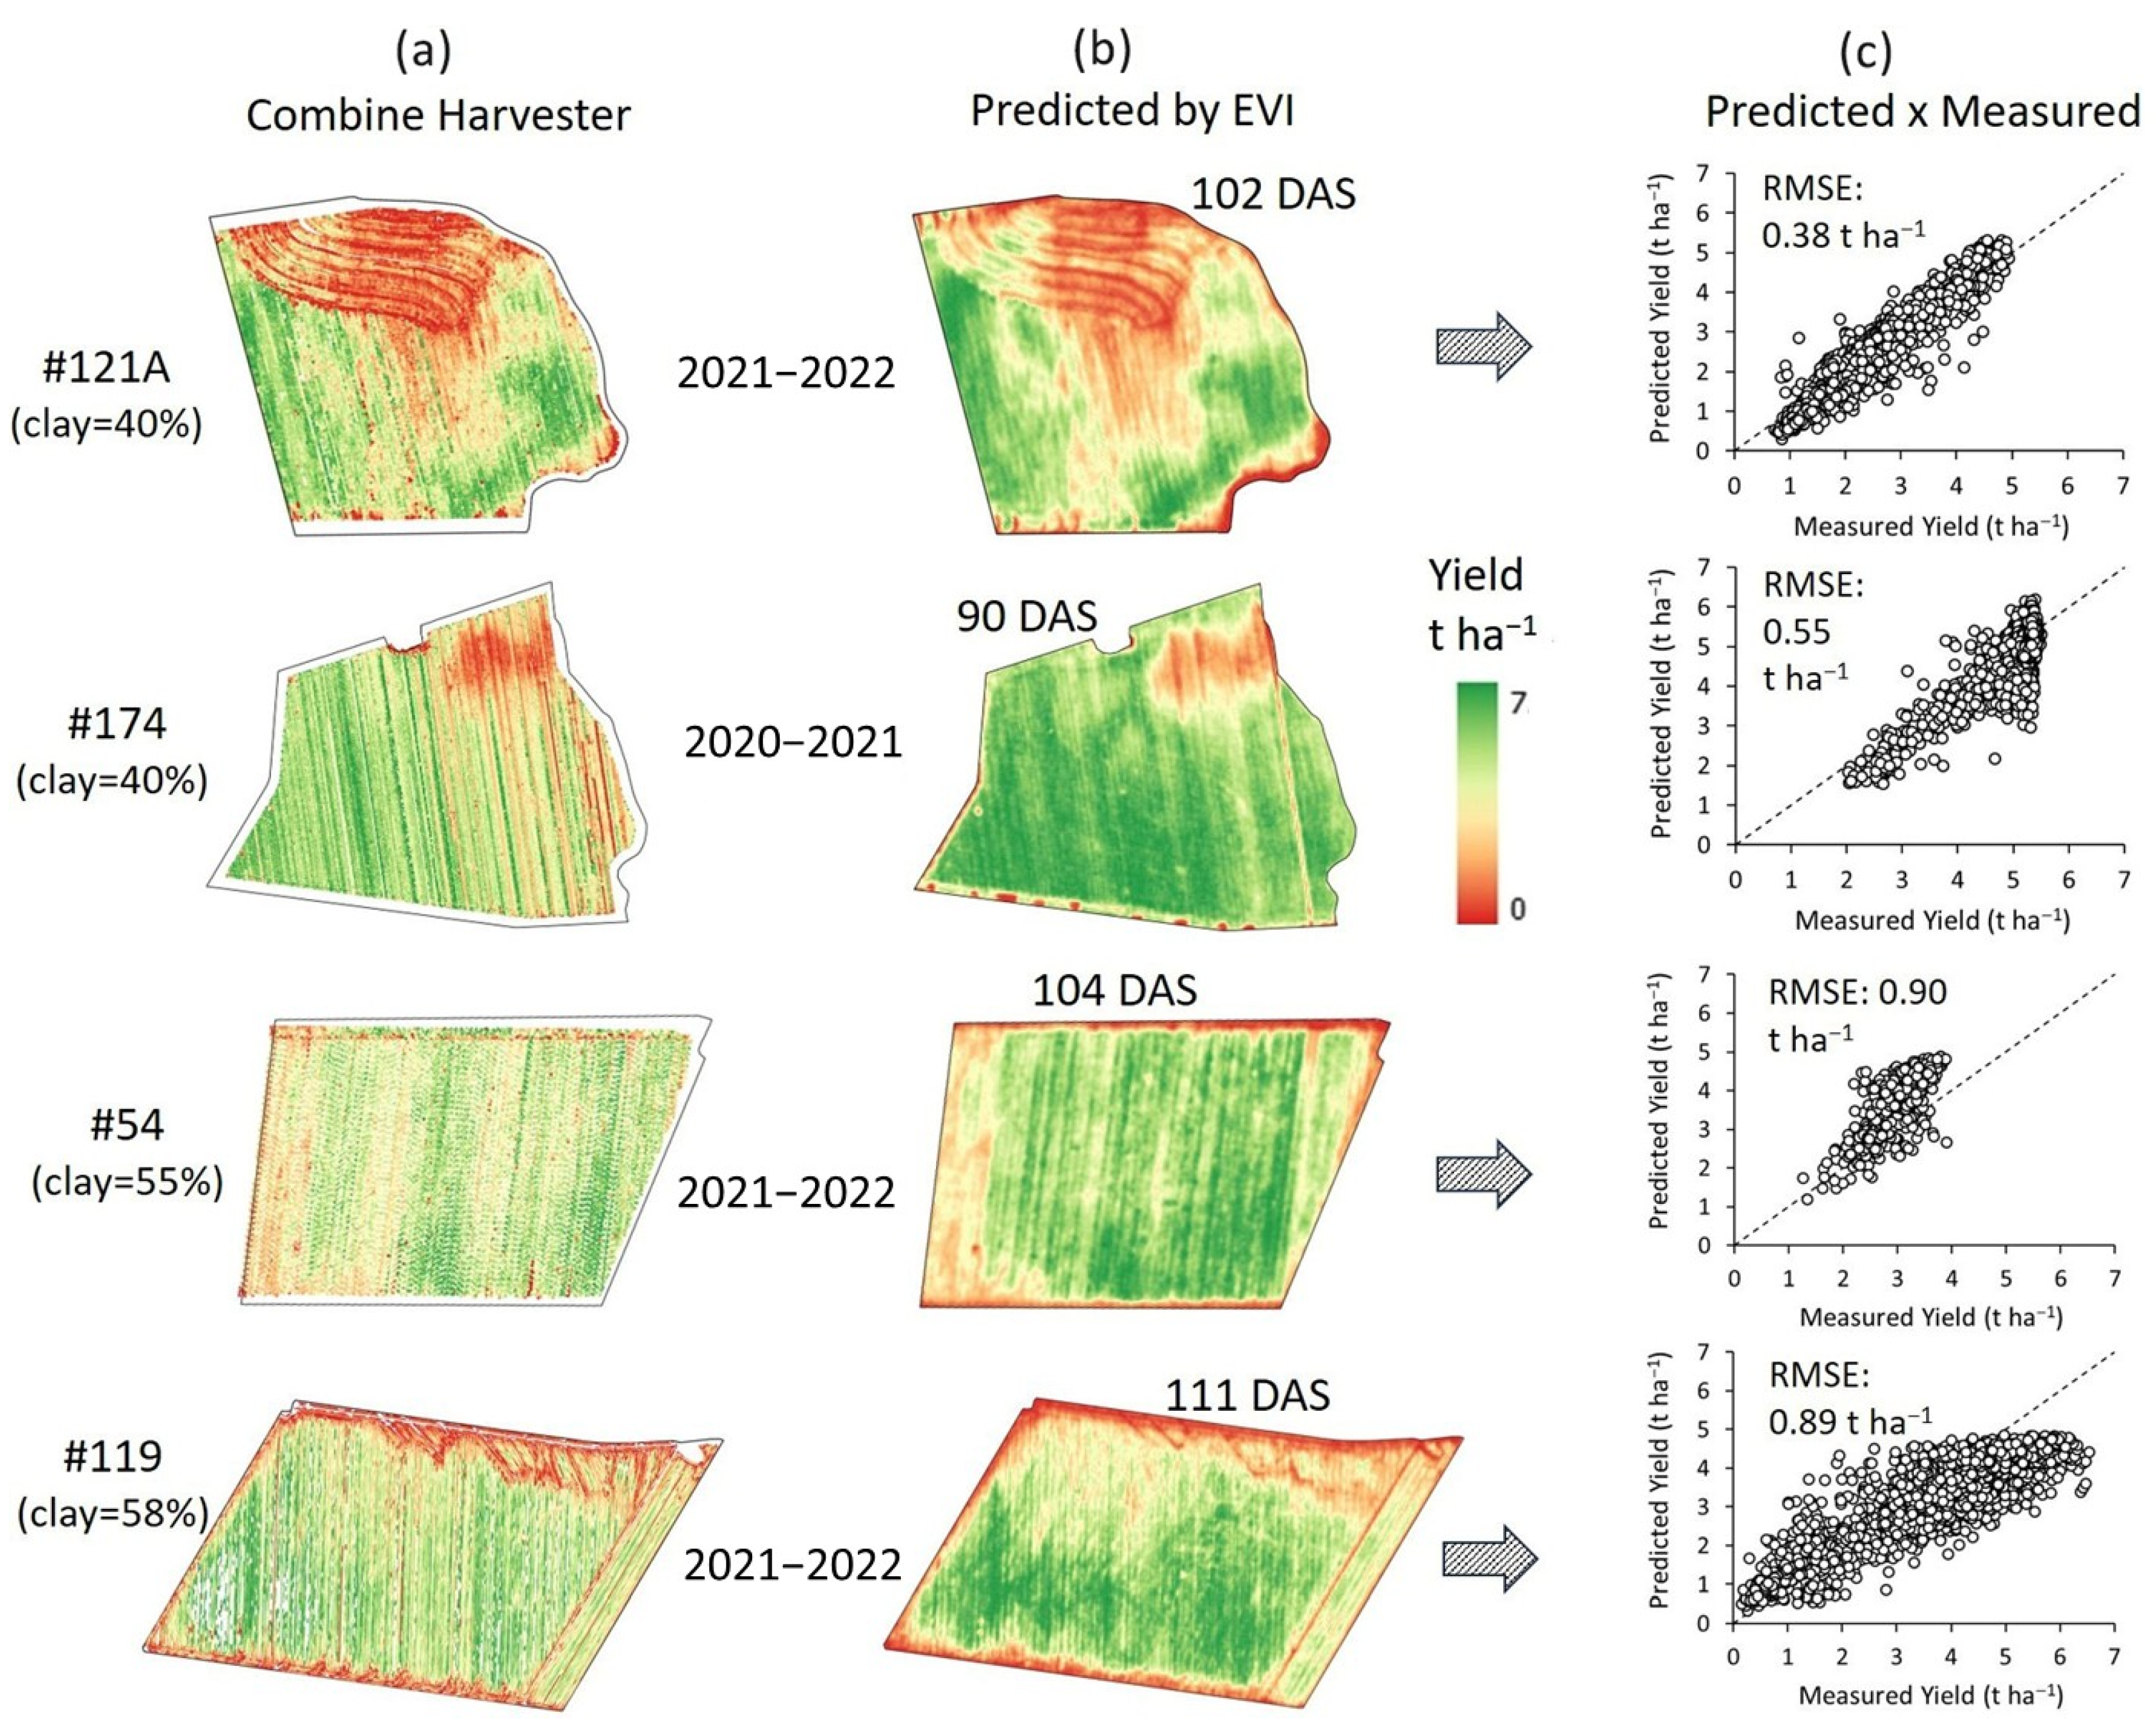
Figure 8 illustrates examples of measured yield maps alongside predicted maps generated with EVI for four plot-seasons, as well as scatterplots comparing measured and predicted data. Overall, the model shows strong agreement with the yield maps obtained from the combine harvester monitor. In the examples, plots 121A and 174 display substantial yield variability (ranging from 1–2 to 4–5 t ha−1), largely driven by the wide variation in clay content within these plots (approximately 10–70%). These plots achieved RMSE values of 0.38 and 0.55 t ha−1, lower than the overall average RMSE (0.695 t ha−1), likely due to the higher quality of the corresponding yield maps. In contrast, plots 54 and 119, which are more homogeneous in clay content (50–70%), show yield variation that appears to be more strongly influenced by climatic conditions and border effects. These plots presented RMSE values above the testing average. Similar findings have been reported in other studies that evaluated pixel-level crop yield prediction using combine harvester data for model training and testing, where substantial differences in prediction accuracy were observed among individual plots/fields [,,]. Although the causes of such discrepancies have not been extensively investigated, it is reasonable to hypothesize that the quality of individual yield maps plays a decisive role in both model training and testing [], especially in studies that rely on on-farm datasets and multiple data sources across broad spatial scales.
Figure 8.
Cotton yield maps from combine harvesters (a), predicted from Sentinel-2 EVI at 10 × 10 m resolution (b), and scatterplots of measured vs. predicted yields on the 40 × 40 m grid (c), for four plots of the testing dataset.
The spatial variability patterns observed in Figure 8 are consistent with the main drivers of within-field yield variability reported in the literature [,,,]. The dominant natural sources of variability include differences in soil texture, especially clay content, which directly affects soil water-holding capacity, nutrient retention, and plant availability. Topographic features also play a key role by influencing surface runoff, erosion, and water redistribution across the landscape. These natural factors frequently interact with anthropogenic influences, such as soil compaction caused by machinery traffic, uneven distribution of agricultural inputs, localized pest and disease incidence, and suboptimal fertilizer management. As a result, within-field yield variability typically reflects complex interactions between soil properties, terrain attributes, and management practices.
To reduce data noise and improve model performance, a resampling procedure to a 40 × 40 m grid was applied. Although aggregation at this coarser spatial resolution improves model fitting and validation statistics by reducing random variability, it may also smooth genuine spatial patterns associated with management practices, microrelief conditions, or localized crop stress. To address this limitation, predicted yield maps were originally generated at the native Sentinel-2 spatial resolution (10 m), as illustrated in Figure 2. These 10 m maps (Figure 8b) preserve fine-scale variability and are suitable for precision agriculture applications such as variable-rate management, management zone delineation, and localized stress diagnostics. The 40 × 40 m resampling was primary applied to ensure consistent comparison with combine-harvester yield data (Figure 7 and Figure 8c) and to improve model accuracy, but the original 10 m resolution predicted yield maps (Figure 8b) should be preferred for precision agriculture applications.
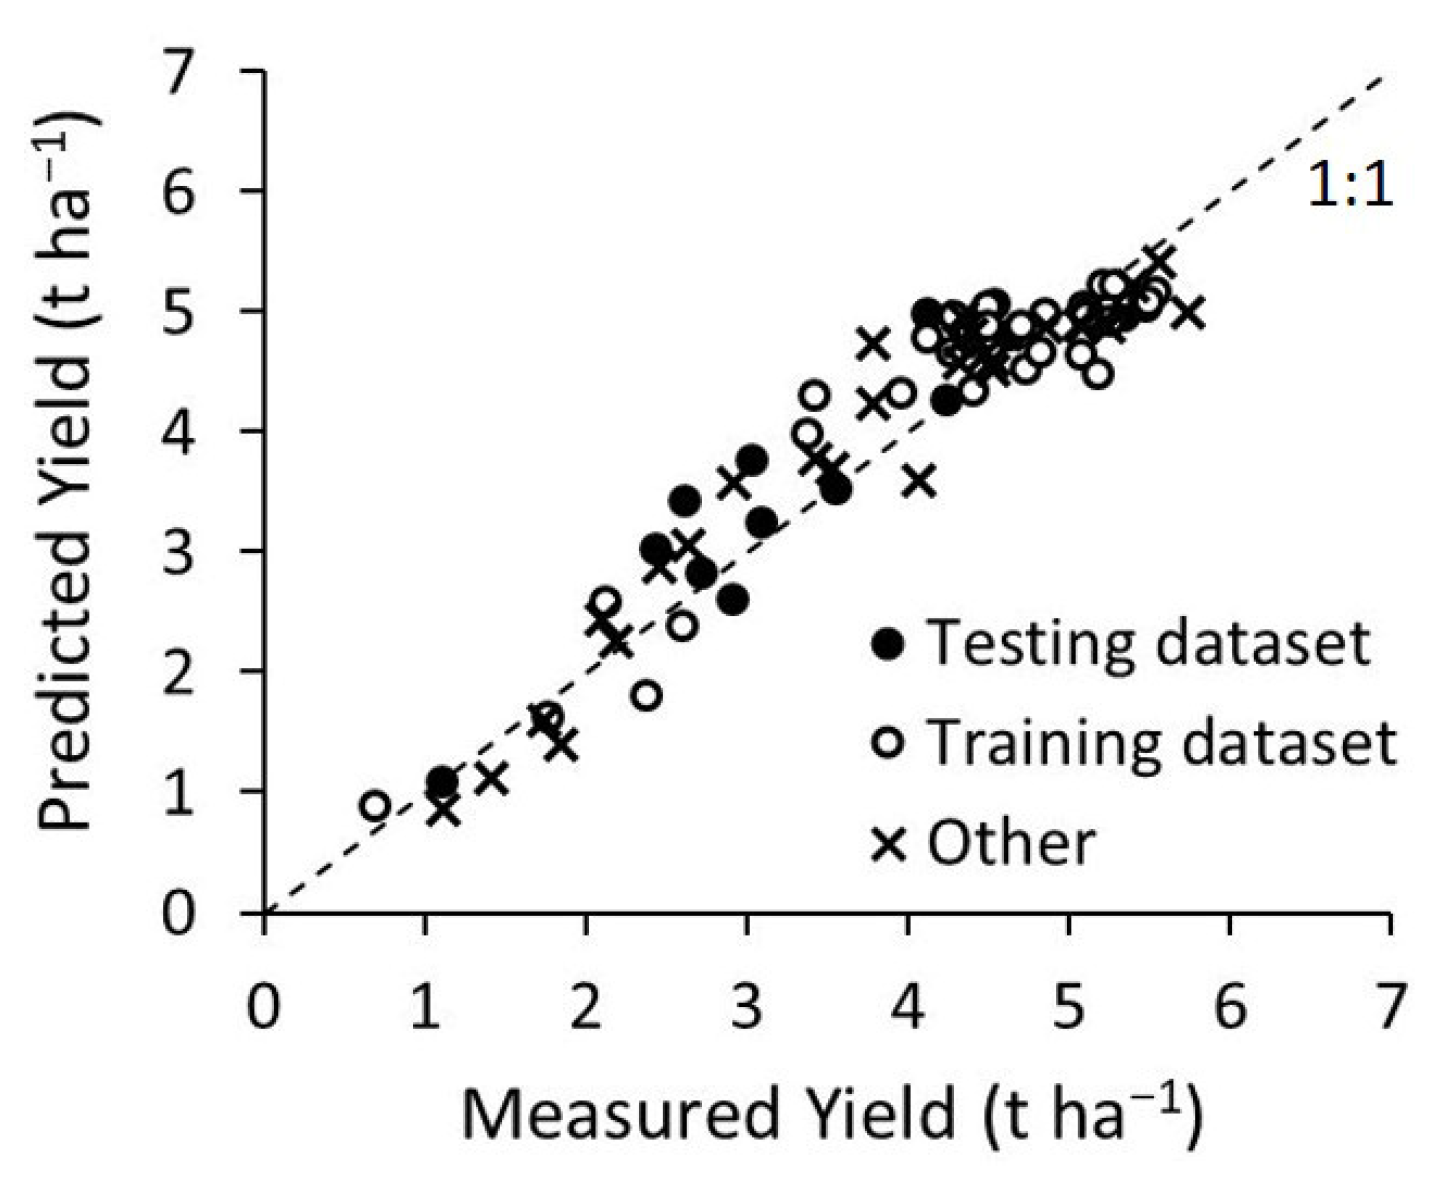
A comparison between measured and predicted yields at the plot scale (mean plot yield) for the entire dataset (76 plot-season combinations) is shown in Figure 9. The results indicate a RMSE of 0.41 t ha−1, which is substantially lower than the pixel-level prediction error (RMSE = 0.695 t ha−1). This improved accuracy at the plot scale likely reflects the fact that average yields were calculated from weight of harvested round cotton modules, whereas yield maps were generated from combine harvester monitors which can exhibit systematic and random errors arising from sensor response lag, flow dynamics in the harvester, calibration drift over time, and differences between machines or harvest conditions [,,,]. At the plot scale, predicted yields showed a slight average overestimation of 0.08 t ha−1 (Bias), while at the pixel scale the Bias was smaller (0.03 t ha−1).
Figure 9.
Comparison between predicted and measured cotton yields at the plot level across all 76 plot-season combinations, including testing (15) and training (35) datasets with combine harvester yield maps, as well as plots where only average plot yield was available.
4. Conclusions
This study demonstrated the feasibility of predicting cotton yield maps in large-scale production systems of the Brazilian Cerrado using Sentinel-2 vegetation indices combined with a logistic growth regression modeling. A grid resampling procedure ensured spatial correspondence between vegetation index layers and yield maps, which improved pixel-level model performance. The approach was evaluated across multiple days-after-sowing (DAS) intervals using EVI, TVI, NDVI, and NDRE. Among these indices, EVI achieved the highest predictive accuracy in the independent test dataset (R2 = 0.78), based on single cloud-free images from 15 plot-seasons. When the optimal vegetation index and DAS interval were selected, yield predictions achieved an RMSE of approximately 0.70 t ha−1 at the pixel scale (relative to combine harvester maps) and 0.41 t ha−1 at the plot scale (relative to average yields derived from cotton module weights).
The proposed method demonstrates the potential of satellite remote sensing as a scalable, cost-effective, and spatially explicit alternative to conventional harvester-based yield monitoring. The 10 m spatial resolution of Sentinel-2 proved adequate for capturing within-field yield variability typical of mechanized cotton systems in the Cerrado. The framework is also adaptable and can be extended to other crops, cultivated from January to August as a second crop after soybean that is cultivated as the first crop in the rainy season, reinforcing its value for precision agriculture applications.
From a practical perspective, remote sensing-based yield prediction enhances decision making for variable-rate input management, within-field zoning, and yield forecasting, particularly where harvester yield maps are unavailable or unreliable. At a broader scale, it offers an operational solution for regional production monitoring, supporting farm management, agribusiness planning, and public policies. These results highlight the growing role of Earth Observation technologies in digital agriculture and demonstrate their potential to complement or substitute traditional yield mapping approaches in large-scale tropical agriculture.
Author Contributions
Conceptualization, C.M.P.V.; Data curation, S.d.C. and E.A.S.; Investigation, C.M.P.V., E.A.S., J.C.F., J.d.M.N. and R.Y.I.; Formal analysis, C.M.P.V., E.A.S., E.J.F., I.d.O.N.L. and S.d.C.; Methodology, C.M.P.V. and E.J.F.; Resources, S.d.C., M.X.S., L.V. and R.G.; Software, E.A.S. and J.d.M.N.; Supervision, C.M.P.V.; Validation, C.M.P.V.; Writing—original draft, C.M.P.V.; Writing—review and editing, C.M.P.V., E.J.F., E.A.S., J.C.F., J.d.M.N., I.d.O.N.L., R.Y.I., M.X.S., L.V. and R.G. All authors have read and agreed to the published version of the manuscript.
Funding
This research was funded by projects Embrapa-Bosch-FAI, SEG: 10.22.00.001, and Embrapa-IMAmt-FAI, SEG: 30.21.90.031.
Data Availability Statement
To verify the possibility of using the data and scripts used in this paper, please contact the corresponding author.
Acknowledgments
The authors would like to thank the Amaggi Group for providing the dataset for this study.
Conflicts of Interest
Author Carlos Manoel Pedro Vaz, Ednaldo José Ferreira, Eduardo Antônio Speranza, Júlio César Franchini, João de Mendonça Naime, Ricardo Yassushi Inamasu and Ivani de Oliveira Negrão Lopes have no received research grants from Brazilian Agricultural Research Corporation. Author Sérgio das Chagas has no received research grants from Amaggi Group, Sapezal. Author Mathias Xavier Schelp and Leonardo Vecchi have no received research grants from Bosch Brazil, Campinas. The authors declare no conflicts of interest.
References
- Blackmore, S.; Godwin, R.J.; Fountas, S. The analysis of spatial and temporal trends in yield map data over six years. Biosyst. Eng. 2003, 84, 455. [Google Scholar] [CrossRef]
- Grisso, R.D.; Alley, M.M.; Thomason, W.E.; Holshouser, D.L.; Roberson, G.T. Precision Farming Tools: Variable-Rate Application; Virginia Cooperative Extension: Blacksburg, VA, USA, 2011; 16p. [Google Scholar]
- Adhikari, K.; Smith, D.R.; Hajda, C.; Kharel, T.P. Within-field yield stability and gross margin variations across corn fields and implications for precision conservation. Precis. Agric. 2023, 24, 1401–1416. [Google Scholar] [CrossRef]
- Speranza, E.A.; Naime, J.M.; Vaz, C.M.P.; dos Santos, J.C.F.; Inamasu, R.Y.; Lopes, I.O.N.; Queirós, L.R.; Rabello, L.M.; Jorge, L.A.C.; Chagas, S.; et al. Delineating management zones with different yield potentials in soybean-corn and soybean-cotton production systems. AgriEngineering 2023, 5, 1481–1497. [Google Scholar] [CrossRef]
- Machado, S.; Bynum, E.D.; Archer, T.L.; Lascano, R.J.; Wilson, L.T.; Bordovsky, J.; Segarra, E.; Bronson, K.; Nesmith, D.M.; Xu, W. Spatial and temporal variability of corn growth and grain yield: Implications for site-specific farming. Crop Sci. 2002, 42, 1564–1576. [Google Scholar] [CrossRef]
- Blackmore, S. The interpretation of trends from multiple yield maps. Comput. Electron. Agric. 2000, 26, 37–51. [Google Scholar] [CrossRef]
- Gauci, A.A.; Fulton, J.P.; Lindsey, A.; Shearer, S.A.; Barker, D.; Hawkins, E.M. Precision of grain yield monitors for use in on—Farm research strip trials. Precis. Agric. 2024, 25, 771–784. [Google Scholar] [CrossRef]
- Wu, B.; Zhang, M.; Zeng, H.; Tian, F.; Potgieter, A.B.; Qin, X.; Yan, N.; Chang, S.; Zhao, Y.; Dong, Q.; et al. Challenges and opportunities in remote sensing-based crop monitoring: A review. Natl. Sci. Rev. 2023, 10, nwac290. [Google Scholar] [CrossRef] [PubMed]
- Gao, F.; Zhang, X. Mapping Crop Phenology in near real-time using satellite remote sensing: Challenges and opportunities. J. Remote Sens. 2021, 2021, 8379391. [Google Scholar] [CrossRef]
- Xue, J.; Su, B. Significant remote sensing vegetation indices: A review of developments and applications. J. Sens. 2017, 2017, 1353691. [Google Scholar] [CrossRef]
- Phiri, D.; Simwanda, M.; Salekin, S.; Nyirenda, V.R.; Murayama, Y.; Ranagalage, M. Sentinel-2 data for land cover/use mapping: A review. Remote Sens. 2020, 12, 2291. [Google Scholar] [CrossRef]
- Li, J.; Chen, B. Global revisit interval analysis of Landsat-8/9 and Sentinel-2A/2B data for terrestrial monitoring. Sensors 2020, 20, 6631. [Google Scholar] [CrossRef] [PubMed]
- Sano, E.E.; Ferreira, L.G.; Asner, G.P.; Steinke, E.T. Spatial and temporal probabilities of obtaining cloud-free Landsat images over the Brazilian tropical savanna. Int. J. Remote Sens. 2007, 28, 2739–2752. [Google Scholar] [CrossRef]
- Lang, P.; Zhang, L.; Huang, C.; Chen, J.; Kang, X.; Zhang, Z.; Tong, Q. Integrating environmental and satellite data to estimate county-level cotton yield in Xinjiang Province. Front. Plant Sci. 2023, 13, 1048479. [Google Scholar] [CrossRef] [PubMed]
- de Siqueira, D.A.B.; Vaz, C.M.P.; da Silva, F.S.; Ferreira, E.J.; Speranza, E.A.; Franchini, J.C.; Galbieri, R.; Belot, J.L.; de Souza, M.; Perina, F.J.; et al. Estimating cotton yield in the Brazilian Cerrado using linear regression models from MODIS vegetation index time series. AgriEngineering 2024, 6, 947–961. [Google Scholar] [CrossRef]
- Johnson, D.M.; Rosales, A.; Mueller, R.; Reynolds, C.; Frantz, R.; Anyamba, A.; Pak, E.; Tucker, C. USA crop yield estimation with MODIS NDVI: Are remotely sensed models better than simple trend analyses? Remote Sens. 2021, 13, 4227. [Google Scholar] [CrossRef]
- He, L.; Mostovoy, G. Cotton yield estimate using Sentinel-2 data and an ecosystem model over the southern US. Remote Sens. 2019, 11, 2000. [Google Scholar] [CrossRef]
- Amin, E.; Pipia, L.; Belda, S.; Perich, G.; Graf, L.V.; Aasen, H.; Wittenberghe, S.V.; Moreno, M.; Verrelst, J. In-season forecasting of within-field grain yield from Sentinel-2 time series data. Int. J. Appl. Earth Obs. Geoinf. 2024, 126, 103636. [Google Scholar] [CrossRef]
- Zhao, Y.; Potgieter, A.B.; Zhang, M.; Wu, B.; Hammer, G.L. Predicting wheat yield at the field scale by combining high-resolution sentinel-2 satellite imagery and crop modelling. Remote Sens. 2020, 12, 1024. [Google Scholar] [CrossRef]
- Hunt, M.L.; Blackburn, G.A.; Carrasco, L.; Redhead, J.W.; Rowland, C.S. High resolution wheat yield mapping using Sentinel-2. Remote Sens. Environ. 2019, 233, 111410. [Google Scholar] [CrossRef]
- Kayad, A.; Sozzi, M.; Gatto, S.; Marinello, F.; Pirotti, F. Monitoring within-field variability of corn yield using sentinel-2 and machine learning techniques. Remote Sens. 2019, 11, 2873. [Google Scholar] [CrossRef]
- Perich, G.; Turkoglu, M.O.; Graf, L.V.; Wegner, J.D.; Aasen, H.; Walter, A.; Liebisch, F. Pixel-based yield mapping and prediction from Sentinel-2 using spectral indices and neural networks. Field Crops Res. 2023, 292, 108824. [Google Scholar] [CrossRef]
- Batistella, D.; Modolo, A.J.; Campos, J.R.R.; Lima, V.A. Comparative analysis of orbital sensors in soybean yield estimation by the random forest algorithm. Ciênc. Agrotec. 2023, 47, e002423. [Google Scholar] [CrossRef]
- Amankulova, K.; Farmonov, N.; Mucsi, L. Time-series analysis of Sentinel-2 satellite images for sunflower yield estimation. Smart Agr. Technol. 2023, 3, 100098. [Google Scholar] [CrossRef]
- Shuai, G.; Basso, B. Subfield maize yield prediction improves when in-season crop water deficit is included in remote sensing imagery-based models. Remote Sens. Environ. 2022, 272, 112938. [Google Scholar] [CrossRef]
- Crusiol, L.G.T.; Nanni, M.R.; Sibaldelli, R.N.R.; Sun, L.; Furlanetto, R.H.; Gonçalves, S.L.; Neumaier, M.; Farias, J.R.B. Early modeling of the upcoming Landsat next constellation for soybean yield prediction under varying levels of water availability. Remote Sens. 2024, 16, 4184. [Google Scholar] [CrossRef]
- Peralta, N.R.; Assefa, Y.; Du, J.; Barden, C.J.; Ciampitti, I.A. Mid-season high-resolution satellite imagery for forecasting site-specific corn yield. Remote Sens. 2016, 8, 848. [Google Scholar] [CrossRef]
- Skakun, S.; Kalecinski, N.I.; Brown, M.G.L.; Johnson, D.M.; Vermote, E.F.; Roger, J.C.; Belen, F. Assessing within-field corn and soybean yield variability from WorldView-3, Planet, Sentinel-2, and Landsat 8 satellite imagery. Remote Sens. 2021, 13, 872. [Google Scholar] [CrossRef]
- Huete, A.; Didan, K.; Miura, T.; Rodriguez, E.P.; Gao, X.; Ferreira, L.G. Overview of the radiometric and biophysical performance of the MODIS vegetation indices. Remote Sens. Environ. 2002, 83, 195–213. [Google Scholar] [CrossRef]
- Broge, N.H.; Leblanc, E. Comparing prediction power and stability of broadband and hyperspectral vegetation indices for estimation of green leaf area index and canopy chlorophyll density. Remote Sens. Environ. 2001, 76, 156–172. [Google Scholar] [CrossRef]
- Rouse, J.W. Monitoring Vegetation Systems in the Great Plains with ERTS. In Proceedings of the Third Earth Resources Technology Satellite-1 Symposium—Volume I: Technical Presentations, NASA SP-351. Washington, DC, USA, 1 January 1974; pp. 309–317. [Google Scholar]
- Barnes, E.M.; Clarke, T.R.; Richards, S.E.; Colaizzi, P.D.; Haberland, J.; Kostrzewski, M.; Waller, P.; Choi, C.; Riley, E.; Thompson, T.; et al. Coincident detection of crop water stress, nitrogen status and canopy density using ground-based multispectral data. In Proceedings of the Fifth International Conference on Precision Agriculture, Bloomington, MN, USA, 16–19 July 2000. [Google Scholar]
- Lorençone, J.A.; Lorençone, P.A.; Aparecido, L.E.O.; Torsoni, G.B.; Rolim, G.S.; Macedo, F.G. The future of cotton in Brazil: Agroclimatic suitability and climate change impacts. AgriEngineering 2025, 7, 198. [Google Scholar] [CrossRef]
- dos Santos, A.; Matos, E.S.; Freddi, O.S.; Galbieri, R.; Lal, R. Cotton production systems in the Brazilian Cerrado: The impact of soil attributes on field-scale yield. Eur. J. Agron. 2020, 118, 126090. [Google Scholar] [CrossRef]
- Ghansah, B.; Landivar Scott, J.L.; Zhao, L.; Starek, M.J.; Foster, J.; Landivar, J.; Bhandari, M. Satellite vs. uncrewed aircraft Systems (UAS): Combining high-resolution SkySat and UAS images for cotton yield estimation. Comput. Electron. Agric. 2025, 234, 110280. [Google Scholar] [CrossRef]
- Alshihabi, O.; Persson, K.; Söderström, M. Easy yield mapping for precision agriculture. Acta Agric. Scand. B 2024, 74, 2411950. [Google Scholar] [CrossRef]
- Fita, D.; Rubio, C.; Franch, B.; Castiñeira-Ibáñez, S.; Tarrazó-Serrano, D.; San Bautista, A. Improving harvester yield maps postprocessing leveraging remote sensing data in rice crop. Precis. Agric. 2025, 26, 33. [Google Scholar] [CrossRef]
- Lyle, G.; Bryan, B.; Ostendorf, B. Post-processing methods to eliminate erroneous grain yield measurements: Review and directions for future development. Precis. Agric. 2014, 15, 377–402. [Google Scholar] [CrossRef]
- Son, N.T.; Chen, C.F.; Chen, C.R.; Minh, V.Q.; Trung, N.H. A Comparative analysis of multitemporal MODIS EVI and NDVI data for large-scale rice yield estimation. Agric. For. Meteorol. 2014, 197, 52–64. [Google Scholar] [CrossRef]
- Kawano, T.; Wallbridge, N.; Plummer, C. Logistic models for simulating the growth of plants by defining the maximum plant size as the limit of information flow. Plant Signal. Behav. 2020, 15, e1709718. [Google Scholar] [CrossRef]
- Eberhardt, I.D.R.; Schultz, B.; Rizzi, R.; Sanches, I.D.; Formaggio, A.R.; Atzberger, C.; Mello, M.P.; Immitzer, M.; Trabaquini, K.; Foschiera, W.; et al. Cloud cover assessment for operational crop monitoring systems in tropical areas. Remote Sens. 2016, 8, 219. [Google Scholar] [CrossRef]
- Echer, F.R.; Galdi, L.V.; Silva, G.R.A.; Santos, J.W.S.; Rocha, C.H.; Cagna, C.P.; Tormena, C.A.; Silva, I.F.; Atarassi, R. Components of high-yielding cotton grown in rain-fed conditions in the Brazilian Cerrado. Agronomy 2024, 14, 2920. [Google Scholar] [CrossRef]
- Oosterhuis, D.M. Growth and development of the cotton plant. In Nitrogen Nutrition in Cotton: Practical Issues; Miley, W.N., Oosterhuis, D.M., Eds.; American Society of Agronomy: Madison, WI, USA, 1990; pp. 1–24. [Google Scholar]
- Liu, J.; Pattey, E.; Jégo, G. Assessment of vegetation indices for regional crop green LAI estimation from Landsat images over multiple growing seasons. Remote Sens. Environ. 2012, 123, 347–358. [Google Scholar] [CrossRef]
- Leo, S.; De Antoni Migliorati, M.; Grace, P.R. Predicting within-field cotton yields using publicly available datasets and machine learning. Agron. J. 2021, 113, 1150–1163. [Google Scholar] [CrossRef]
- Joshi, A.; Pradhan, B.; Gite, S.; Chakraborty, S. Remote-sensing data and deep-learning techniques in crop mapping and yield prediction: A systematic review. Remote Sens. 2023, 15, 2014. [Google Scholar] [CrossRef]
- Wang, H.; Dai, Y.; Yao, Q.; Ma, L.; Zhang, Z.; Lv, X. Multi-task learning model driven by climate and remote sensing data collaboration for mid-season cotton yield prediction. Field Crops Res. 2025, 333, 110070. [Google Scholar] [CrossRef]
- Singh, R.; Kaur, S.; Joshi, D.R.; Iboyi, J.; Dar, E.; Sharma, L.K.; Singh, H. Estimating cotton biomass and nitrogen content using high-resolution satellite and UAV data fusion with machine learning. Smart Agric. Technol. 2025, 12, 101191. [Google Scholar] [CrossRef]
- Kharel, T.P.; Swink, S.N.; Maresma, Á.; Youngerman, C.; Kharel, D.; Czymmek, K.J.; Ketterings, Q.M. Yield monitor data cleaning is essential for accurate corn grain and silage yield determination. Agron. J. 2019, 111, 509–516. [Google Scholar] [CrossRef]
- José, J.V.; Freitas, K.C.d.S.; Costa, J.d.O.; Quiloango-Chimarro, C.A.; Bonfim-Silva, E.M.; Silva, T.J.d.A. Caracterização do cultivo de algodão: Considerações espaço-temporais para o estado de Mato Grosso. Rev. Bras. Eng. Biossistemas 2022, 16, e1097. [Google Scholar]
- Ge, Y.; Thomasson, J.A.; Sui, R.; Morgan, C.L.S. A module-specific post-processing calibration method to improve cotton yield mapping. Comput. Electron. Agric. 2009, 68, 161–167. [Google Scholar] [CrossRef]
- Vellidis, G.; Perry, C.D.; Rains, G.C.; Thomas, D.L.; Wells, N.; Kvien, C.K. Simultaneous assessment of cotton yield monitors. Appl. Eng. Agric. 2003, 19, 259–272. [Google Scholar] [CrossRef]
- Maldaner, L.F.; Molin, J.P.; Spekken, M. Methodology to filter out outliers in high spatial density data to improve maps reliability. Sci. Agric. 2022, 79, e20200178. [Google Scholar] [CrossRef]
Disclaimer/Publisher’s Note: The statements, opinions and data contained in all publications are solely those of the individual author(s) and contributor(s) and not of MDPI and/or the editor(s). MDPI and/or the editor(s) disclaim responsibility for any injury to people or property resulting from any ideas, methods, instructions or products referred to in the content. |
© 2025 by the authors. Licensee MDPI, Basel, Switzerland. This article is an open access article distributed under the terms and conditions of the Creative Commons Attribution (CC BY) license (https://creativecommons.org/licenses/by/4.0/).