

Alpha-EIOU-YOLOv8: An Improved Algorithm for Rice Leaf Disease Detection
 , and
, and
Abstract
1. Introduction
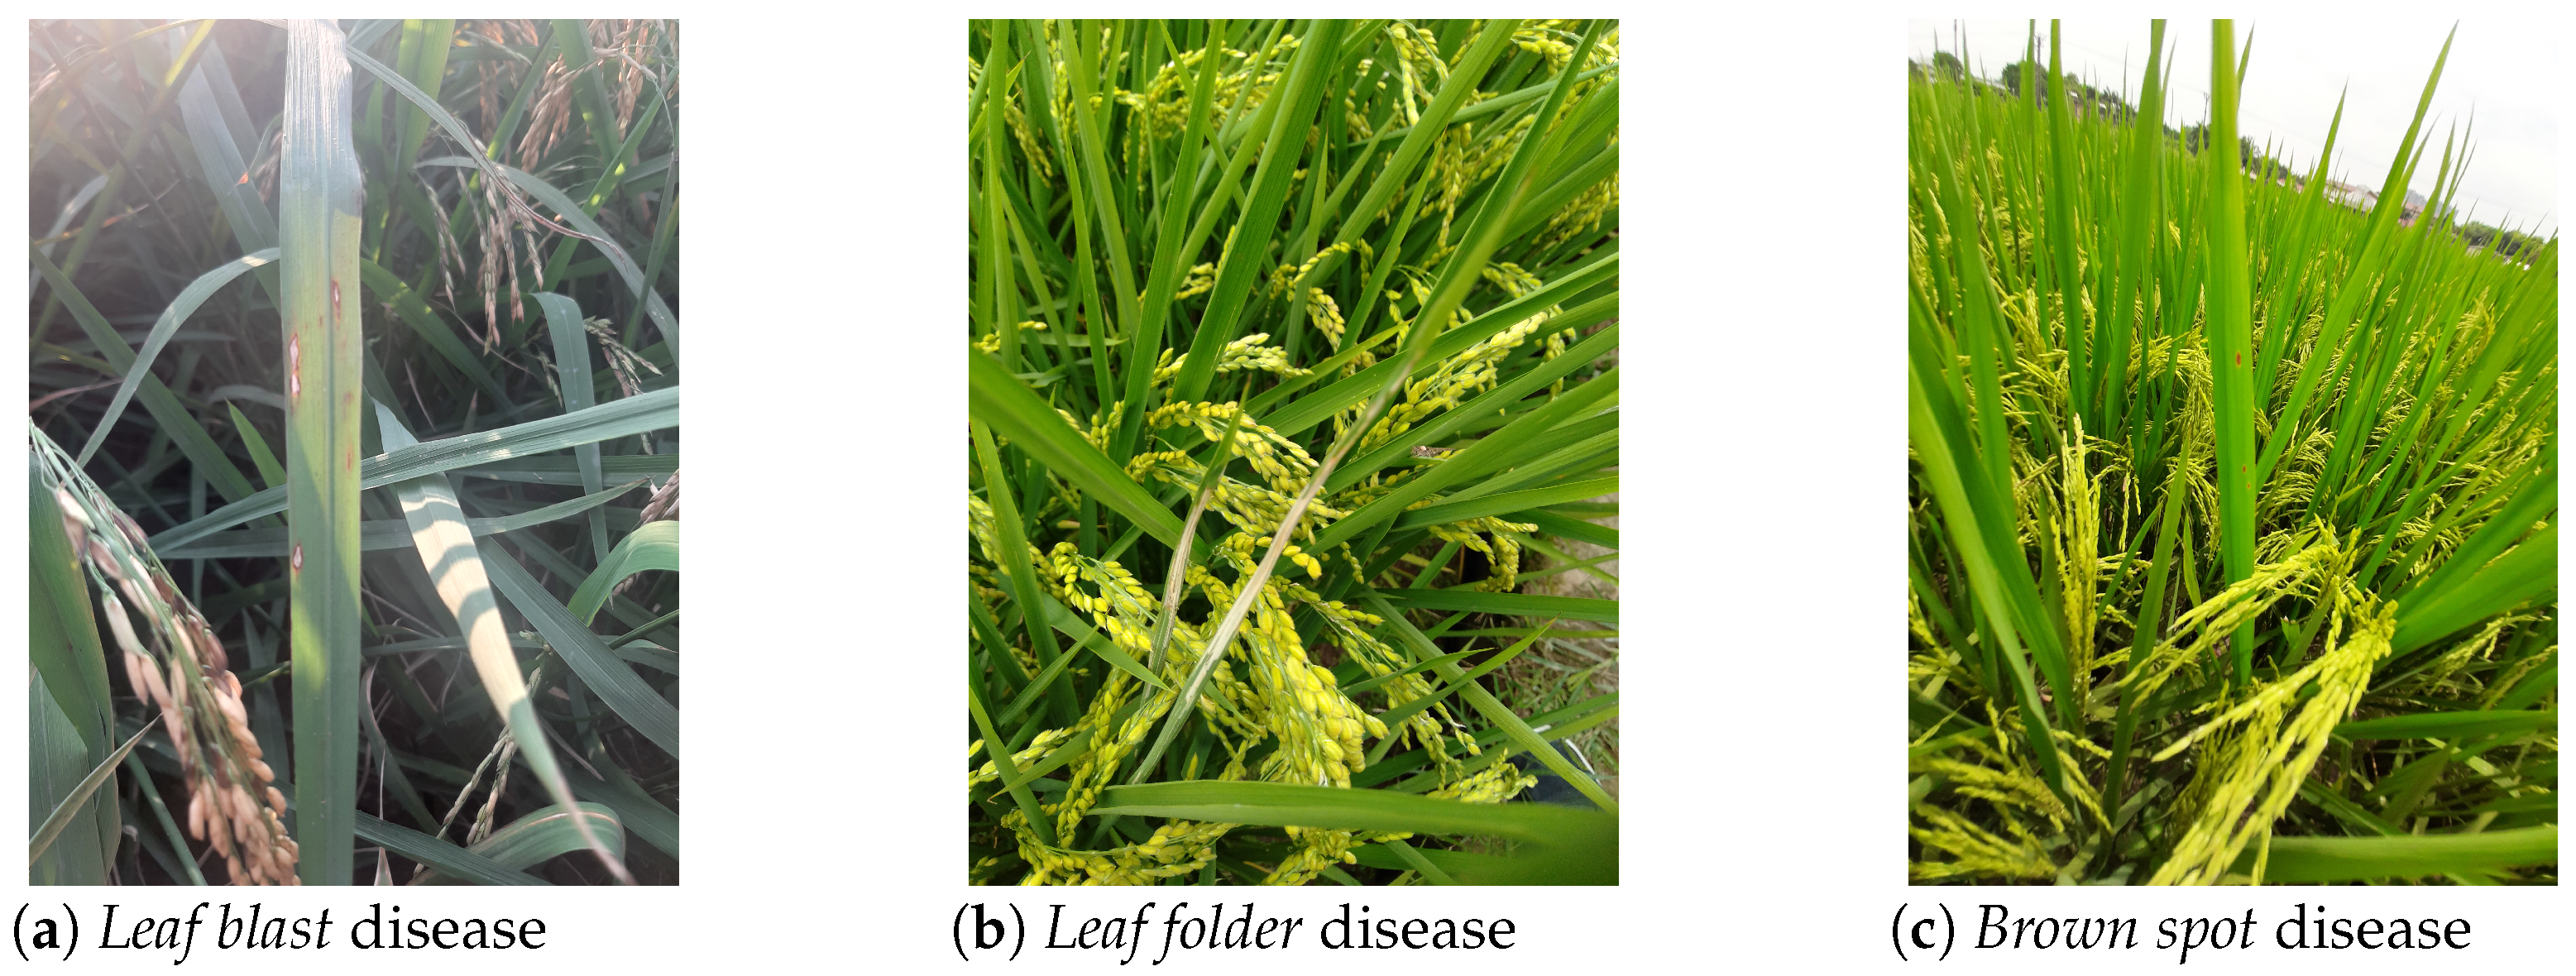
1.1. Leaf Blast
1.2. Leaf Folder
1.3. Brown Spot
2. Materials and Methods
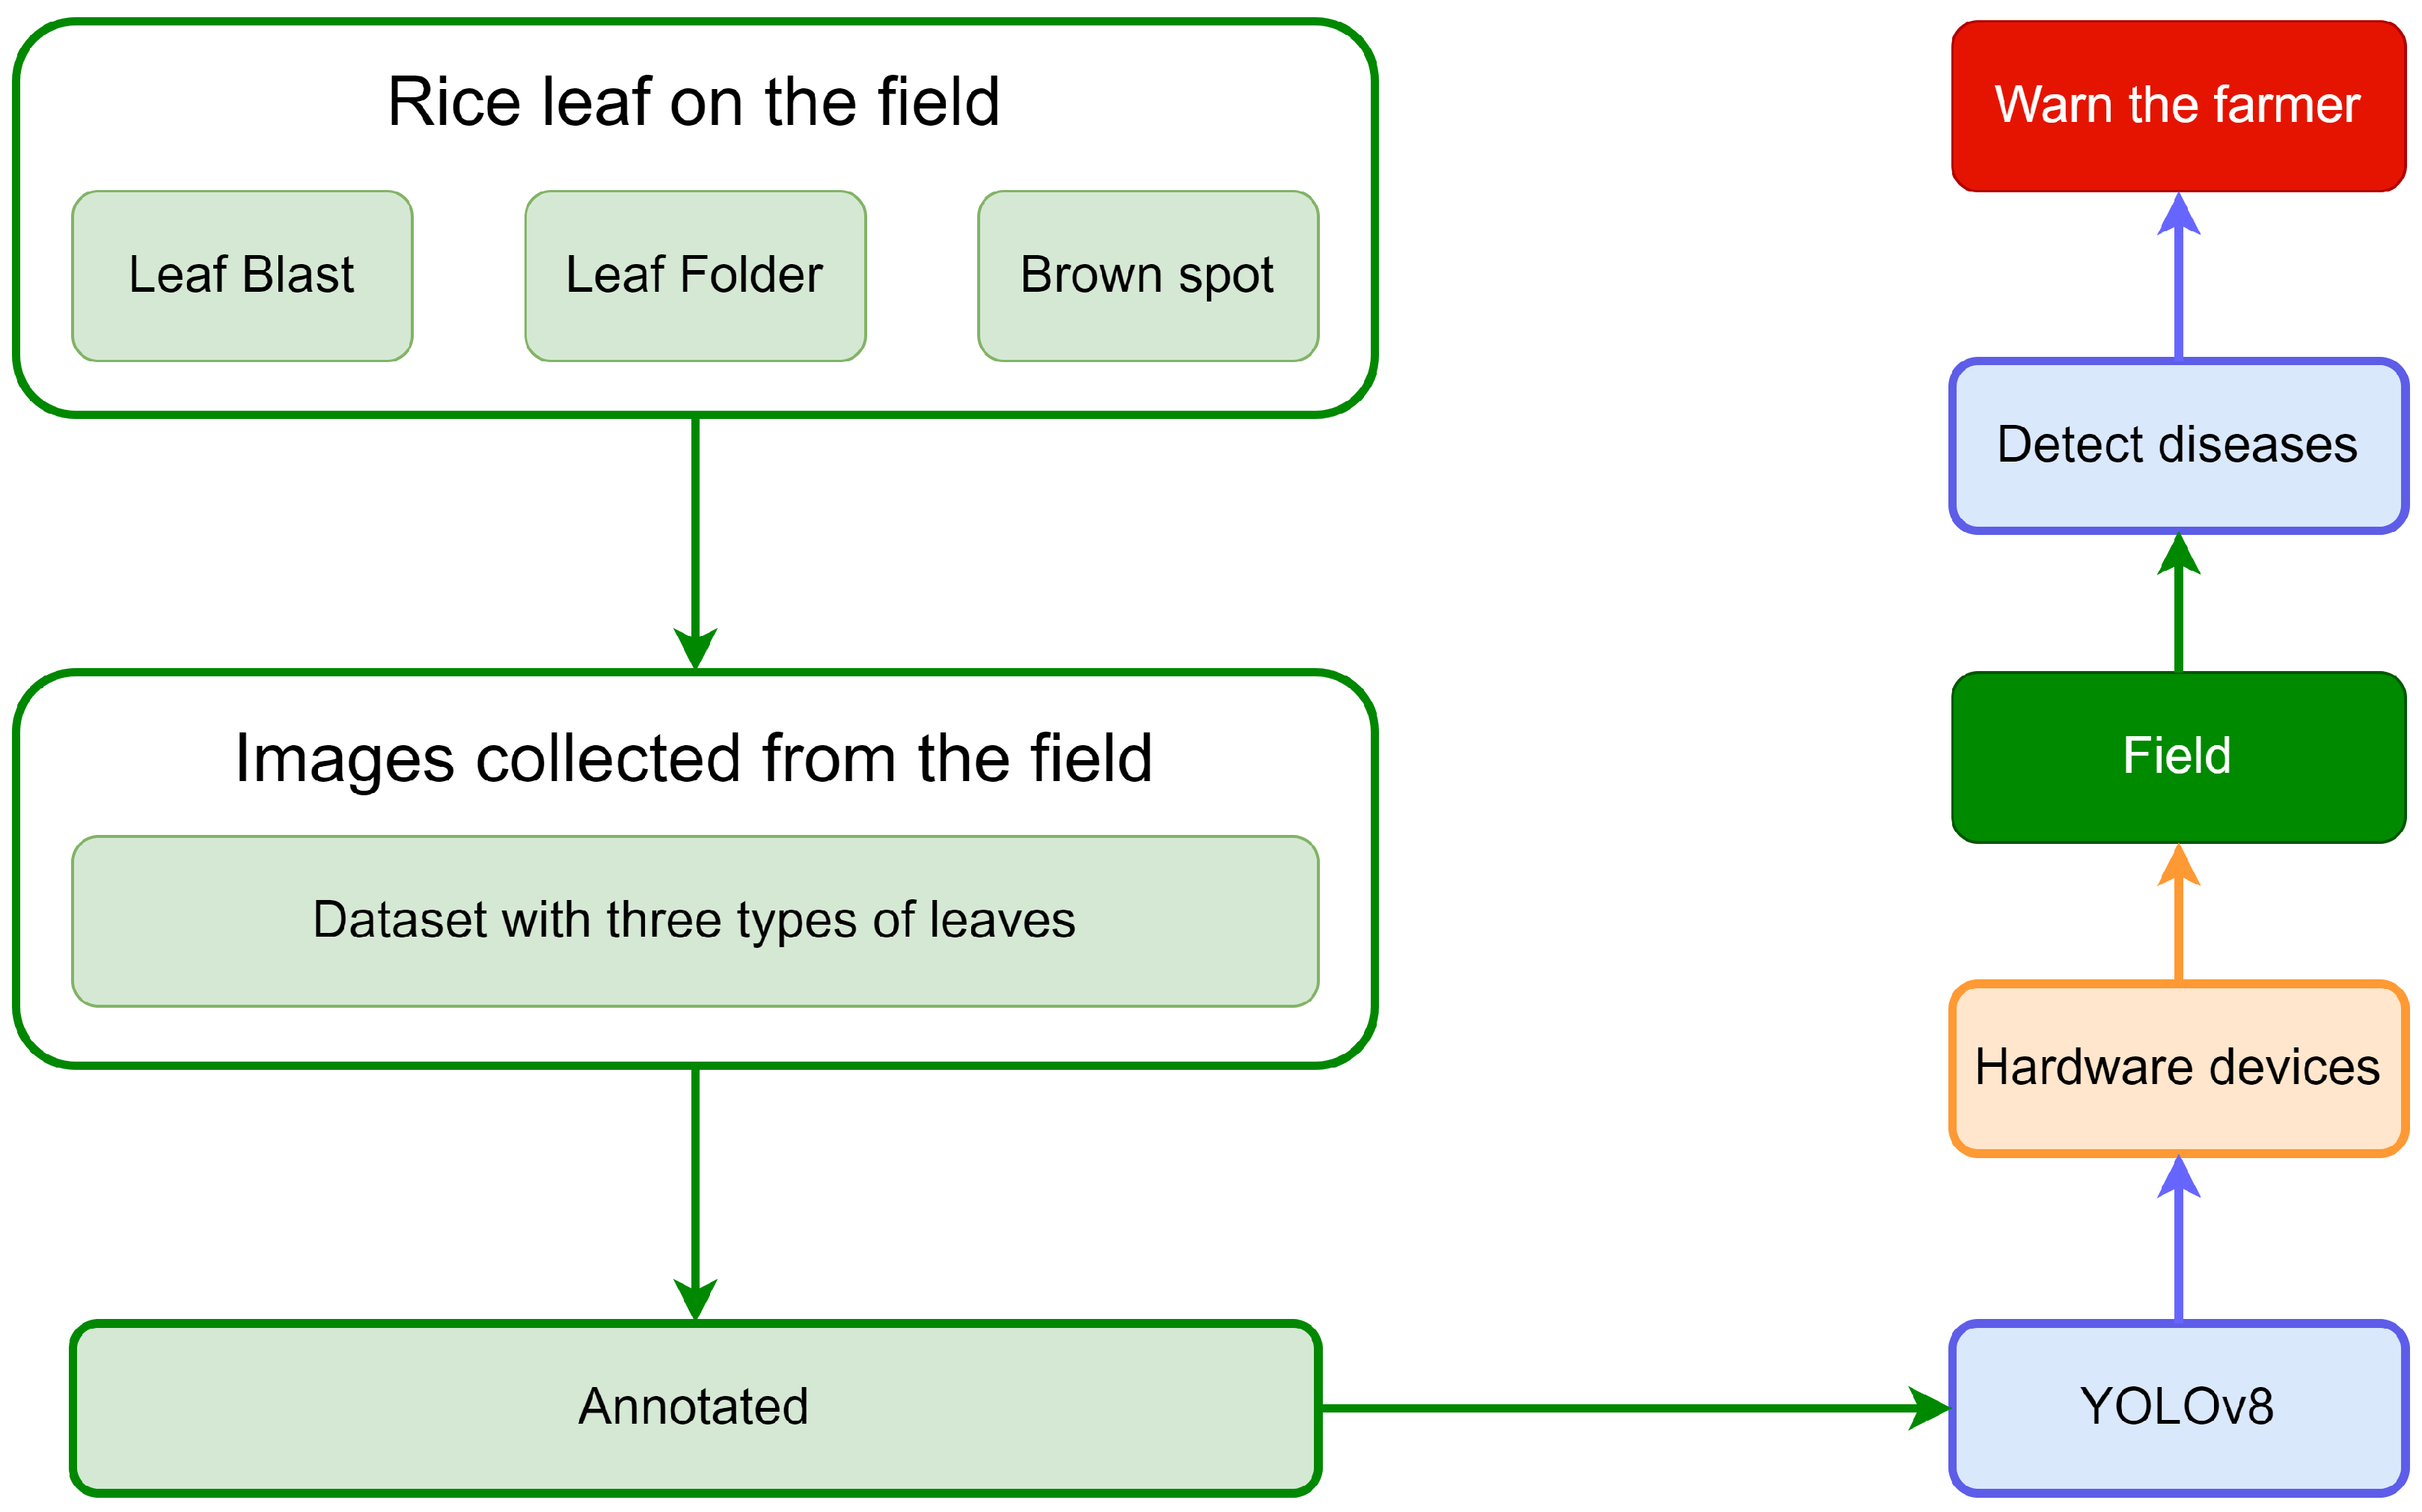
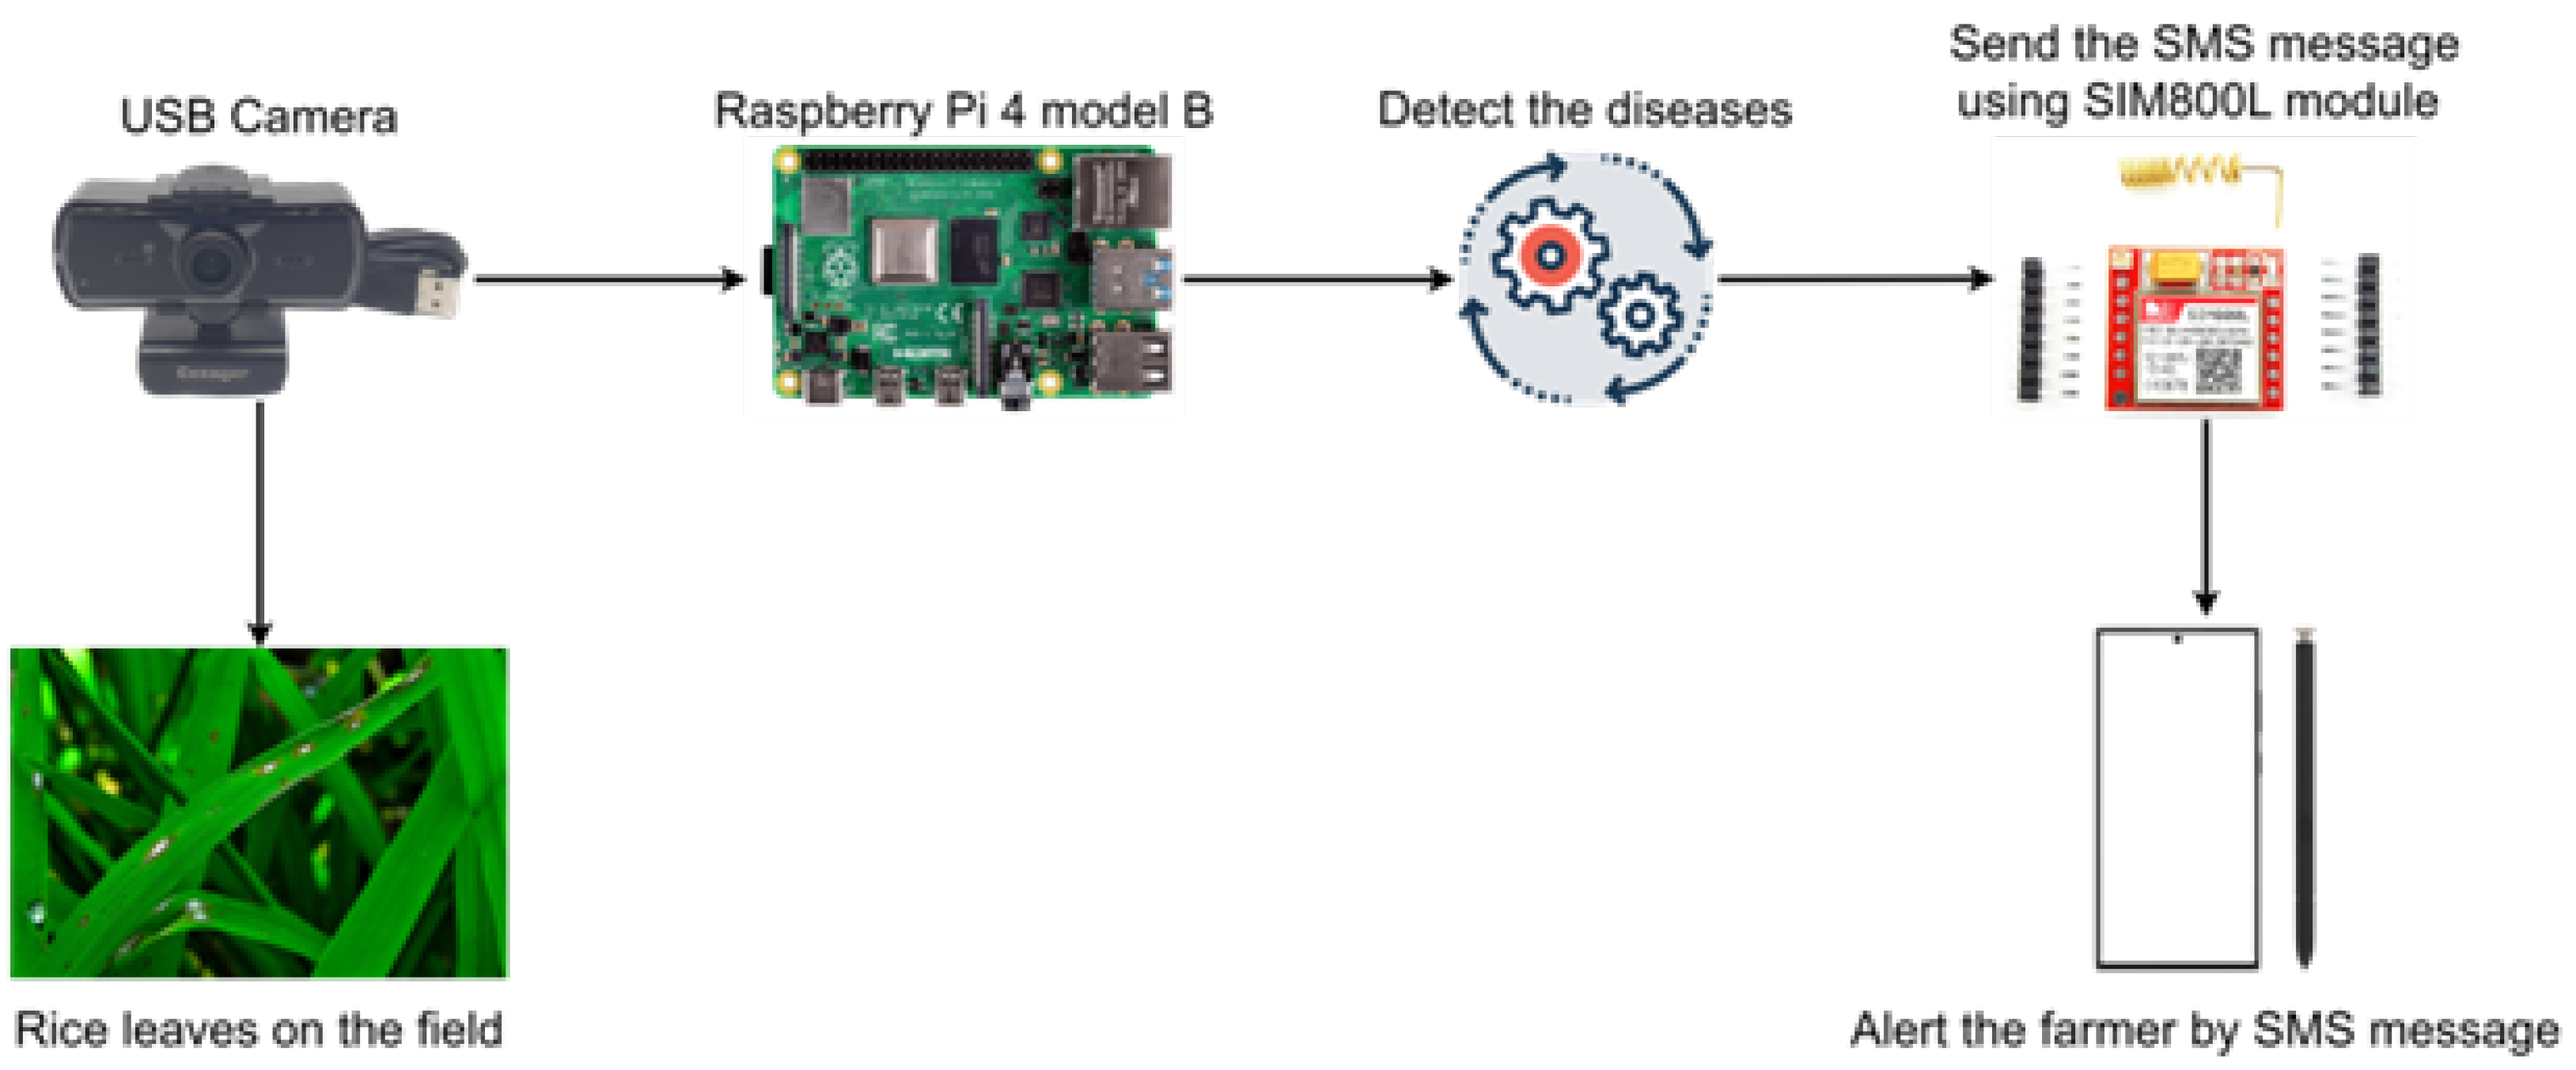
2.1. System Overview
2.2. System Hardware Design
2.3. Data Preparation
2.3.1. Image Collection
2.3.2. Dataset Splitting
2.3.3. Data Augmentation
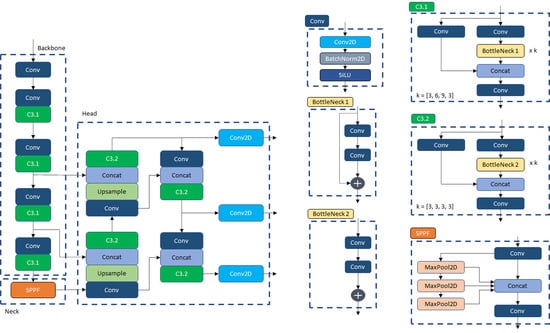
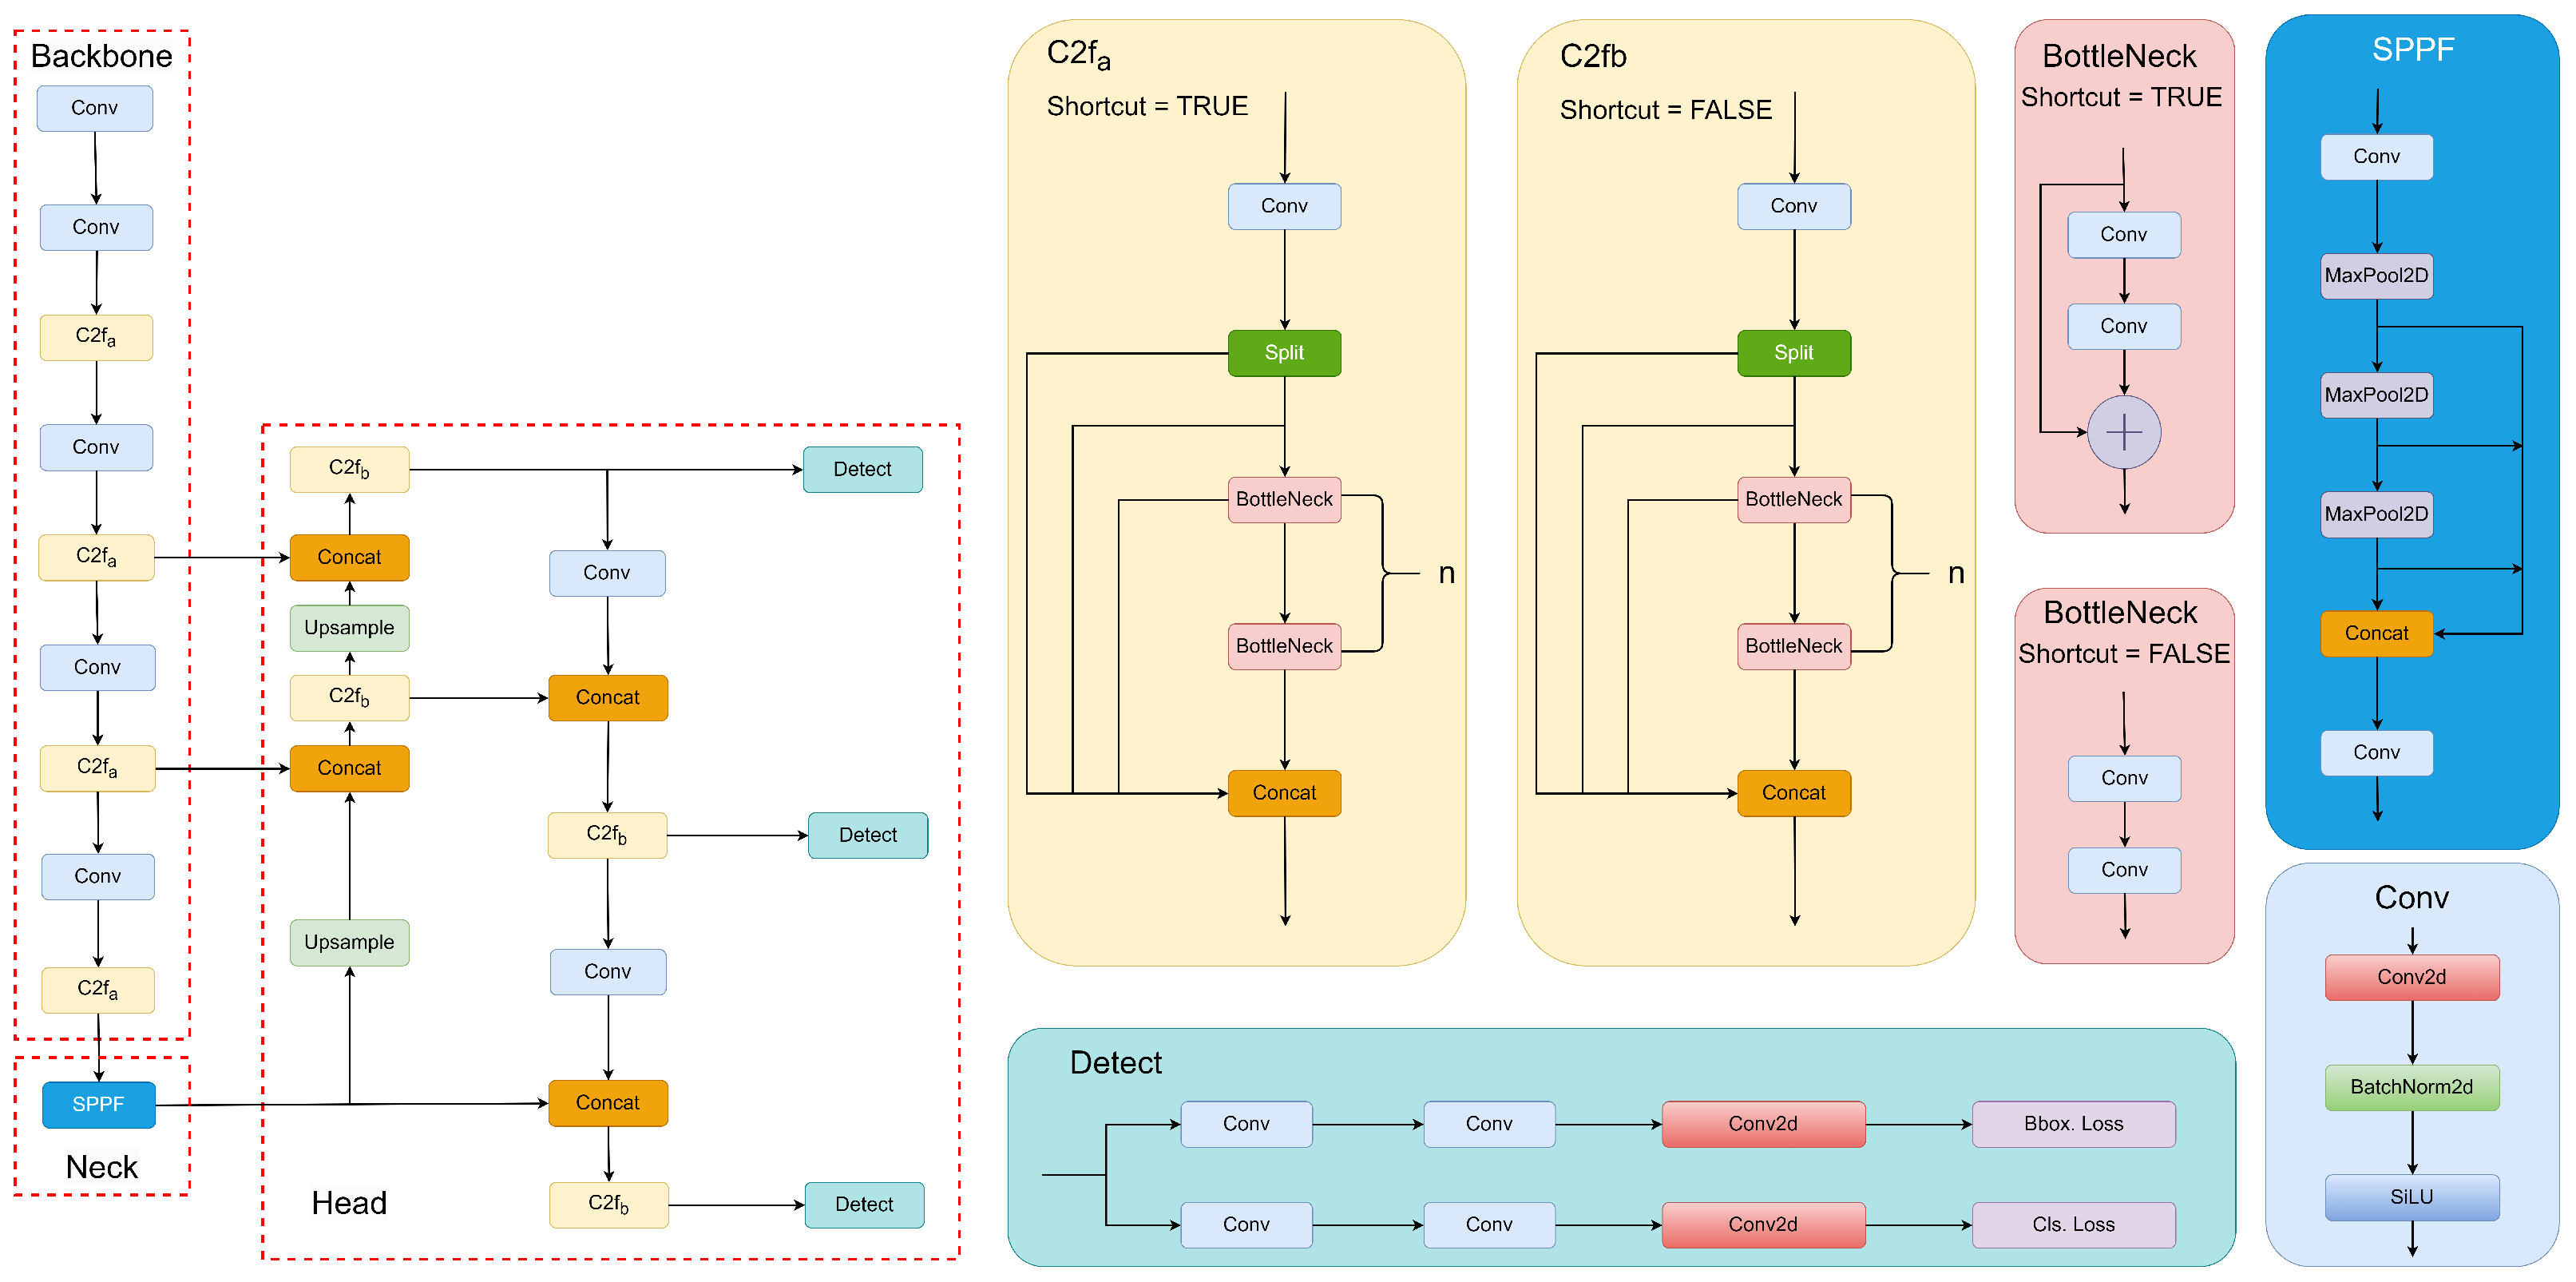
2.4. YOLOv8 Architecture
2.4.1. Overview
2.4.2. Backbone
2.4.3. Neck
2.4.4. Head
2.5. Metrics
2.6. Loss
2.6.1. Classification Loss
2.6.2. Loss Calculation
- c: class number, in this case, , otherwise ;
- : weight of the positive answer for class c;
- N: the batch size;
- n: number of samples in a batch;
- : positive class relates to that logit, while represents that for a negative class.
2.6.3. Box Loss
2.6.4. DFL Loss
2.7. Loss
2.7.1. Efficient IoU Loss
- v does not represent the relation between w and or h and ; instead, it represents the difference between their aspect ratios. In cases where , we will have , which is inconsistent with reality. Because of this, the loss function will only try to increase the similarity of the aspect ratio, rather than decrease the discrepancy between and ;
- The gradient of v with respect to w and h can be demonstrated as:With the second equation, it is easy to see that if w is increased, then h will decrease and vice versa. According to the author, it is unreasonable when and or and . To solve the above problem, the authors have suggested a new version of IoU loss, which is EIoU. The loss function is computed in Equation (15).
2.7.2. Alpha-IoU Loss
- The loss re-weighting: with and ;
- will adaptively down-weight and up-weight the relative loss of all objects according to their IoUs when and , respectively. When , the reweighting factor increases monotonically with the increase in IoU ( decays from 1 to ). In other words, with , the model will focus more on one high-IoU object;
- The loss gradient reweighting: with the turning point at when and if . When , the above reweighting factor increases monotonically with the increase in IoU, while decreasing monotonically with the increase in IoU when . In other words, with helps detectors learn faster on high-IoU objects.
2.7.3. Alpha-EIoU Loss
3. Results and Discussion
3.1. Parameter Setting
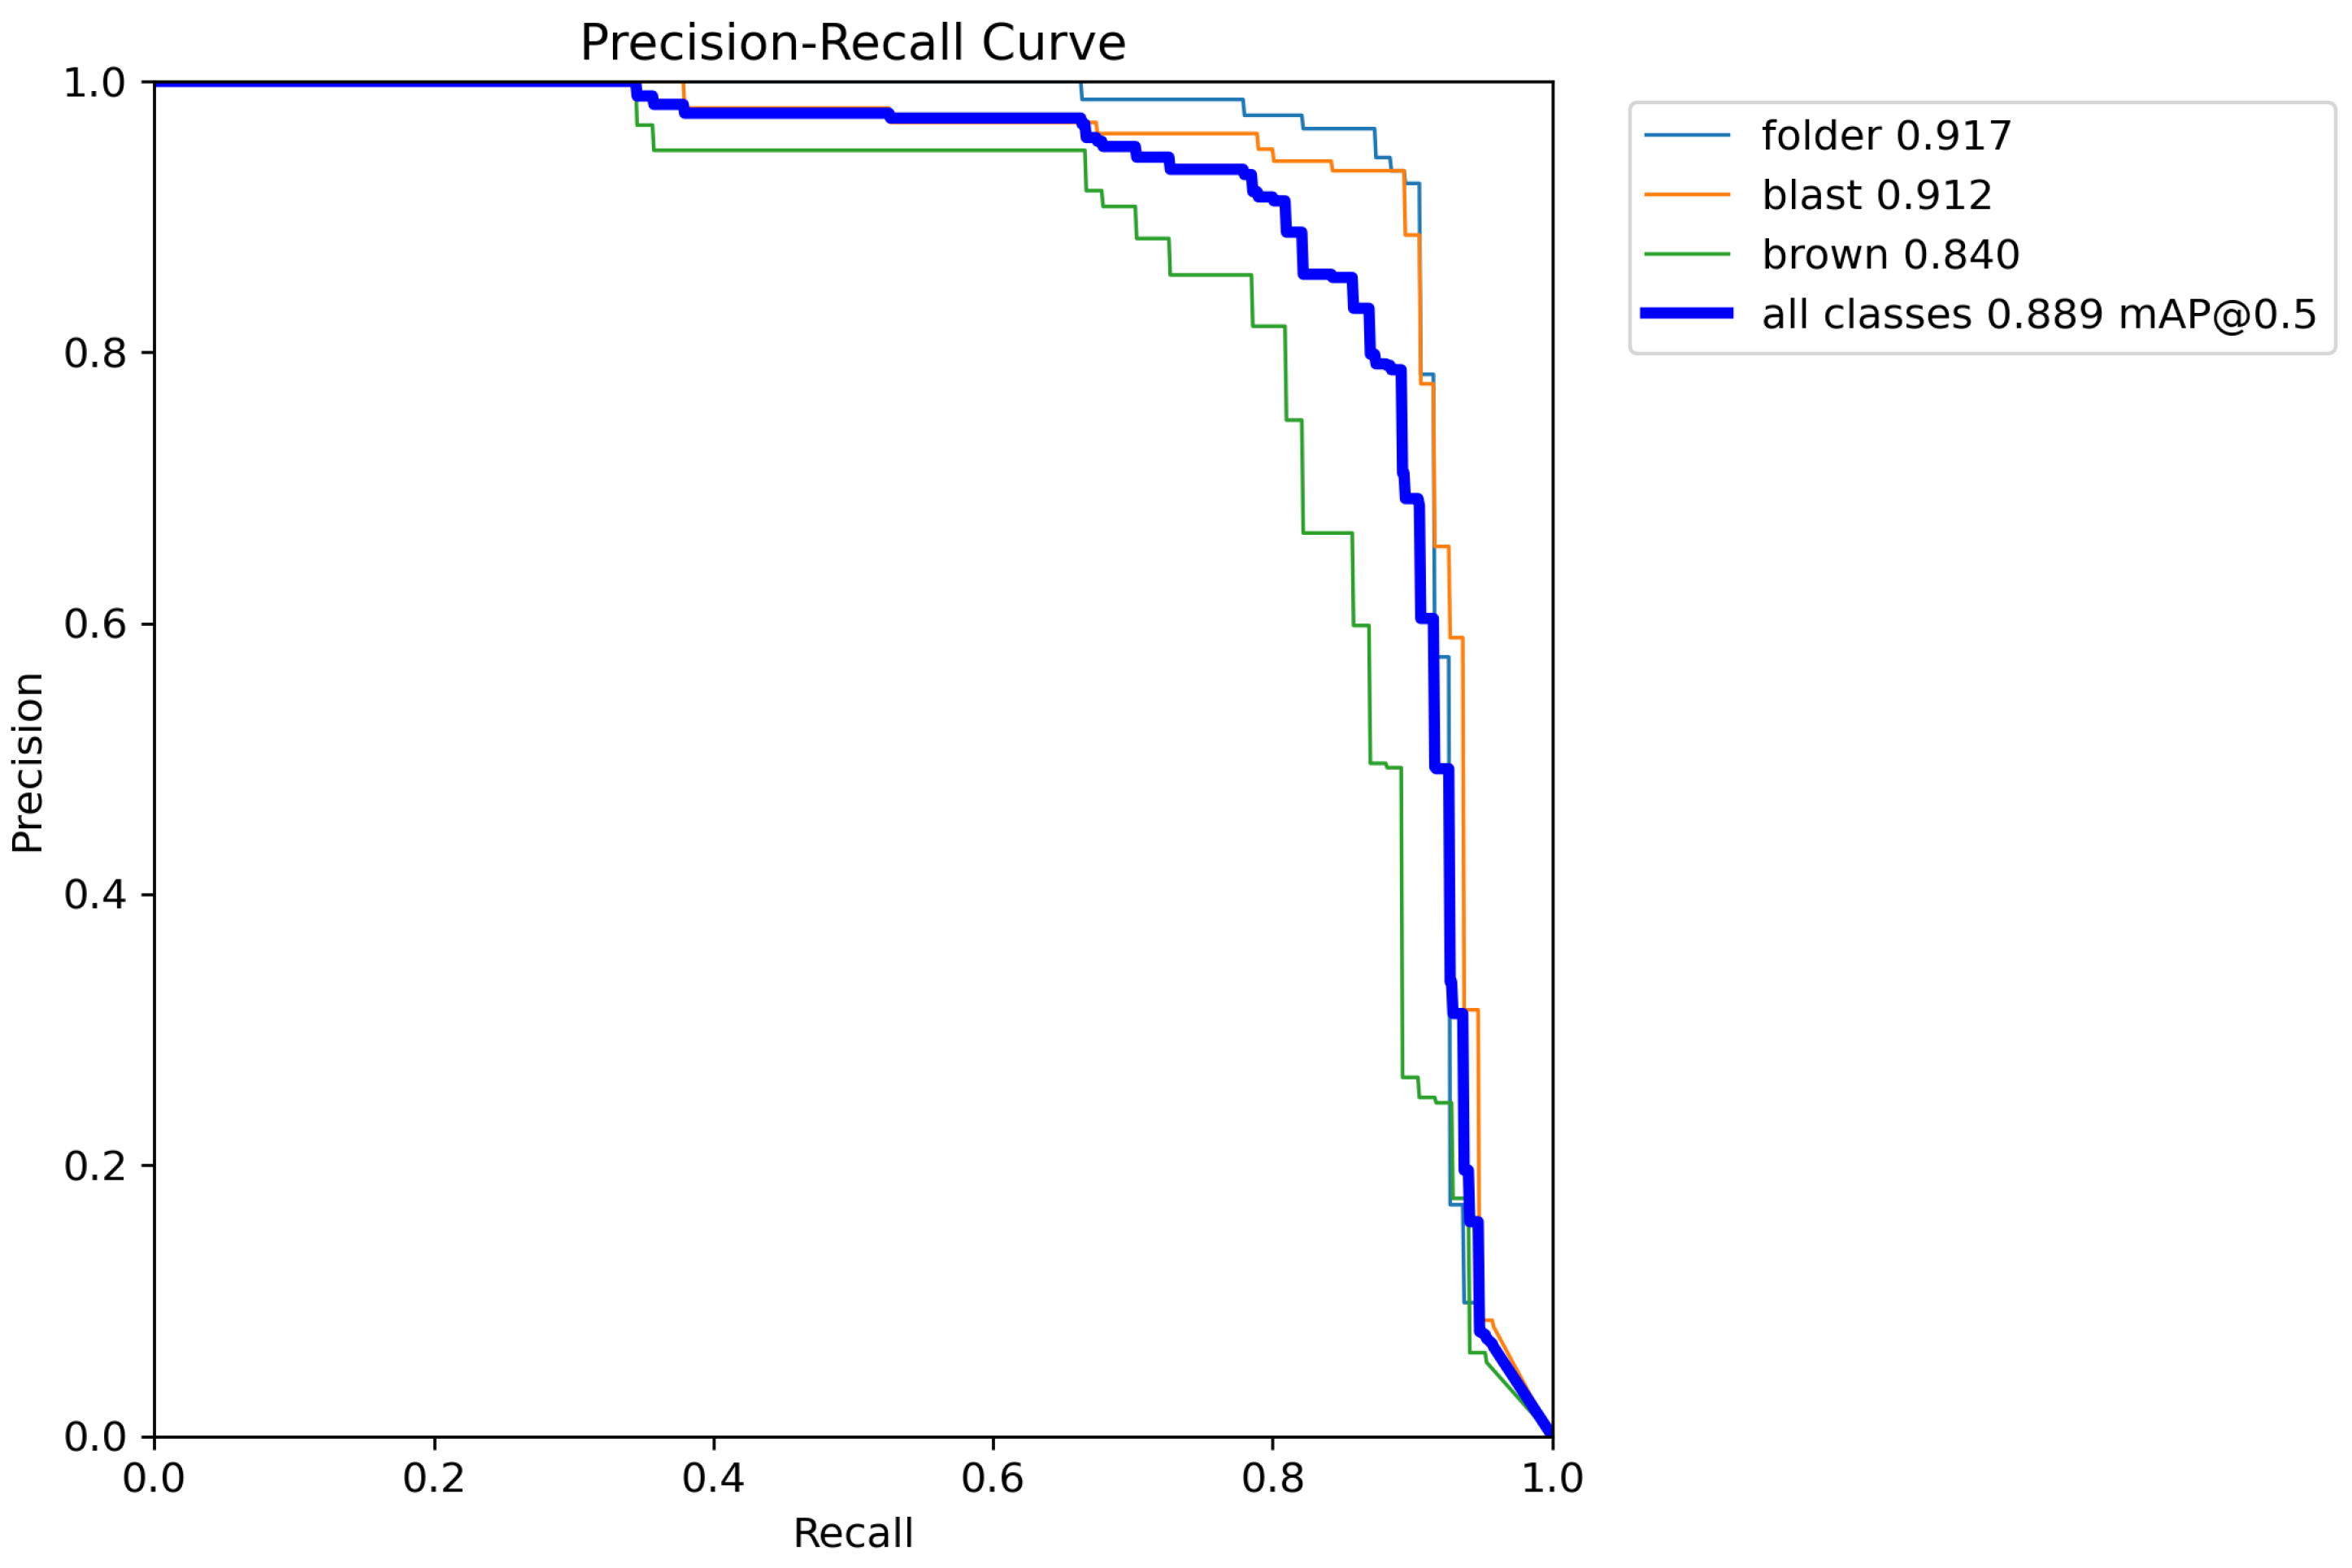
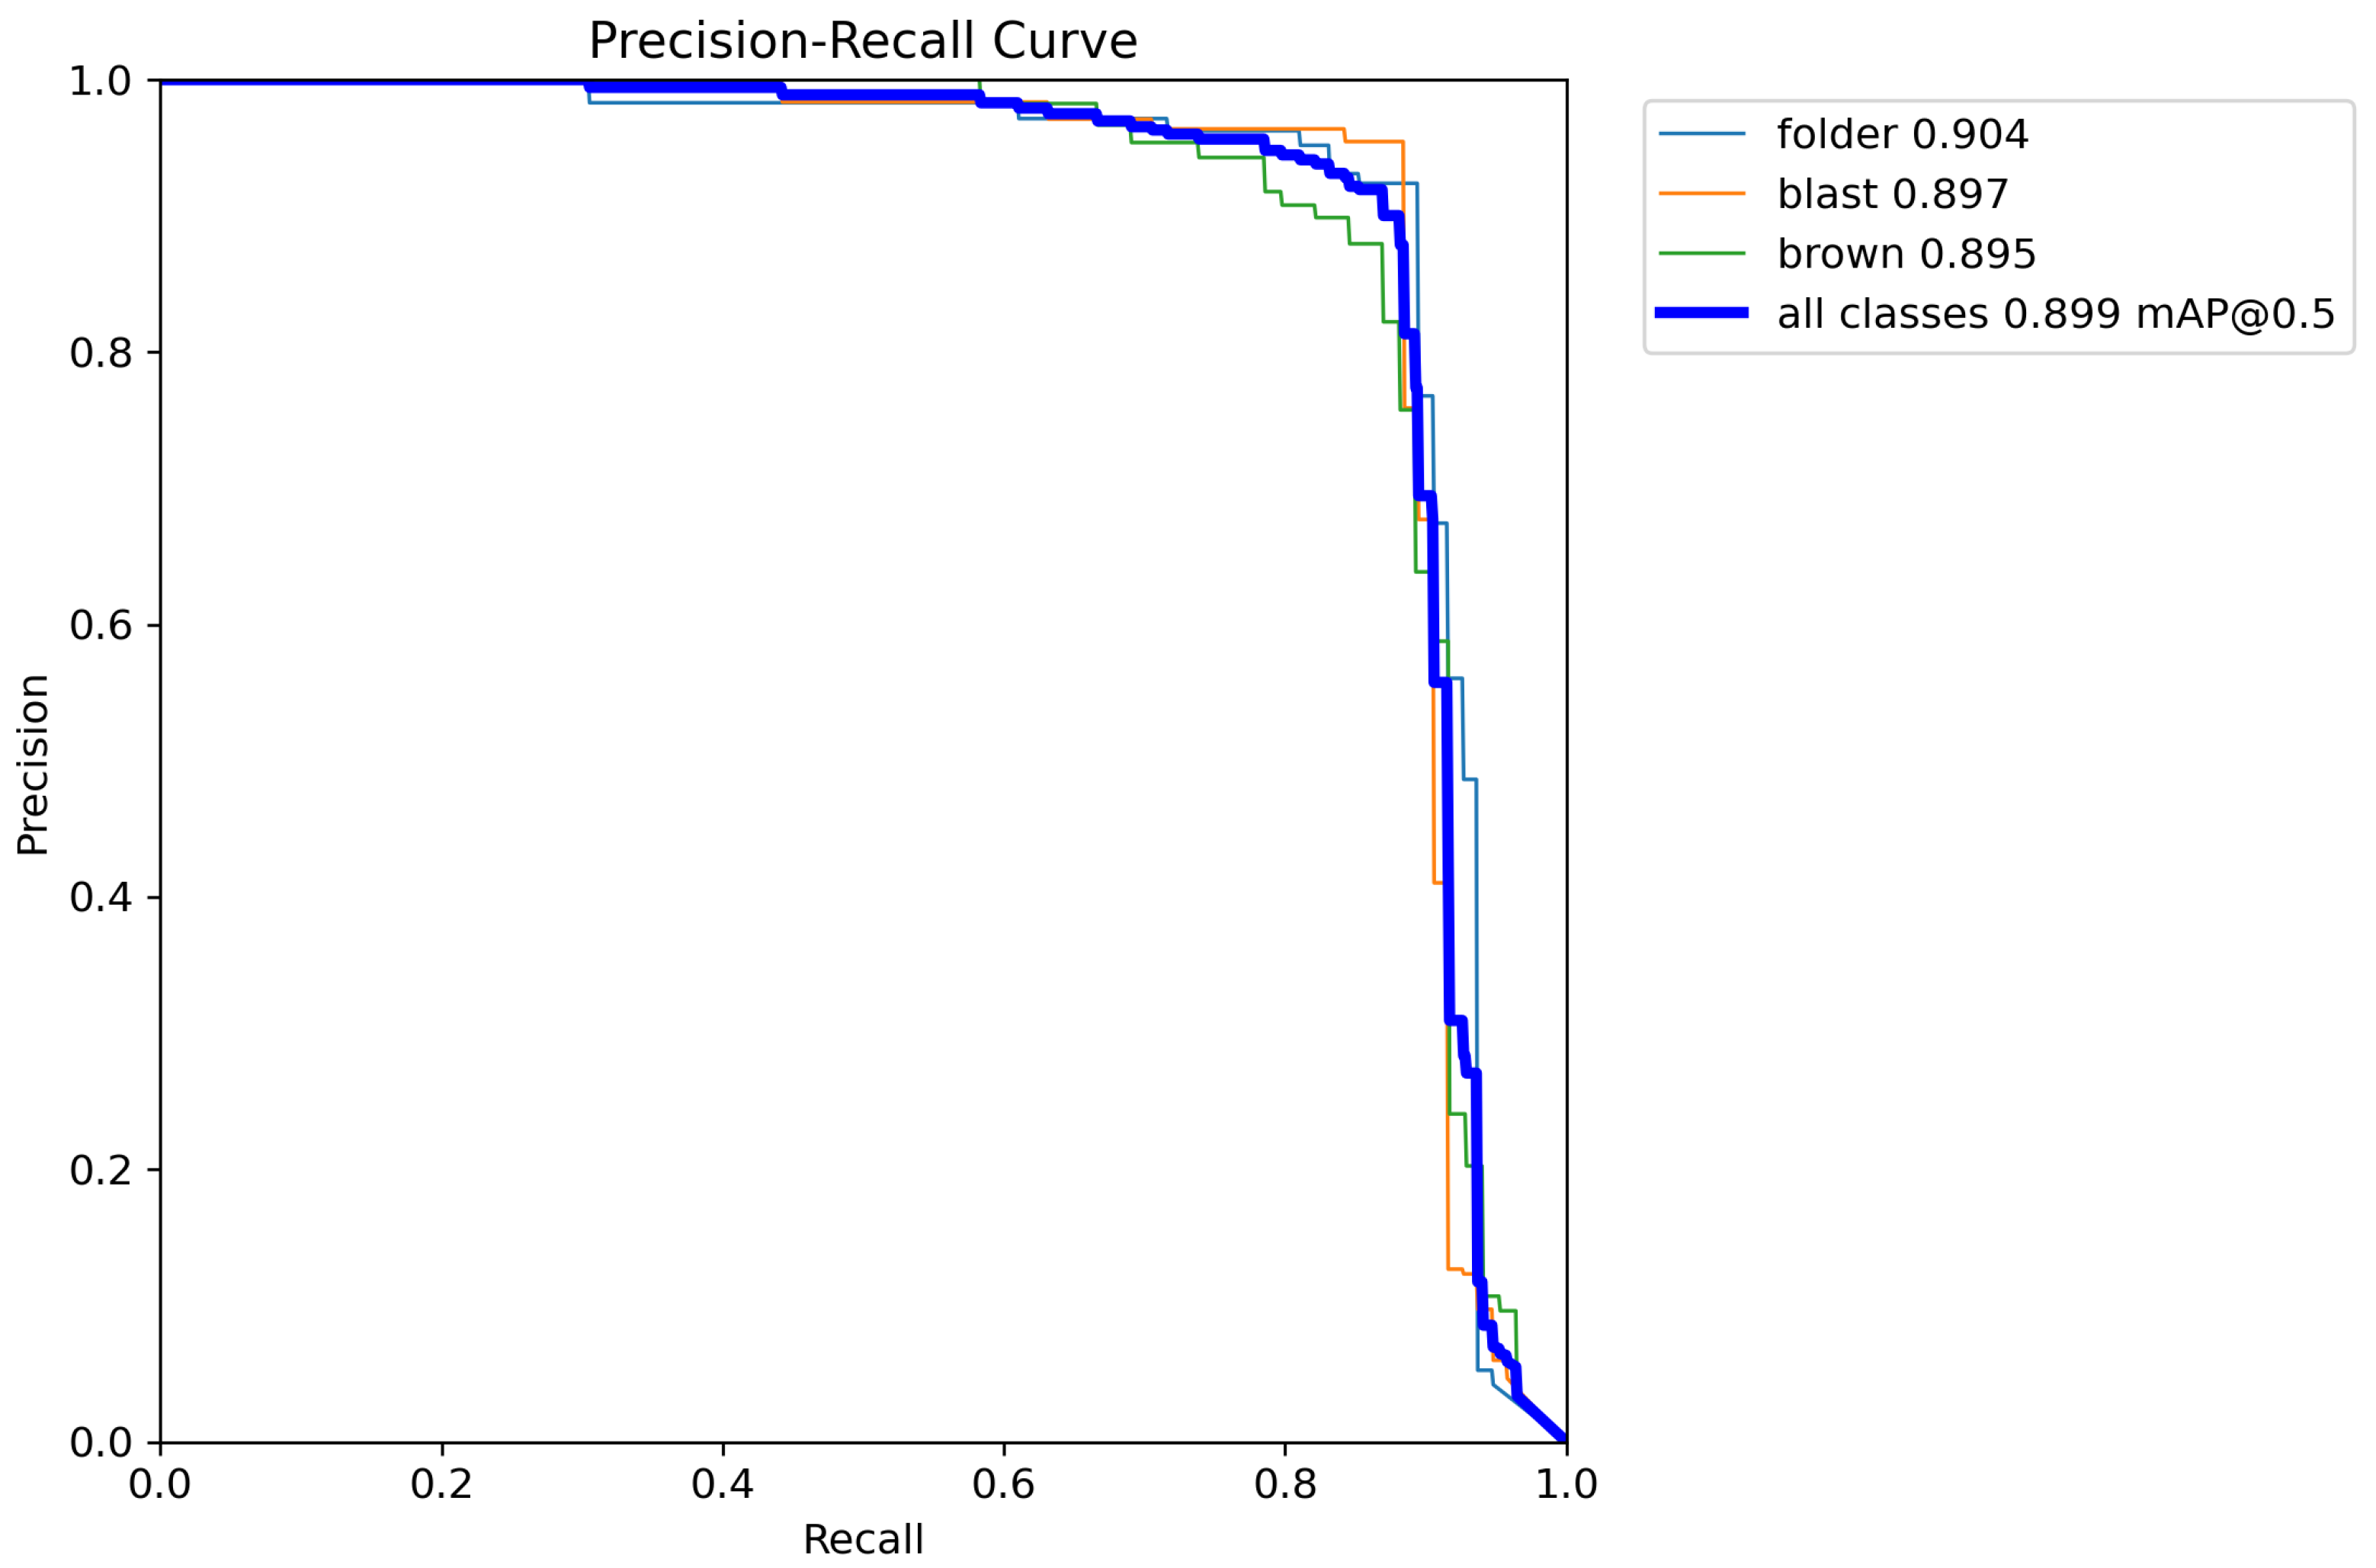
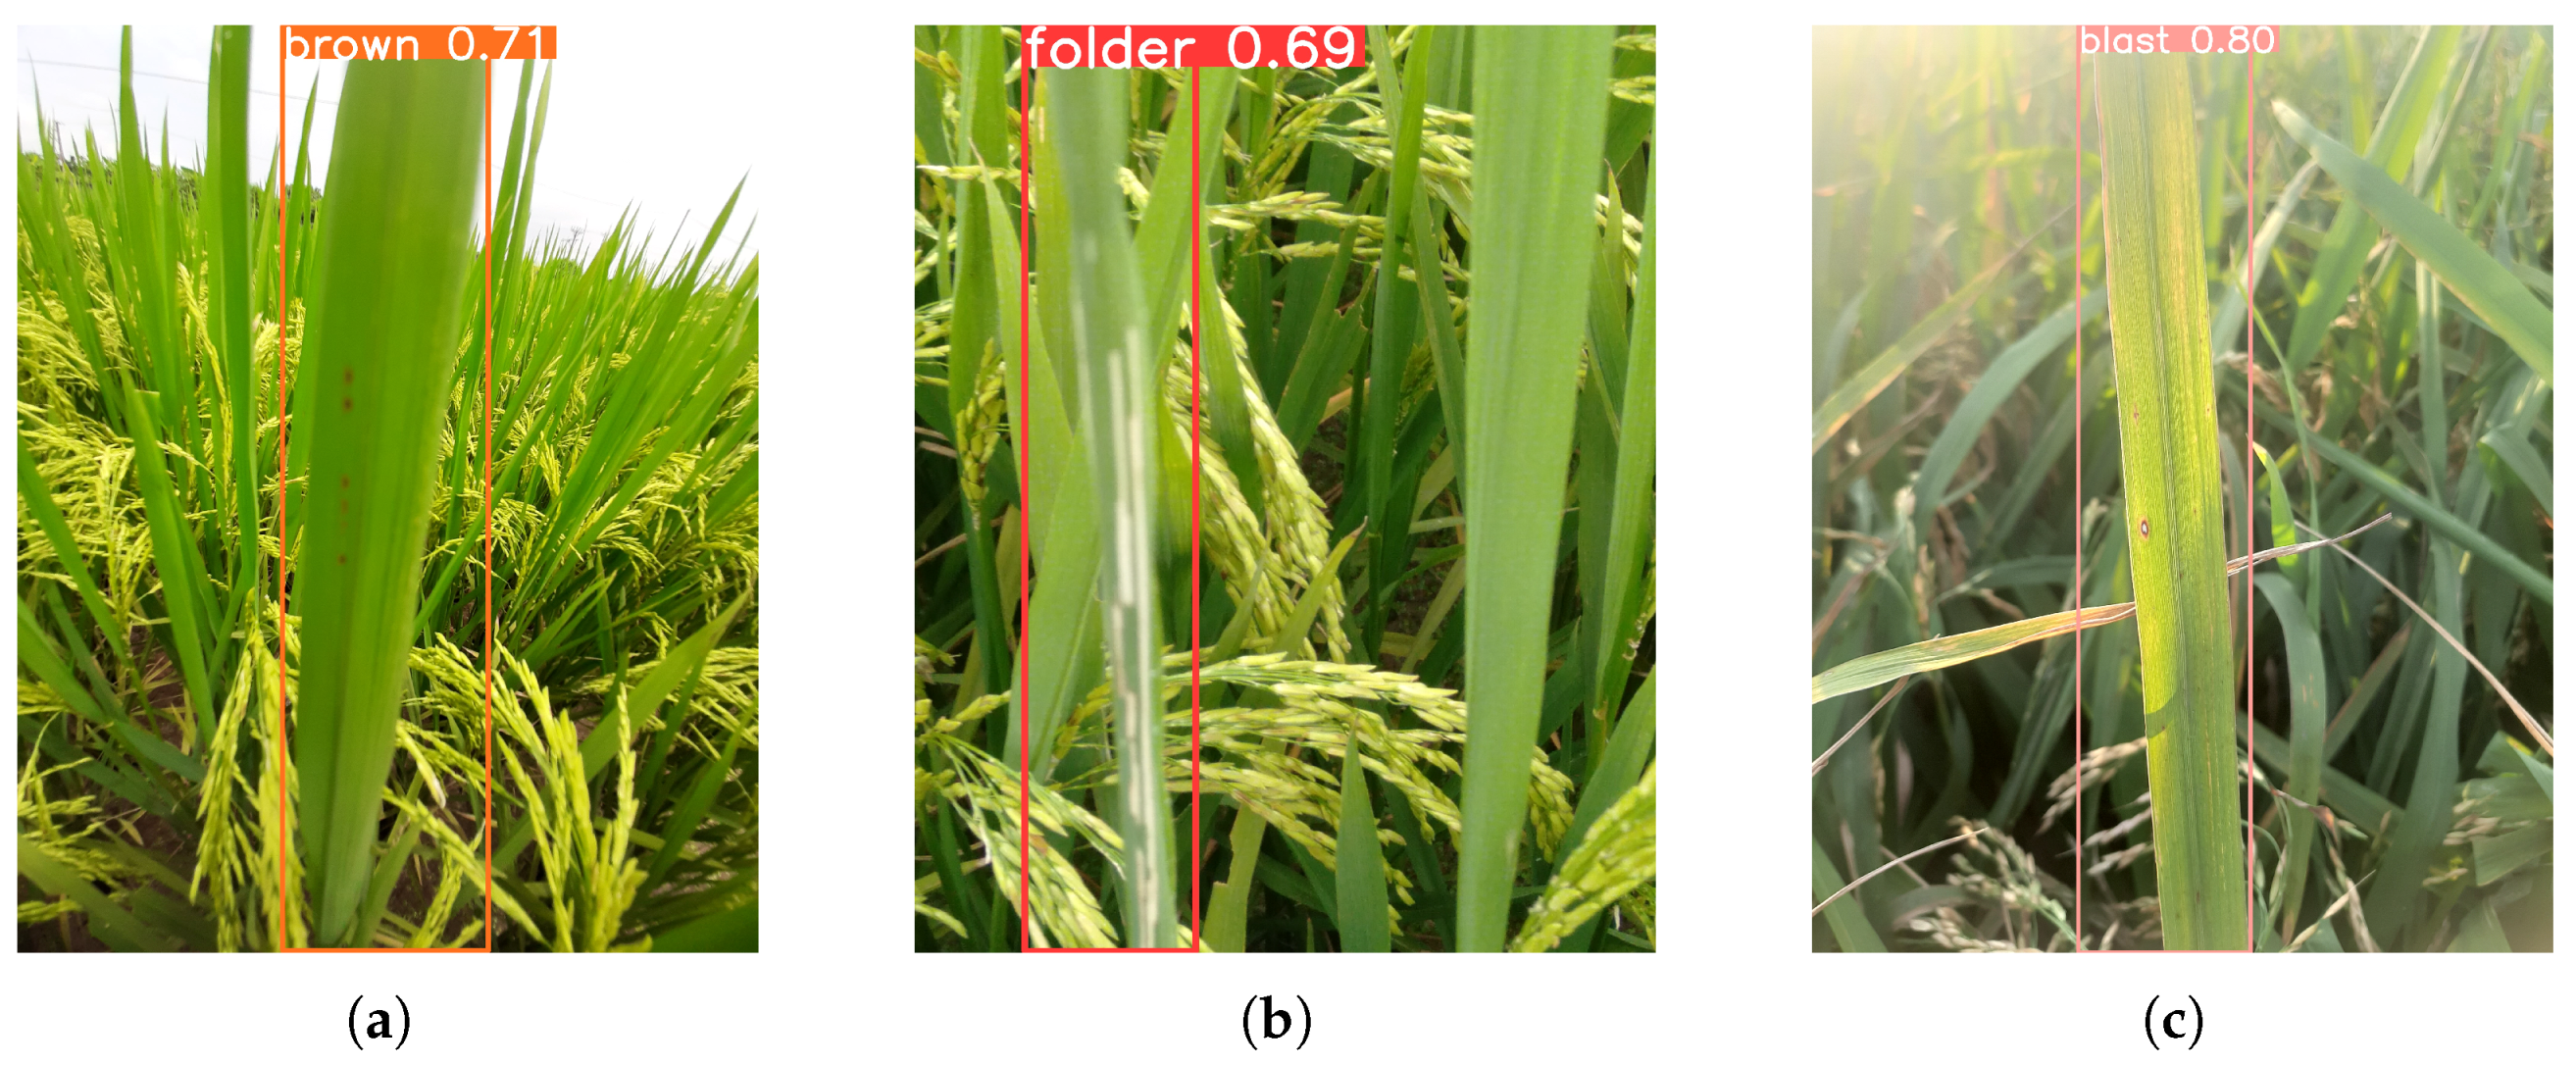
3.2. Evaluation of the Proposed Method
3.3. Discussion
4. Conclusions
Author Contributions
Funding
Institutional Review Board Statement
Informed Consent Statement
Data Availability Statement
Acknowledgments
Conflicts of Interest
Abbreviations
| AI | Artificial Intelligence |
| IoT | Internet of Things |
| CNN | Convolutional Neural Network |
| SVM | Support vector machines |
| GSM | Global system for mobile communications |
| mAP | Mean Average Precision |
References
- Fairhurst, T.; Dobermann, A. Rice in the global food supply. World 2002, 5, 454349–511675. [Google Scholar]
- Wijayanto, A.K.; Junaedi, A.; Sujaswara, A.A.; Khamid, M.B.; Prasetyo, L.B.; Hongo, C.; Kuze, H. Machine Learning for Precise Rice Variety Classification in Tropical Environments Using UAV-Based Multispectral Sensing. AgriEngineering 2023, 5, 2000–2019. [Google Scholar] [CrossRef]
- de Oliveira Carneiro, L.; Coradi, P.C.; Rodrigues, D.M.; Lima, R.E.; Teodoro, L.P.R.; de Moraes, R.S.; Teodoro, P.E.; Nunes, M.T.; Leal, M.M.; Lopes, L.R.; et al. Characterizing and Predicting the Quality of Milled Rice Grains Using Machine Learning Models. AgriEngineering 2023, 5, 1196–1215. [Google Scholar] [CrossRef]
- Paidipati, K.K.; Chesneau, C.; Nayana, B.M.; Kumar, K.R.; Polisetty, K.; Kurangi, C. Prediction of rice cultivation in India—Support vector regression approach with various kernels for non-linear patterns. AgriEngineering 2021, 3, 182–198. [Google Scholar] [CrossRef]
- Rahman, H.; Sharifee, N.H.; Sultana, N.; Islam, M.I.; Habib, S.A.; Ahammad, T. Integrated Application of Remote Sensing and GIS in Crop Information System—A Case Study on Aman Rice Production Forecasting Using MODIS-NDVI in Bangladesh. AgriEngineering 2020, 2, 264–279. [Google Scholar] [CrossRef]
- Krichen, M. Convolutional Neural Networks: A Survey. Computers 2023, 12, 151. [Google Scholar] [CrossRef]
- Naved, M.; Devi, V.A.; Gaur, L.; Elngar, A.A. (Eds.) E-Learning Modeling Technique and Convolution Neural Networks in Online Education. In IoT-Enabled Convolutional Neural Networks: Techniques and Applications; River Publishers: Aalborg, Denmark, 2023. [Google Scholar]
- Uoc, N.Q.; Duong, N.T.; Thanh, B.D. A novel automatic detecting system for cucumber disease based on the convolution neural network algorithm. GMSARN Int. J. 2022, 16, 295–302. [Google Scholar]
- Saleem, M.H.; Potgieter, J.; Arif, K.M. Plant disease detection and classification by deep learning. Plants 2002, 8, 468. [Google Scholar] [CrossRef] [PubMed]
- Agbulos, M.K.; Sarmiento, Y.; Villaverde, J. Identification of leaf blast and brown spot diseases on rice leaf with yolo algorithm. In Proceedings of the IEEE 7th International Conference on Control Science and Systems Engineering (ICCSSE), Qingdao, China, 30 July–1 August 2021; pp. 307–312. [Google Scholar] [CrossRef]
- Zhang, K.; Wu, Q.; Liu, A.; Meng, X. Can deep learning identify tomato leaf disease? Adv. Multimed. 2018, 8, 6710865. [Google Scholar] [CrossRef]
- Liu, J.; Wang, X. Tomato diseases and pests detection based on improved yolo v3 convolutional neural network. Front. Plant Sci. 2020, 11, 898. [Google Scholar] [CrossRef]
- Sharma, R.; Kukreja, V.; Kaushal, R.K.; Bansal, A.; Kaur, A. Rice leaf blight disease detection using multi-classification deep learning model. In Proceedings of the 10th International Conference on Reliability, Infocom Technologies and Optimization (Trends and Future Directions) (ICRITO), Noida, India, 13–14 October 2022; pp. 1–5. [Google Scholar] [CrossRef]
- Deng, R.; Tao, M.; Xing, H.; Yang, X.; Liu, C.; Liao, K.; Qi, L. Automatic diagnosis of rice diseases using deep learning. Front. Plant Sci. 2021, 12, 701038. [Google Scholar] [CrossRef]
- Altinbİlek, H.F.; Kizil, U. Identification of paddy rice diseases using deep convolutional neural networks. Yuz. YıL Univ. J. Agric. Sci. 2021, 32, 705–713. [Google Scholar] [CrossRef]
- Shrivastava, V.K.; Pradhan, M.K.; Minz, S.; Thakur, M.P. Rice plant disease classification using transfer learning of deep convolution neural network. ISPRS Int. Arch. Photogramm. Remote Sens. Spat. Inf. Sci. 2019, 42, 631–635. [Google Scholar] [CrossRef]
- Chaudhari, D.J.; Malathi, K. A survey on rice leaf and seedlings disease detection system. Indian J. Comput. Sci. Eng. (IJCSE) 2021, 12, 561–568. [Google Scholar] [CrossRef]
- Rahman, C.R.; Arko, P.S.; Ali, M.E.; Khan, M.A.I.; Apon, S.H.; Nowrin, F.; Wasif, A. Identification and recognition of rice diseases and pests using convolutional neural networks. Biosyst. Eng. 2020, 194, 112–120. [Google Scholar] [CrossRef]
- Hasan, M.J.; Mahbub, S.; Alom, M.S.; Nasim, M.A. Rice disease identification and classification by integrating support vector machine with deep convolutional neural network. In Proceedings of the 2019 1st International Conference on Advances in Science, Engineering and Robotics Technology, Dhaka, Bangladesh, 3–5 May 2019; pp. 1–6. [Google Scholar] [CrossRef]
- Ramesh, S.; Vydeki, D. Recognition and Classification of Paddy Leaf Diseases Using Optimized Deep Neural Network with Jaya Algorithm. Inf. Process. Agric. 2020, 7, 249–260. [Google Scholar] [CrossRef]
- Maheswaran, S.; Sathesh, S.; Rithika, P.; Shafiq, I.M.; Nandita, S.; Gomathi, R.D. Detection and Classification of Paddy Leaf Diseases Using Deep Learning (CNN). In Computer, Communication, and Signal Processing. ICCCSP 2022. IFIP Advances in Information and Communication Technology; Neuhold, E.J., Fernando, X., Lu, J., Piramuthu, S., Chandrabose, A., Eds.; Springer: Cham, Switzerland, 2022; Volume 651. [Google Scholar] [CrossRef]
- Haque, M.E.; Rahman, A.; Junaeid, I.; Hoque, S.U.; Paul, M. Rice Leaf Disease Classification and Detection Using YOLOv5. arXiv 2022, arXiv:2209.01579. [Google Scholar] [CrossRef]
- Jhatial, M.J.; Shaikh, R.A.; Shaikh, N.A.; Rajper, S.; Arain, R.H.; Chandio, G.H.; Bhangwar, A.Q.; Shaikh, H.; Shaikh, K.H. Deep learning-based rice leaf diseases detection using yolov5. Sukkur IBA J. Comput. Math. Sci. 2022, 6, 49–61. [Google Scholar] [CrossRef]
- Sparks, N.C.A.; Cruz, C.V. Brown Spot. Available online: http://www.knowledgebank.irri.org/training/fact-sheets/pest-management/diseases/item/brown-spot (accessed on 5 September 2023).
- Catindig, J. Rice Leaf Folder. Available online: http://www.knowledgebank.irri.org/training/fact-sheets/pest-management/insects/item/rice-leaffolder (accessed on 5 September 2023).
- Redmon, J.; Farhadi, A. YOLO9000: Better, faster, stronger. In Proceedings of the IEEE Conference on Computer Vision and Pattern Recognition, Honolulu, HI, USA, 21–26 July 2017; pp. 7263–7271. [Google Scholar]
- Redmon, J.; Farhadi, A. Yolov3: An incremental improvement. arXiv 2018, arXiv:1804.02767. [Google Scholar]
- Bochkovskiy, A.; Wang, C.Y.; Liao, H.Y.M. Yolov4: Optimal speed and accuracy of object detection. arXiv 2020, arXiv:2004.10934. [Google Scholar]
- Li, C.; Li, L.; Jiang, H.; Weng, K.; Geng, Y.; Li, L.; Ke, Z.; Li, Q.; Cheng, M.; Nie, W.; et al. YOLOv6: A single-stage object detection framework for industrial applications. arXiv 2022, arXiv:2209.02976. [Google Scholar]
- Wang, C.Y.; Bochkovskiy, A.; Liao, H.Y.M. YOLOv7: Trainable bag-of-freebies sets new state-of-the-art for real-time object detectors. In Proceedings of the IEEE/CVF Conference on Computer Vision and Pattern Recognition, Vancouver, BC, Canada, 17–24 June 2023; pp. 7464–7475. [Google Scholar]
- Wang, C.Y.; Liao, H.Y.M.; Yeh, I.H. Designing network design strategies through gradient path analysis. arXiv 2022, arXiv:2211.04800. [Google Scholar]
- Lee, Y.; Hwang, J.W.; Lee, S.; Bae, Y.; Park, J. An energy and GPU-computation efficient backbone network for real time object detection. In Proceedings of the IEEE/CVF Conference on Computer Vision and Pattern Recognition Workshops, Long Beach, CA, USA, 16–17 June 2019. [Google Scholar]
- Feng, C.; Zhong, Y.; Gao, Y.; Scott, M.R.; Huang, W. Tood: Task-aligned one-stage object detection. In 2021 IEEE/CVF International Conference on Computer Vision (ICCV); IEEE Computer Society: Washington, DC, USA, 2021; pp. 3490–3499. [Google Scholar] [CrossRef]
- Zheng, Z.; Wang, P.; Ren, D.; Liu, W.; Ye, R.; Hu, Q.; Zuo, W. Enhancing geometric factors in model learning and inference for object detection and instance segmentation. IEEE Trans. Cybern. 2021, 52, 8574–8586. [Google Scholar] [CrossRef] [PubMed]
- Li, X.; Wang, W.; Wu, L.; Chen, S.; Hu, X.; Li, J.; Tang, J.; Yang, J. Generalized focal loss: Learning qualified and distributed bounding boxes for dense object detection. Adv. Neural Inf. Process. Syst. 2020, 33, 21002–21012. [Google Scholar]
- Zhang, Y.F.; Ren, W.; Zhang, Z.; Jia, Z.; Wang, L.; Tan, T. Focal and efficient IOU loss for accurate bounding box regression. Neurocomputing 2022, 506, 146–157. [Google Scholar] [CrossRef]
- He, J.; Erfani, S.; Ma, X.; Bailey, J.; Chi, Y.; Hua, X.S. Alpha-IoU: A family of power intersection over union losses for bounding box regression. Adv. Neural Inf. Process. Syst. 2022, 34, 20230–20242. [Google Scholar]
- Haque, M.E.; Paul, M.; Rahman, A.; Tohidi, F.; Islam, M.J. Rice leaf disease detection and classification using lightly trained Yolov7 active deep learning approach. In Proceedings of the Digital Image Computing: Techniques and Applications (DICTA), Port Macquarie, NSW, Australia, 28 November–1 December 2023. [Google Scholar]
- Available online: https://docs.ultralytics.com/models/yolov8/ (accessed on 19 January 2024).
- Available online: https://docs.ultralytics.com/models/yolov7/ (accessed on 19 January 2024).
- Available online: https://www.stereolabs.com/blog/performance-of-yolo-v5-v7-and-v8 (accessed on 19 January 2024).
- Zhang, H.; Wang, Y.; Dayoub, F.; Sunderhauf, N. VarifocalNet: An IoU-aware Dense Object Detector. arXiv 2020, arXiv:2008.13367. [Google Scholar] [CrossRef]
- Loshchilov, I.; Frank, H. SGDR: Stochastic Gradient Descent with Warm Restarts. arXiv 2016, arXiv:1608.03983. [Google Scholar]


| No. | Name of Main Part | Specifications |
|---|---|---|
| 1 | USB Camera Essager C3 |
|
| 2 | Raspberry Pi 4 model B |
|
| 3 | SIM 800 L |
|
| No. | Name | Function |
|---|---|---|
| 1 | Hsv_h | 0.015 |
| 2 | Hsv_s | 0.7 |
| 3 | Hsv_v | 0.4 |
| 4 | Translate | 0.1 |
| 5 | Scale | 0.5 |
| 6 | Flipud | 0.5 |
| 7 | Fliplr | 0.5 |
| 8 | Mosaic | 1.0 |
| Batch size | 16 |
| Optimizer | SGD |
| Epoch | 300 |
| Initial learning rate | 0.01 |
| Final learning rate | 0.0001 |
| Momentum | 0.937 |
| YOLOv8 | PRECISION | RECALL | F1 | mAP@50 |
|---|---|---|---|---|
| All | 89.6 | 83.5 | 86.4 | 88.9 |
| Leaf Folder | 93.9 | 88.4 | 91.1 | 91.7 |
| Leaf Blast | 86.7 | 90.5 | 88.6 | 91.2 |
| Brown Spot | 88.2 | 71.5 | 79.0 | 84.0 |
| YOLOv8 | Precision | Recall | F1 | mAP@50 |
|---|---|---|---|---|
| All | 90.0 | 84.4 | 87.1 | 89.9 |
| Leaf Folder | 93.1 | 85.2 | 89.0 | 90.4 |
| Leaf Blast | 86.2 | 88.4 | 87.3 | 89.7 |
| Brown Spot | 90.6 | 79.8 | 84.9 | 89.5 |
| Size (pixels) | Params (M) | FLOPs (B) | NVIDIA Jetson AGX Orin (FPS) | |
|---|---|---|---|---|
| YOLOv8n | 640 | 3.2 | 8.7 | 383 |
| YOLOv5n | 640 | 1.9 | 4.5 | 370 |
| YOLOv7-tiny | 640 | 6.2 | 13.8 | 290 |
Disclaimer/Publisher’s Note: The statements, opinions and data contained in all publications are solely those of the individual author(s) and contributor(s) and not of MDPI and/or the editor(s). MDPI and/or the editor(s) disclaim responsibility for any injury to people or property resulting from any ideas, methods, instructions or products referred to in the content. |
© 2024 by the authors. Licensee MDPI, Basel, Switzerland. This article is an open access article distributed under the terms and conditions of the Creative Commons Attribution (CC BY) license (https://creativecommons.org/licenses/by/4.0/).
Share and Cite
Trinh, D.C.; Mac, A.T.; Dang, K.G.; Nguyen, H.T.; Nguyen, H.T.; Bui, T.D. Alpha-EIOU-YOLOv8: An Improved Algorithm for Rice Leaf Disease Detection. AgriEngineering 2024, 6, 302-317. https://doi.org/10.3390/agriengineering6010018
Trinh DC, Mac AT, Dang KG, Nguyen HT, Nguyen HT, Bui TD. Alpha-EIOU-YOLOv8: An Improved Algorithm for Rice Leaf Disease Detection. AgriEngineering. 2024; 6(1):302-317. https://doi.org/10.3390/agriengineering6010018
Chicago/Turabian StyleTrinh, Dong Cong, Anh Tuan Mac, Khanh Giap Dang, Huong Thanh Nguyen, Hoc Thai Nguyen, and Thanh Dang Bui. 2024. "Alpha-EIOU-YOLOv8: An Improved Algorithm for Rice Leaf Disease Detection" AgriEngineering 6, no. 1: 302-317. https://doi.org/10.3390/agriengineering6010018
APA StyleTrinh, D. C., Mac, A. T., Dang, K. G., Nguyen, H. T., Nguyen, H. T., & Bui, T. D. (2024). Alpha-EIOU-YOLOv8: An Improved Algorithm for Rice Leaf Disease Detection. AgriEngineering, 6(1), 302-317. https://doi.org/10.3390/agriengineering6010018