Highlights
What are the main findings?
- Intersection resilience is as critical as efficiency, revealing that conventional performance metrics alone are insufficient under disruptive conditions.
- A combined heuristic–microsimulation framework effectively evaluates both operational performance and robustness, capturing vulnerabilities such as power outages.
What is the implication of the main finding?
- Urban planners and policymakers can prioritize intersection designs that preserve mobility during climate-related disruptions, strengthening urban resilience strategies.
- The integrated methodological approach provides a transferable tool for other cities to support evidence-based decisions on resilient intersection planning and investment.
Abstract
Extreme weather events, such as storms, pose significant challenges to the reliability and efficiency of urban road networks, making intersection design and management critical to maintaining mobility. This paper addresses the dual objectives of traffic efficiency and resilience by evaluating the performance of roundabouts, signalized, and two-way stop-controlled (TWSC) intersections under normal and storm-disrupted conditions. A mixed-method approach was adopted, combining a heuristic framework from the Highway Capacity Manual with microsimulations in AIMSUN Next. Three Polish case studies were examined; each was modeled under alternative control strategies. The findings demonstrate the superior robustness of roundabouts, which retain functionality during power outages, while signalized intersections reveal vulnerabilities when control systems fail, reverting to less efficient TWSC behavior. TWSC intersections consistently exhibited the weakest performance, particularly under high or uneven traffic demand. Despite methodological differences in delay estimation, the convergence of results through Level of Service categories strengthens the reliability of findings. Beyond technical evaluation, the study underscores the importance of resilient intersection design in climate-vulnerable regions and the value of integrating analytical and simulation-based methods. By situating intersection performance within urban resilience, this research provides actionable insights for policymakers, planners, and engineers seeking to balance efficiency with adaptability in infrastructure planning.
1. Introduction
The combination of hazards such as storms and floods, with vulnerabilities like rapid urbanization and inefficient road infrastructure, increases disaster risks in urban areas [1,2,3]. According to World Bank data [4], 56% of the global population (4.4 billion) currently lives in cities, a figure projected to rise to nearly 70% by 2050. At the same time, the intensity and frequency of disasters are increasing due to climate change and urban population growth [5,6,7]. Between 2000–2023, about 80% of major U.S. electricity outages (≥50,000 customers or ≥300 MW) were weather-related, with severe storms, winter weather, and tropical cyclones as the main causes, and their frequency nearly doubled in the last decade [8]. Similarly, long-term studies in Europe and Italy found that weather is the leading driver of large-scale power outages, particularly winter events affecting transmission lines [9]. These findings highlight the importance of adaptation and mitigation strategies for strengthening urban resilience, a priority emphasized by researchers, policymakers, planners, and stakeholders [10,11,12]. Road infrastructure, while vital for daily life and economic activities, remains highly vulnerable to disruptions [6]. Moreover, resilience is closely tied to the Sustainable Development Goals (SDGs), introduced in the 2030 Agenda [13], specifically SDGs 11 and 13, that underscore making cities resilient and sustainable, as well as taking actions to combat climate change and its effects [14].
In this context, resilience in urban systems refers to the capacity to maintain functionality under disruptions [6,15], while in transportation, it denotes the ability of road networks to restore service after disturbances [6,16]. Efficiency, by contrast, reflects the capacity of transport infrastructure to ensure reliable mobility of people and goods with minimal costs, time, energy use, and environmental impacts [6,17,18]. Road networks are thus central to urban resilience, with connectivity, geometry, and design strongly influencing efficiency and vulnerability [19,20]. Intersection performance, an indicator of efficiency, is typically evaluated using metrics such as the volume-to-capacity ratio and control delay time, which capture different aspects of service quality for road users [18]. The choice of specific metrics depends on the objectives of each study. Road network resilience is commonly assessed by comparing functionality before and after a disruptive event [20]. Traffic-related functionality metrics, including travel time and throughput, are typically examined at the road network level [21]; however, at the intersection level, control delay time can serve as a useful indicator of functionality.
This research proposes a heuristic approach supported by microsimulations for evaluating intersection efficiency with an emphasis on resilience. The method integrates both efficiency and resilience into a flexible framework, analyzing various intersection geometries and control modes under normal and disrupted conditions. The study aims to generate insights to support resilient and efficient intersection design and management, ultimately improving urban mobility and infrastructure stability. To define the scope, several assumptions are introduced. The heuristic draws on the analytical framework of the Highway Capacity Manual (HCM), 6th edition [18], which treats intersections as isolated systems, while microsimulations are conducted using AIMSUN Next [22]. Each case study begins with its specific geometry and layout, but is evaluated under three traffic control types (roundabout, signalized intersection, and two-way stop-controlled (TWSC) intersection) regardless of its current configuration. The primary metric for the heuristic approach is control delay time, while microsimulations consider delay time, travel time, speed, and average approach delay, all measured under pre- and post-storm conditions. Since analytical and simulation results are not directly comparable, the level of service (LOS) is included as a supplementary indicator for both methods. Together, these metrics provide a more comprehensive assessment of intersection performance and resilience. Storm duration was not considered a critical factor for this study, as it was not deemed necessary to evaluate its impact on intersection resilience. Instead, the consequence of a storm, namely, electricity outages, was considered a critical factor in this research. Therefore, any other aspects of storms, including intensity, frequency, and duration, are not important for the objectives of this study.
The primary objective of this research is to integrate the efficiency and resilience of intersections into a unified assessment framework, providing a novel approach to enhancing infrastructure adaptability and robustness against future disruptions. To evaluate intersection performance, traffic composed solely of Human-Driven Vehicles (HDVs) in various intersection layouts was analyzed to address the following key questions:
- What role does intersection design play in the efficiency and resilience of signalized intersections during traffic signal failures caused by extreme weather events?
- How do different traffic control types and geometries affect intersection performance and resilience under both normal and post-storm conditions?
- How can predictive resilience metrics be developed and applied to intersection design and evaluation to better anticipate and mitigate the impacts of storm-induced power outages?
Following this introduction, the paper is organized as follows: Section 2 presents a brief literature review. Section 3 represents the study areas and methodology, followed by Section 4, which represents the findings of this study. Section 5 discusses the results of the heuristic approach and the microsimulations conducted using AIMSUN Next [22]. Section 6 provides the conclusions, highlights the contributions to the field, and outlines the study’s limitations and potential future developments. The final section contains the references used in this research.
2. Literature Review
The literature review conducted in this study follows the step-based research method outlined in [23], using a hybrid approach that combined meta-synthesis and realist review. The review focused on the peer-reviewed papers published since 2013. Searches were conducted until 19 September 2025, in three phases.
In the first phase, the Scopus database was queried using the terms “resilient roads” and “urban mobility” in the Article title, Abstract, and Keywords fields, yielding 68 peer-reviewed articles. Expanding the query by adding “intersection efficiency” and “smart mobility” returned no additional results.
In the second phase, abstracts were screened for relevance. During this process, 52 papers were excluded for not meeting the selection criteria, leaving 16 relevant papers.
In the third phase, a hybrid search was conducted across relevant journal websites, using keyword-based and semantic search techniques to identify additional studies not captured in Scopus. This process yielded 24 further peer-reviewed articles.
In total, 40 studies were included. Although the literature cannot be divided into entirely independent categories, for the purposes of analysis and gap identification, the selected studies were grouped into three thematic areas: (i) resilient road and intersection design, (ii) smart and resilient urban mobility, and (iii) urban resilience planning and governance. These categories are outlined in Section 2.1, Section 2.2 and Section 2.3, with gaps discussed in Section 2.4.
2.1. Resilient Road and Intersection Design
Road networks are fundamental to urban design, shaping long-term growth and resilience through their structure and typology [19,20]. Given their long lifespans and interdependencies, resilience must be assessed at multiple scales, from intersections to corridors and entire networks, since vulnerabilities at one level can propagate across the system [24].
At the intersection level, Zhao et al. [25] developed a spatiotemporal framework to identify critical intersections with greater precision. Decision analysis and expert judgment have also been applied to prioritize regional infrastructure resilience [26]. Quantitative tools contribute further insights. Resilience indices highlight the redesign of vulnerable intersections, with roundabouts demonstrating superior robustness [27], while urban form design has been linked to improvements in both energy efficiency and resilience [28].
Studies have also examined intersection safety under rising traffic demands and technological transitions [29], and proposed flood-resilient infrastructure incorporating green design principles [30]. Research on pavement-vehicle interactions has identified implications for material degradation, operating costs, and environmental outcomes, particularly with the advent of electric vehicles [31]. In terms of operations, adaptive traffic signal systems have been shown to outperform fixed-timing controls, offering greater flexibility under dynamic traffic conditions [32].
Collectively, these contributions highlight that resilient road and intersection design requires an integrated approach that combines structural robustness, innovative design principles, and adaptive operational strategies.
2.2. Smart and Resilient Urban Mobility
The evolution of smart mobility emphasizes automation, data-driven methods, and adaptive technologies as key to urban resilience. Lv and Zheng [33] developed a framework addressing road operation, transport planning, and automated vehicles, while Ghaffarpasand et al. [34] demonstrated how telematics data can enhance safety, reduce emissions, and improve logistics and insurance policies. Studies in emerging economies highlight foresight and long-term planning as essential to resilient transport systems [35].
Forecasting and quantitative assessment are central to mobility resilience. Tang and Heinimann [36] proposed a resilience-based metric for recurrent congestion, providing a systemic way to quantify how traffic systems absorb disturbances and recover functionality. Recent approaches leverage traffic sensor networks and machine learning to improve speed prediction, system optimization, and traffic flow forecasting [37,38,39]. Hybrid deep learning models achieve high accuracy in spatiotemporal traffic forecasting [40], while extended long short-term memory (LSTM) models capture periodicity and variability in traffic profiles over long time horizons [41]. Together, these methods illustrate how predictive analytics and resilience metrics can support adaptive urban mobility.
Emerging technologies such as the Internet of Vehicles (IoV) and blockchain also contribute to mobility resilience. IoV enables layered communication architectures and supports autonomous systems, though it raises new challenges for security and resilience [42]. Blockchain-based systems facilitate transparency and decentralized coordination in mobility networks [43].
At the multimodal level, resilience benefits from real-time operational responses to cascading failures [44], while disaster-related studies underscore how mobility disruptions propagate across systems. Research highlights that traffic flows and spatial interactions, rather than hazard proximity alone, are key in shaping resilience [7]. Disruptions such as floods and hurricanes often create bottlenecks far beyond the directly affected zones [45], while pandemic-related research emphasizes dynamic recovery strategies, redeployment of public transport, and shifts toward walking and cycling as essential for maintaining urban mobility under stress [46,47,48].
Taken together, these studies demonstrate that smart and resilient urban mobility depends on the integration of predictive analytics, adaptive technologies, and multimodal strategies to maintain functionality under both routine and disruptive conditions.
2.3. Urban Resilience Planning and Governance
Resilience is not only a technical property but also a function of urban planning and governance. Socio-spatial perspectives illustrate how resilience evolves over time [49], while operational frameworks link design with adaptable urban forms, emphasizing both contextual sensitivity and the preservation of historic areas under development pressure [50].
System dynamics modeling across cities in the UK, Brazil, and India revealed that ambitious modal shifts toward active travel can significantly reduce mortality risks from flooding and infectious disease outbreaks, underscoring the critical role of forward-thinking transport design in building resilience [51]. In Bangkok, integrated flood–mobility modeling showed that inundation drives a shift from cars to rail, highlighting the importance of resilient transit systems and supportive policies such as fare incentives [52]. Fan et al. [53], applied AI models to guide post-disaster recovery, offering decision-support for emergency planning.
Beyond modeling, broader planning challenges remain. Urban resilience planning has gained urgency as cities face complex risks linked to globalization and climate change. Resilience is often seen as an inherent feature of cities [54], but emerging vulnerabilities require innovative solutions, including biophilic and smart design approaches [55]. Research from Latin America and Africa highlights the challenges of uncontrolled growth and limited infrastructure maintenance, which reduce resilience and exacerbate mobility issues [56,57]. Equitable access to essential services is also critical, as disaster scenarios in Latin America and Asia demonstrate how disruptions can restrict access to healthcare and public facilities [58,59].
Governance further shapes resilience outcomes. Mediterranean island case studies reveal that fragmented governance and limited coordination hinder holistic smart city development, underscoring the importance of aligning strategic aspirations with public discourse to ensure adoption of resilient innovations [60].
Overall, these findings show that urban resilience planning and governance require cross-sectoral integration across transportation, land use, energy, and telecommunications, along with targeted strategies to ensure equitable access for vulnerable populations.
2.4. Gaps in the Literature
This literature review focuses on studies assessing resilience procedures in urban road infrastructures, primarily at national, regional, and city levels [7,26,48,49,51,52,53]. The resilience of urban systems largely depends on road networks, whose connectivity, geometry, and design exert a strong influence on network efficiency and vulnerability [19,20]. Existing studies have explored resilience at multiple scales, from intersections to entire networks [24,25], but most research considers intersections as part of broader networks or focuses narrowly on physical characteristics and environmental conditions [20,29]. Advances in smart mobility, telematics, and machine learning have improved traffic management and forecasting [34,37], yet these approaches typically address day-to-day operations rather than extreme events. Although evidence suggests that disruptions can alter traffic patterns far beyond the affected zone [7,45], little attention has been given to how intersections—the most critical nodes of road systems—function and recover under such conditions. Furthermore, despite system-level modeling and case studies highlighting bottlenecks and recovery trajectories after shocks [51,52,53], empirical and simulation-based evidence on how intersection design and control influence these dynamics remains limited.
Overall, the literature indicates the need to move beyond resistance-based designs toward resilience-oriented approaches that integrate adaptability, dynamic recovery, and predictive metrics. Significant gaps remain in understanding how different intersection geometries and management strategies affect resilience and efficiency, particularly during climate-related hazards such as storm-induced power outages. To address these gaps, this research proposes a heuristic approach supported by microsimulations to evaluate intersection efficiency with an emphasis on resilience. The method integrates both efficiency and resilience into a flexible framework, analyzing various intersection geometries and control modes under normal and disrupted conditions. From a societal point of view, this study also aims to generate insights to support resilient and efficient intersection design and management, ultimately improving urban mobility and infrastructure stability.
3. Study Areas and Methodology
In this section, the studied intersections are first introduced, followed by a description of the methodologies applied in this research. Figure 1 presents a step-based chart illustrating the proposed framework.
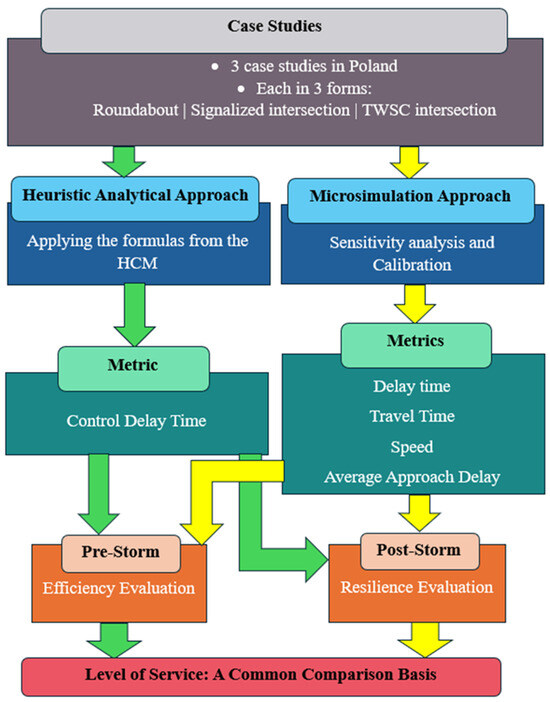
Figure 1.
The methodological approach of the study.
3.1. Overview of Case Studies
This section is dedicated to introducing the case studies in their current situation, as well as further necessary information on the designed traffic control types for each of them. The views and geometric sketches of all examined intersections are illustrated in Figure 2.
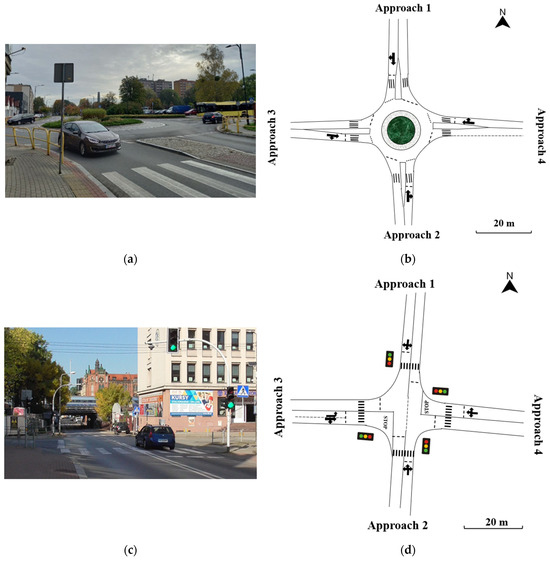
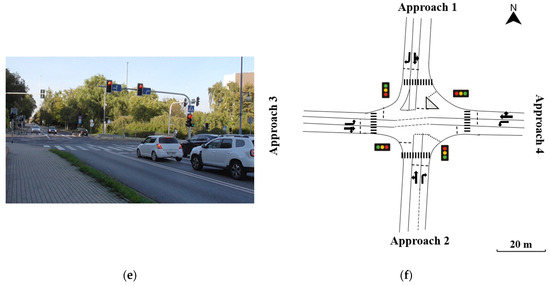
Figure 2.
Examined case studies: (a) View from the west entry at Case Study 1 (latitude: 50.319716, longitude: 19.003237); (b) Geometric sketch of Case Study 1; (c) View from the south entry at Case Study 2 (latitude: 50.255549, longitude: 19.030781); (d) Geometric sketch of Case Study 2; (e) View from the south entry at Case Study 3 (latitude: 50.251557, longitude: 19.029674); (f) Geometric sketch of Case Study 3.
The selected intersections are typical urban road intersections; however, their geometries and layouts make them suitable for design as roundabouts, signalized intersections, or TWSC intersections, aligning with the objectives of this study. They were chosen based on their locations, available facilities, and compatibility with the study’s aims. The intersections are situated near major trip generators, including a university, a cemetery, and several residential and administrative buildings. Field surveys confirmed that these sites experience traffic congestion and performance issues. Moreover, as described in the following paragraphs, the selected case studies differ in geometry, layout, number of lanes per approach, entry and exit traffic flows, and control type, enabling the analysis of a key research question.
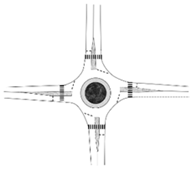
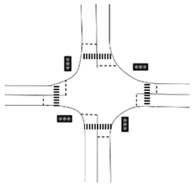
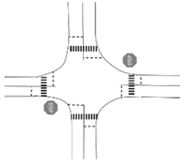
The first case study is a single-lane four-leg roundabout [61], located in a suburban area of Siemianowice Śląskie. Each approach has one entry and one exit lane with a width of 3.50 m (see Figure 2b). It connects Kościelna and Oświęcimska, the major streets, with Maciejkowicka and Plac 11 Listopada, the minor streets. The roundabout has an outer diameter of 30.00 m, and the circulatory roadway is one lane with a width of 5.00 m. The second case study examines a four-leg signalized intersection situated in the urban area of Katowice. Each approach has one entry lane, except for approach 3, which has two entry lanes and one exit lane. All lanes are 3.50 m wide (see Figure 2d). This intersection is at the convergence of Konstantego Damrota, the major street, and Wojewódzka and Zygmunta Krasińskiego, the minor streets. All approaches have one shared lane for left-turn, right-turn, and through movements except approach 3, which has one shared lane for through and right-turn movements, and one exclusive left-turn lane. The third case study is a four-leg signalized intersection located in the urban area of Katowice. Each approach has two entry lanes and one exit lane, with each lane being 3.50 m wide (see Figure 2f). The intersection is at the junction of Konstantego Damrota, the major street, and Powstańców, the minor street. The major street entries consist of one shared lane for left-turn and through movements, and one exclusive right-turn lane. The minor street entries consist of one shared lane for right-turn and through movements, and one exclusive left-turn lane. All the intersections comply with Polish regulations [61,62]. The speed limit is 40 (km/h) in Case Study 1, and 30 (km/h) in Case Studies 2 and 3.
In line with the research objectives, each case study was conceptualized with three different configurations: its existing layout and two alternative designs. For example, Case Study 1, currently a roundabout, is also examined as a signalized intersection and a two-way stop-controlled intersection. Accordingly, the geometric characteristics of all configurations are described for each case study, and the current and designed layouts are presented in Table 1.

Table 1.
The geometries of the current and designed configurations of case studies.
Traffic flow graphs for the case studies are illustrated in Figure 3. The total traffic flows for intersections 1, 2, and 3 are 1311, 1099, and 1452 vehicles per hour, respectively, with heavy vehicles accounting for 12%, 2%, and 3% of these flows. For the analysis, mean traffic volumes during peak hours were applied. Data were collected using two tripod-mounted digital cameras, primarily positioned on sidewalks to capture all vehicle movements, supplemented by on-site observations. Peak hours were identified in consultation with experts and locals and further validated through frequent field surveys conducted during the study period. These peak hours were 7:00 a.m. to 8:30 a.m., 12:00 p.m. to 1:00 p.m., and 3:00 p.m. to 5:00 p.m., with morning and afternoon showing heavier demand, and noon exhibiting a lighter peak. Data collection was performed on weekdays between September and November 2023, spanning at least five full days, from morning to evening at each site. Although the urban context may be regarded as generally conducive to pedestrian and cyclist activity, field observations revealed their presence to be minimal; therefore, their influence on traffic performance was considered negligible and excluded from the analysis.
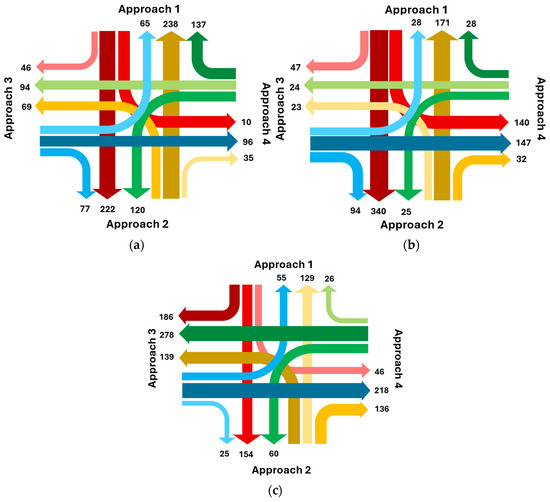
Figure 3.
Traffic flow graphs for: (a) Case Study 1; (b) Case Study 2; (c) Case Study 3. Note: 1—All values are expressed in vehicles per hour. 2—In all traffic flow graphs, the red gradient represents flow from approach 1, the orange gradient from approach 2, the blue gradient from approach 3, and the green gradient from approach 4. 3—Approaches 1 to 4, for each case study, are the same as the approaches illustrated in Figure 2b,d,f.
For the signalized configurations, Case Study 1 was modeled with a cycle length of 90 s under pretimed, fixed timing control, following the design procedure in Chapter 31 of the HCM [18], to equalize the volume-to-capacity ratios for critical lane groups. The existing signalized intersections in Case Studies 2 and 3 operate with pretimed, fixed timings traffic signal control and have cycle lengths of 80 s. In Case Studies 1 and 2, the cycle length is divided into two phases, whereas in Case Study 3, it is divided into four phases. Phase details are presented in Figure 4.
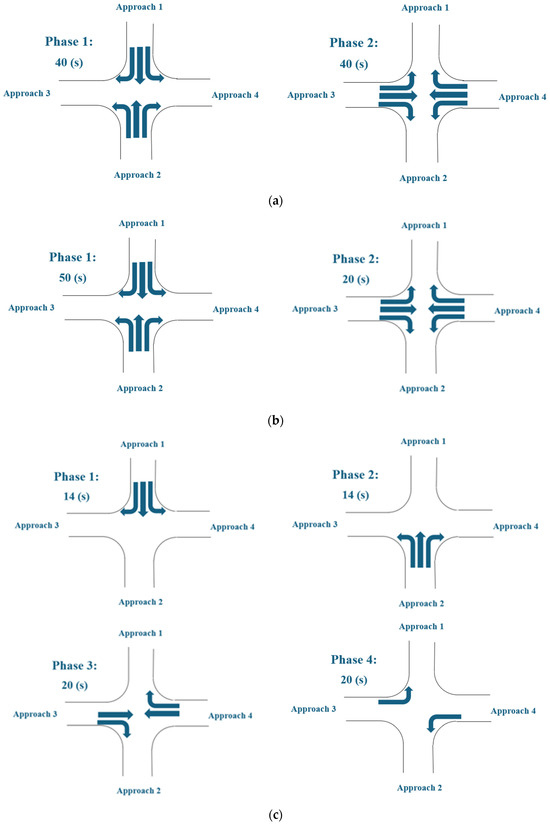
Figure 4.
The phase timing plan diagram for: (a) Case Study 1; (b) Case Study 2; (c) Case Study 3. Note: 1—Approaches 1 to 4, for each case study, are the same as the approaches illustrated in Figure 2b,d,f. 2—The total yellow times in a cycle length for case studies 1, 2, and 3 are 10, 10, and 12 s, respectively.
3.2. Research Methodology
The case studies in this research were analyzed using two methodologies: a heuristic approach, based on the HCM [18], and a microsimulation approach using AIMSUN Next [22]. Each methodology is described in the following sections. It is important to note that signalized intersections were assumed to operate as TWSC intersections following storm events due to power outages. The only storm-related impact considered in this study is the electricity cutoff that occurs after a storm and persists for a certain period.
3.2.1. The Heuristic Approach
This heuristic approach is analytical, and the control delay time is considered the key parameter for assessing the efficiency and resilience of each type of traffic control in pre- and post-storm situations. Control delay measures the time vehicles are slowed or stopped at intersections due to traffic control devices [18]. To calculate the total control delay time for the intersection, the first step is to calculate the control delay time per lane, followed by the control delay time per approach, and finally the control delay time for the entire intersection. The formulas for calculating the control delay time in each lane for roundabouts (Chapter 22 of the HCM [18]), signalized intersections (Chapter 19 of the HCM [18]), and TWSC intersections (Chapter 20 of the HCM [18]) are presented as Equations (1)–(3) in Table 2. Furthermore, the variables, along with a schematic sketch for each traffic control mode, are also introduced in Table 2.

Table 2.
Introducing the control delay time equations and variables for each traffic control mode.
The control delay per approach is calculated as a weighted average of the control delay time for each lane in that approach, with the volume or flow rate of each lane serving as the weight. Similarly, the total control delay time for the intersection is calculated as a weighted average of the control delay time for each approach, with the volume or flow rate of each approach serving as the weight.
Another important parameter in the control delay analysis for each traffic control type, required both for delay time calculations and calibrating the microsimulations, is the capacity (see Table 3, Equations (4)–(6)).

Table 3.
Capacity equations and variables for each traffic control mode.
The adjusted saturation flow rate (rs), expressed in vehicles per hour per lane (veh/h/ln), is calculated by multiplying the base saturation flow rate by the adjustment factors. The base saturation flow rate (rbs) was set to 1750 passenger cars per hour per lane (pc/h/ln) for Case Study 1, and 1900 (pc/h/ln) for Case Studies 2 and 3, following the default values in Chapter 19 of the HCM [18], which are suggested based on city population. The adjustment factors (fi) correct the base saturation flow rate by accounting for the geometry and traffic conditions of the specific lane, such as lane width, heavy vehicles, grades, area type, turning movements, and parking activity adjacent to the lane group. Equation (7) presents the adjusted saturation flow rate, where m is the number of adjustment factors applied to the base saturation flow rate, and all other parameters were introduced earlier. In this study, adjustment factors applied to the base saturation flow rates include heavy vehicles, right-turn movements, and left-turn movements for Case Study 1, with area type added for Case Studies 2 and 3.
The efficiency of each case study under pre-storm scenario was evaluated by calculating total control delay for alternative control strategies, and the results were compared to determine whether the existing configuration represents the most efficient option. Resilience was assessed by comparing total control delay under pre- and post-storm scenarios using the same approach, assuming that after a storm, signalized intersections operate as TWSC during power outages. This comparative analysis identifies the most efficient and resilient control strategies for each case study relative to their current configurations.
The level of service for a lane group, approach, or entire intersection was determined from the calculated or observed control delay time [18]. LOS is categorized from A to F, with A representing the best level of service and F the worst. For motorized vehicles, LOS thresholds depend primarily on the volume-to-capacity ratio and control delay. When the volume-to-capacity exceeds 1 (indicating oversaturation), LOS is rated as F regardless of control delay. Otherwise, LOS is assigned according to control delay thresholds, as summarized in Table 4.

Table 4.
Level of service threshold for motorized vehicles in undersaturated conditions based on [18].
As mentioned earlier in the Introduction Section [20] and in previous paragraphs, the heuristic approach in this study uses control delay time and LOS as indicators of intersection functionality. The values under normal conditions represent the efficiency of the examined intersections. Intersection resilience is defined by comparing these metrics before and after storm events. Finally, a comparison of these results, along with LOS assessments for the examined traffic control types, indicates whether each case study is efficient and resilient under pre- and post-storm scenarios or whether the traffic control type should be reconsidered.
3.2.2. Microsimulation
This section focuses on microsimulation using AIMSUN Next [22]. AIMSUN Next, a widely used transport simulation tool, was selected for this research due to its ability to simulate isolated intersections and road segments [63,64,65], its flexibility in representing diverse intersection layouts, traffic control types, and configurations [63,64], and the availability of a licensed version for this study. In this analysis, only human-driven vehicles were considered in the traffic flow.
Data collected during peak hours were used to develop the Origin-Destination (O-D) matrices. For the studied intersections in Poland, observed traffic flows served as the basis for constructing these matrices. The next step involved replicating the actual geometry of each intersection in AIMSUN Next [22]. This process included defining road sections, specifying the number of lanes per approach, road type, lane width, and speed limit, and then connecting road sections with nodes. Centroids, representing trip start and end points for each approach, were assigned to populate the O-D matrix cells for each intersection.
Depending on the traffic control strategy under investigation, the linking node was defined as a roundabout, a signalized intersection, or a TWSC intersection, with the corresponding input parameters for each mode. For example, signalized intersections required a detailed signal timing plan, including predefined signal groups and phases, turning movements, cycle length, control plan duration, and yellow intervals. For TWSC intersections, movement priorities were specified, while for roundabouts, parameters such as central island diameter, circulating lane width and number, and entry priorities were defined. Detectors were placed at selected points along road sections to record measures such as speed, count, density, flow, and headway.
A dynamic microsimulation scenario was implemented using the stochastic route choice (SRC) method, in which vehicles are probabilistically assigned to routes based on a defined distribution. This allows vehicle trajectories to be observed and their performance statistics analyzed [22]. Each case study model, representing real-world conditions, was simulated for one-hour periods, and the resulting flows were compared against observed data to assess the accuracy of AIMSUN Next in reproducing real traffic conditions. To validate the model, Geoffrey E. Havers’ statistic (GEH index) was used [63]. A model is considered acceptable if 85% or more of the flows have a GEH value below 5. Nearly all models showed GEH results below this threshold. Additionally, the percentage difference between simulated and observed data was examined, averaging around 10% across all case studies. Therefore, calibration of model parameters was required in all scenarios.
A sensitivity analysis of model parameters was conducted for each model to assess the impact of changing each parameter on the simulation results. The sensitivity analysis was performed to identify which parameters significantly affected the simulation outcomes and should be considered for calibration. These parameters are: 1—Speed limit acceptance, reflecting drivers’ compliance with speed limits, where values above 1 indicate exceeding the limit and values below 1 indicate driving under it. 2—Reaction time (s), which is the duration a driver needs to respond to changes in the speed of the vehicle ahead. 3—Reaction time at stop (s), which is the time a stationary vehicle requires to respond to the acceleration of the vehicle ahead. 4—Reaction time at traffic light (s), which is the time the first vehicle waiting at a traffic light takes to respond when the light turns green. 5—Maximum acceleration (m/s2) is the vehicle’s highest possible acceleration, applicable in all conditions, as defined in the Gipps car-following model. 6—Gap (s), allows setting a custom headway between vehicles, overriding the car-following model’s calculated distance, with the effective gap being the lesser of the specified value and the default distance [22].
The most sensitive parameters were calibrated by iteratively adjusting their values to align the simulated capacity data with the observed or calculated capacities, ensuring a more accurate representation of traffic behavior. Calibration was performed for each type of traffic control in every case study. For roundabouts, the conflicting flow ranged from free flow to 2000 vehicles per hour (based on the entry mechanisms described in [66]); for signalized intersections, the effective green time ranged from 10 to 60 s; and for TWSC intersections, the conflicting flow also ranged from free flow to 2000 (veh/h). The default and calibrated model parameter values for each case study are presented in Table 5.

Table 5.
The default and calibrated values of the model parameters.
It is worth noting that, when Case Study 3 was conceptualized as a TWSC intersection, the movement groups were adjusted according to [18] to align with TWSC right-of-way rules. In the signalized intersection under pre- and post-storm conditions, the major streets had two lanes: one shared left-turn and through lane and one exclusive right-turn lane. In the TWSC intersection, these were modified to one exclusive left-turn lane and one shared through and right-turn lane. Based on these adjustments, sensitivity analyses and calibration were necessary for both TWSC intersections in Case Study 3, and the calibrated results are presented in Table 5 as TWSC intersection (post-storm) and TWSC intersection (lane adjustment).
To confirm the validity of the calibration process, the GEH index was used [63]. In all cases, more than 90% of the flows had a GEH value below 5, and the models were therefore accepted based on this. Furthermore, scattergram analysis and t-test were performed to ensure the reliability of the calibration. Figure 5 illustrates the scattergram for the current configuration of Case Study 2, approach 1 (see Figure 2d) as an example. Table 6, Table 7 and Table 8 present the corresponding statistics for comparing simulated versus observed or calculated capacities across all case studies. Due to right-of-way priorities at the TWSC intersection with lane adjustment (explained earlier in the previous paragraph), the calculated capacities for the shared right-turn and through lane were equal across all conflicting flow rates, and the simulated capacity values were nearly identical. Therefore, a t-test was deemed unnecessary for this lane group and is not reported in Table 8.
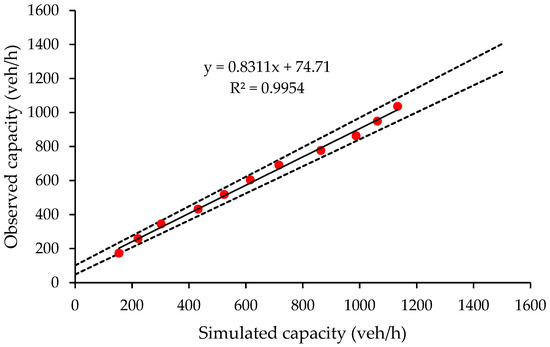
Figure 5.
Scattergram for Case Study 2 in its current configuration.

Table 6.
The statistics of the calibration process in Case Study 1.

Table 7.
The statistics of the calibration process in Case Study 2.

Table 8.
The statistics of the calibration process in Case Study 3.
After calibration, the models were run using mean peak flow rates as inputs. The results and discussion are presented in Section 4 and Section 5. Delay time, travel time, speed, and average approach delay were used as metrics to evaluate the efficiency and resilience of the case studies under pre- and post-storm scenarios.
- Delay time (s/km) is calculated as the difference between travel time under free-flow conditions and actual travel time [22];
- Travel time (s/km) is the average time a vehicle takes to cover one kilometer within the network, calculated as the mean of all individual travel times (exit time minus entrance time) [22];
- Speed (km/h) is the average speed of all vehicles upon exiting the system, computed from each vehicle’s mean travel speed [22];
- Average approach delay (s/veh) is computed by summing the delays of each link weighted by their flow and dividing by the total traffic flow [22].
Finally, the level of service for the average approach delay of each case study was determined according to the HCM [18] classification (see Table 4).
Similar to the heuristic approach, delay time, travel time, speed, average approach delay, and LOS are considered indicators of intersection functionality in the microsimulations. Under normal conditions, these metrics reflect the efficiency of the intersections, whereas their comparison before and after storm events represents intersection resilience.
4. Results
The results section presents findings from two complementary methods used to evaluate intersection efficiency and resilience: a heuristic analytical approach and microsimulations. For the heuristic approach, the average control delay time and the corresponding level of service are reported for all traffic control types and case studies. Microsimulation results include delay time, travel time, speed, average approach delay, and level of service based on the HCM [18] classification. While each method differs in calculation procedures and assumptions, both approaches yield comparable trends and LOS classifications. Presenting the results of both methods separately demonstrates their consistency and convergence, supporting the robustness and reliability of the proposed framework.
4.1. The Heuristic Approach Results
The analysis for Case Studies 1 to 3 considers both pre- and post-storm situations. The pre-storm scenario represents the normal situation before any storm, while the post-storm scenario depicts the situation after a storm, resulting in an electricity outage. Each intersection is assumed to perform as a roundabout, a signalized, or a TWSC intersection, and the baseline of this analysis is Figure 2b,d,f. As noted earlier in the text and in accordance with [18], adjustments were made to the movement groups in Case Study 3 to ensure consistency with right-of-way regulations at the TWSC intersection. In the signalized intersection, the major streets consisted of two lanes: one shared lane designated for left-turn and through movements, and one exclusive right-turn lane. In the TWSC intersection, these were reconfigured into one exclusive left-turn lane and one shared through and right-turn lane. The average control delay time is used as a metric to assess the performance efficiency and resilience of roundabouts, signalized, and TWSC intersections before and after a storm, respectively.
Total control delay is typically used to compare delays across different traffic control types. Control delay, which measures the time vehicles are slowed or stopped at intersections due to traffic control devices, is a crucial metric for determining an intersection’s level of service [18]. In this study, total control delay was analyzed to evaluate the efficiency and resilience of roundabouts, signalized, and two-way stop-controlled intersections before and after a disaster event. The corresponding level of service in each case was also determined to provide a clearer understanding of efficiency and resilience. Figure 6 presents the average control delay for each intersection under the three traffic control types.
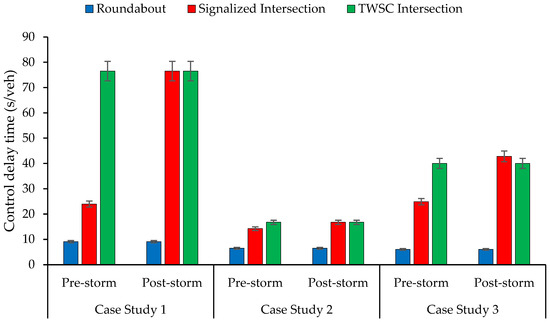
Figure 6.
The average control delay time (s/veh) of the entire intersection in pre- and post-storm conditions for case studies 1 to 3.
Figure 6 illustrates the average control delay time for the entire intersection across the case studies under three traffic control types. The y-axis denotes the average delay in seconds per vehicle (s/veh), while the x-axis distinguishes the case studies and their associated control strategies in both pre- and post-storm conditions. Blue columns correspond to roundabout operations, red columns to signalized intersections, and green columns to TWSC intersections.
Case Study 1 evaluates a roundabout in its current configuration. In both pre- and post-storm conditions, and under the study’s assumption that storm impacts are limited to electricity outages, the average control delay remains constant at 9.09 (s/veh), corresponding to LOS A. When the same site is modeled as a signalized intersection, the outcomes diverge: under pre-storm conditions, signal control results in 23.95 s per vehicle (LOS C), whereas in the post-storm scenario, the assumed power outage renders the signals inoperative, forcing TWSC operation. This shift produces a substantial increase in delay, reaching 76.54 (s/veh), corresponding to LOS F. When directly modeled as a TWSC, the intersection performs identically in pre- and post-storm conditions, consistent with the study’s assumptions, with a delay of 76.54 s per vehicle (LOS F). These results demonstrate the resilience of the roundabout configuration compared to the vulnerability of signalized control under power outages.
Case Study 2 examines a signalized intersection in its existing layout. In the pre-storm scenario, the average control delay is 14.23 s per vehicle (LOS B). Following the electricity outage in post-storm conditions, the intersection defaults to TWSC operation, yielding 16.75 (s/veh), corresponding to LOS C. The marginal difference between pre- and post-storm delays indicates that performance is largely preserved despite the operational shift. When the intersection is modeled as a single-lane roundabout, the delay decreases notably to 6.49 s per vehicle (LOS A), with no change between scenarios due to the study’s assumptions. Finally, when modeled directly as a TWSC, performance remains the same in pre- and post-storm conditions, with a control delay of 16.75 s per vehicle (LOS C). Overall, this case illustrates that certain signalized intersections may maintain acceptable service levels even when converted to TWSC operation during electricity outages.
Case Study 3 considers another signalized intersection. Under pre-storm conditions, the average control delay time is 24.90 (s/veh), corresponding to LOS C. In the post-storm scenario, the assumed outage disables the traffic signals, and the intersection operates as a TWSC with delays increasing to 42.82 s per vehicle (LOS E), marking a substantial deterioration in performance. When reconfigured as a two-lane roundabout, the average delay decreases sharply to 6.05 s per vehicle (LOS A), remaining unchanged between scenarios under the study’s assumptions. Finally, when directly modeled as a TWSC with adjusted movement groups (as described earlier), the intersection again shows identical results in both scenarios, reporting 40.04 (s/veh), corresponding to LOS E. These findings highlight that, for intersections with higher pre-storm delays, the transition to TWSC under outage conditions can produce significant reductions in service quality.
4.2. The Microsimulation Results
The models were reproduced in AIMSUN Next [22], as explained in Section 3.2.2. After completing the calibration process and verifying its reliability, the models are simulated using AIMSUN Next [22], and the results are presented in this section. The delay time, travel time, speed, and average approach delay are considered as metrics to evaluate the efficiency and resilience of different traffic control types in each case study under normal and post-storm conditions. Additionally, the level of service in each situation was determined based on the HCM classification [18], to provide a clearer understanding of efficiency and resilience in the examined case studies. Figure 7, Figure 8, Figure 9 and Figure 10 illustrate the aforementioned values for each case study. In Figure 7, Figure 8, Figure 9 and Figure 10, consistent with Figure 6, the blue columns present the results for roundabouts, the red columns show the values for signalized intersections, and the green columns depict the results of the simulations for the TWSC intersections under pre-and post-storm conditions for each examined case. Similarly, the x-axis represents the case studies and their associated control types in pre- and post-storm conditions, while the y-axis represents the delay time (s/km), travel time (s/km), speed (km/h), and average approach delay (s/veh), respectively.
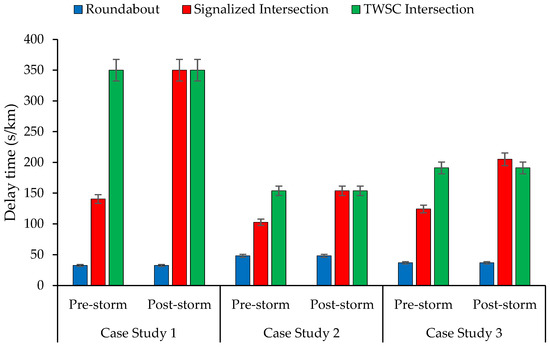
Figure 7.
The comparison of delay time (s/km) in pre- and post-storm situations for case studies 1 to 3.
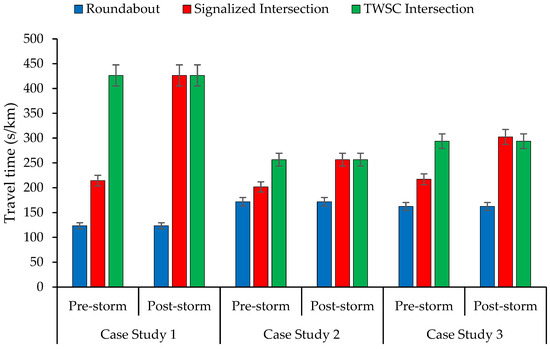
Figure 8.
The comparison of travel time (s/km) in pre- and post-storm situations for case studies 1 to 3.
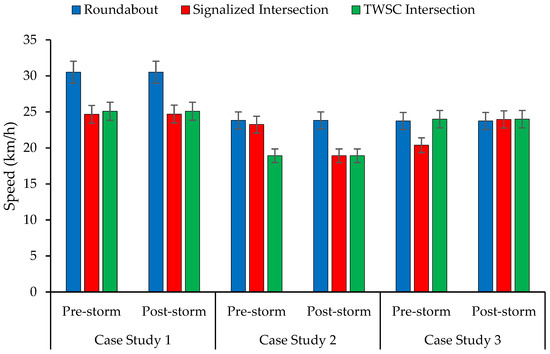
Figure 9.
The comparison of speed (km/h) in pre- and post-storm situations for case studies 1 to 3.
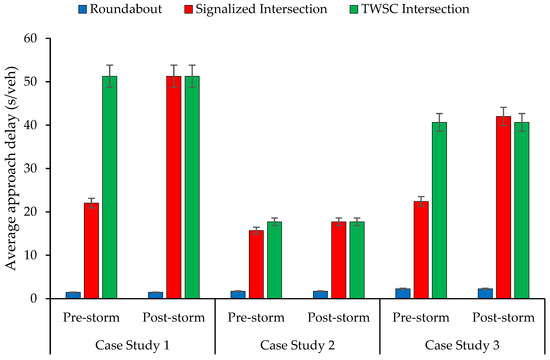
Figure 10.
The comparison of average approach delay (s/veh) in pre- and post-storm situations for case studies 1 to 3.
Figure 7 presents the simulated delay time (s/km) for all case studies under three types of traffic control and in both pre- and post-storm scenarios.
In Case Study 1, the current roundabout configuration shows no change in performance between pre- and post-storm conditions, consistent with the study’s assumptions that storm effects are limited to electricity outages. The average delay remains 32.41 s per kilometer. When modeled as a signalized intersection, delay increases markedly, reaching 140.47 (s/km) under pre-storm conditions and 350.00 (s/km) under post-storm conditions. The intersection is then modeled as a TWSC, which operates identically across both scenarios, with a delay time of 350.00 (s/km).
Case Study 2, a signalized intersection in its current form, shows average control delay times of 102.64 (s/km) pre-storm and 153.91 (s/km) post-storm. When reconfigured as a single-lane roundabout, delay time decreases significantly to 48.07 (s/km) in both scenarios. Under TWSC control, the intersection again performs identically across conditions, reporting 153.91 (s/km), which is consistent with the post-storm signalized case.
Case Study 3, also a signalized intersection, reports 124.36 (s/km) under pre-storm conditions. In the post-storm scenario, the assumed power outage converts operations to TWSC, where delay nearly doubles to 205.19 (s/km). When modeled as a two-lane roundabout, delay decreases substantially to 36.74 (s/km), with no difference between scenarios. After adjusting movement groups to reflect TWSC right-of-way regulations, the modeled TWSC delay equals 191.12 (s/km), which is more than five times the roundabout value but slightly lower than the post-storm condition of the signalized model.
Across all case studies, roundabouts consistently exhibit the lowest delay, regardless of the number of circulating lanes or scenarios. Signalized intersections rank second in pre-storm conditions but deteriorate under the assumed power outage, often matching or exceeding TWSC delays.
Figure 8 shows the simulated travel time (s/km). The bar chart follows the same structure as Figure 7. The results mirror the delay time patterns, though the values differ. For example, in Case Study 1, roundabout configuration produces the shortest travel time at 123.51 (s/km), compared to 214.39 (s/km) under the signalized pre-storm scenario and 426.44 (s/km) under both the signalized post-storm and TWSC scenarios. Similar trends are observed across all case studies.
Simulated speeds (km/h) are depicted in Figure 9. In most cases, roundabout configurations yield higher average speeds than the other control types. However, in Case Study 3 under post-storm conditions, the two-lane roundabout exhibits slightly lower speeds compared to the signalized and TWSC models, suggesting that speed outcomes may not align directly with delay or travel time metrics and warrant further investigation.
Finally, Figure 10 presents the average approach delay (s/veh). The trends are consistent with those observed for delay time and travel time. To better assess the operational performance and resilience of these case studies, these results are also reported here based on the LOS classifications suggested by the HCM [18].
In Case Study 1, the current roundabout configuration maintains an approach delay of 1.46 (s/veh) in both pre- and post-storm conditions, corresponding to LOS A. When modeled as a signalized intersection, this value increases to 22.03 (s/veh) under pre-storm conditions (LOS C) and 51.27 (s/veh) under post-storm conditions (LOS F). Similarly, when the intersection operates as a TWSC, the intersection yields 51.27 (s/veh) in both scenarios (LOS F), matching the post-storm signalized case.
Considering Case Study 2, which is a signalized intersection, the average approach delay equals 15.69 (s/veh) under pre-storm conditions and 17.73 (s/veh) in the post-storm scenario, corresponding to LOS B and LOS C, respectively. The metric’s value when the intersection is modeled as a TWSC intersection remains unchanged compared to the post-storm signalized model. On the other hand, when the intersection is modeled as a single-lane roundabout, the average approach delay decreases to 1.70 (s/veh) under both scenarios, corresponding to LOS A. Although the control delay time (from the heuristic approach) and the average approach delay (from microsimulations) are not directly comparable, Table 9 presents both sets of results for Case Study 2, shown in Figure 6 and Figure 10, along with LOS, as an example that clearly illustrates the findings of this research.

Table 9.
The results obtained from the heuristic approach and microsimulations for Case Study 2.
Case Study 3 is another signalized intersection that under normal conditions reports an average approach delay of 22.42 (s/veh), corresponding to LOS C. However, this metric nearly doubled in post-storm conditions to 42.01 (s/veh), when the intersection operates as a TWSC due to power outages. This delay value corresponds to LOS E. The performance and resilience of a TWSC model under normal and post-storm conditions are 40.64 (s/veh), representing LOS E. When the intersection was reconfigured to a double-lane roundabout, the average approach delay substantially decreased to 2.27 (s/veh) for both scenarios, corresponding to LOS A.
5. Discussion
The operational efficiency of road infrastructure has long been a crucial topic due to the strong dependency of economic and life activities on reliable mobility [1,67]. Although the concept of road resilience is more recent, its importance is not inferior to operational performance and has become a timely research focus [1,2,6,16,68,69]. However, measuring the resilience of road infrastructure is not straightforward; it may depend on the objectives and priorities of decision-makers as well as on the type of disruption to which the road network is exposed.
This study intentionally integrates two complementary methods—a heuristic analytical approach and microsimulations—to evaluate intersection performance under consistent conditions. Presenting both allows for a direct comparison between independent approaches, providing a built-in validation of the results and strengthening the credibility of the conclusions (see Table 9).
In this study, the efficiency and resilience of road intersections were assessed using a heuristic analytical framework and microsimulations. Pre-storm values of performance metrics are used to assess efficiency (operational performance), whereas comparisons of pre- and post-storm values are employed to evaluate resilience.
Although both the heuristic analytical method and AIMSUN Next [22] microsimulations were applied; it is important to acknowledge that their results are not strictly comparable due to methodological differences and variations in performance measure definitions. The heuristic framework reports control delay based on the HCM [18], which aggregates all forms of delay experienced by vehicles at the intersection, including deceleration, stopped delay, and acceleration [18]. In contrast, microsimulation platforms such as AIMSUN typically compute approach delay based on vehicle trajectories, capturing localized delays at stop lines but treating mid-block or re-acceleration time differently [63,70]. These conceptual distinctions explain the numerical discrepancies observed, particularly for roundabouts, where the heuristic approach estimates an average control delay of approximately 9.00 (s/veh) (LOS A), while AIMSUN reports an average approach delay of about 1.50 (s/veh) (LOS A), as observed in Case Study 1.
Despite these numerical differences, this comparison serves as an internal validation of the proposed framework, as the two approaches demonstrate strong convergence when results are interpreted in terms of LOS (see Table 9) and overall delay trends. Across all case studies and traffic control types, both methods consistently identified the relative performance of roundabouts, signalized intersections, and TWSCs under pre- and post-storm scenarios. This suggests that while absolute delay values may differ in some cases, the approaches provide complementary insights: the heuristic framework offers standardized and widely recognized benchmarks, while microsimulation captures more granular and dynamic vehicle interactions [71,72,73]. Accordingly, LOS classification emerges as a robust common ground for integrating analytical and simulation-based findings. At the same time, these differences underscore the need for caution when directly comparing delay magnitudes across methodologies, as highlighted in prior comparative studies [74,75,76].
The combined results yield several important insights regarding the operational performance and resilience of different intersection control types under normal conditions and storm-related electricity outages. Roundabouts consistently exhibited stable performance across pre- and post-storm conditions, underscoring their independence from electrical systems and highlighting their suitability as resilient traffic control solutions during power outages. Furthermore, in all case studies and scenarios, both average control delay (heuristic approach results) and average approach delay (microsimulation results) were lowest for roundabouts, confirming them as the most efficient and resilient option in this study. These findings are consistent with previous studies [6,77,78,79,80], which have also shown that roundabouts are less vulnerable to system disruptions compared to signalized intersections.
Signalized intersections, by contrast, displayed clear vulnerabilities. In pre-storm scenarios, signals typically achieved moderate levels of service (LOS B–C, which are considered acceptable for urban road networks). However, under post-storm conditions, the assumed power outage forced a transition to TWSC operation, which substantially degraded performance—particularly in Case Studies 1 and 3, where delays nearly doubled, indicating reduced resilience. These findings align with earlier research emphasizing the operational risks of power outages at signalized intersections [14,81,82]. Microsimulation results reinforced this vulnerability, showing sharp increases in both delay and travel time when signals became inoperative.
TWSC intersections, whether directly modeled or as a fallback for failed signals, consistently produced higher delays than roundabouts and, in many cases, even higher than signalized intersections under normal conditions. This finding reinforces both HCM evidence [18], and simulation-based studies [14,83,84], which demonstrate that TWSCs perform poorly under heavy or unbalanced traffic due to their reliance on gap acceptance. Notably, Case Study 2 revealed that under moderate traffic, TWSC operation was only marginally less efficient and resilient than signals, suggesting that context-specific factors strongly influence efficiency and resilience assessments. Similar context-sensitive findings have also been reported in case studies in Italy [14].
Periodic reassessment of intersections is often warranted to maintain efficiency, safety, and resilience when evolving traffic demand and driver behavior exceed the capacity of existing control schemes. One real-world example involved converting a TWSC intersection into a turbo roundabout in 2015 [85], a transformation that eliminated congestion, improved capacity, and significantly enhanced safety. Empirical studies enforced this pattern: for instance, retrofitting signalized and stop-controlled intersections to roundabouts in Oxford [86], as well as converting signalized intersections into mini-roundabouts in Michigan [87]. These findings support the argument that traffic control should be periodically reassessed and redesigned in response to shifts in traffic patterns to maintain both efficiency and resilience.
Another noteworthy observation arises from the speed results. While roundabouts generally supported higher average speeds, Case Study 3 showed an exception, where the two-lane roundabout in the post-storm scenario recorded slightly lower average speeds than signalized and TWSC configurations. This suggests that roundabout benefits are not universal and may vary depending on geometry, traffic composition, and flow patterns. Further research should therefore investigate the interplay of speed, safety, and resilience under disrupted conditions.
Finally, the dual-method approach of combining analytical calculations with AIMSUN microsimulations strengthens the analysis. The heuristic framework provided benchmark values and LOS classifications, while microsimulations captured more nuanced patterns in delay, travel time, and speed. The consistency of findings across both approaches increases confidence in the results, although the simplifying assumption that storm impacts are limited to electricity outages should be acknowledged. Other storm-related disruptions, such as flooding, debris, or traffic demand surges, should be explored in future research to generate more comprehensive resilience assessments. Importantly, the convergence between analytical and microsimulation results, together with agreement with published findings, demonstrates that the proposed framework builds upon and extends current knowledge rather than standing in isolation.
6. Conclusions
The main objective of this study was to evaluate the efficiency and resilience of road intersections under pre-storm and post-storm conditions, focusing on roundabouts, signalized intersections, and TWSC intersections. Two complementary approaches were applied: a heuristic analytical method based on the control delay suggested by the HCM [18], and microsimulations using AIMSUN Next 20.0.5 [22]. Three case studies from Poland (a single-lane roundabout and two signalized intersections in their current configurations) were analyzed using data collected between September and November 2023. Each of these intersections was investigated under all three traffic control types. For example, Case Study 1, originally a single-lane roundabout, was also modeled as a signalized intersection and a TWSC intersection for comparison purposes.
The results of both approaches consistently indicated that roundabouts outperformed signalized and TWSC intersections in terms of efficiency and resilience. Their independence from external power supply makes them particularly advantageous in post-storm scenarios involving electricity outages. Signalized intersections generally provided acceptable service under normal conditions but showed substantial performance degradation when signals became inoperative, reverting to TWSC operation. TWSC intersections, whether modeled directly or as a fallback, performed the worst overall, particularly under heavy or unbalanced traffic.
While heuristic and microsimulation methods are not directly comparable due to differences in delay estimation, their convergence in level of service categories confirms LOS as a reliable common basis for integrating results. This convergence reinforces confidence in the consistency and validity of the findings.
From a practical perspective, the results identify roundabouts as the most storm-resilient traffic control strategy, especially in regions prone to electricity disruptions. For signalized intersections, contingency planning should be prioritized, including backup power systems, temporary traffic management strategies, or long-term conversion to more resilient designs.
The findings highlight that intersection efficiency and resilience are site-specific and should be periodically reassessed to adapt to changing conditions. Climatic variations, technological advances in vehicles (e.g., connected and automated vehicles), and evolving traffic demands may render previously optimal control strategies less effective over time. The proposed framework addresses these challenges by integrating efficiency and resilience within a unified approach that relies on a standardized analytical metric. This metric is simple to compute, requires minimal data collection, and is not restricted by climate, environment, or geometry, enabling its application to any intersection worldwide. The framework thus provides a practical, adaptable, and universal tool for maintaining intersection performance in dynamic urban contexts.
The main contribution of this study lies in integrating analytical and simulation-based methods to evaluate intersection resilience under storm conditions. However, it is limited by its core assumption that storm impacts are restricted to electricity outages. Future research should address additional storm-related disruptions (e.g., flooding, debris, or fluctuating demand) and incorporate safety performance metrics. Moreover, due to the negligible presence of pedestrians and cyclists in the analyzed intersections, these modes were excluded from the current analysis. Further studies should examine intersections with substantial pedestrian and cyclist activity to assess their influence on intersection resilience.
In conclusion, while signalized intersections can function efficiently under normal conditions, they remain highly vulnerable to power outages. Roundabouts, by contrast, consistently demonstrated superior operational performance and resilience. These findings underscore the importance of the periodic reassessment of intersection control strategies to ensure long-term efficiency and resilience. For stakeholders, quantitative metrics such as control delay or approach delay provide precise performance measures, while LOS classification offers a practical benchmark for decision-making, particularly when exact delay values are not required.
Author Contributions
Conceptualization, N.Z., E.M. and A.G.; methodology, N.Z., E.M. and A.G.; software, N.Z. and M.L.T.; validation, N.Z. and M.L.T.; formal analysis, N.Z. and E.M.; investigation, N.Z., E.M. and A.G.; resources, N.Z., E.M. and A.G.; data curation, M.L.T., N.Z., E.M. and A.G.; writing—original draft preparation, N.Z.; writing—review and editing M.L.T., N.Z., E.M. and A.G.; visualization, M.L.T., N.Z., E.M. and A.G.; supervision, M.L.T., E.M. and A.G.; project administration, E.M. and N.Z.; funding acquisition N.Z., E.M. and A.G. All authors have read and agreed to the published version of the manuscript.
Funding
This research received no external funding.
Data Availability Statement
The data presented in this study are available on request from the corresponding author due to licensing restrictions of the AIMSUN Next 20.0.5 software used to produce the simulation data.
Acknowledgments
This research has been partially supported by the European Union—Next Generation EU—National Sustainable Mobility Center, Italian Ministry of University and Research, Spoke 9.
Conflicts of Interest
The authors declare no conflicts of interest.
Abbreviations
The following abbreviations are used in this manuscript:
| GEH | Geoffrey E. Havers |
| HCM | Highway Capacity Manual |
| HDV | Human-Driven Vehicle |
| IoV | Internet of Vehicles |
| LOS | Level of Service |
| LSTM | Long Short-Term Memory |
| O-D | Origin-Destination |
| SDGs | Sustainable Development Goals |
| SRC | Stochastic Route Choice |
| TWSC | Two-Way Stop-Controlled |
References
- Kasmalkar, I.G.; Serafin, K.A.; Miao, Y.; Bick, I.A.; Ortolano, L.; Ouyang, D.; Suckale, J. When floods hit the road: Resilience to flood-related traffic disruption in the San Francisco Bay Area and beyond. Sci. Adv. 2020, 6, eaba2423. [Google Scholar] [CrossRef]
- Xu, W.; Zhang, Y.; Proverbs, D.; Zhong, Z. Enhancing the resilience of road networks to flooding. Int. J. Build. Pathol. Adapt. 2024, 42, 213–236. [Google Scholar] [CrossRef]
- Zare, N.; Talebbeydokhti, N. Policies and governance impact maps of floods on metropolitan Shiraz (the first step toward resilience modeling of the city). Int. J. Disaster Risk Reduct. 2018, 28, 298–317. [Google Scholar] [CrossRef]
- World Bank Group. Urban Development. Available online: https://www.worldbank.org/en/topic/urbandevelopment/overview#1 (accessed on 15 July 2025).
- CRED. 2023 Disasters in Numbers: A Significant Year of Disaster Impact; Emergency Events Database: Brussels, Belgium, 2024; p. 8. [Google Scholar]
- Zare, N. Harmonizing Efficiency and Resilience in Road Intersection Performance: A Novel Heuristic for Mobility Infrastructure Assessment. Ph.D. Thesis, University of Palermo, Palermo, Italy, 2025; p. 183. [Google Scholar]
- Li, Z.; Yan, W.; Wang, L. Measuring mobility resilience with network-based simulations of flow dynamics under extreme events. Transp. Res. Part D Transp. Environ. 2024, 135, 104362. [Google Scholar] [CrossRef]
- Carvallo, J.P.; Casey, J. Weather-Related Power Outages Rising. Available online: https://www.climatecentral.org/climate-matters/weather-related-power-outages-rising (accessed on 15 September 2024).
- Stankovski, A.; Gjorgiev, B.; Locher, L.; Sansavini, G. Power blackouts in Europe: Analyses, key insights, and recommendations from empirical evidence. Joule 2023, 7, 2468–2484. [Google Scholar] [CrossRef]
- Batica, J. Methodology for Flood Resilience Assessment in Urban Environments and Mitigation Strategy Development. Ph.D. Thesis, Université Nice Sophia Antipolis, Nice, France, 2015. [Google Scholar]
- Rezvani, S.M.; de Almeida, N.M.; Falcão, M.J. Climate adaptation measures for enhancing urban resilience. Buildings 2023, 13, 2163. [Google Scholar] [CrossRef]
- Lv, Y.; Sarker, M.N.I. Integrative approaches to urban resilience: Evaluating the efficacy of resilience strategies in mitigating climate change vulnerabilities. Heliyon 2024, 10, e28191. [Google Scholar] [CrossRef]
- United Nations Statistics Division. SDG Indicators: Metadata Repository; United Nations: Nairobi, Kenya, 2021.
- Zare, N.; Macioszek, E.; Granà, A.; Giuffrè, T. Blending efficiency and resilience in the performance assessment of urban intersections: A novel heuristic informed by literature review. Sustainability 2024, 16, 2450. [Google Scholar] [CrossRef]
- Therrien, M.-C.; Normandin, J.-M.; Paterson, S.; Pelling, M. Mapping and weaving for urban resilience implementation: A tale of two cities. Cities 2021, 108, 102931. [Google Scholar] [CrossRef]
- Espinet, X.; Schweikert, A.; van den Heever, N.; Chinowsky, P. Planning resilient roads for the future environment and climate change: Quantifying the vulnerability of the primary transport infrastructure system in Mexico. Transp. Policy 2016, 50, 78–86. [Google Scholar] [CrossRef]
- Bengigi, E. Efficiency and Resilience Trade-Offs for Roadway Intersection Design in the US Virgin Islands. Master’s Thesis, Naval Postgraduate School, Monterey, CA, USA, 2020. [Google Scholar]
- National Academies of Sciences, Engineering, and Medicine. Highway Capacity Manual: A Guide for Multimodal Mobility Analysis, 6th ed.; The National Academies Press: Washington, DC, USA, 2016. [CrossRef]
- Sharifi, A. Resilient urban forms: A review of literature on streets and street networks. Build. Environ. 2019, 147, 171–187. [Google Scholar] [CrossRef]
- Boeing, G.; Ha, J. Resilient by design: Simulating street network disruptions across every urban area in the world. Transp. Res. Part A Policy Pract. 2024, 182, 104016. [Google Scholar] [CrossRef]
- Sun, W.; Bocchini, P.; Davison, B.D. Resilience metrics and measurement methods for transportation infrastructure: The state of the art. Sustain. Resilient Infrastruct. 2020, 5, 168–199. [Google Scholar] [CrossRef]
- Aimsun Next. Version20 Dynamic Simulator User Manual; TSS-Transport Simulation Systems: Barcelona, Spain, 2020. [Google Scholar]
- Berrang-Ford, L.; Pearce, T.; Ford, J.D. Systematic review approaches for climate change adaptation research. Reg. Environ. Change 2015, 15, 755–769. [Google Scholar] [CrossRef]
- Klemt-Albert, K.; Hartung, R.; Bahlau, S. Enhancing resilience of traffic networks with a focus on impacts of neuralgic points like urban tunnels. In Resilience Engineering for Urban Tunnels; ASCE: Reston, VA, USA, 2018; pp. 55–70. [Google Scholar] [CrossRef]
- Zhao, Z.; Tang, L.; Yang, X.; Zhang, H.; Li, G.; Li, Q. Identifying critical urban intersections from a fine-grained spatio-temporal perspective. Travel Behav. Soc. 2024, 34, 100649. [Google Scholar] [CrossRef]
- McDaniels, T.L.; Chang, S.E.; Hawkins, D.; Chew, G.; Longstaff, H. Towards disaster-resilient cities: An approach for setting priorities in infrastructure mitigation efforts. Environ. Syst. Dec. 2015, 35, 252–263. [Google Scholar] [CrossRef]
- Pratelli, A.; Leandri, P.; Aiello, R.; Souleyrette, R.R. Intersection redesign for network resilience and safety. Promet-Traffic Transp. 2021, 33, 297–308. [Google Scholar] [CrossRef]
- Yang, P.P.-J. Energy resilient urban form: A design perspective. Energy Procedia 2015, 75, 2922–2927. [Google Scholar] [CrossRef][Green Version]
- Sharafeldin, M.; Farid, A.; Ksaibati, K. Investigating the impact of roadway characteristics on intersection crash severity. Eng 2022, 3, 412–423. [Google Scholar] [CrossRef]
- Hettiarachchi, S.; Wasko, C.; Sharma, A. Rethinking urban storm water management through resilience–The case for using green infrastructure in our warming world. Cities 2022, 128, 103789. [Google Scholar] [CrossRef]
- Mattinzioli, T.; Butt, A.A.; Harvey, J. Literature review on pavements and electric vehicle interaction: A research roadmap. Transp. Res. Part D Transp. Environ. 2023, 122, 103886. [Google Scholar] [CrossRef]
- Mondal, M.A.; Rehena, Z. Priority-based adaptive traffic signal control system for smart cities. SN Comput. Sci. 2022, 3, 417. [Google Scholar] [CrossRef]
- Lv, Y.; Zheng, N. Monash Research Center of Automated and Resilient Road Systems [Its Research Lab]. IEEE Intell. Transp. Syst. Mag. 2023, 15, 166–175. [Google Scholar] [CrossRef]
- Ghaffarpasand, O.; Burke, M.; Osei, L.K.; Ursell, H.; Chapman, S.; Pope, F.D. Vehicle telematics for safer, cleaner and more sustainable urban transport: A review. Sustainability 2022, 14, 16386. [Google Scholar] [CrossRef]
- Mageto, J.; Twinomurinzi, H.; Luke, R.; Mhlongo, S.; Bwalya, K.; Bvuma, S. Building resilience into smart mobility for urban cities: An emerging economy perspective. Int. J. Prod. Res. 2024, 62, 5556–5573. [Google Scholar] [CrossRef]
- Tang, J.; Heinimann, H.R. A resilience-oriented approach for quantitatively assessing recurrent spatial-temporal congestion on urban roads. PLoS ONE 2018, 13, e0190616. [Google Scholar] [CrossRef] [PubMed]
- Chen, G.; wan Zhang, J. Intelligent transportation systems: Machine learning approaches for urban mobility in smart cities. Sustain. Cities Soc. 2024, 107, 105369. [Google Scholar] [CrossRef]
- Magalhaes, R.P.; Lettich, F.; Macedo, J.A.; Nardini, F.M.; Perego, R.; Renso, C.; Trani, R. Speed prediction in large and dynamic traffic sensor networks. Inf. Syst. 2021, 98, 101444. [Google Scholar] [CrossRef]
- Abduljabbar, R.; Dia, H.; Liyanage, S. Machine Learning Traffic Flow Prediction Models for Smart and Sustainable Traffic Management. Infrastructures 2025, 10, 155. [Google Scholar] [CrossRef]
- Topilin, I.; Jiang, J.; Feofilova, A.; Beskopylny, N. Traffic Flow Prediction via a Hybrid CPO-CNN-LSTM-Attention Architecture. Smart Cities 2025, 8, 148. [Google Scholar] [CrossRef]
- Toba, A.-L.; Kulkarni, S.; Khallouli, W.; Pennington, T. Long-Term Traffic Prediction Using Deep Learning Long Short-Term Memory. Smart Cities 2025, 8, 126. [Google Scholar] [CrossRef]
- Mishra, P.; Singh, G. Internet of Vehicles for Sustainable Smart Cities: Opportunities, Issues, and Challenges. Smart Cities 2025, 8, 93. [Google Scholar] [CrossRef]
- Rejeb, A.; Rejeb, K.; Zaher, H.F.; Simske, S. Blockchain and Smart Cities: Co-Word Analysis and BERTopic Modeling. Smart Cities 2025, 8, 111. [Google Scholar] [CrossRef]
- Zhang, L.; Xu, M.; Wang, S. Mitigating vulnerability of a multimodal public transit system for sustainable megacities: A real-time operational control method. Sustain. Cities Soc. 2024, 101, 105142. [Google Scholar] [CrossRef]
- Wassmer, J.; Merz, B.; Marwan, N. Resilience of transportation infrastructure networks to road failures. Chaos 2024, 34. [Google Scholar] [CrossRef] [PubMed]
- Azolin, L.G.; da Silva, A.N.R.; Pinto, N. Incorporating public transport in a methodology for assessing resilience in urban mobility. Transp. Res. Part D Transp. Environ. 2020, 85, 102386. [Google Scholar] [CrossRef]
- Tang, J.; Lin, H.; Fan, X.; Yu, X.; Lu, Q. A topology-based evaluation of resilience on urban road networks against epidemic spread: Implications for COVID-19 responses. Front. Public Health 2022, 10, 1023176. [Google Scholar] [CrossRef]
- Lara, D.V.R.; Pfaffenbichler, P.; da Silva, A.N.R. Modeling the resilience of urban mobility when exposed to the COVID-19 pandemic: A qualitative system dynamics approach. Sustain. Cities Soc. 2023, 91, 104411. [Google Scholar] [CrossRef] [PubMed]
- Liu, Y.; Bu, S.; Zhang, S.; Xu, C. Research on the Socio-Spatial Resilience Evaluation and Evolution of the Central Area of Beijing in Transitional China. Sustainability 2024, 16, 7098. [Google Scholar] [CrossRef]
- Shafiei-Dastjerdi, M.; Lak, A. Towards resilient place emphasizing urban form: An assessment framework in urban design. Sustain. Cities Soc. 2023, 96, 104646. [Google Scholar] [CrossRef]
- Garcia, L.; Hafezi, M.; Lima, L.; Millett, C.; Thompson, J.; Wang, R.; Akaraci, S.; Goel, R.; Reis, R.; Nice, K.A. Future-proofing cities against negative city mobility and public health impacts of impending natural hazards: A system dynamics modelling study. Lancet Planet. Heath 2025, 9, e207–e218. [Google Scholar] [CrossRef]
- Vichiensan, V.; Wasuntarasook, V.; Komkong, T.; Takano, T.; Wongsa, S.; Nakamura, S. Assessing the impact of pluvial flooding adaptation measures on urban transport in Bangkok. Asian Transp. Stud. 2025, 11, 100167. [Google Scholar] [CrossRef]
- Fan, X.; Zhang, X.; Wang, X.; Yu, X. A deep reinforcement learning model for resilient road network recovery under earthquake or flooding hazards. J. Infrastruct. Preserv. Resil. 2023, 4, 8. [Google Scholar] [CrossRef]
- Cheek, W.; Chmutina, K. Measuring resilience in the assumed city. Int. J. Disaster Risk Sci. 2022, 13, 317–329. [Google Scholar] [CrossRef]
- Tarek, S.; Ouf, A.S.E.-D. Biophilic smart cities: The role of nature and technology in enhancing urban resilience. J. Eng. Appl. Sci. 2021, 68, 40. [Google Scholar] [CrossRef]
- Arimah, B. Infrastructure as a Catalyst for the Prosperity of African Cities. Procedia Eng. 2017, 198, 245–266. [Google Scholar] [CrossRef]
- Cordero, D.; Rodriguez, G. Merger of network graph indicators to estimate resilience in Latin American cities. IEEE Access 2022, 10, 81071–81093. [Google Scholar] [CrossRef]
- Tariverdi, M.; Nunez-Del-Prado, M.; Leonova, N.; Rentschler, J. Measuring accessibility to public services and infrastructure criticality for disasters risk management. Sci. Rep. 2023, 13, 1569. [Google Scholar] [CrossRef]
- Santos, T.; Silva, M.A.; Fernandes, V.A.; Marsden, G. Resilience and vulnerability of public transportation fare systems: The case of the city of Rio De Janeiro, Brazil. Sustainability 2020, 12, 647. [Google Scholar] [CrossRef]
- Karagkouni, A.; Dimitriou, D. The Overton Window in Smart City Governance: The Methodology and Results for Mediterranean Cities. Smart Cities 2025, 8, 98. [Google Scholar] [CrossRef]
- Bąk, R.; Gaca, S.; Ostrowski, K.; Tracz, M.; Woźniak, K. Wytyczne Projektowania Skrzyżowań Drogowych, Część II: Ronda; WR-D-31-3; Ministry of Infrastructure: Warsaw, Poland, 2022.
- Bąk, R.; Gaca, S.; Kieć, M.; Ostrowski, K. Guidelines for the Design of Road Intersections. Part 2: Ordinary and Channelized Intersections [Wytyczne Projektowania Skrzyżowań Drogowych. Część 2: Skrzyżowania Zwykłe i Skanalizowane]; Ministry of Infrastructure: Warsaw, Poland; Department of Public Roads: Warsaw, Poland, 2022.
- Barceló, J. Fundamentals of Traffic Simulation; Springer: New York, NY, USA, 2010; Volume 145. [Google Scholar]
- Acuto, F.; Coelho, M.C.; Fernandes, P.; Giuffre, T.; Macioszek, E.; Grana, A. Assessing the environmental performances of urban roundabouts using the VSP methodology and AIMSUN. Energies 2022, 15, 1371. [Google Scholar] [CrossRef]
- Tumminello, M.L.; Macioszek, E.; Granà, A.; Giuffrè, T. Evaluating traffic-calming-based urban road design solutions featuring cooperative driving technologies in energy efficiency transition for smart cities. Energies 2023, 16, 7325. [Google Scholar] [CrossRef]
- Tumminello, M.L.; Macioszek, E.; Granà, A.; Giuffrè, T. Simulation-based analysis of “what-if” scenarios with connected and automated vehicles navigating roundabouts. Sensors 2022, 22, 6670. [Google Scholar] [CrossRef]
- Berdica, K. An introduction to road vulnerability: What has been done, is done and should be done. Transp. Policy 2002, 9, 117–127. [Google Scholar] [CrossRef]
- Jamal, T.B.; Hasan, S.; Abdul-Aziz, O.I.; Mozumder, P.; Meyur, R. Strengthening Infrastructure Resilience to Hurricanes by Modeling Transportation and Electric Power Network Interdependencies. Nat. Hazard. Rev. 2025, 26, 04025024. [Google Scholar] [CrossRef]
- Saei, S.; Tajik, N. Scenario-Based Optimization of Network Resilience: Integrating Vulnerability Assessments and Traffic Flow. arXiv 2025, arXiv:2503.23251. [Google Scholar] [CrossRef]
- Alexiadis, V.; Jeannotte, K.; Chandra, A.; Skabardonis, A.; Dowling, R. Traffic Analysis Toolbox Volume I, Traffic Analysis Tools Primer; United States Federal Highway Administration Office of Research: McLean, VA, USA, 2004.
- Dowling, R.; Skabardonis, A.; Alexiadis, V. Traffic Analysis Toolbox, Volume III: Guidelines for Applying Traffic Microsimulation Modeling Software; Department of Transportation Federal Highway Administration: McLean, VA, USA, 2004.
- Hollander, Y.; Liu, R. The principles of calibrating traffic microsimulation models. Transportation 2008, 35, 347–362. [Google Scholar] [CrossRef]
- Ahn, K.; Rakha, H.; Trani, A.; Van Aerde, M. Estimating vehicle fuel consumption and emissions based on instantaneous speed and acceleration levels. J. Transp. Eng. 2002, 128, 182–190. [Google Scholar] [CrossRef]
- Dion, F.; Rakha, H.; Kang, Y.-S. Comparison of delay estimates at under-saturated and over-saturated pre-timed signalized intersections. Transp. Res. Part B Methodol. 2004, 38, 99–122. [Google Scholar] [CrossRef]
- Kim, S.-O.; Benekohal, R.F. Comparison of control delays from CORSIM and the Highway Capacity Manual for oversaturated signalized intersections. J. Transp. Eng. 2005, 131, 917–923. [Google Scholar] [CrossRef]
- Ghanim, M.S.; Shaaban, K.; Allawi, S. Operational performance of signalized intersections: HCM and microsimulation comparison. In Proceedings of the 2022 Intermountain Engineering, Technology and Computing (IETC), Orem, UT, USA, 13–14 May 2022. [Google Scholar] [CrossRef]
- Taglieri, D.; Liu, H.; Gayah, V.V. Network-wide implementation of roundabouts versus signalized intersections on urban streets: Analytical and simulation comparison. Transp. Res. Rec. 2024, 2678, 719–735. [Google Scholar] [CrossRef]
- Demir, H.G.; Demir, Y.K. A Comparison of traffic flow performance of roundabouts and signalized intersections: A case study in Nigde. Open Transp. J. 2020, 14, 120–132. [Google Scholar] [CrossRef]
- Taglieri, D. Urban Traffic Network Operations: Roundabouts vs. Signalized Intersections. Master’s Thesis, Penn State University, University Park, PA, USA, 2022. [Google Scholar]
- Macioszek, E. Roundabout entry capacity calculation—A case study based on roundabouts in Tokyo, Japan, and Tokyo surroundings. Sustainability 2020, 12, 1533. [Google Scholar] [CrossRef]
- Ansariyar, A.; Jeihani, M. Real-time traffic control and safety measure analysis using LiDAR sensor during traffic signal failures. In Proceedings of the International Conference on Transportation and Development 2024, Atlanta, GA, USA, 15–18 June 2024; pp. 798–810. [Google Scholar]
- Chandler, B.E.; Myers, M.; Atkinson, J.E.; Bryer, T.; Retting, R.; Smithline, J.; Trim, J.; Wojtkiewicz, P.; Thomas, G.B.; Venglar, S.P. Signalized Intersections Informational Guide; Department of Transportation Federal Highway Administration: Washington, DC, USA, 2013.
- Yang, Z.; Zhang, Y.; Grembek, O. Combining traffic efficiency and traffic safety in countermeasure selection to improve pedestrian safety at two-way stop controlled intersections. Transp. Res. Part A Policy Pract. 2016, 91, 286–301. [Google Scholar] [CrossRef]
- Kaczorek, M.; Jacyna, M. Fuzzy logic as a decision-making support tool in planning transport development. Arch. Transp. 2022, 61, 51–70. [Google Scholar] [CrossRef]
- Macioszek, E.; Kurek, A. A case study analysis of roundabouts entry capacity localised on one of the main road in Sosnowiec city (Poland). Zesz. Naukowe. Transp./Politech. Śląska 2019, 105, 139–156. [Google Scholar] [CrossRef]
- Uddin, W.; Headrick, J.; Sullivan, J.S. Performance Evaluation of Roundabouts for Traffic Flow Improvements and Crash Reductions at a Highway Interchange in Oxford, MS. In Proceedings of the Transportation Research Board 91st Annual Meeting, Washington, DC, USA, 22–26 January 2012. [Google Scholar]
- Qawasmeh, B.; Kwigizile, V.; Oh, J.-S. Performance and safety effectiveness evaluation of mini-roundabouts in Michigan. J. Eng. Appl. Sci. 2023, 70, 36. [Google Scholar] [CrossRef]
Disclaimer/Publisher’s Note: The statements, opinions and data contained in all publications are solely those of the individual author(s) and contributor(s) and not of MDPI and/or the editor(s). MDPI and/or the editor(s) disclaim responsibility for any injury to people or property resulting from any ideas, methods, instructions or products referred to in the content. |
© 2025 by the authors. Licensee MDPI, Basel, Switzerland. This article is an open access article distributed under the terms and conditions of the Creative Commons Attribution (CC BY) license (https://creativecommons.org/licenses/by/4.0/).
