Article

Striking a Pose: DIY Computer Vision Sensor Kit to Measure Public Life Using Pose Estimation Enhanced Action Recognition Model

1
Norman B. Leventhal Center for Advanced Urbanism, Massachusetts Institute of Technology, 75 Amherst Street, E14-140, Cambridge, MA 02142, USA
2
Department of Urban Studies and Planning, Massachusetts Institute of Technology, 77 Massachusetts Avenue, Cambridge, MA 02142, USA
*
Authors to whom correspondence should be addressed.
Smart Cities 2025, 8(6), 183; https://doi.org/10.3390/smartcities8060183
Submission received: 12 August 2025 / Revised: 14 October 2025 / Accepted: 20 October 2025 / Published: 1 November 2025
(This article belongs to the Special Issue Computer Vision for Creating Sustainable Smart Cities of Tomorrow)

Highlights

What are the main findings?
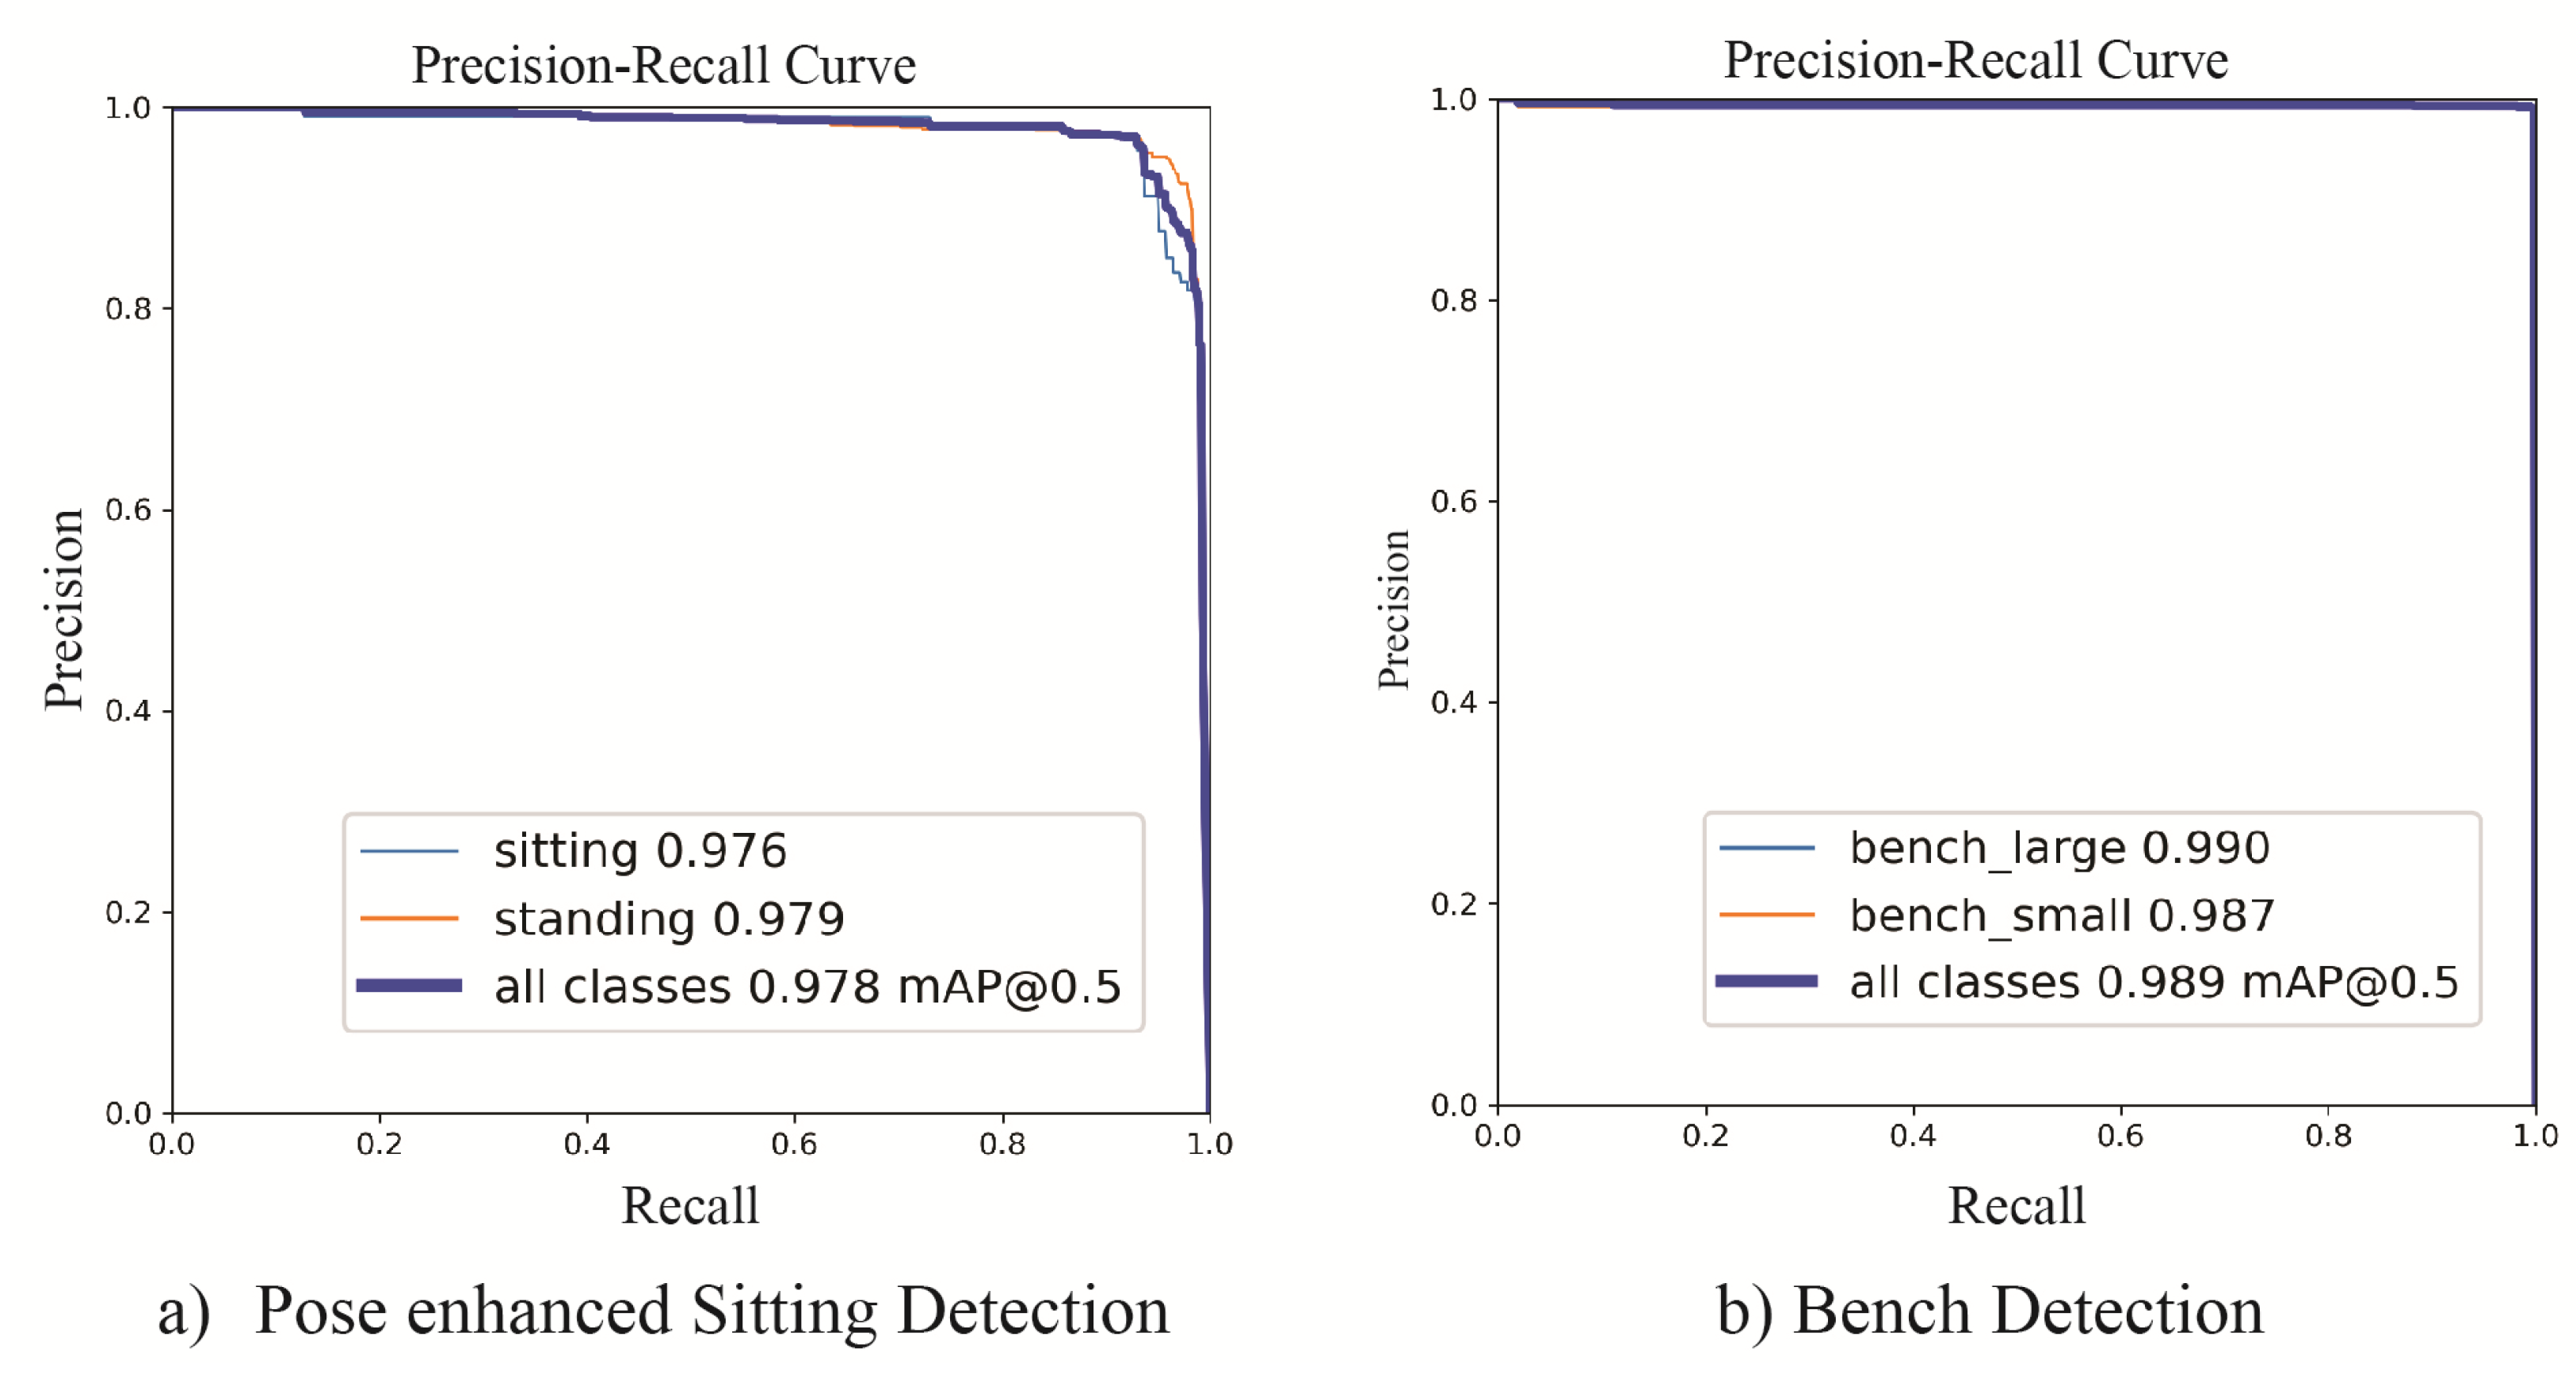
  • This study found that integrating a pose estimation model with a traditional computer vision model improves the accuracy and reliability of detecting public-space behaviors such as sitting and socializing. The pose-enhanced sitting recognition model achieved a mean Average Precision (mAP@0.5) of 97.8%, showing major gains in precision, recall, and generalizability compared to both baseline data and commercially available vision recognition systems.
  • Measurements from the field deployment of movable benches at the University of New South Wales demonstrated a clear behavioral impact. The number of people staying increased by 360%, sitting rose by 1400%, and socializing grew from none to an average of nine individuals per day.
What is the implication of the main finding?
  • Including pose estimation models with vision recognition models can improve standardized vision recognition models of public space elements. This improvement can help better measure public space.
  • The Public Life Sensor Kit (PLSK) developed through this research provides a scalable, low-cost, and privacy-conscious framework for real-time behavioral observation. As an open-source and edge-based alternative to commercial sensors, it enables researchers to continuously measure human activity without storing identifiable video. This approach democratizes behavioral observation, enabling local governments and communities to collect high-resolution data ethically.

Abstract

Observing and measuring public life is essential for designing inclusive, vibrant, and climate-resilient public spaces. While urban planners have traditionally relied on manual observation, recent advances in open-source Computer Vision (CV) now enable automated analysis. However, most CV sensors in urban studies focus on transportation analysis, offering limited insight into nuanced human behaviors such as sitting or socializing. This limitation stems in part from the challenges CV algorithms face in detecting subtle activities within public spaces. This study introduces the Public Life Sensor Kit (PLSK), an open-source, do-it-yourself system that integrates a GoPro camera with an NVIDIA Jetson edge device, and evaluates whether pose estimation-enhanced CV models can improve the detection of fine-grained public life behaviors, such as sitting and social interaction. The PLSK was deployed during a public space intervention project in Sydney, Australia. The resulting data were measured against data collected from the Vivacity sensor, a commercial transportation-focused CV system, and traditional human observation. The results show that the PLSK outperforms the commercial sensor in detecting and classifying key public life activities, including pedestrian traffic, sitting, and socializing. These findings highlight the potential of the PLSK to support ethically collected and behavior-rich public space analysis and advocate for its adoption in next-generation urban sensing technologies.

1. Introduction

Understanding the physical and social dynamics that contribute to successful public spaces remains a core area of interest for urban planners and designers. As William H. Whyte famously noted, “The best way to know how people use a space is to simply watch them.” His study, The Social Life of Small Urban Spaces (1980), pioneered the use of observational study and manual time-lapse video analysis to quantify social life in small urban spaces, including pedestrian movement, lingering, and group formation. Traditional methods, such as direct observation, interviews, and recorded video analysis [1,2,3], have long provided valuable insights into human behavior in urban settings. Even contemporary research, such as studies on climate change and public behavior, frequently relies on traditional approaches involving human surveys and observational techniques [4,5,6]. However, such traditional methods of mapping people’s movement trajectories, counting pedestrians, tracking behaviors such as sitting or standing with duration, and documenting group behaviors such as socializing are time-consuming, labor-intensive, and limited in temporal and spatial scale, making them difficult to sustain over extended periods or across multiple sites.
The growing accessibility of Computer Vision (CV) algorithms has opened new possibilities for automating the observation of small urban spaces. Several pioneering studies have demonstrated that CV can augment labor-intensive, survey-based studies of social life [7,8,9,10,11]. Yet despite these advances, practical tools for designers and planners remain limited. Most commercial CV sensors are optimized for transportation analytics and surveillance, lacking the ability to recognize fine-grained social behaviors such as sitting or socializing, without compromising privacy. Furthermore, much of the urban CV research depends on imagery collected by external organizations rather than original field data. While large-scale static street-view imagery (SVI) [12,13,14,15,16,17,18,19,20,21,22,23,24] has been valuable for assessing built-environment qualities, it cannot capture the dynamic and temporal dimensions of social life in small urban spaces.
To address these limitations, this study introduces the Public Life Sensor Kit (PLSK), an open-source framework designed to democratize CV-based observation of social life in public spaces. PLSK enables users to collect and analyze data at specific locations of interest using lightweight, privacy-preserving hardware and customizable behavioral-recognition models. The framework integrates pose-enhanced models capable of identifying nuanced behaviors such as sitting and standing. Tested in a small-scale urban-space improvement project featuring movable benches at the University of New South Wales (UNSW) in Sydney, Australia, PLSK was benchmarked against a commercially available CV sensor and non-pose-enhanced baseline model, demonstrating its effectiveness in automating behavioral observation while maintaining transparency and adaptability for public space research.

2. Literature Review

2.1. Historical Context of Research on Public Life

In the late twentieth century, urban design underwent a philosophical shift toward people-centered and place-based approaches. Designers and planners began prioritizing the performance, vitality, and everyday use of spaces as key indicators of urban design quality [3]. Understanding the physical features that contribute to vibrant public spaces has since become essential for contemporary urban planners and designers. A growing body of research shows that well-designed environments, those that encourage people to linger, interact, and feel safe, have profound implications for addressing some of today’s most pressing societal challenges, including public health, racial justice, and gender equity [25,26,27].
In addition, studies utilizing surveys and focus groups have demonstrated that high-quality public spaces facilitate social interaction and foster place attachment, which in turn strengthens community cohesion [28]. Scholars have also highlighted the economic benefits of such spaces, showing that thoughtful design interventions can increase foot traffic, support small businesses, and contribute to the vibrancy of commercial districts [29]. As shared spaces where individuals of all backgrounds have a right to be and are often compelled to encounter others, vibrant public spaces have become a key focus of multidisciplinary research, engaging fields beyond urban planning, including sociology, public health, and economics.
Historically, public life studies have relied on direct human observation to analyze and quantify urban activity. Early methodologies emphasized techniques such as observation to cognitive mapping [1] and time-lapse video recordings [2] to document pedestrian flows, seating choices, and patterns of social interaction. A significant contribution to this tradition was made by Gehl and Svarre [30] in the book titled How to Study Public Life. The book introduced a systematic approach based on five questions: how many, who, where, what, and how long. The approach has been influential in assessing spatial activity, quantifying the social dimension of the use of public space, and making urban design interventions aimed at improving livability.
Building on this foundation, the Public Life Data Protocol [31] refined these methods by bringing a standardized approach to the collection and analysis of public life data across various geographical and cultural contexts. The protocol presents survey tools that aim to record pedestrian activity, seating behavior, and social interaction and, thereby, offer a solid basis to evaluate the influence of urban design interventions on public behavior.
One of the most important observations in Gehl’s work is the division of public life activities into various categories of engagement, particularly in relation to staying, sitting, and socializing. He draws a distinction between necessary activities, such as commuting and shopping, and optional activities, such as strolling, sitting, or resting. The distinction emphasizes how open public spaces create more engagement in optional activities and hence more regular social interaction [30]. The Public Life Data Protocol builds on this insight by structuring data collection around these categories, thereby enabling a more nuanced understanding of how urban spaces function as social environments.
Although traditional observational methods have provided valuable insight and data for urban planners, they are time-consuming, labor-intensive, and typically restricted to specific times, making them difficult to scale. As urban environments become increasingly complex and diverse, there is a growing demand for automated, high-resolution data collection methods that support more inclusive, objective, and data-driven decision-making. Recent advances in CV and artificial intelligence (AI) offer promising tools to create an automated approach towards the development of continuous, high-resolution monitoring of how people interact with their environments, providing urban designers with actionable insights to guide the strategic placement of shade structures, vegetation, and street furniture. In doing so, CV can support the evaluation and creation of public spaces that are not only socially vibrant but also environmentally adaptive.

2.2. Computer Vision in Urban Studies and Public Life

CV has become an important tool in urban studies, enabling automated, data-driven analysis of the built environment. Recent open-source methods for image segmentation, object detection, and classification allow researchers to quantify urban form and activity with substantially less manual effort than traditional observation.

2.2.1. Urban Studies Using Data Collected by External Providers

Many CV-based urban studies rely on imagery that already exists online, such as SVI, rather than site-specific field collection. SVI is one of the most widely used datasets for Computer Vision studies in urban environments. Frameworks such as Zhang et al. [32] use SVI to classify urban features—green space, housing types, sidewalk quality—and relate them to socio-demographic indicators. Other SVI studies examine public health [12,13], mobility and walkability [14,15,16,17,18,19,20,21], and urban economic patterns [22,23,24]. A substantial literature also extracts climate-related metrics from SVI. The Green View Index (GVI) quantifies visible greenery and has been linked to travel behavior and physical activity [33,34]. The Sky View Factor (SVF), originating in urban climatology and architectural studies of enclosure, measures the fraction of sky visible from the ground and is widely used to analyze microclimate and urban heat [35,36]. Beyond SVI, satellite imagery supports flood assessment and green-infrastructure mapping [37,38,39,40].
Recently, multimodal large language models (MLLMs) and vision-language models (VLMs) have been applied to SVI. Hosseini et al. [41] introduced the ELSA (Evaluating the Localization of Social Activities) benchmark to evaluate the localization of social activities with Open-Vocabulary Object Detection (OVD) models, which are defined by their ability to identify objects based on prompts that rely on a vast and flexible vocabulary [42]. However, the study reveals that even well-known models like Grounding DINO struggle to differentiate between basic human actions such as sitting, standing, and running, assigning similar confidence scores (e.g., 0.44, 0.53, and 0.53, respectively). Furthermore, Zhang et al. [43] revealed that MLLM-generated safety assessments showed no significant difference from human safety perception surveys, demonstrating that MLLMs can reliably estimate perceived urban safety from SVI and enable efficient, city-scale assessment. Similarly, Zhou et al. [44] found that MLLM-generated aesthetic scores exhibited strong alignment with a human-rated benchmark dataset and used an MLLM to evaluate the visual attractiveness of Chongqing’s streetscapes using SVI, emphasizing the rapid, scalable evaluation capability of MLLM for macro-level urban visual analysis.
Recent studies have also applied CV to footage collected by unmanned aerial vehicles (UAVs) [45], developing models for traffic monitoring and public-safety surveillance. However, their model training and evaluation primarily rely on datasets collected by others (e.g., VisDrone, UAVDT) without validating the model’s performance within a specific area of interest. Similarly, Balivada et al. [46] presented a CV approach for road-anomaly detection and severity assessment, again benchmarking on publicly available datasets (UAV-PDD2023, UAV Pavement Crack, PDS-UAV, B21-CAP0388). While these UAV-based advances are promising for traffic monitoring and surveillance, current models have not yet been evaluated for their ability to capture continuous, place-specific dynamics in urban spaces or other targeted areas of interest.
Despite these technological advancements, relying on SVI, UAV imagery, and satellite imagery to study the dynamic nature of social life in urban spaces presents important limitations. Urban environments change continuously, and activities such as sitting or lingering vary by time of day, day of the week, and season. Much of the existing research depends on periodically updated sources like Google Street View (GSV), which restricts the ability to capture short-term or real-time changes in public behavior. In addition, limited accessibility, perspective distortions, and infrequent updates make these sources poorly suited to rapidly changing phenomena [47,48,49].

2.2.2. Urban Studies Using Data Collected by the Researchers

Beyond relying on datasets collected by others, a growing body of work collects original data to enable fine-grained, continuous, and high-resolution CV analyses for the areas of interest. Broadly, two approaches appear in the literature: (1) applying CV to video obtained from existing closed-circuit television (CCTV) feeds or other pre-recorded footage, and (2) performing on-device inference with sensor kits equipped with a customized CV model to detect objects of interest to generate privacy-preserving measurements.
CV applied after data collection: CCTV and pre-recorded footage
A large body of work applies CV to imagery acquired prior to analysis, most commonly CCTV feeds or other pre-recorded videos. For example, Salazar-Miranda et al. [8] analyze changes in pedestrian behavior across four US public spaces using videos captured at two points in time. Numerous studies focus on abnormal- or event-detection using CCTV [50,51,52,53,54], while others leverage municipal surveillance cameras to characterize park use patterns [55]. Kim and Chan [56] develop and test a model for pedestrian road-crossing alerts using pre-recorded video. More recently, vision-language approaches such as TrafficVLM generate natural-language descriptions of traffic scenes and pedestrian activity from video [57]. Within public-life research specifically, several studies process site-recorded footage offline to examine fine-grained social behaviors. Loo and Fan [9] use time-lapse video to relate edges, movable furniture, and landmarks to patterns of social interaction in urban parks, and Williams et al. [11] evaluate the feasibility of CV methods for quantifying activities in public space and highlight barriers to adoption by planning practitioners.
While post-hoc analysis yields rich behavioral insight, it typically requires collecting and storing identifiable video, which raises privacy risks and introduces consent, retention, and governance challenges that can conflict with community expectations. These constraints motivate on-device, privacy-preserving approaches that perform computation locally, minimize or avoid raw video storage, and output task-specific summaries suitable for ethical and scalable monitoring.
CV applied while data are collected: On-device and edge inference.
An emerging line of work performs inference directly on edge devices during data collection. For example, Chen and Wang [58] detect passenger crossing behavior in stations using an NVIDIA Jetson Nano with a custom YOLOv5 model. Sarvajcz et al. [59] deploy a Jetson Nano system for real-time pedestrian and priority-sign detection mounted on a vehicle. Wang et al. [60] design a YOLO-based pedestrian detector on the Jetson Xavier platform. Closer to public-space monitoring, Salazar-Miranda et al. [15] introduce a custom sensor kit that records street activity and runs inference on the device, demonstrating a privacy-preserving collection pipeline. However, the reported average precision (AP) for the “stayer” class is 0.48, indicating that behavior-specific recognition still requires detection model advances to achieve robust performance, which we seek to do in our research. Commercial edge-based CV sensors are also common in transportation monitoring and analytics [61,62]. These systems are optimized for flow monitoring, emphasizing vehicle and pedestrian counts and occupancy while giving limited consideration to public-life behaviors such as staying, sitting, and mingling. Moreover, they seldom provide spatial mapping outputs which are necessary for analyzing small urban spaces.

2.2.3. Contributions to Public-Life Sensing and Urban Computer Vision

It is clear that urban studies research has applied CV to existing third-party imagery, such as SVI, researcher-pre-recorded video, and CCTV. These sources support valuable analyses but present limitations for studying the dynamics of small urban spaces. Static or externally curated imagery, such as SVI, cannot capture near-real-time change at specific sites. Offline processing of recorded footage raises privacy, consent, and governance challenges that hinder sustained deployment across many locations. By contrast, edge inference, such as the one developed for the study, offers a path toward local computation, which limits raw-video storage, thereby improving privacy protection and task-specific outputs aligned with research questions.
This study contributes to that direction by (1) developing an open-source, edge-based sensor kit oriented to public-life measurement in small urban spaces; and (2) introducing a pose-enhanced fine-tuning approach for action recognition that targets behaviors salient to planning practice, such as sitting versus standing. Together, these elements address gaps in prior work that focus primarily on transportation counts or rely on post-hoc, privacy-sensitive video processing, and they provide a replicable framework for ethical, fine-grained observation in the field.

3. Methodology

3.1. Public Life Sensor Kit Development

3.1.1. Hardware: Edge Device and Camera System

This study developed an open-source sensor kit to enable continuous, real-time data collection in public spaces using CV technology for automated behavioral analysis. The system consisted of two main components, as shown in Figure 1. The first was an edge computing device, the NVIDIA Jetson Orin Nano, which performed on-device computer vision inference and data processing. The second was a GoPro camera that provided the video input. By leveraging edge computing, this research addressed common challenges associated with cloud-dependent CV systems, such as latency, bandwidth constraints, and privacy risks [63]. Unlike cloud-based processing, which requires transmitting raw video footage to external servers, edge devices perform computations locally, ensuring that only processed outputs, such as object detections and metadata, are stored or shared. This approach significantly enhances data security and user privacy, offering a more ethical and practical solution for urban monitoring applications [64]. In addition to its technical and ethical advantages, the system was cost-effective. The NVIDIA Jetson Orin Nano, the edge device used in this study, was available on the market at the time for approximately $249 [65], whereas renting a comparable cloud GPU (e.g., NVIDIA T4) for one month could cost around $255 [66]. This economic accessibility further supports the scalability and replicability of the proposed approach for researchers and city governments alike.
NVIDIA Jetson Orin Nano for On-device Processing.
For on-device, low-latency data processing, this study employed the NVIDIA Jetson Orin Nano—an edge computing device released in 2023. There were two primary reasons for the use of this particular hardware. Primarily, NVIDIA Jetson has been widely adopted in CV-based pedestrian and vehicle detection urban research with demonstrated effectiveness in real-world urban research, smart city projects, and smart mobility research [58,59,60,67,68,69,70]. The hardware facilitates on-device GPU acceleration, enabling low-latency object detection and tracking, which are important for monitoring public areas in real-time.
Second, the Jetson Orin Nano provides scalability and compatibility with real-world applications beyond academia, as it has been integrated into smart city data collection, traffic analysis, and AI-driven urban planning initiatives by companies such as Vivacity and Sighthound [61,62]. Moreover, NVIDIA’s Linux-based operating system has a user-friendly GUI, making it simple to use and hence easy for researchers with different technical backgrounds to operate the system.
GoPro for Video Capture and Streaming.
To capture live site activity, this study employed a GoPro camera, building on methodologies from previous projects. For example, Square Nine used aerial imagery captured with a GoPro to monitor furniture movement and assess visitor engagement within a plaza [71]. Similarly, the BenchMark project mounted GoPro cameras on static boards to capture images every five seconds, which were later analyzed to identify pedestrian patterns in public spaces [11].
Following these precedents, the present study leveraged the GoPro’s waterproof and outdoor-ready design, compact and lightweight form factor, and built-in wireless capabilities for remote operation. The camera was connected to the NVIDIA Jetson Orin Nano via a dedicated peer-to-peer (P2P) Wi-Fi Direct link, enabling stable, low-latency video transmission independent of external network infrastructure. In this configuration, the Jetson is connected directly to the GoPro’s local Wi-Fi SSID without requiring a router, ensuring continuous streaming even in outdoor environments with limited connectivity. The connection and live stream were managed programmatically using the OpenGoPro Python SDK (version 0.16.1), which allowed remote camera control and streaming initiation through asynchronous commands.

3.1.2. Software: Computer Vision Model for Public Life Studies

Pose Estimation-Enhanced Model for Improving the Accuracy of Human Behavior Detection.
Recognizing human actions using CV has long been hindered by low classification accuracy and generalizability in different environments, even when analyzing pre-recorded video footage. However, pose estimation has shown substantial promise in enhancing the localization and interpretation of human behavior [72]. In particular, fields such as sports analytics have already demonstrated the utility of pose estimation for tracking and analyzing complex movement patterns [73,74]. Similarly, Hosseini et al. [41] highlight the potential of pose estimation-based CV models to improve the detection of social behaviors. Yet, despite this promise, human behavior detection using pose estimation has not yet been implemented in urban studies within real-world public space settings outside the lab.
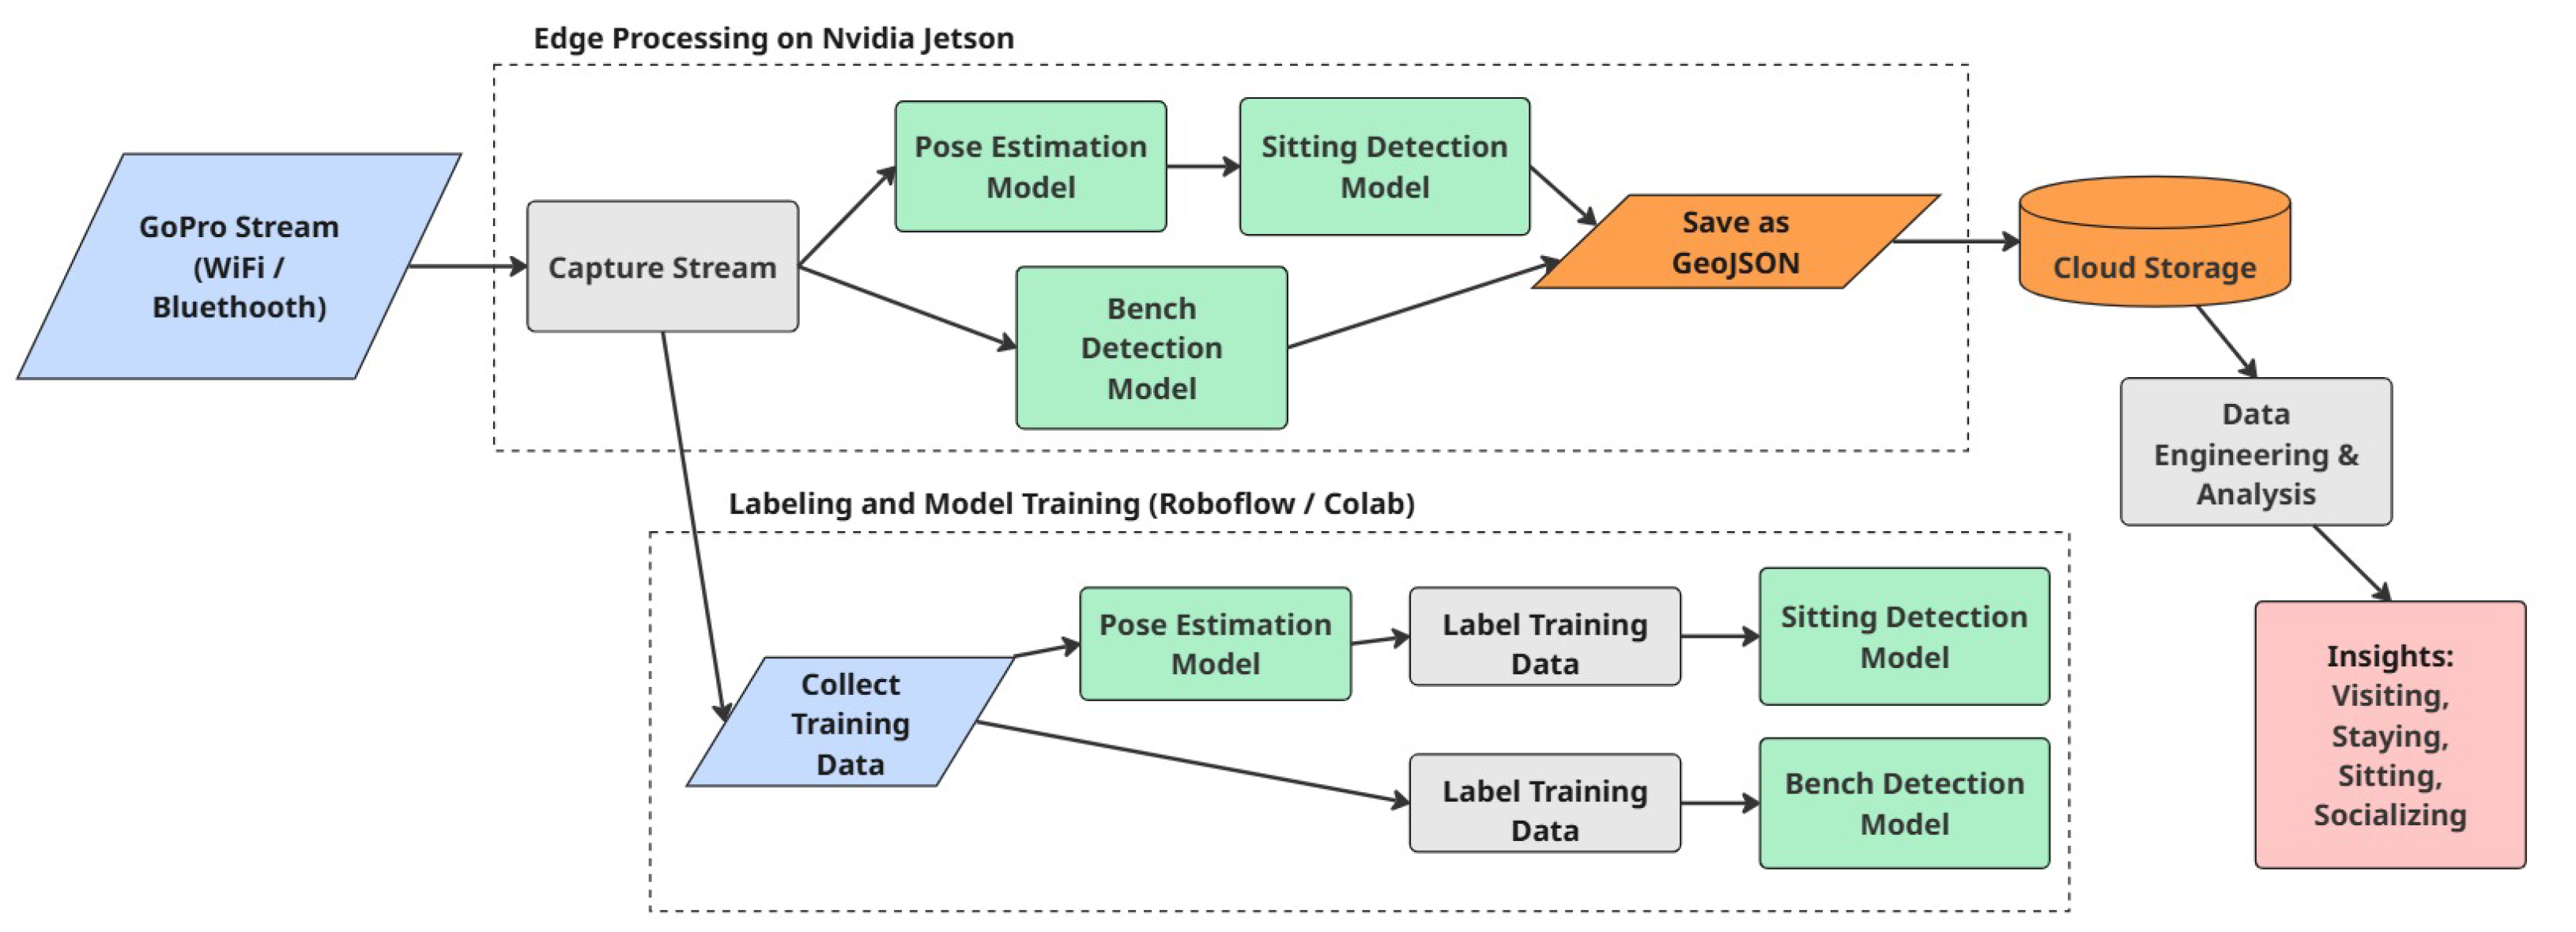
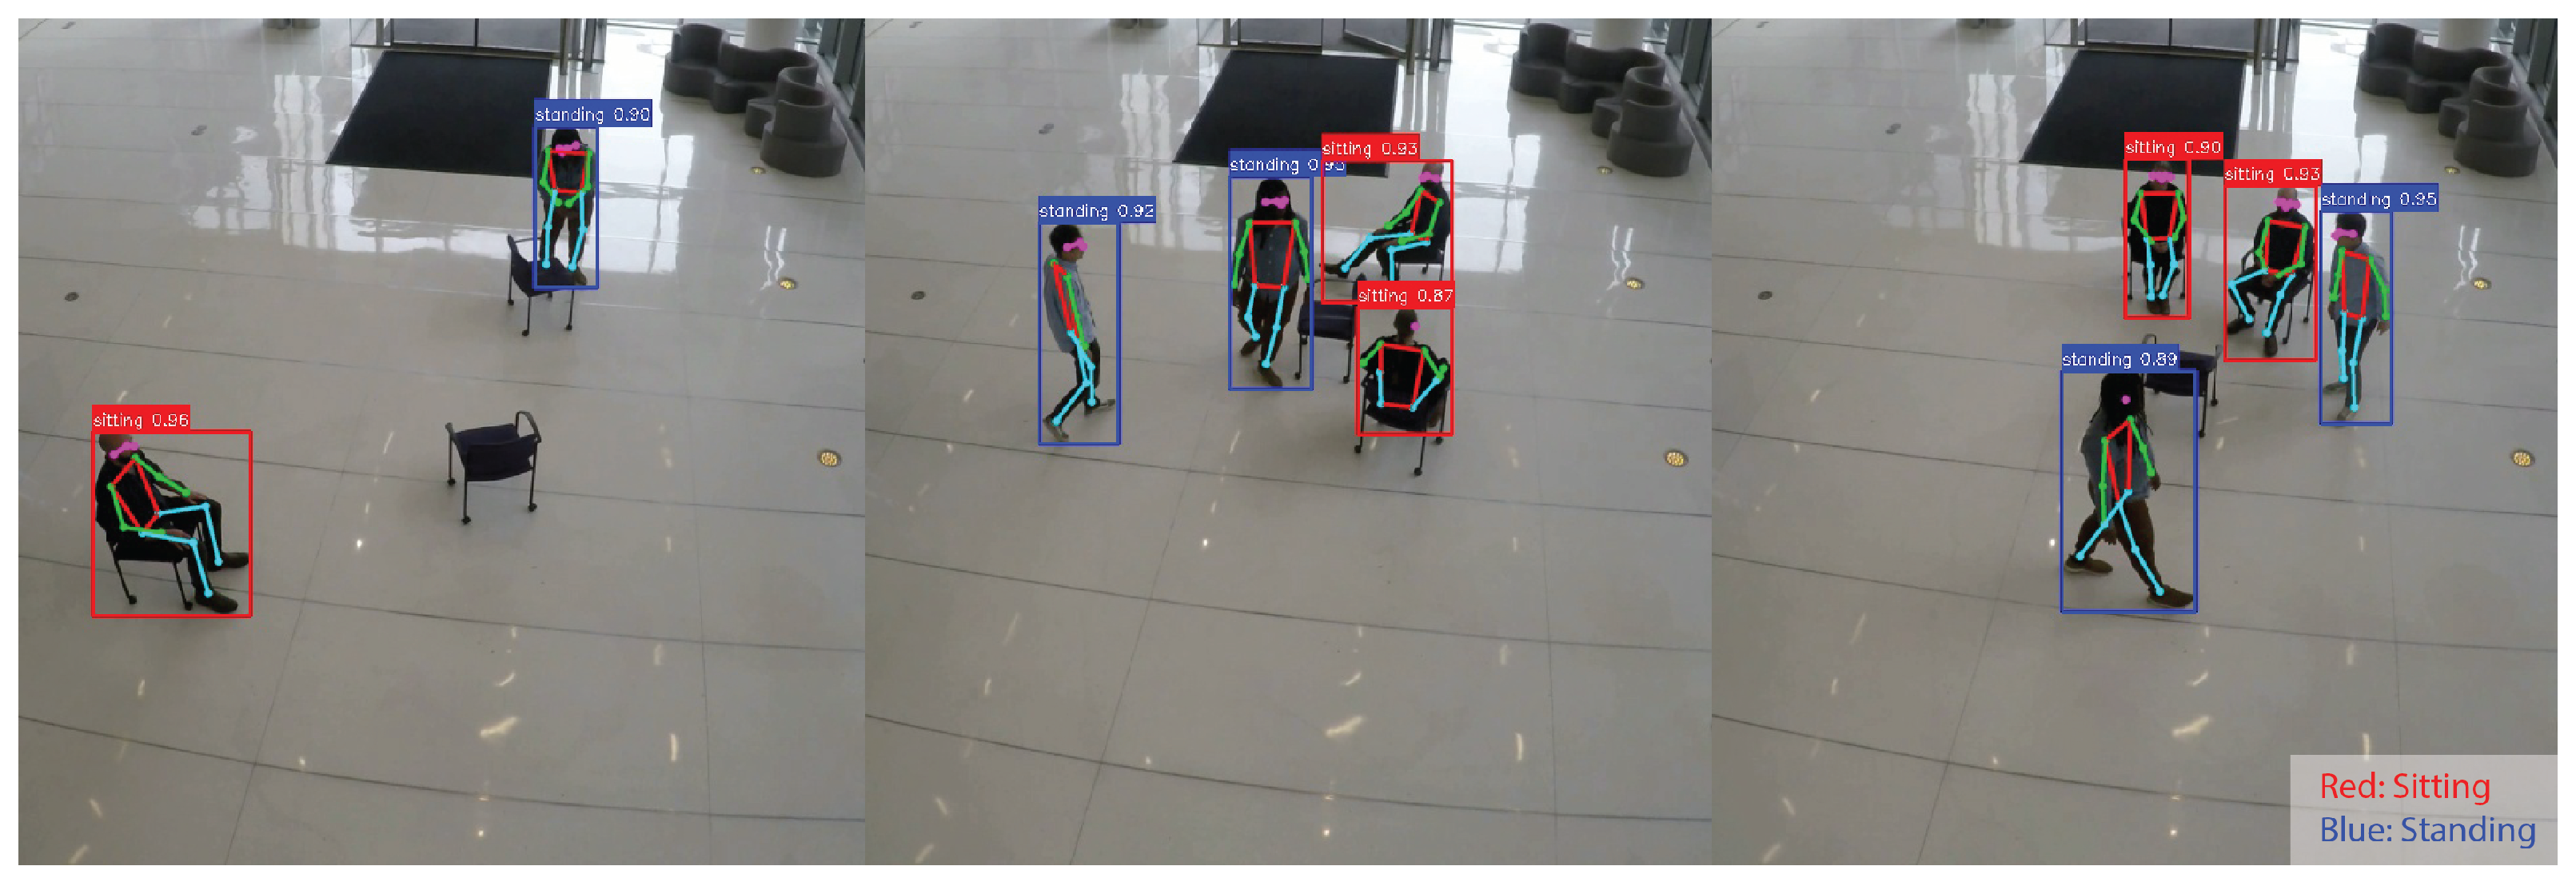
This study introduced pose estimation-enhanced action recognition into real-world public space monitoring, marking the first such application for urban planners and designers. We trained a custom sitting activity recognition model using outputs from the open-source YOLOv8 pose estimation model. To improve the interpretability of machine vision, we implemented a color-coded skeletal overlay. Annotations were generated based on these pose outputs, forming the foundation of the training dataset. The deployed system operated through a two-stage on-device inference pipeline, as illustrated in Figure 2. Video streams were captured from the GoPro camera (GoPro Inc., San Mateo, CA, USA) and processed in real time on the NVIDIA Jetson Orin Nano (NVIDIA Corporation, Santa Clara, CA, USA). The first stage performed pose estimation to extract keypoint information from detected individuals and enhanced the raw image with pose skeleton drawing as shown in Figure 3, followed by the second stage, which applied the trained sitting action recognition model. This model classified and located sitting, standing, and bench positions within the frame. The processed results were saved as GeoJSON files, as shown in Table 1, which were then transferred to cloud storage for further data engineering and analysis.
Unlike conventional CV pipelines in sports analytics—which typically rely on post-hoc analysis of pre-recorded footage—our system enables real-time, privacy-conscious, on-device inference without storing any video. This approach required lightweight models capable of efficient object detection and tracking under real-time constraints. To ensure scalability and accessibility, we evaluated several CV development frameworks—including Detectron2, NVIDIA TAO Toolkit, OpenMMLab, and Ultralytics—based on their support for multi-task learning, usability, and suitability for low-latency edge deployment [67]. We selected Ultralytics’ YOLO framework due to its performance efficiency, flexibility, and growing adoption in urban analytics applications [58,68,75]. Its open-source nature also facilitated seamless integration with Roboflow, enabling streamlined dataset management, model training, and deployment workflows without licensing restrictions [76].
Model Training: sitting action recognition, bench detection.
This project trained two customized CV models based on YOLOv8. The first was a sitting action recognition model, enhanced with pose estimation to improve the accuracy of classifying sitting and standing activities, as illustrated in Figure 3.
The second model, a bench detection model, was developed to detect and track movable benches co-designed with students and faculty from the UNSW Industrial Design Department, as shown in Figure 4.
Both models—the bench detection and the sitting action recognition—were first tested on the MIT campus before being deployed at the Sydney intervention site. The identical training pipeline was later applied to sample data gathered from the deployment location to evaluate the framework’s replicability and robustness.
To ensure reliable performance under diverse real-world conditions—including varying lighting (sunny, rainy, and cloudy) and pedestrian densities—our team collected one minute of training footage per hour for a week. All video frames were annotated using Roboflow, which streamlined data augmentation, preprocessing, and dataset splitting. For additional robustness, we augmented the dataset through horizontal flipping, saturation adjustments between −25% and +25%, and exposure variations between −5% and +5%.
Performance Evaluation and Validation.
To validate the PLSK’s performance, model outputs were cross-compared with traditional human observations conducted using the Public Life Diversity Toolkit 2.0, developed by the Gehl Institute as a structured framework for quantifying public life through systematic observation. Four UNSW student observers carried out five-minute surveys at random times throughout the study period, recording indicators such as pedestrian counts, sitting or standing postures, and the use of movable benches. To further benchmark the PLSK, a commercially available CV sensor (Vivacity), commonly used for transport analysis, was also deployed, mounted directly above the GoPro to capture the same study area.
Model performance was evaluated using AP, which approximated the area under the precision–recall (PR) curve—where a larger area indicates stronger performance in both precision (precision measures the proportion of true positive predictions among all positive predictions, reflecting the model’s accuracy in identifying relevant objects.) and recall (recall quantifies the proportion of true positives identified out of all actual relevant objects, indicating the model’s sensitivity.) [77]. Among various evaluation criteria used in object detection research, AP remains one of the most widely accepted. Notably, benchmark datasets such as PASCAL VOC [78] and Open Images 2019 [79] have standardized the use of mean Average Precision (mAP), which averages AP scores across all object classes. Accordingly, we reported our results using mAP, a robust and widely adopted metric for assessing performance in multi-class object detection tasks.
To understand the potential performance of our model we compared the results with those from a recent study focusing on detecting sitting behavior in public spaces, particularly those performing on-device inference without storing video footage. Because there have been only a few previous works that applied on-device CV models for behavioral analysis, our model’s mAP was closest to the Street Activity Detection Model developed by Salazar-Miranda et al. [15]. The comparison examined the overall results of both models, aiming to demonstrate how different models perform when asked to identify the same type of features, i.e., staying versus sitting.
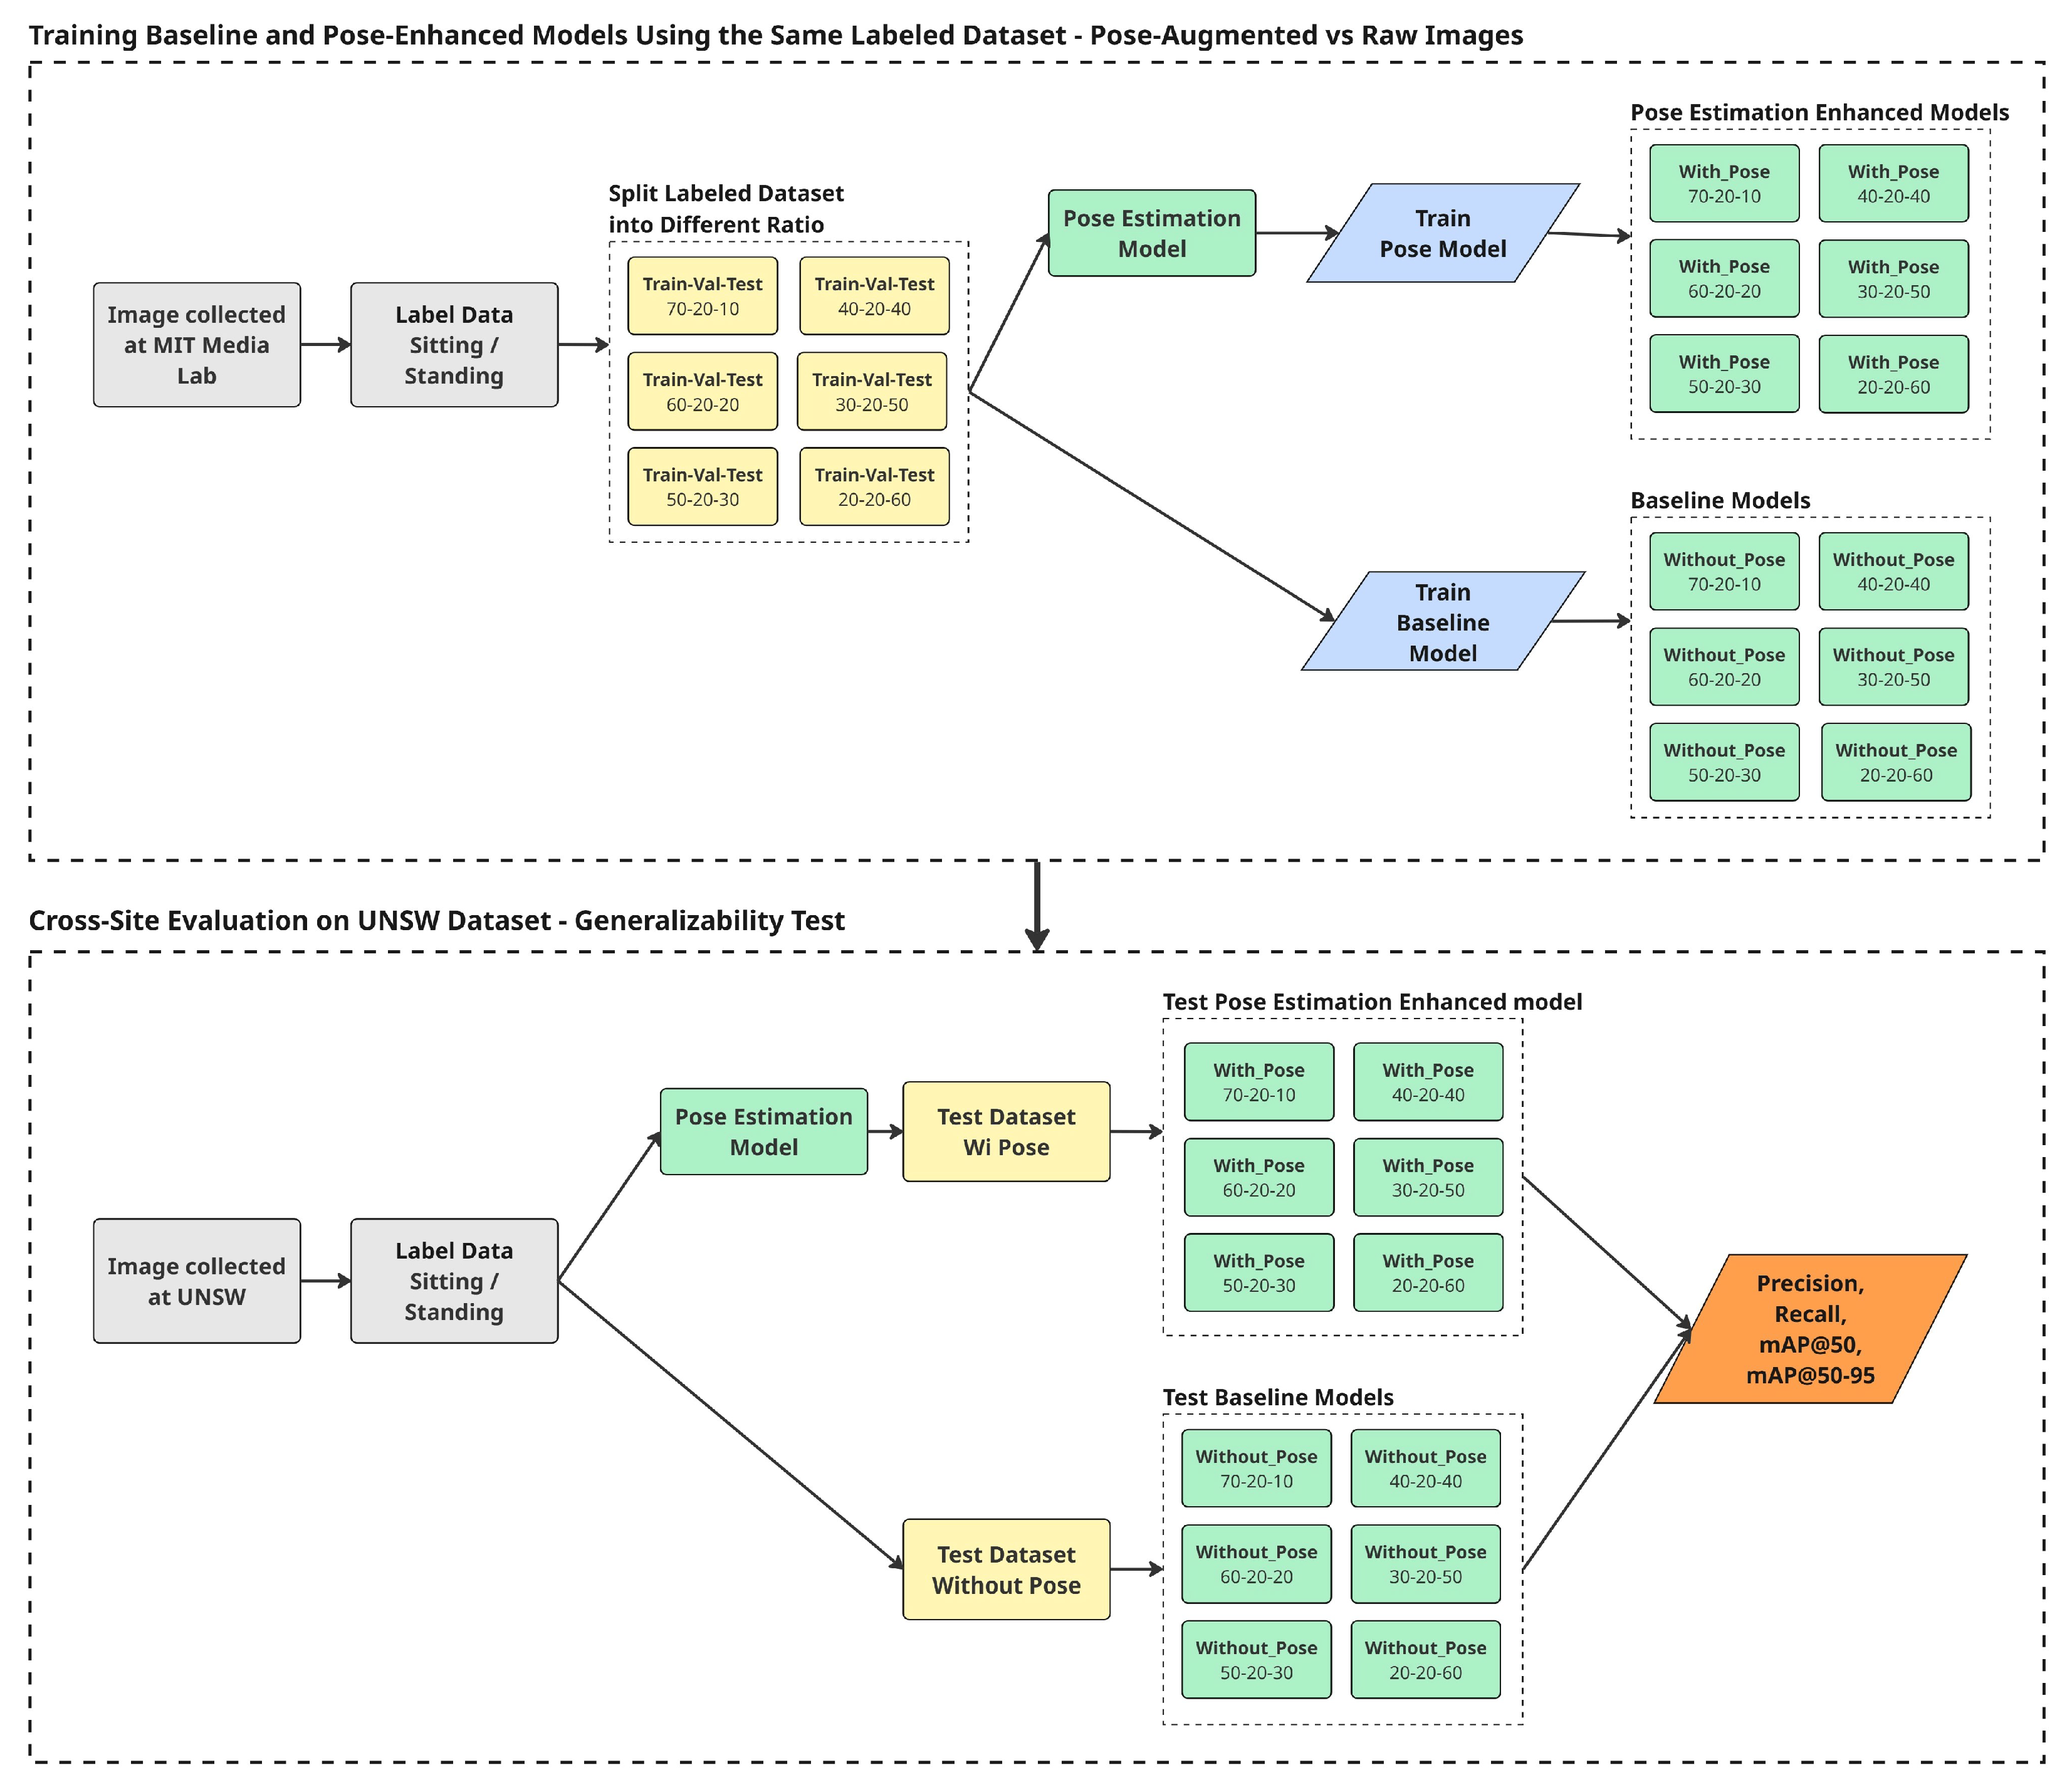
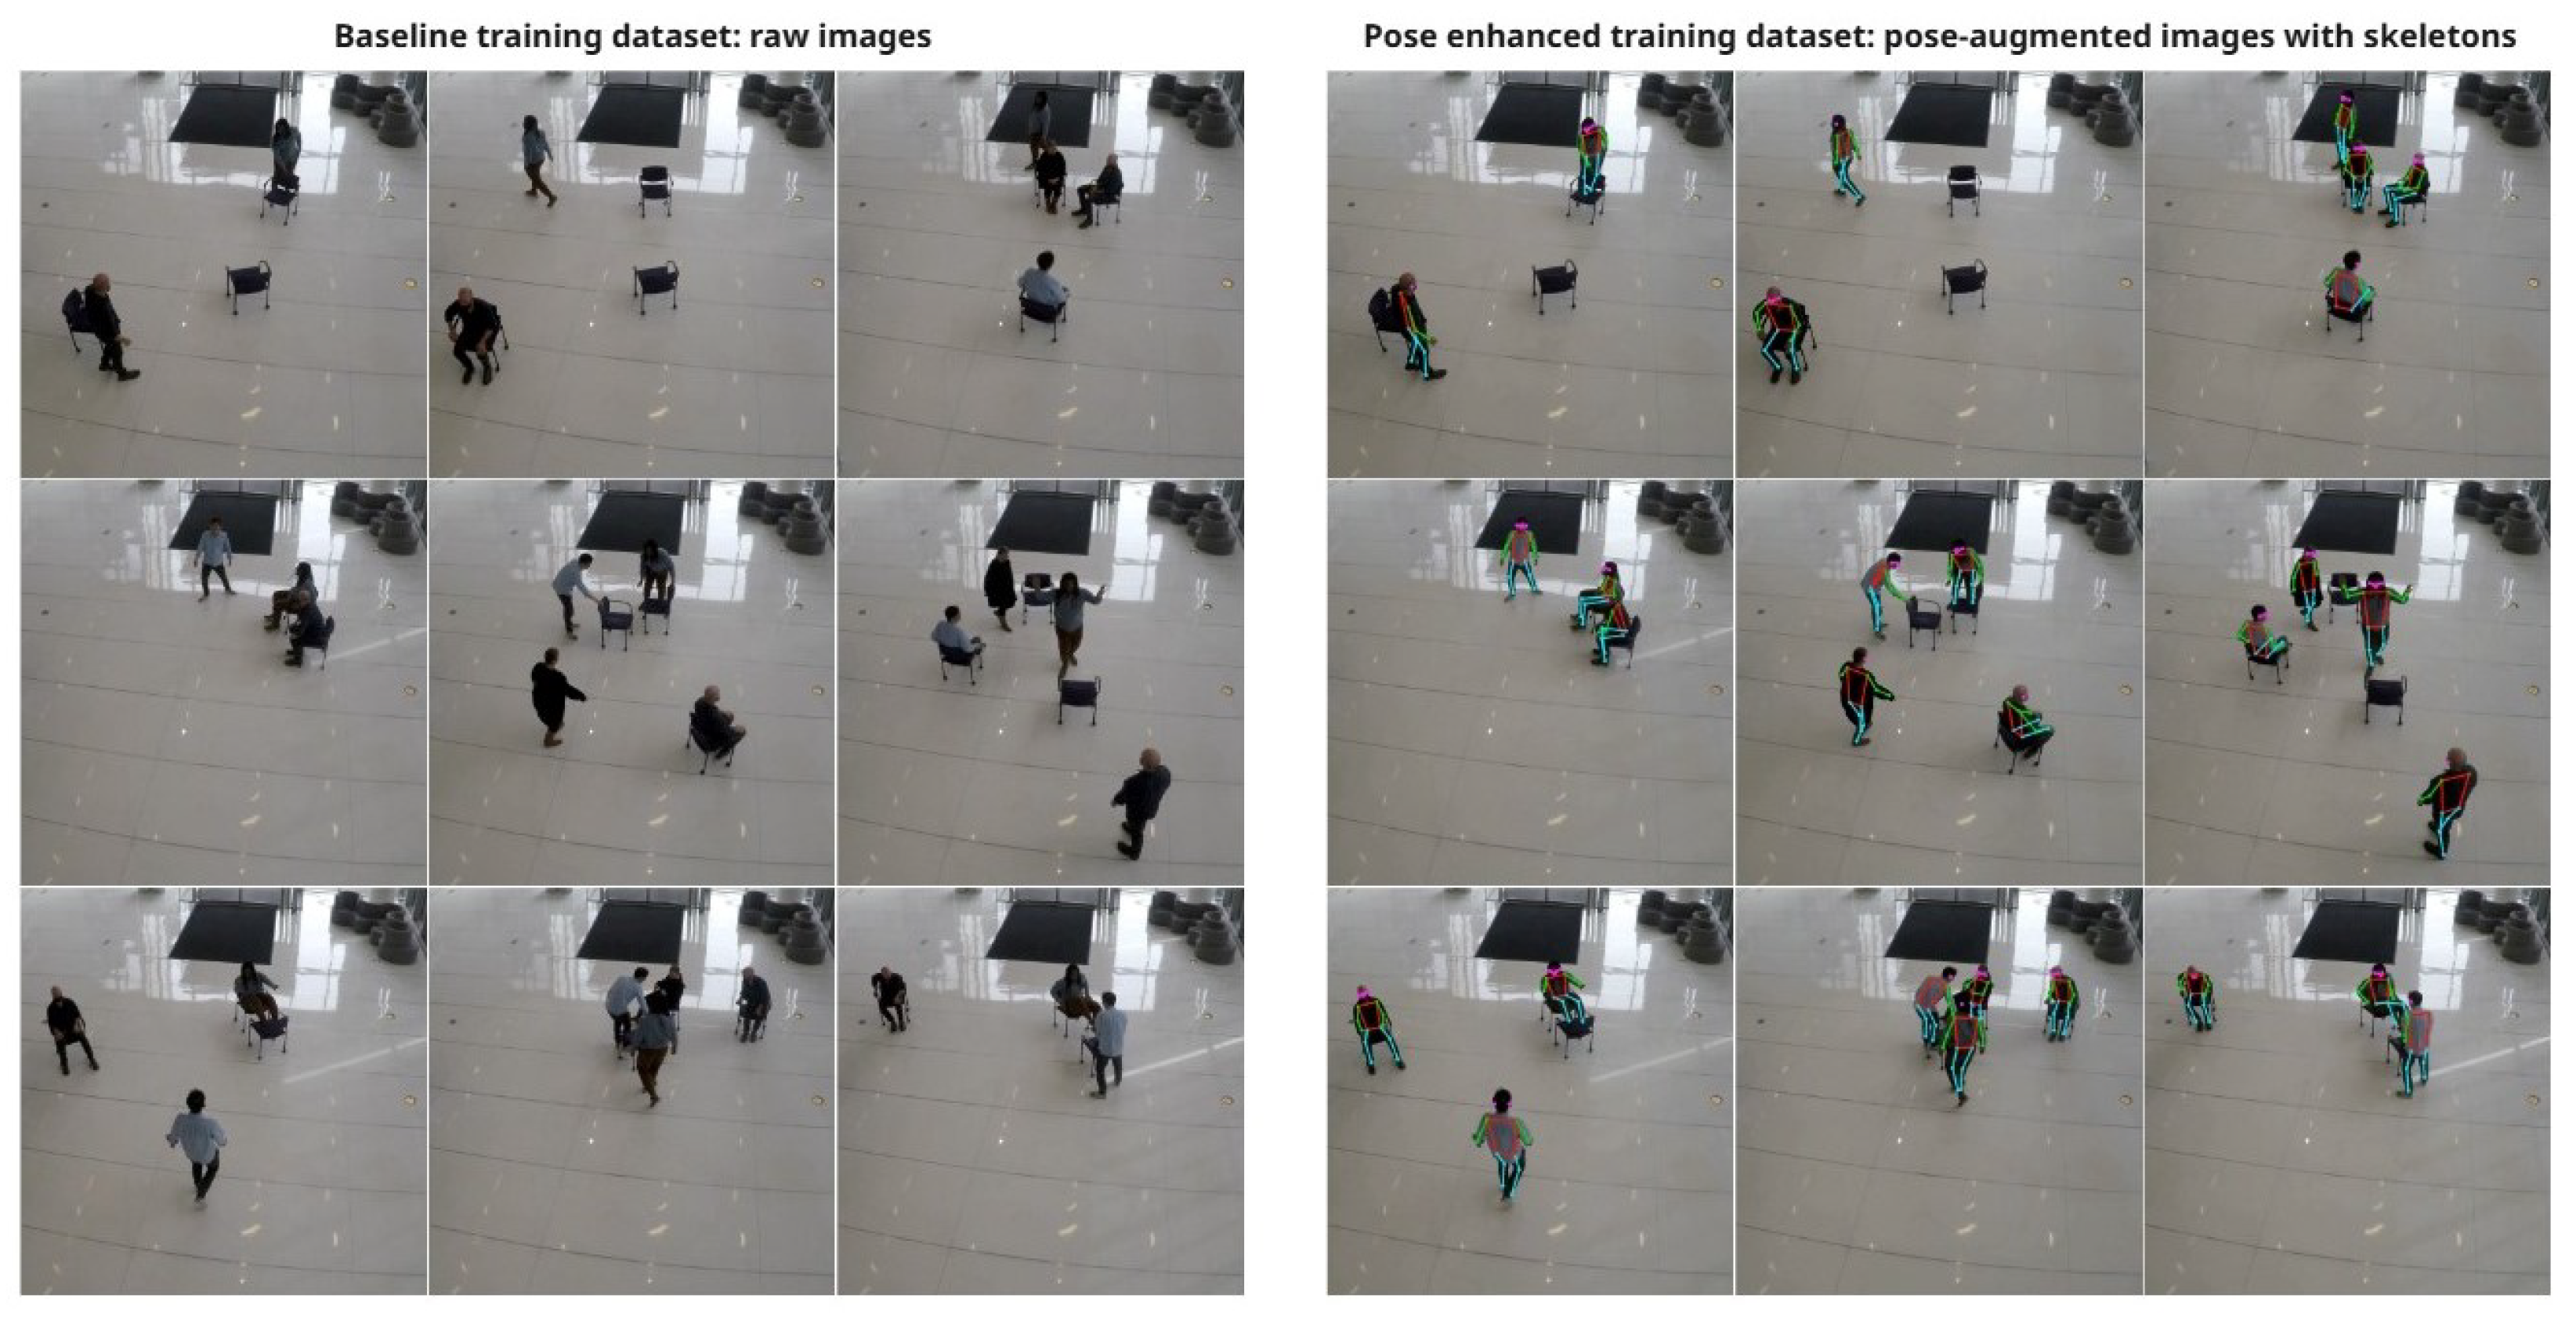
In addition to the comparative mAP evaluation, an additional validation experiment was conducted to examine how pose estimation improves model generalizability and behavioral recognition accuracy. As illustrated in Figure 5, two models were trained using an identically labeled dataset collected at our research lab. One model used raw images as a baseline, and the other used pose-augmented images with skeleton overlays, as shown in Figure 6. Both models were fine-tuned across multiple train, validation, and test ratios and later evaluated on a separate dataset collected at the UNSW campus under different environmental and lighting conditions to assess the potential benefits of pose estimation for behavior recognition.

3.2. Public Life Analysis

3.2.1. GPS Data Acquisition

Mapping and visualizing the trajectories of people to reveal spatial and temporal patterns has been a foundational practice in urban planning to study public life. To achieve this, accurate GPS coordinates are essential. However, a major limitation of commercial CV sensor kits—such as Vivacity, Numina, and Fyma—was that they did not provide latitude and longitude points but rather X and Y coordinates of the image itself. This means that the GPS coordinates of detected objects (e.g., pedestrians or vehicles) are not included in their output and would need to be transformed.
Although transforming detections from image space into GPS coordinates is theoretically feasible, no off-the-shelf tools currently support this process with the level of spatial precision required for urban behavioral analysis. To address this gap within the PLSK framework, we implemented homographic transformation—a technique widely used in sports analytics to convert player positions captured from fixed camera angles into real-world geographic coordinates [80,81,82]. By applying this method, we were able to generate spatially accurate trajectories and behavioral maps from camera-based detections, adding a critical spatial layer to our understanding of how people use public space.
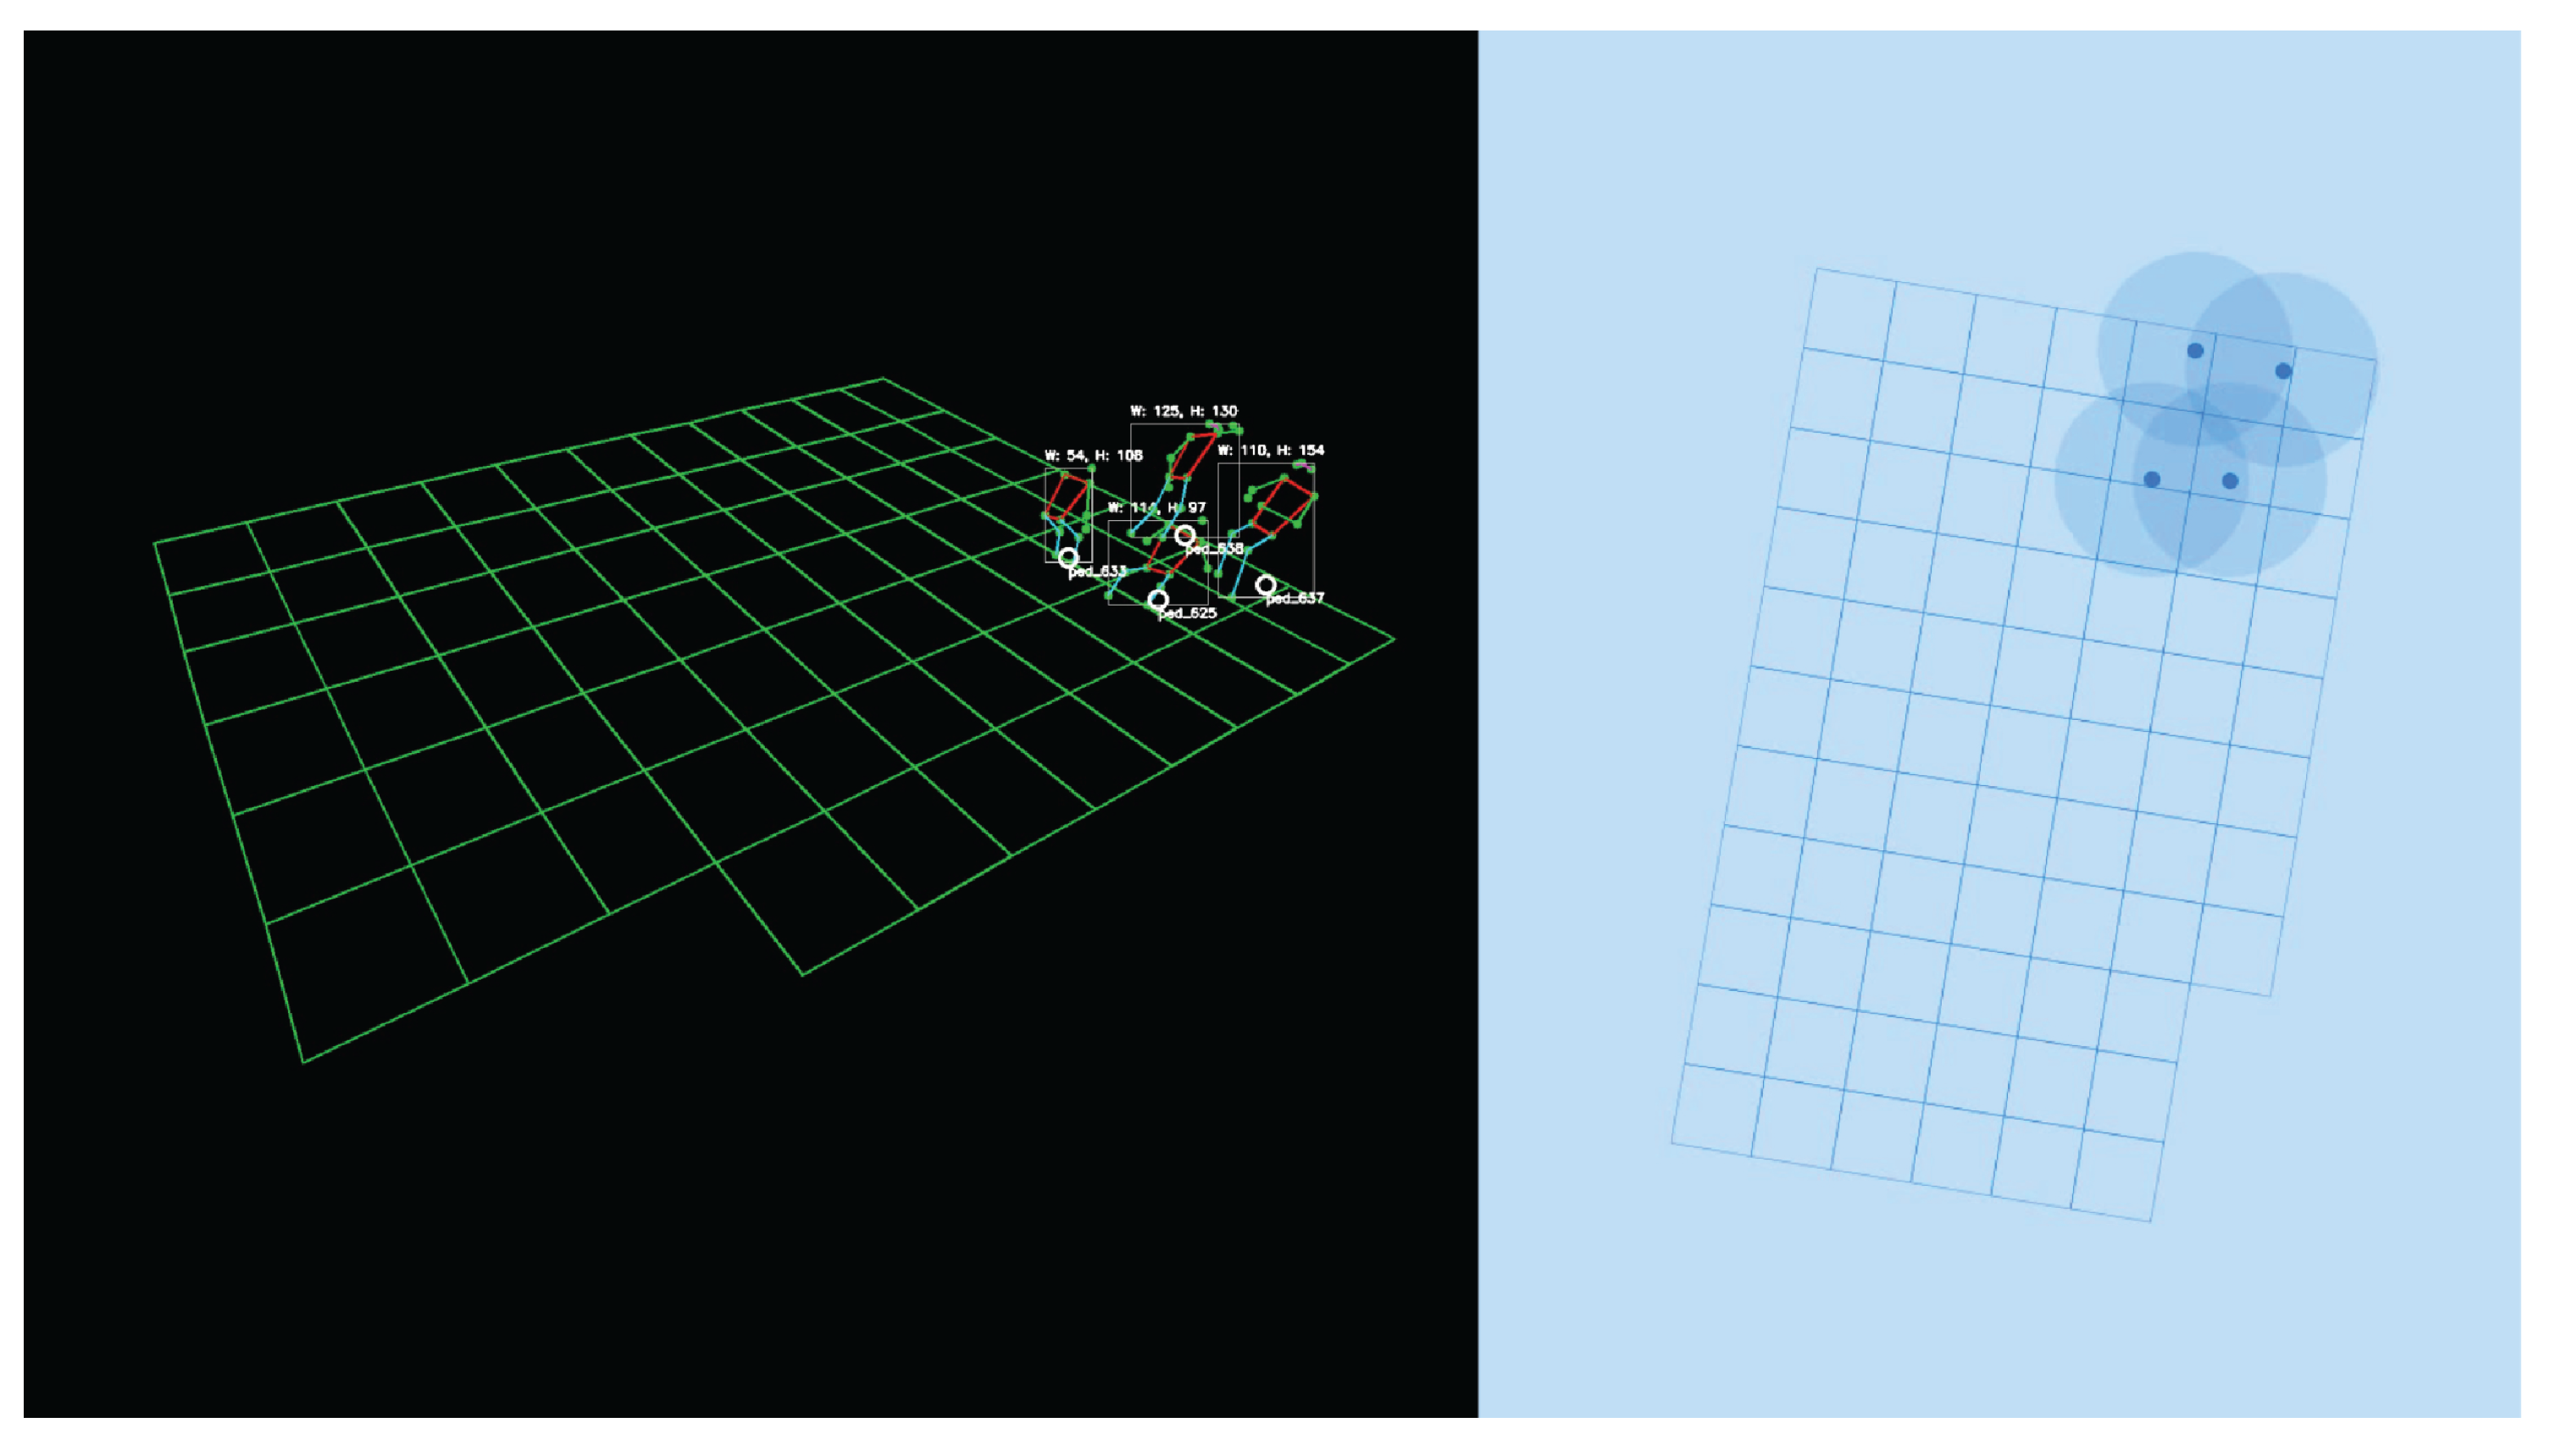
To enable accurate spatial mapping between image coordinates and real-world GPS coordinates, we implemented a homographic transformation workflow based on on-site calibration and computational grid generation. A reference grid was first established at the deployment location, where two sets of corresponding data were collected: (1) the coordinates of four reference points in image space (x, y) extracted from captured video frames, and (2) the corresponding geographic coordinates (latitude and longitude) obtained using GPS measurements. These coordinates were subsequently calibrated to improve positional precision.
Using these paired reference points, a 3 × 3 homography matrix was computed to define the geometric relationship between the image plane and the geographic coordinate plane [83], as illustrated in Figure 7. The accuracy of this transformation is highly dependent on the granularity of the spatial grid and the extent covered by each matrix. In this study, the test site covered approximately 74 square meters (7 × 11 m). Rather than collecting GPS data for each of the seventy-four 1 × 1 m cells, we obtained GPS coordinates for the four corners of the full rectangular study area. These coordinates were then used to interpolate intermediate positions computationally, allowing us to automatically generate seventy-four local homography matrices, one for each grid cell (Figure 8).

3.2.2. Socializing Behavior Categorization

This study analyzed public life by measuring the frequency and duration of key behaviors such as standing, sitting, staying, and socializing. Among these, variations in socializing patterns are particularly meaningful for understanding how public spaces support interaction and engagement. However, as Barrett [84] notes, emotional states cannot be reliably inferred from facial expressions, and likewise, social interaction cannot be fully captured from spatial proximity alone. Socializing is inherently subjective—shaped by context, intent, and interpersonal dynamics—yet prior research has sought to approximate it through spatial and temporal patterns of co-presence.
Proximity-based analysis has been widely employed in urban studies, emphasizing that spatial closeness and sustained co-presence are fundamental enablers of social behavior [3,9,85]. For instance, Gehl [3] demonstrated how spatial configurations influence opportunities for interaction, highlighting proximity and duration as key dimensions of public life. Similarly, Hall [86] introduced the theory of proxemics, which classifies interpersonal communication into distinct distance zones. Patterson [87] later expanded on this framework, defining intimate distance (0–0.45 m), personal distance (0.45–1.2 m), social distance (1.2–3.6 m), and public distance (beyond 3.6 m). These foundational studies underscore how physical spacing conditions social exchange. Building on this theoretical foundation, recent CV-based research has sought to infer social interactions from positional and movement data. For example, Loo and Fan [9] employed a graph-based method to distinguish social interaction from general pedestrian movement, using DBSCAN algorithm developed by Schubert et al. [85] to cluster individuals within a 2.1-m spatial threshold per frame and refining group detection through temporal analysis. Acknowledging that no universal threshold can perfectly delineate social interaction, we adopted a pragmatic criterion of one meter for spatial proximity—consistent with the upper range of Hall’s “personal distance” zone—and a continuous co-presence of two minutes to represent sustained interaction.
Building on this framework, we employed the Spatio-Temporal Density-Based Spatial Clustering of Applications with Noise (ST-DBSCAN) algorithm to detect and analyze socializing behavior. ST-DBSCAN, introduced by Birant and Kut [88], extends the conventional DBSCAN by incorporating a temporal dimension, enabling the detection of evolving activity clusters over time. The algorithm has been successfully applied in diverse domains—for instance, to study collective animal movement [89] and behavioral dynamics in social networks [90]. By integrating spatial proximity and temporal persistence, our method provides a reproducible and computationally grounded approach for quantifying patterns of social interaction in public spaces.

4. Results

4.1. PLSK Test Deployment

Beginning on 26 July 2024, our research team deployed two sensor systems in the green spaces at UNSW: our custom-designed PLSK and a commercially available Vivacity sensor. Both operated concurrently over three weeks. The first week served as a baseline data collection, capturing activity in the space prior to any intervention. In the following two weeks, twelve movable benches were deployed, allowing us to evaluate their impact and observe changes in public space use. The PLSK recorded pedestrian activity with nuanced behavioral categorization—identifying sitting, standing, staying, and socializing—while also logging the precise GPS coordinates of the movable benches. In contrast, the Vivacity sensor tracked people solely as pedestrians, without distinguishing between different behaviors.

4.1.1. PLSK Model Performance

The two PLSK CV models, pose-enhanced sitting action recognition and bench detection, demonstrated strong performance, as shown in Table 2 and the PR curve in Figure 9. The pose-enhanced sitting action recognition model achieved an AP of 97.6% for detecting seated individuals and 97.9% for standing individuals, resulting in a mAP@0.5 of 97.8%.
To evaluate the performance of our sitting action recognition model, we compared it, in Table 3, with one of the most recent studies that developed a street activity detection model capable of identifying cars, passersby, stayers, and micro-mobility users [15]. The model was trained using a dataset that combined 1000 GSV images and 675 additional images from the MS COCO dataset and achieved an AP of 0.48 for identifying “stayers” and a mAP of 0.68 for overall detection (stayer, passerby, car and micro-mobility). As there is currently no widely available benchmark dataset dedicated to sitting detection, this comparison provides a contextual reference, based on the fact that our model tried to identify the same type of features. It should be noted that the evaluation was not conducted on an identical dataset or under the same training conditions, but rather sought to illustrate how one model performed on a discrete set of data vs. another model on another discrete set of data. The comparison of the two studies revealed that our sitting action recognition model achieved an mAP of 0.978 for sitting detection, significantly outperforming the 0.48 reported in the referenced study, which also aimed to identify sitting. This suggests that, within our study area and testing setup, our model demonstrates strong capability in detecting sitting and standing behaviors.
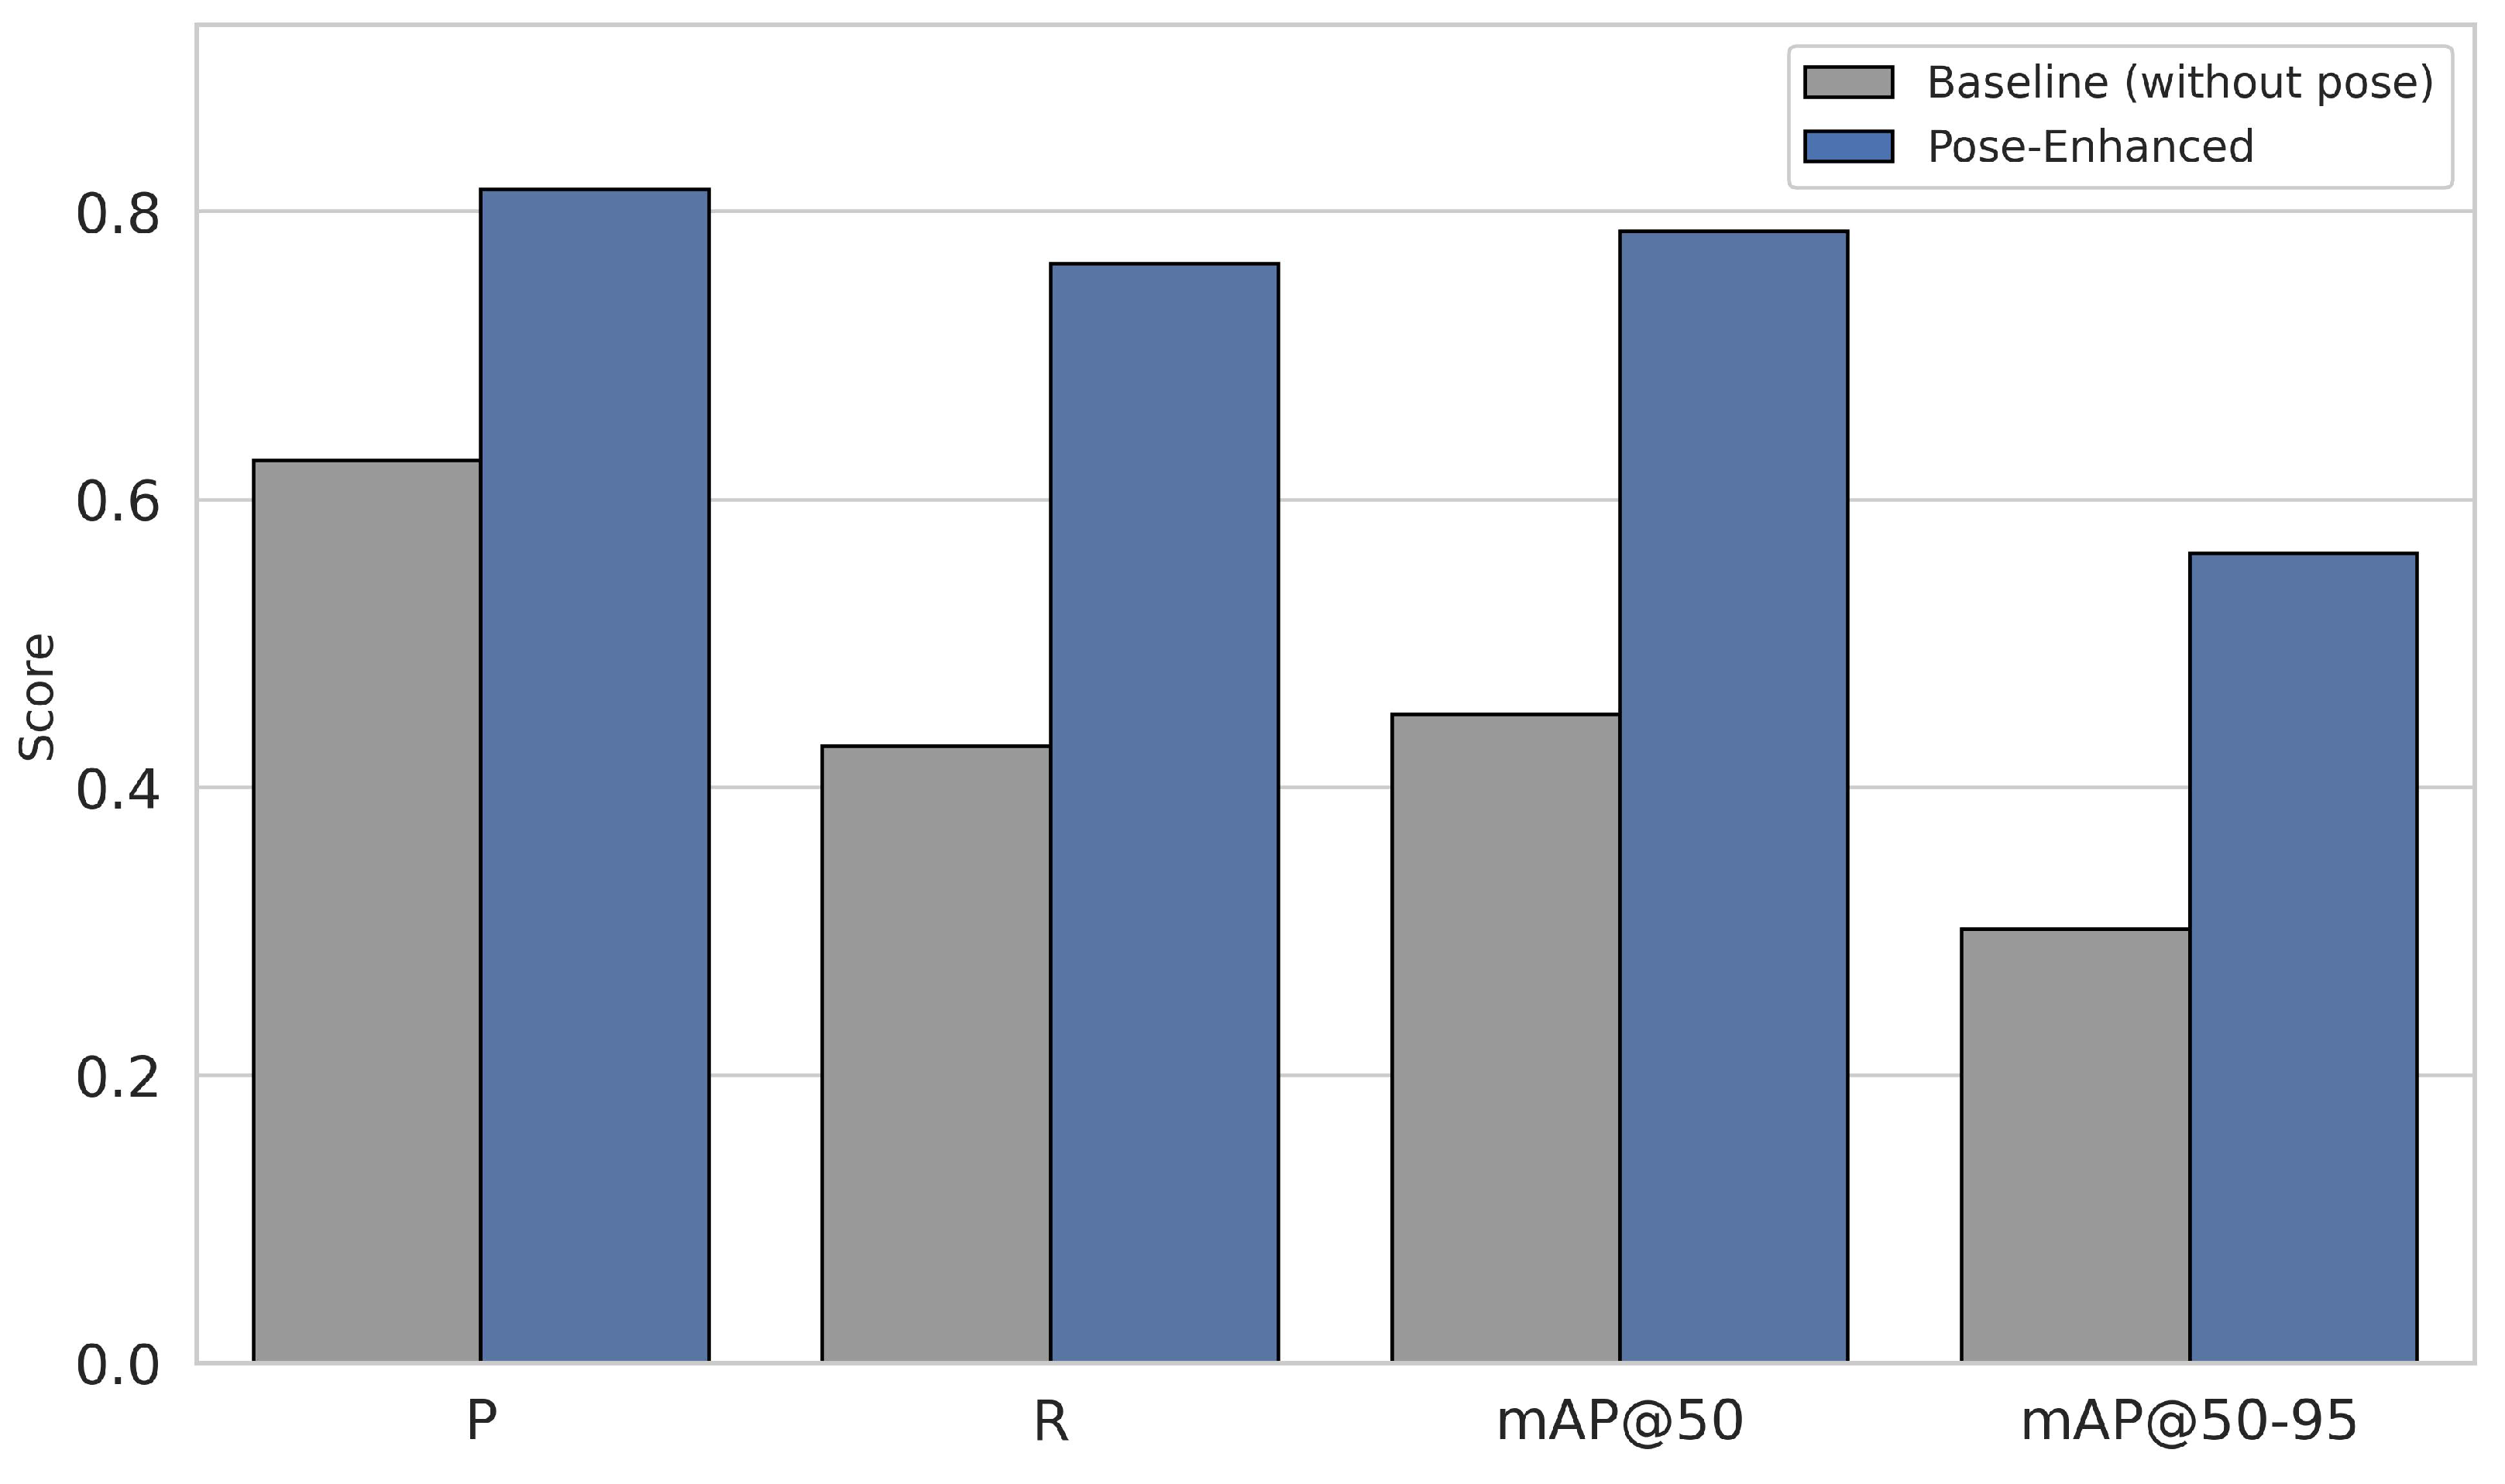
To determine whether adding pose estimation improved our model performance, we tested the performance difference between our baseline model without pose estimation and the pose-enhanced model. Our results showed that the pose-enhanced model was statistically improved. An independent two-sample t-test was conducted on four key evaluation metrics: Precision, Recall, mAP@50, and mAP@50–95, as illustrated in Figure 5. Both models were trained six times using different train–validation–test split ratios ranging from 70–20–10 to 20–20–60, each representing an independent experimental condition. This provided multiple performance samples for each model type and enabled statistical comparison beyond a single training outcome. The t-test examines whether the average scores of two groups differ significantly beyond what could be expected from random variation. In this study, it was used to verify whether the observed improvements in the pose-enhanced model reflected a genuine effect of incorporating pose estimation rather than random fluctuation caused by dataset partitioning.
As shown in Table 4 and Figure 10, all four metrics improved significantly, with p-values below 0.001. The pose-enhanced model achieved higher precision of 0.815 compared with 0.627 for the baseline model, recall of 0.764 compared with 0.429, mAP@50 of 0.786 compared with 0.451, and mAP@50–95 of 0.562 compared with 0.302. These statistically significant differences confirm that integrating pose estimation meaningfully improves the model’s ability to recognize and classify human behaviors across different site observations.
The statistical validation demonstrates that the integration of pose estimation substantially increases detection accuracy and model robustness. The inclusion of skeleton drawings provides structured spatial cues that help the model distinguish between visually similar actions such as sitting and standing, as illustrated in Figure 6. This enhancement reduces dependence on environmental context, resulting in more consistent and transferable recognition of human behaviors across varied urban settings. The improvement across all metrics highlights the value of pose-based feature representation for developing scalable behavioral sensing systems.

4.1.2. PLSK Comparison with Vivacity Sensor

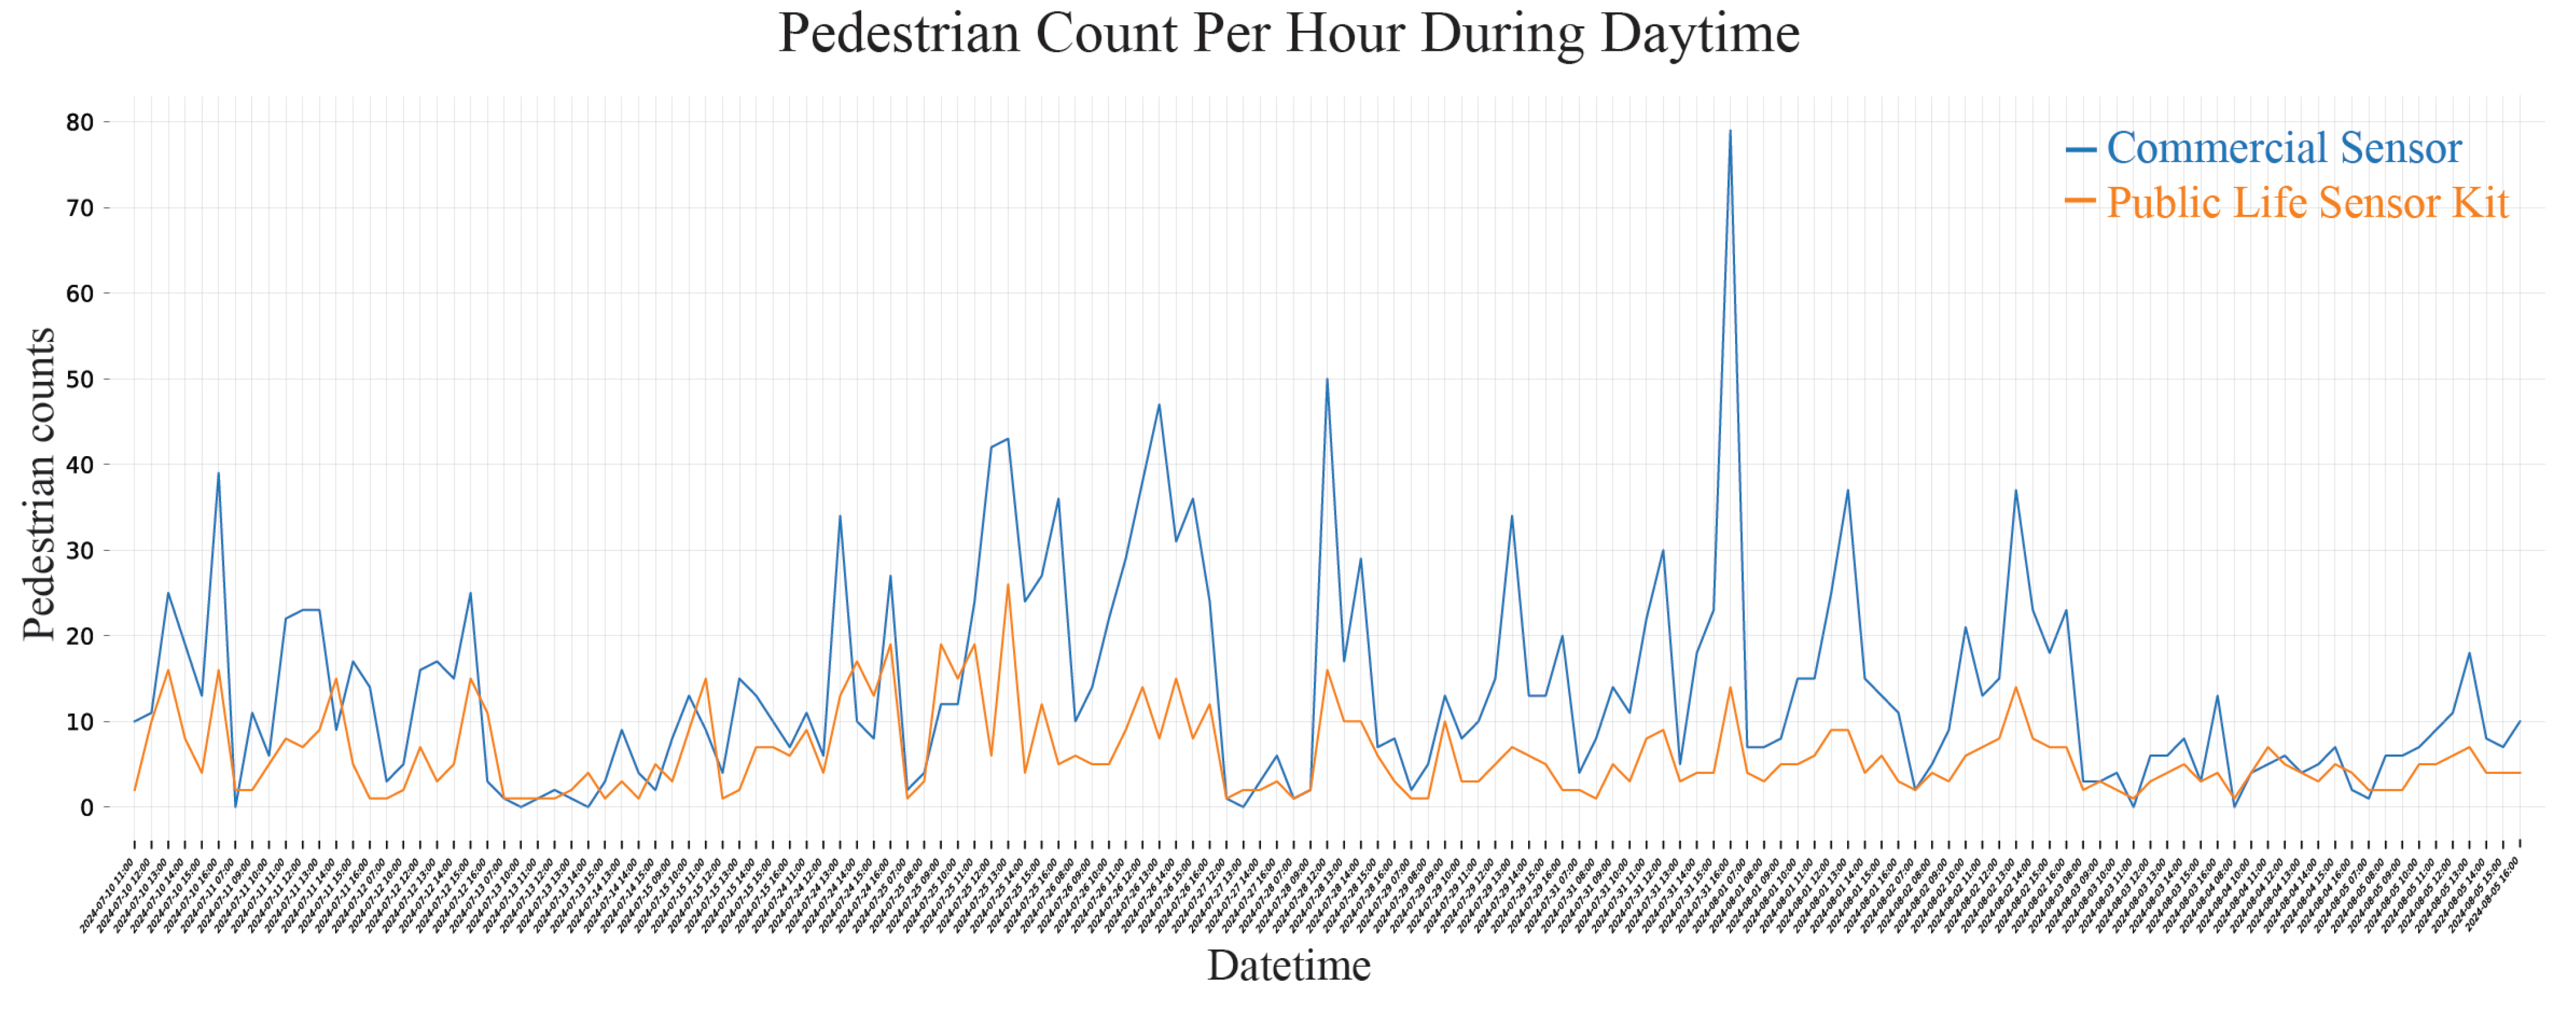
To further compare the PLSK performance, the Vivacity sensor was installed alongside the PLSK to record pedestrian occupancy within the study area. Figure 11 presents a line graph of hourly pedestrian counts during daytime from 07:00 AM to 06:00 PM, with the PLSK data shown in orange and the Vivacity data in blue. Over the course of the study period, the PLSK recorded a total of 864 pedestrians, averaging six pedestrians per hour. In contrast, the Vivacity sensor recorded 1953 pedestrians, with an average of fourteen pedestrians per hour—more than twice the count reported by the PLSK.
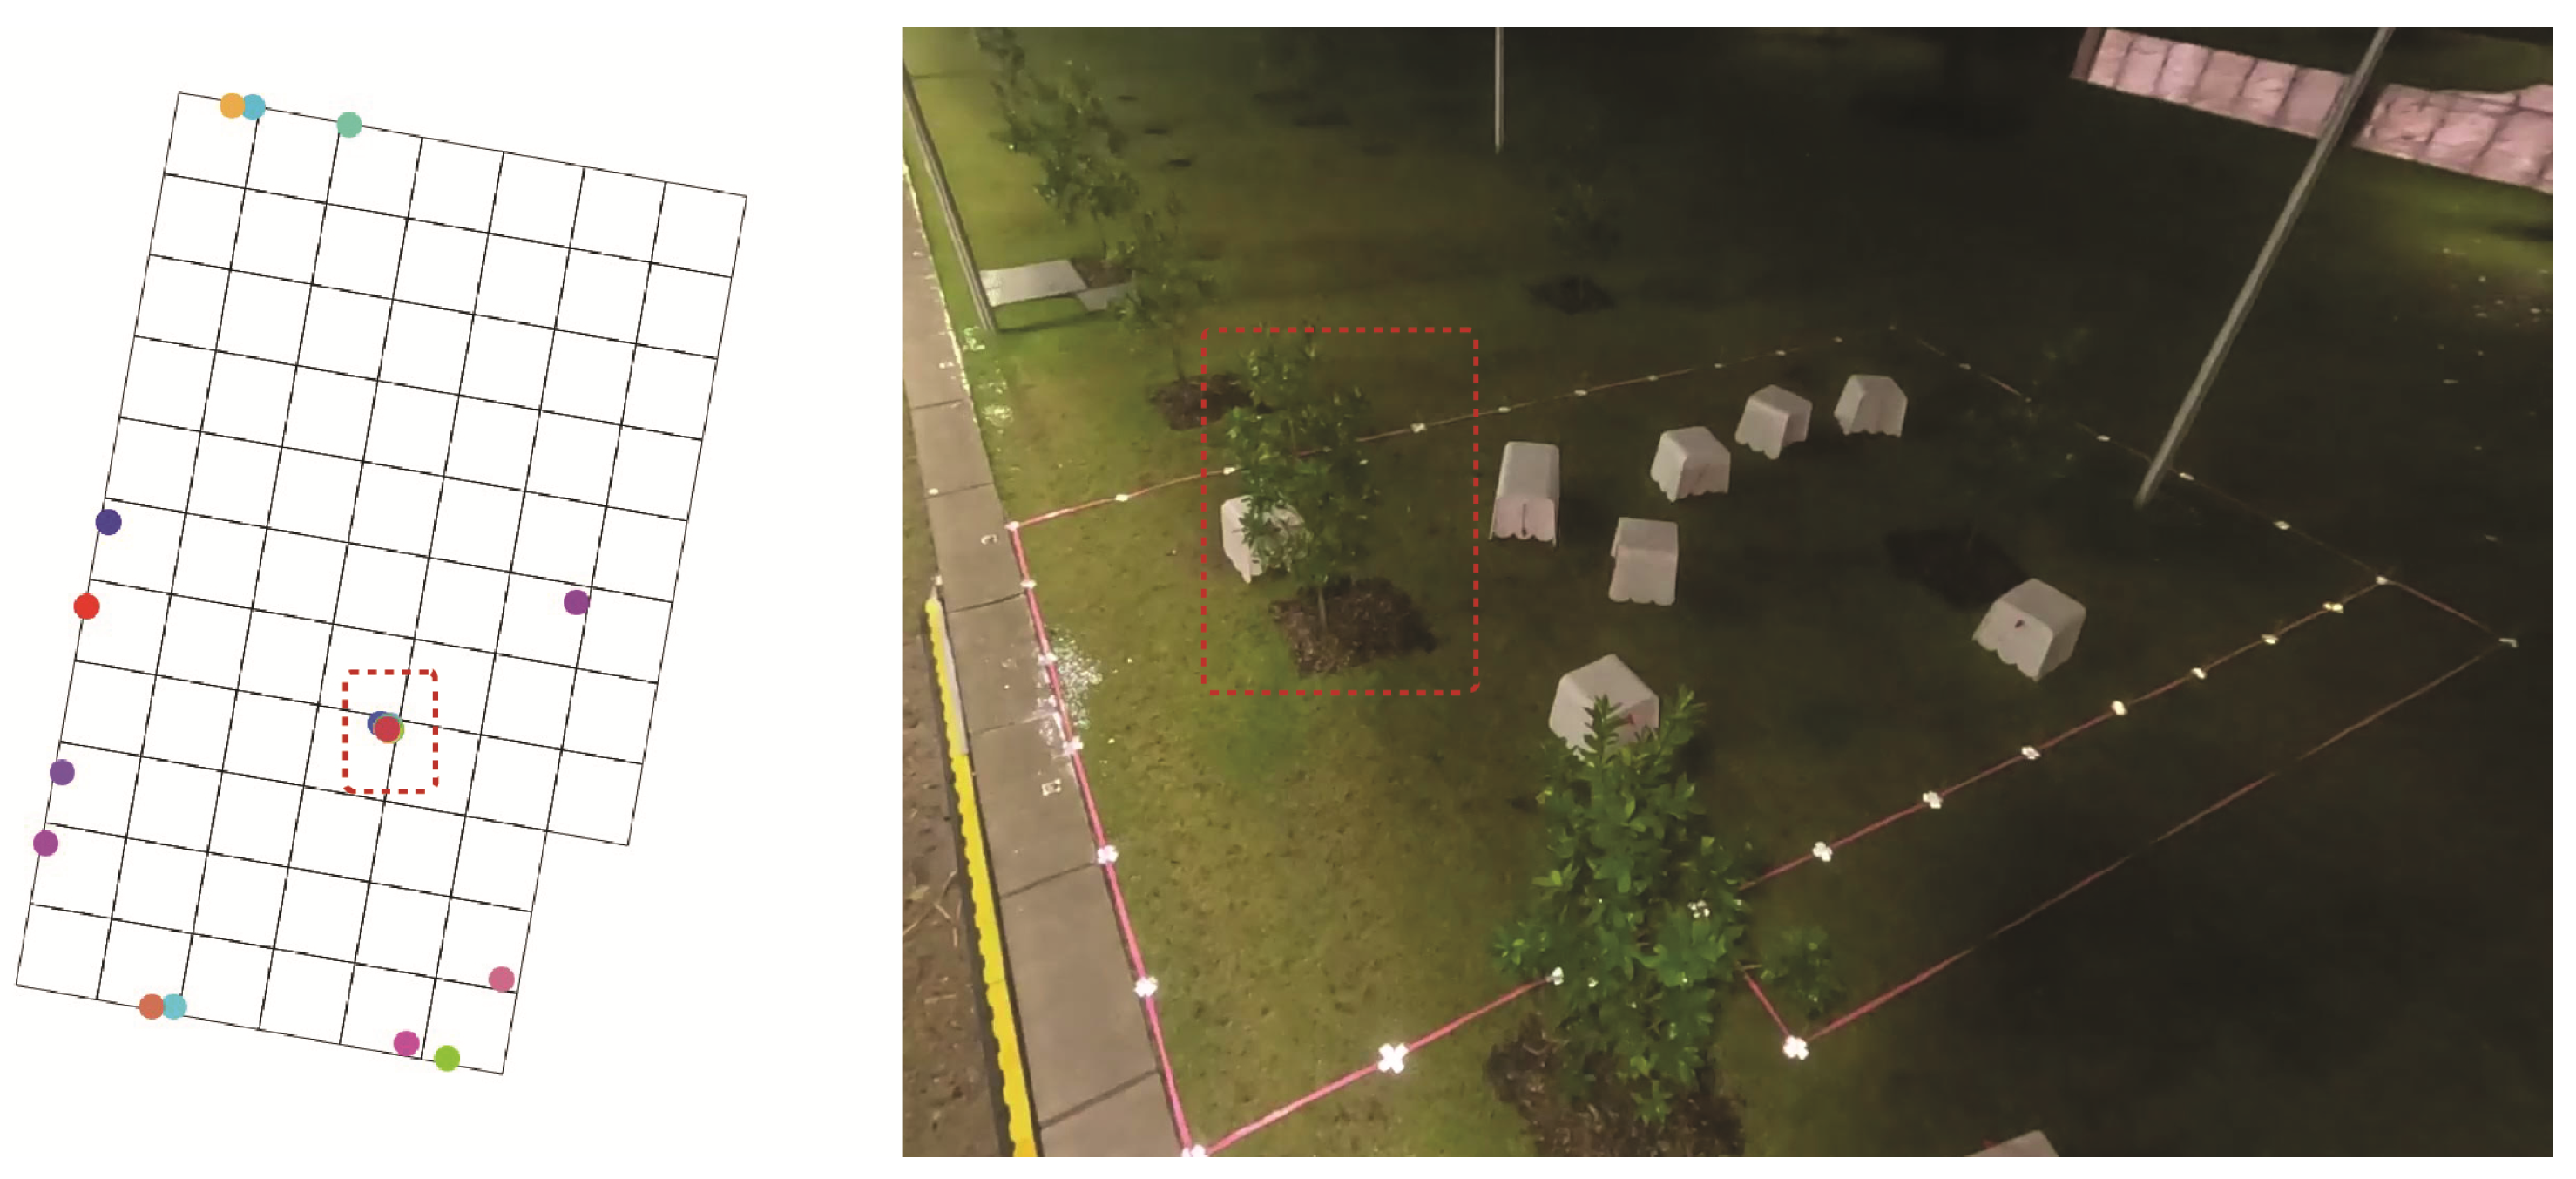
To investigate this discrepancy, we included nighttime data and generated Figure 12, which shows the average hourly pedestrian counts over a full 24-h period. The tendency for the Vivacity sensor to overcount pedestrians was even more pronounced during nighttime hours compared to daytime. Upon closer inspection, we found that the Vivacity sensor frequently misclassified a stationary tree within the study area as a pedestrian (Random sampling of data from 12 July (12:00–13:00) revealed that the Vivacity sensor repeatedly misidentified a tree as a pedestrian, resulting in a high number of false positives—57 out of 70 total detections. The tree’s location is highlighted by a red rectangle in Figure 13. This finding underscores the importance of site-specific calibration in CV models used for public space research, as environmental features such as trees can lead to significant false positives, even in seemingly straightforward tasks like pedestrian counting).

4.2. Public Life Analysis Result

Using data obtained from the PLSK, individual behaviors were categorized into four groups: visiting, staying, sitting, and socializing. The visiting category represents the total number of people entering the observed area. Individuals who remained on-site for more than five minutes were classified as staying. The sitting category was derived from the action recognition model enhanced with pose estimation, developed specifically for this study. Finally, socializing behavior was identified using the ST-DBSCAN algorithm, which grouped detected individuals based on their spatial and temporal proximity. In this framework, individuals located within one meter of each other for more than two minutes were considered to be socializing. This threshold, while not intended as a definitive behavioral classification, served as a consistent and interpretable measure to compare changes in group activity before and after the intervention. Figure 14 illustrates an example of detected social interactions and their corresponding spatial clusters.

Results of the Intervention: Changes in Individual Behavior

The introduction of movable seating substantially influenced behavioral patterns in the study area, as summarized in Table 5. The average daily number of visitors increased by approximately 14%, from 55 to 63 individuals. More notably, the number of people classified as staying increased by 360%, from five to twenty-three individuals per day. Sitting activity showed the largest relative increase—from an average of one person to fifteen people per day—representing a 1400% rise. As for socializing, no such instances were recorded prior to the intervention; after the installation of movable benches, an average of nine individuals engaged in social interaction daily.
These findings align with longstanding theories in public life research. William H. Whyte’s observations famously noted that “people like to sit where there are places for them to sit,” underscoring the strong relationship between physical infrastructure and social behavior. Similarly, contemporary studies grounded in Jan Gehl’s design principles have demonstrated that movable street furniture encourages people to pause, linger, and interact in public spaces [7]. The results from our field deployment reinforce these observations, offering quantitative evidence that small design interventions can meaningfully increase opportunities for staying, sitting, and socializing in urban settings.

5. Discussion

This research introduced the PLSK, an open-source CV toolkit designed to enhance the study of public life through pose estimation-augmented behavior recognition. By bridging the gap between traditional human observation and commercial sensing technologies, the PLSK enables automated, privacy-conscious analysis of nuanced human behaviors in public space using a model improved by pose estimation for greater accuracy. Deployed and tested during a real-world public space intervention, the system revealed subtle behavior patterns such as sitting, staying, and socializing, demonstrating how small-scale urban design changes, like the introduction of movable benches or features benefiting the quality of the environment, such as shade, can shape social interactions. Through a comparative analysis with a commercial sensor, this study highlights the advantages of human-centered, DIY, and open-source CV systems in urban research, offering a new methodological direction for capturing and understanding public life with greater specificity and accessibility.

5.1. Public Life Measurement and Broader Implications

Through the deployment of the PLSK, we were able to collect round-the-clock data on sitting behavior with high accuracy, without storing video footage or compromising user privacy. Our findings suggest that the introduction of movable benches led to a greater proportion of visitors staying longer, sitting, and engaging with their surroundings, infusing the space with social energy, as shown in Table 2. While it may seem intuitive that people are more likely to stay, sit, and gather when seating or shade is available, the ability to quantify and measure these behavioral shifts through automated methods systematically represents a significant advancement in public space research. A key driver of this advancement is the pose estimation model developed for the PLSK, which demonstrated high accuracy in distinguishing between seated and standing individuals—subtle behavioral distinctions that generic object detection models often fail to capture.
Beyond this pilot project, the PLSK framework holds significant potential for advancing the study of behavioral responses to climate change, particularly those shaped by microclimatic variability. As intensifying climate conditions increasingly threaten outdoor activity—especially in underserved communities with limited access to safe and comfortable public spaces—declines in social interaction may exacerbate issues of isolation and inequity. Yet many studies in climate behavior research continue to rely on more labor-intensive observational methods that are ill-suited to capture the dynamic relationship between human behavior and environmental change [4,5,6]. The PLSK offers a scalable, high-frequency, and privacy-conscious alternative, enabling real-time analysis of how environmental factors like temperature, wind, and solar exposure influence public space use. These insights can inform tactical design interventions—such as shade structures, vegetation, or movable seating—to enhance thermal comfort and equity, particularly during extreme weather. Furthermore, by adapting pose estimation-based models to recognize hard-to-capture user groups (e.g., individuals with wheelchairs, adults with strollers, or people with dogs), the PLSK supports more inclusive and responsive urban design. To foster continued innovation, the system’s code has been released as open-source, encouraging others to extend this framework in support of cross-disciplinary public life research.

5.2. Lessons from Comparing PLSK and Commercial Sensor

The analysis of both the PLSK and the Vivacity sensor revealed the critical importance of fine-tuning object detection models using site-specific data to reduce false positives. While such calibration needs were anticipated for our custom-built system, it was noteworthy that the commercially available Vivacity sensor exhibited similar limitations, highlighting that no universally generalized model can perfectly adapt to all environments without contextual adjustments.
During the three-week pilot study, one such issue emerged with the Vivacity sensor: a false detection caused by a nearby tree resulted in the overcounting of pedestrians, particularly under low-light conditions. Vivacity acknowledged that their sensors are typically intended for long-term deployments, where extended calibration and validation can be conducted prior to data collection. However, within the constraints of our short-term, small-scale deployment, such processes were not feasible. Moreover, analyzing the Vivacity data proved challenging, as the system only provides aggregated outputs, without access to object-level detections or geographic metadata. This creates a “black box” structure that prevents detailed error checking for users and limits the ability to conduct granular spatial analysis.
Although the Vivacity sensor occasionally misclassified environmental features such as trees as pedestrians, our pose-enhanced model demonstrated strong performance even under varying levels of occlusion, lighting, and crowd density. Future studies may further evaluate and highlight its robustness across more diverse environmental contexts to enhance the scalability of the PLSK framework.

5.3. Future Research Considerations

5.3.1. Integrating Vision-Language Models with PLSK

The PLSK illustrates the potential of an automated, pose-enhanced action recognition approach for collecting public life data. However, current CV models remain constrained by predefined object categories that often oversimplify human activity and fail to capture the full spectrum of behaviors observed in public space. For example, a yoga class held in a public square may be categorized simply as “people sitting”—a technically accurate label that nonetheless overlooks the cultural and social significance of collective exercise. Similarly, a street musician performing on a corner might be identified merely as “a person standing,” disregarding their contribution to the vibrancy and atmosphere of the space. These examples reveal the inherent limitations of present CV systems and underscore the need for more context-aware, semantically enriched approaches to analyzing public life.
Recent advancements in small VLMs—notably NanoVLM [91]—offer promising pathways to bridge this gap. By combining visual input with natural language processing, VLMs can generate contextually refined descriptions, allowing for the recognition of complex group behaviors such as yoga sessions or street performances beyond fixed categorical labels. However, current VLMs still face limitations: they often lack the spatial resolution required for fine-grained urban analysis—in other words, they cannot accurately capture the geographic position of detected activities. This is where the PLSK adds critical value: by integrating high-resolution, real-time geolocation data with detailed behavioral inference from VLMs, it can provide a spatially grounded and holistic framework for interpreting public activity. When coupled with the contextual depth enabled by VLMs, this approach holds potential for uncovering hidden patterns in how people occupy, share, and transform public space.
Further, the present study demonstrates the feasibility of detecting socializing and staying behaviors through spatial–temporal analysis; these classifications inevitably simplify complex, context-dependent human interactions. Social engagement is shaped by culture, intention, and situational nuance—factors that cannot be fully inferred from proximity and duration alone. This limitation underscores an important methodological boundary of current CV systems, which primarily rely on visual geometry rather than meaning. A promising direction for future work lies in developing multisensory and multimodal frameworks that integrate audio, environmental, and textual data to contextualize behavioral inference. In particular, coupling the PLSK with VLM-based behavior captioning could yield semantically grounded descriptions that capture not only where people are and how they move, but also the social or cultural context of their activity.

5.3.2. Exploring Alternative Approaches to Spatial Mapping

While the proposed grid-based homography method provided high spatial accuracy within the small-scale test area, manually generating multiple local matrices may become impractical for larger or multi-site deployments. Future research could explore more scalable and automated approaches to spatial mapping through Simultaneous Localization and Mapping (SLAM), which integrates camera localization and environmental reconstruction directly from visual data. Recent advances in deep learning-based SLAM have been actively applied in autonomous driving research [92] as well as indoor object tracking and mapping [93]. These approaches combine traditional geometric modeling with neural network-driven feature extraction and semantic scene understanding. For example, CNN-SLAM leverages RGB-D data to achieve improved depth estimation and scene interpretation compared with conventional methods [94]. However, its reliance on computationally intensive neural networks can constrain real-time performance on resource-limited edge devices [94]. Future work could investigate lightweight or hybrid SLAM frameworks that balance spatial precision with computational efficiency, thereby enabling scalable, real-time behavioral sensing across diverse public environments.

5.3.3. Integrating PLSK with Other Sensor Networks

While the PLSK offers rich spatial data on public life behaviors, its capabilities can be significantly enhanced through integration with other urban sensing networks—such as microclimatic sensing infrastructure. An expanding body of research underscores the profound influence of climate change and real-time environmental conditions on how people use public space. Factors such as ambient temperature, humidity, wind speed, and solar radiation shape decisions about where and how long people stay—whether they seek shade, avoid sun-exposed surfaces, or gather near vegetation—all linked to perceived thermal comfort. By integrating the PLSK with a distributed network of microclimate sensors, researchers can more precisely correlate behavioral patterns with immediate environmental conditions. This fusion of behavioral and environmental data provides a holistic lens for understanding spatial behavior, allowing urban designers not only to monitor activity but also to interpret the environmental motivations behind it. Such integration is particularly valuable for assessing the effectiveness of climate-adaptive design strategies—like tree canopies, shade structures, or misting systems—and for anticipating how future climate stressors may reshape public space use. Ultimately, this approach advances the development of climate-responsive, evidence-based public space designs rooted in both behavioral and environmental insight.

6. Conclusions

This study introduced the PLSK, an open-source DIY edge-computing framework that automates the collection and analysis of public life data using CV. Built with privacy and accessibility in mind, the PLSK integrates a pose estimation-enhanced action recognition model to detect and quantify human behaviors such as sitting and standing. Compared with conventional CV approaches, the pose-enhanced method achieved higher accuracy and stronger generalizability. The system provides a replicable and ethical way to generate evidence for assessing spatial quality and informing interventions that range from tactical urbanism to climate-responsive design.
The PLSK was deployed during a public space intervention at the UNSW in Sydney, Australia, and evaluated across multiple dimensions. First, pedestrian counting performance was benchmarked against Vivacity, a widely used commercial CV sensor. The pose-enhanced model showed greater robustness in low-light conditions and produced fewer false positives in detecting pedestrians. Second, we contextualized our results with recent research on street activity detection. Although the datasets differ, our sitting action recognition reached an mAP of 0.978 for sitting, which indicates high accuracy relative to reported values in prior work and underscores the reliability of the collected data. Third, a cross-site generalization study trained the model on data collected at our research lab and tested it on a separate dataset from UNSW. Independent two-sample t-tests comparing the baseline and pose-enhanced models confirmed significant gains in precision, recall, and mean average precision, indicating improved transferability under varied environmental and lighting conditions.
Overall, this research demonstrates the potential of pose-enhanced CV to automate the quantification of social life in small urban spaces. By bridging traditional observation with open-source, edge-based sensing, the PLSK provides a scalable and transparent framework for studying micro-scale, human-centered behaviors. Unlike many commercial CV tools and macro-scale built-environment studies using CV, the PLSK concentrates on fine-grained everyday actions that reveal how people occupy and experience public spaces. As an open-source toolkit, it enables continuous, ethical, and comparable observations across sites, supporting more inclusive, evidence-based, and climate-resilient urban design.

Author Contributions

Conceptualization, S.W. and M.K.; methodology, S.W. and M.K.; software, M.K.; validation, S.W. and M.K.; formal analysis, M.K.; investigation, S.W. and M.K.; resources, S.W. and M.K.; data curation, M.K.; writing—original draft preparation, M.K.; writing—review and editing, S.W. and M.K.; visualization, M.K.; supervision, S.W.; project administration, S.W. and M.K.; funding acquisition, S.W. All authors have read and agreed to the published version of the manuscript.

Funding

This work was supported by Transport for New South Wales, Sydney, Australia, Safer Cities program.

Institutional Review Board Statement

The study was conducted in accordance with the Declaration of Helsinki and approved by the Human Research Ethics Committee of the University of New South Wales on 24 June 2024, with reference number iRECS6717.

Informed Consent Statement

Not applicable.

Data Availability Statement

The raw data supporting the conclusions of this article will be made available by the authors on request.

Acknowledgments

This project builds on Sarah Williams’s original work, Benchmark 1.0, performed in 2018, and without the thoughtful creativity of this earlier project, we would not have made these improvements in CV. This 2018 project was funded by the Gehl Foundation (no longer in existence); we are thankful for their support. The authors thank Transport for New South Wales for supporting the development of this new version of benchmark research, which allowed us to build the latest technology. The authors thank the researchers and students who contributed to the development of the Public Life Sensor Kit, including Hannah Nicole Shumway and Sebastian Ives. We also acknowledge Gaby Carucci for her contributions to the development of graphics for the project website. Additionally, we would like to thank the University of New South Wales Industrial Design faculty members, Mariano Ramirez and Gonzalo Portas, who collaborated with students to design movable benches for the public space intervention. The author’s would like to acknowledge that this was a truly collaborative project and could not have been achieved without everyone on the team, and that the authors contributed equally to the paper.

Conflicts of Interest

The authors declare no conflicts of interest.

Abbreviations

The following abbreviations are used in this manuscript:
CVComputer Vision
SVIStreet View Image
PLSKPublic Life Sensor Kit
UNSWUniversity of New South Wales
AIArtificial Intelligence
GVIGreen View Index
SVFSky View Factor
MLLMMultimodal Large Language Model
VLMVision Language Model
OVDOpen Vocabulary Object Detection
UAVUnmanned Aerial Vehicle
GSVGoogle Street View
CCTVClosed Circuit Television
APAverage Precision
P2PPeer to Peer
PRPrecision Recall
mAPMean Average Precision
ST-DBSCANSpatio Temporal Density Based Spatial Clustering of Applications with Noise
SLAMSimultaneous Localization and Mapping

References

  1. Lynch, K. The Image of the City; MIT Press: Cambridge, MA, USA, 1964. [Google Scholar]
  2. Whyte, W. The Social Life of Small Urban Spaces; Project for Public Spaces: New York, NY, USA, 1980. [Google Scholar]
  3. Gehl, J. Life Between Buildings; Danish Architectural Press: Copenhagen, Denmark, 2011. [Google Scholar]
  4. Rosso-Alvarez, J.; Jiménez-Caldera, J.; Campo-Daza, G.; Hernández-Sabié, R.; Caballero-Calvo, A. Integrating Objective and Subjective Thermal Comfort Assessments in Urban Park Design: A Case Study of Monteria, Colombia. Urban Sci. 2025, 9, 139. [Google Scholar] [CrossRef]
  5. Luo, Z.; Marchi, L.; Gaspari, J. A Systematic Review of Factors Affecting User Behavior in Public Open Spaces Under a Changing Climate. Sustainability 2025, 17, 2724. [Google Scholar] [CrossRef]
  6. Lopes, H.S.; Remoaldo, P.C.; Vidal, D.G.; Ribeiro, V.; Silva, L.T.; Martín-Vide, J. Sustainable Placemaking and Thermal Comfort Conditions in Urban Spaces: The Case Study of Avenida dos Aliados and Praça da Liberdade (Porto, Portugal). Urban Sci. 2025, 9, 38. [Google Scholar] [CrossRef]
  7. He, K.; Li, H.; Zhang, H.; Hu, Q.; Yu, Y.; Qiu, W. Revisiting Gehl’s urban design principles with computer vision and webcam data: Associations between public space and public life. Environ. Plan. B Urban Anal. City Sci. 2025, 23998083251328771. [Google Scholar] [CrossRef]
  8. Salazar-Miranda, A.; Fan, Z.; Baick, M.; Hampton, K.N.; Duarte, F.; Loo, B.P.Y.; Glaeser, E.; Ratti, C. Exploring the social life of urban spaces through AI. Proc. Natl. Acad. Sci. USA 2025, 122, e2424662122. [Google Scholar] [CrossRef]
  9. Loo, B.P.; Fan, Z. Social interaction in public space: Spatial edges, moveable furniture, and visual landmarks. Environ. Plan. B Urban Anal. City Sci. 2023, 50, 2510–2526. [Google Scholar] [CrossRef]
  10. Niu, T.; Qing, L.; Han, L.; Long, Y.; Hou, J.; Li, L.; Tang, W.; Teng, Q. Small public space vitality analysis and evaluation based on human trajectory modeling using video data. Build. Environ. 2022, 225, 109563. [Google Scholar] [CrossRef]
  11. Williams, S.; Ahn, C.; Gunc, H.; Ozgirin, E.; Pearce, M.; Xiong, Z. Evaluating sensors for the measurement of public life: A future in image processing. Environ. Plan. B Urban Anal. City Sci. 2019, 46, 1534–1548. [Google Scholar] [CrossRef]
  12. Huang, J.; Teng, F.; Yuhao, K.; Jun, L.; Ziyu, L.; Wu, G. Estimating urban noise along road network from street view imagery. Int. J. Geogr. Inf. Sci. 2024, 38, 128–155. [Google Scholar] [CrossRef]
  13. Zhao, T.; Liang, X.; Tu, W.; Huang, Z.; Biljecki, F. Sensing urban soundscapes from street view imagery. Comput. Environ. Urban Syst. 2023, 99, 101915. [Google Scholar] [CrossRef]
  14. Lian, T.; Loo, B.P.Y.; Fan, Z. Advances in estimating pedestrian measures through artificial intelligence: From data sources, computer vision, video analytics to the prediction of crash frequency. Comput. Environ. Urban Syst. 2024, 107, 102057. [Google Scholar] [CrossRef]
  15. Salazar-Miranda, A.; Zhang, F.; Sun, M.; Leoni, P.; Duarte, F.; Ratti, C. Smart curbs: Measuring street activities in real-time using computer vision. Landsc. Urban Plan. 2023, 234, 104715. [Google Scholar] [CrossRef]
  16. Liu, D.; Wang, R.; Grekousis, G.; Liu, Y.; Lu, Y. Detecting older pedestrians and aging-friendly walkability using computer vision technology and street view imagery. Comput. Environ. Urban Syst. 2023, 105, 102027. [Google Scholar] [CrossRef]
  17. Koo, B.W.; Hwang, U.; Guhathakurta, S. Streetscapes as part of servicescapes: Can walkable streetscapes make local businesses more attractive? Comput. Environ. Urban Syst. 2023, 106, 102030. [Google Scholar] [CrossRef]
  18. Qin, K.; Xu, Y.; Kang, C.; Kwan, M.P. A graph convolutional network model for evaluating potential congestion spots based on local urban built environments. Trans. GIS 2020, 24, 1382–1401. [Google Scholar] [CrossRef]
  19. Tanprasert, T.; Siripanpornchana, C.; Surasvadi, N.; Thajchayapong, S. Recognizing Traffic Black Spots From Street View Images Using Environment-Aware Image Processing and Neural Network. IEEE Access 2020, 8, 121469–121478. [Google Scholar] [CrossRef]
  20. den Braver, N.R.; Kok, J.G.; Mackenbach, J.D.; Rutter, H.; Oppert, J.M.; Compernolle, S.; Twisk, J.W.R.; Brug, J.; Beulens, J.W.J.; Lakerveld, J. Neighbourhood drivability: Environmental and individual characteristics associated with car use across Europe. Int. J. Behav. Nutr. Phys. Act. 2020, 17, 8. [Google Scholar] [CrossRef]
  21. Mooney, S.J.; Wheeler-Martin, K.; Fiedler, L.M.; LaBelle, C.M.; Lampe, T.; Ratanatharathorn, A.; Shah, N.N.; Rundle, A.G.; DiMaggio, C.J. Development and Validation of a Google Street View Pedestrian Safety Audit Tool. Epidemiology 2020, 31, 301. [Google Scholar] [CrossRef]
  22. Li, Y.; Long, Y. Inferring storefront vacancy using mobile sensing images and computer vision approaches. Comput. Environ. Urban Syst. 2024, 108, 102071. [Google Scholar] [CrossRef]
  23. Qiu, W.; Zhang, Z.; Liu, X.; Li, W.; Li, X.; Xu, X.; Huang, X. Subjective or objective measures of street environment, which are more effective in explaining housing prices? Landsc. Urban Plan. 2022, 221, 104358. [Google Scholar] [CrossRef]
  24. Yao, Y.; Zhang, J.; Qian, C.; Wang, Y.; Ren, S.; Yuan, Z.; Guan, Q. Delineating urban job-housing patterns at a parcel scale with street view imagery. Int. J. Geogr. Inf. Sci. 2021, 35, 1927–1950. [Google Scholar] [CrossRef]
  25. Orsetti, E.; Tollin, N.; Lehmann, M.; Valderrama, V.A.; Morató, J. Building Resilient Cities: Climate Change and Health Interlinkages in the Planning of Public Spaces. Int. J. Environ. Res. Public Health 2022, 19, 1355. [Google Scholar] [CrossRef]
  26. Hoover, F.A.; Lim, T.C. Examining privilege and power in US urban parks and open space during the double crises of antiblack racism and COVID-19. Socio-Ecol. Pract. Res. 2021, 3, 55–70. [Google Scholar] [CrossRef]
  27. Huang, Y.; Napawan, N.C. “Separate but Equal?” Understanding Gender Differences in Urban Park Usage and Its Implications for Gender-Inclusive Design. Landsc. J. 2021, 40, 1–16. [Google Scholar] [CrossRef]
  28. Kaźmierczak, A. The contribution of local parks to neighbourhood social ties. Landsc. Urban Plan. 2013, 109, 31–44. [Google Scholar] [CrossRef]
  29. Credit, K.; Mack, E. Place-making and performance: The impact of walkable built environments on business performance in Phoenix and Boston. Environ. Plan. B Urban Anal. City Sci. 2019, 46, 264–285. [Google Scholar] [CrossRef]
  30. Gehl, J.; Svarre, B. How to Study Public Life; Island Press/Center for Resource Economics: Washington, DC, USA, 2013. [Google Scholar] [CrossRef]
  31. Gehl Institute; San Francisco Planning Department; Copenhagen Municipality City Data Department; Seattle Department of Transportation. Public Life Data Protocol (Version: Beta); Technical Report; Gehl Institute: New York, NY, USA, 2017. [Google Scholar]
  32. Zhang, F.; Salazar-Miranda, A.; Duarte, F.; Vale, L.; Hack, G.; Chen, M.; Liu, Y.; Batty, M.; Ratti, C. Urban Visual Intelligence: Studying Cities with Artificial Intelligence and Street-Level Imagery. Ann. Am. Assoc. Geogr. 2024, 114, 876–897. [Google Scholar] [CrossRef]
  33. Lu, Y. Using Google Street View to investigate the association between street greenery and physical activity. Landsc. Urban Plan. 2019, 191, 103435. [Google Scholar] [CrossRef]
  34. He, H.; Lin, X.; Yang, Y.; Lu, Y. Association of street greenery and physical activity in older adults: A novel study using pedestrian-centered photographs. Urban For. Urban Green. 2020, 55, 126789. [Google Scholar] [CrossRef]
  35. Liu, L.; Sevtsuk, A. Clarity or confusion: A review of computer vision street attributes in urban studies and planning. Cities 2024, 150, 105022. [Google Scholar] [CrossRef]
  36. Sun, Q.C.; Macleod, T.; Both, A.; Hurley, J.; Butt, A.; Amati, M. A human-centred assessment framework to prioritise heat mitigation efforts for active travel at city scale. Sci. Total Environ. 2021, 763, 143033. [Google Scholar] [CrossRef]
  37. Yang, L.; Driscol, J.; Sarigai, S.; Wu, Q.; Lippitt, C.D.; Morgan, M. Towards Synoptic Water Monitoring Systems: A Review of AI Methods for Automating Water Body Detection and Water Quality Monitoring Using Remote Sensing. Sensors 2022, 22, 2416. [Google Scholar] [CrossRef]
  38. Cai, J.; Tao, L.; Li, Y. CM-UNet++: A Multi-Level Information Optimized Network for Urban Water Body Extraction from High-Resolution Remote Sensing Imagery. Remote Sens. 2025, 17, 980. [Google Scholar] [CrossRef]
  39. Bazzett, D.; Marxen, L.; Wang, R. Advancing regional flood mapping in a changing climate: A HAND-based approach for New Jersey with innovations in catchment analysis. J. Flood Risk Manag. 2025, 18, e13033. [Google Scholar] [CrossRef]
  40. Fuentes, S.; Tongson, E.; Gonzalez Viejo, C. Urban Green Infrastructure Monitoring Using Remote Sensing from Integrated Visible and Thermal Infrared Cameras Mounted on a Moving Vehicle. Sensors 2021, 21, 295. [Google Scholar] [CrossRef]
  41. Hosseini, M.; Cipriano, M.; Eslami, S.; Hodczak, D.; Liu, L.; Sevtsuk, A.; Melo, G.d. ELSA: Evaluating Localization of Social Activities in Urban Streets using Open-Vocabulary Detection. arXiv 2024, arXiv:2406.01551. [Google Scholar] [CrossRef]
  42. Li, J.; Xie, C.; Wu, X.; Wang, B.; Leng, D. What Makes Good Open-Vocabulary Detector: A Disassembling Perspective. arXiv 2023, arXiv:2309.00227. [Google Scholar] [CrossRef]
  43. Zhang, J.; Li, Y.; Fukuda, T.; Wang, B. Urban safety perception assessments via integrating multimodal large language models with street view images. Cities 2025, 165, 106122. [Google Scholar] [CrossRef]
  44. Zhou, Q.; Zhang, J.; Zhu, Z. Evaluating Urban Visual Attractiveness Perception Using Multimodal Large Language Model and Street View Images. Buildings 2025, 15, 2970. [Google Scholar] [CrossRef]
  45. Guo, G.; Qiu, X.; Pan, Z.; Yang, Y.; Xu, L.; Cui, J.; Zhang, D. YOLOv10-DSNet: A Lightweight and Efficient UAV-Based Detection Framework for Real-Time Small Target Monitoring in Smart Cities. Smart Cities 2025, 8, 158. [Google Scholar] [CrossRef]
  46. Balivada, S.; Gao, J.; Sha, Y.; Lagisetty, M.; Vichare, D. UAV-Based Transport Management for Smart Cities Using Machine Learning. Smart Cities 2025, 8, 154. [Google Scholar] [CrossRef]
  47. Marasinghe, R.; Yigitcanlar, T.; Mayere, S.; Washington, T.; Limb, M. Computer vision applications for urban planning: A systematic review of opportunities and constraints. Sustain. Cities Soc. 2024, 100, 105047. [Google Scholar] [CrossRef]
  48. Garrido-Valenzuela, F.; Cats, O.; van Cranenburgh, S. Where are the people? Counting people in millions of street-level images to explore associations between people’s urban density and urban characteristics. Comput. Environ. Urban Syst. 2023, 102, 101971. [Google Scholar] [CrossRef]
  49. Ito, K.; Biljecki, F. Assessing bikeability with street view imagery and computer vision. Transp. Res. Part C Emerg. Technol. 2021, 132, 103371. [Google Scholar] [CrossRef]
  50. Mohanaprakash, T.A.; Somu, C.S.; Nirmalrani, V.; Vyshnavi, K.; Sasikumar, A.N.; Shanthi, P. Detection of Abnormal Human Behavior using YOLO and CNN for Enhanced Surveillance. In Proceedings of the 2024 5th International Conference on Smart Electronics and Communication (ICOSEC), Trichy, India, 18–20 September 2024; pp. 1823–1828. [Google Scholar] [CrossRef]
  51. Mahajan, R.C.; Pathare, N.K.; Vyas, V. Video-based Anomalous Activity Detection Using 3D-CNN and Transfer Learning. In Proceedings of the 2022 IEEE 7th International Conference for Convergence in Technology (I2CT), Mumbai, India, 7–9 April 2022; pp. 1–6. [Google Scholar] [CrossRef]
  52. He, Y.; Qin, Y.; Chen, L.; Zhang, P.; Ben, X. Efficient abnormal behavior detection with adaptive weight distribution. Neurocomputing 2024, 600, 128187. [Google Scholar] [CrossRef]
  53. Yang, Y.; Angelini, F.; Naqvi, S.M. Pose-driven human activity anomaly detection in a CCTV-like environment. IET Image Process. 2023, 17, 674–686. [Google Scholar] [CrossRef]
  54. Thyagarajmurthy, A.; Ninad, M.G.; Rakesh, B.G.; Niranjan, S.; Manvi, B. Anomaly Detection in Surveillance Video Using Pose Estimation. In Proceedings of the Emerging Research in Electronics, Computer Science and Technology: Proceedings of International Conference, ICERECT 2018, Mandya, India, 23–24 August 2018; pp. 753–766. [Google Scholar] [CrossRef]
  55. Gravitz-Sela, S.; Shach-Pinsly, D.; Bryt, O.; Plaut, P. Leveraging City Cameras for Human Behavior Analysis in Urban Parks: A Smart City Perspective. Sustainability 2025, 17, 865. [Google Scholar] [CrossRef]
  56. Kim, S.K.; Chan, I.C. Novel Machine Learning-Based Smart City Pedestrian Road Crossing Alerts. Smart Cities 2025, 8, 114. [Google Scholar] [CrossRef]
  57. Dinh, Q.M.; Ho, M.K.; Dang, A.Q.; Tran, H.P. TrafficVLM: A Controllable Visual Language Model for Traffic Video Captioning. In Proceedings of the IEEE/CVF Conference on Computer Vision and Pattern Recognition, Seattle, WA, USA, 16–22 June 2024. [Google Scholar] [CrossRef]
  58. Chen, C.; Wang, W. Jetson Nano-Based Subway Station Area Crossing Detection. In Proceedings of the International Conference on Artificial Intelligence in China, Tianjin, China, 29 November 2024; Wang, W., Mu, J., Liu, X., Na, Z.N., Eds.; Springer: Singapore, 2024; pp. 627–635. [Google Scholar] [CrossRef]
  59. Sarvajcz, K.; Ari, L.; Menyhart, J. AI on the Road: NVIDIA Jetson Nano-Powered Computer Vision-Based System for Real-Time Pedestrian and Priority Sign Detection. Appl. Sci. 2024, 14, 1440. [Google Scholar] [CrossRef]
  60. Wang, Y.; Zou, R.; Chen, Y.; Gao, Z. Research on Pedestrian Detection Based on Jetson Xavier NX Platform and YOLOv4. In Proceedings of the 2023 4th International Symposium on Computer Engineering and Intelligent Communications (ISCEIC), Nanjing, China, 18–20 August 2023; pp. 373–377. [Google Scholar] [CrossRef]
  61. Kono, V. Viva’s Peter Mildon to Present at NVIDIA GTC: Overcoming Commuting Conditions with Computer Vision; Vivacity Labs: London, UK, 2024. [Google Scholar]
  62. NVIDIA Technical Blog. Metropolis Spotlight: Sighthound Enhances Traffic Safety with NVIDIA GPU-Accelerated AI Technologies; NVIDIA: Santa Clara, CA, USA, 2021. [Google Scholar]
  63. Plastiras, G.; Terzi, M.; Kyrkou, C.; Theocharides, T. Edge Intelligence: Challenges and Opportunities of Near-Sensor Machine Learning Applications. In Proceedings of the 2018 IEEE 29th International Conference on Application-specific Systems, Architectures and Processors (ASAP), Milan, Italy, 10–12 July 2018; pp. 1–7, ISSN 2160-052X. [Google Scholar] [CrossRef]
  64. Wang, F.; Zhang, M.; Wang, X.; Ma, X.; Liu, J. Deep Learning for Edge Computing Applications: A State-of-the-Art Survey. IEEE Access 2020, 8, 58322–58336. [Google Scholar] [CrossRef]
  65. NVIDIA. Robotics & Edge AI|NVIDIA Jetson. Available online: https://marketplace.nvidia.com/en-us/enterprise/robotics-edge/?limit=15 (accessed on 19 October 2025).
  66. Google Cloud. GPU Pricing. Available online: https://cloud.google.com/products/compute/gpus-pricing?hl=en (accessed on 19 October 2025).
  67. Iqbal, U.; Davies, T.; Perez, P. A Review of Recent Hardware and Software Advances in GPU-Accelerated Edge-Computing Single-Board Computers (SBCs) for Computer Vision. Sensors 2024, 24, 4830. [Google Scholar] [CrossRef]
  68. Byzkrovnyi, O.; Smelyakov, K.; Chupryna, A.; Lanovyy, O. Comparison of Object Detection Algorithms for the Task of Person Detection on Jetson TX2 NX Platform. In Proceedings of the 2024 IEEE Open Conference of Electrical, Electronic and Information Sciences (eStream), Vilnius, Lithuania, 25 April 2024; pp. 1–6, ISSN 2690-8506. [Google Scholar] [CrossRef]
  69. Nguyen, H.H.; Tran, D.N.N.; Jeon, J.W. Towards Real-Time Vehicle Detection on Edge Devices with Nvidia Jetson TX2. In Proceedings of the 2020 IEEE International Conference on Consumer Electronics—Asia (ICCE-Asia), Seoul, Republic of Korea, 26–28 April 2020; pp. 1–4. [Google Scholar] [CrossRef]
  70. Afifi, M.; Ali, Y.; Amer, K.; Shaker, M.; ElHelw, M. Robust Real-time Pedestrian Detection in Aerial Imagery on Jetson TX2. arXiv 2019, arXiv:1905.06653. [Google Scholar] [CrossRef]
  71. Civic Data Design Lab. @SQ9: An MIT DUSP 11.458 Project, 2019. Available online: https://sq9.mit.edu/index.html (accessed on 19 October 2025).
  72. Zhou, J.; Wang, Z.; Meng, J.; Liu, S.; Zhang, J.; Chen, S. Human Interaction Recognition with Skeletal Attention and Shift Graph Convolution. In Proceedings of the 2022 International Joint Conference on Neural Networks (IJCNN), Padua, Italy, 18–23 July 2022; pp. 1–8, ISSN 2161-4407. [Google Scholar] [CrossRef]
  73. Ingwersen, C.K.; Mikkelstrup, C.M.; Jensen, J.N.; Hannemose, M.R.; Dahl, A.B. SportsPose—A Dynamic 3D Sports Pose Dataset. In Proceedings of the IEEE/CVF Conference on Computer Vision and Pattern Recognition, Vancouver, BC, Canada, 17–24 June 2023; pp. 5219–5228. [Google Scholar] [CrossRef]
  74. Fani, M.; Neher, H.; Clausi, D.; Wong, A.; Zelek, J. Hockey Action Recognition via Integrated Stacked Hourglass Network. In Proceedings of the IEEE Conference on Computer Vision and Pattern Recognition Workshops, Honolulu, HI, USA, 21–26 July 2017. [Google Scholar] [CrossRef]
  75. Dai, Y.; Liu, L.; Wang, K.; Li, M.; Yan, X. Using computer vision and street view images to assess bus stop amenities. Comput. Environ. Urban Syst. 2025, 117, 102254. [Google Scholar] [CrossRef]
  76. Roboflow. Roboflow and Ultralytics Partner to Streamline YOLOv5 MLOps, 2021. Available online: https://blog.roboflow.com/ultralytics-partnership/ (accessed on 19 October 2025).
  77. Padilla, R.; Netto, S.L.; da Silva, E.A.B. A Survey on Performance Metrics for Object-Detection Algorithms. In Proceedings of the 2020 International Conference on Systems, Signals and Image Processing (IWSSIP), Niterói, Brazil, 1–3 July 2020; pp. 237–242, ISSN 2157-8702. [Google Scholar] [CrossRef]
  78. Everingham, M.; Van Gool, L.; Williams, C.K.I.; Winn, J.; Zisserman, A. The Pascal Visual Object Classes (VOC) Challenge. Int. J. Comput. Vis. 2010, 88, 303–338. [Google Scholar] [CrossRef]
  79. Google Research. Open Images 2019—Object Detection, 2019. Available online: https://www.kaggle.com/competitions/open-images-2019-object-detection (accessed on 19 October 2025).
  80. Viloria, I.R. Creating Better Data: How To Map Homography, 2024. Available online: https://blogarchive.statsbomb.com/articles/football/creating-better-data-how-to-map-homography/ (accessed on 19 October 2025).
  81. Prakash, H.; Shang, J.C.; Nsiempba, K.M.; Chen, Y.; Clausi, D.A.; Zelek, J.S. Multi Player Tracking in Ice Hockey with Homographic Projections. arXiv 2024, arXiv:2405.13397. [Google Scholar] [CrossRef]
  82. Pandya, Y.; Nandy, K.; Agarwal, S. Homography Based Player Identification in Live Sports. In Proceedings of the IEEE/CVF Conference on Computer Vision and Pattern Recognition, Vancouver, BC, Canada, 17–24 June 2023; pp. 5209–5218. [Google Scholar]
  83. OpenCV. OpenCV: Geometric Image Transformations, 2024. Available online: https://docs.opencv.org/4.x/da/d54/group__imgproc__transform.html (accessed on 19 October 2025).
  84. Barrett, L.F. How Emotions Are Made: The Secret Life of the Brain; HarperCollins: New York, NY, USA, 2017. [Google Scholar]
  85. Schubert, E.; Sander, J.; Ester, M.; Kriegel, H.P.; Xu, X. DBSCAN Revisited, Revisited: Why and How You Should (Still) Use DBSCAN. ACM Trans. Database Syst. 2017, 42, 1–19. [Google Scholar] [CrossRef]
  86. Hall, E.T. A System for the Notation of Proxemic Behavior. Am. Anthropol. 1963, 65, 1003–1026. [Google Scholar] [CrossRef]
  87. Patterson, M. Spatial Factors in Social Interactions. Hum. Relations 1968, 21, 351–361. [Google Scholar] [CrossRef]
  88. Birant, D.; Kut, A. ST-DBSCAN: An algorithm for clustering spatial–temporal data. Data Knowl. Eng. 2007, 60, 208–221. [Google Scholar] [CrossRef]
  89. Cakmak, E.; Plank, M.; Calovi, D.S.; Jordan, A.; Keim, D. Spatio-temporal clustering benchmark for collective animal behavior. In Proceedings of the 1st ACM SIGSPATIAL International Workshop on Animal Movement Ecology and Human Mobility, New York, NY, USA, 2 November 2021; HANIMOB ’21. pp. 5–8. [Google Scholar] [CrossRef]
  90. Ou, Z.; Wang, B.; Meng, B.; Shi, C.; Zhan, D. Research on Resident Behavioral Activities Based on Social Media Data: A Case Study of Four Typical Communities in Beijing. Information 2024, 15, 392. [Google Scholar] [CrossRef]
  91. NVIDIA. NanoVLM—NVIDIA Jetson AI Lab, 2024. Available online: https://www.jetson-ai-lab.com/tutorial_nano-vlm.html (accessed on 19 October 2025).
  92. Zhang, Q.; Gou, S.; Li, W. Visual Perception System for Autonomous Driving. In Proceedings of the 2024 IEEE/RSJ International Conference on Intelligent Robots and Systems (IROS), Abu Dhabi, United Arab Emirates, 14–18 October 2024. [Google Scholar] [CrossRef]
  93. Wang, K.; Yao, X.; Ma, N.; Ran, G.; Liu, M. DMOT-SLAM: Visual SLAM in dynamic environments with moving object tracking. Meas. Sci. Technol. 2024, 35, 096302. [Google Scholar] [CrossRef]
  94. Singh, B.; Kumar, P.; Kaur, N. Advancements and Challenges in Visual-Only Simultaneous Localization and Mapping (V-SLAM): A Systematic Review. In Proceedings of the 2024 2nd International Conference on Sustainable Computing and Smart Systems (ICSCSS), Vitually, 10–12 July 2024; pp. 116–123. [Google Scholar] [CrossRef]
Figure 1. Hardware components of the Public Life Sensor Kit: (1) GoPro Hero 12 Black camera and Nvidia Jetson edge device; (2) Nvidia Jetson installed on-site with accompanying DTPR signage; (3) Mounted GoPro camera alongside a Vivacity commercial sensor for comparison.
Smartcities 08 00183 g001
Figure 2. System architecture of the Public Life Sensor Kit.
Smartcities 08 00183 g002
Figure 3. The pose estimation-enhanced sitting action recognition model was tested at MIT Media Lab, before deployment in public space in Sydney. The body skeleton colors indicate different parts of the human body: magenta for the head, red for the torso, green for the arms, and cyan for the legs.
Smartcities 08 00183 g003
Figure 4. Movable benches in the research area at the green space on the UNSW campus. (Photo: Robert Walsh).
Smartcities 08 00183 g004
Figure 5. Model training and cross—site validation for assessing pose estimation effects on generalizability and accuracy.
Smartcities 08 00183 g005
Figure 6. Comparison of baseline and pose-enhanced training datasets used for sitting action recognition. The body skeleton colors in the image set on the right indicate different parts of the human body: magenta for the head, red for the torso, green for the arms, and cyan for the legs.
Smartcities 08 00183 g006
Figure 7. Homography Transformation Matrix [83].
Smartcities 08 00183 g007
Figure 8. Homographic transition of sample test points from detection in image space into geographic coordinates. The image on the left shows detection points overlaid on the image plane, while the image on the right shows their transformed positions in coordinate space. Green lines denote the grid structure, and cyan points indicate the sample test positions.
Smartcities 08 00183 g008
Figure 9. Precision–Recall curves for the pose-enhanced models. (a) Sitting action recognition with per-class AP: sitting 0.976, standing 0.979; overall mAP@0.5 = 0.978. (b) Bench detection with per-class AP: bench_large 0.990, bench_small 0.987; overall mAP@0.5 = 0.989.
Smartcities 08 00183 g009
Figure 10. Comparison of six pose-enhanced and six non-pose baseline models illustrating the effect of pose estimation on model performance. Each model was trained under a different train-validation-test split ratio (70-20-10 to 20-20-60) and evaluated on an external test dataset. Bars represent the mean performance values across the six runs for each model type, including Precision, Recall, mAP@50, and mAP@50–95.
Smartcities 08 00183 g010
Figure 11. Pedestrian counts per hour during daytime at UNSW, 07:00–18:00. The Public Life Sensor Kit is compared with a commercial sensor placed to capture the same field of view.
Smartcities 08 00183 g011
Figure 12. Average pedestrian count per hour of the day at the UNSW study site. Bars report the mean count in one-hour bins for the Commercial Sensor (left) and the Public Life Sensor Kit (right), aggregated across study days.
Smartcities 08 00183 g012
Figure 13. (Left): Commercial sensor GPS event locations during a one-hour window (12:00–13:00, 12 July), plotted in site coordinates; each colored dot represents a different detected object, and the dashed box marks a cluster of detections. (Right): Overhead image of the same area showing a tree within the research boundary that overlaps the cluster.
Smartcities 08 00183 g013
Figure 14. (Left): Image–space detections and tracks from the pose-enhanced model, visualized on the site grid. (Right): results re-projected to site coordinates and clustered with ST-DBSCAN to identify social interaction groups.
Smartcities 08 00183 g014
Table 1. Structure of GeoJSON feature collected for sitting detection.
FieldExampleDescription
typeFeatureDefines the GeoJSON object as an individual spatial feature.
geometry.typePointGeometry type representing a single detected person as a point feature.
geometry.coordinates[1059, 685]Point coordinates (x, y) in image space corresponding to the estimated foot-ground contact position derived from lower-body keypoints using pose estimation.
properties.categorystandingClassified behavioral category (e.g., sitting and standing).
properties.confidence0.6397Model confidence score associated with
the detection.
properties.timestamp2024-06-19T13:51:12.279838Timestamp indicating when the detection occurred.
properties.objectID6Unique identifier assigned to the tracked individual across frames.
properties.gridId7Spatial grid identifier indicating which analysis zone the point falls within.
properties.keypoints[[x, y, c], …]Array of 17 human body keypoints following the COCO format, each containing coordinates (x, y) and confidence (c) values.
(1) Each detection instance is recorded as a GeoJSON feature containing spatial, temporal, and behavioral attributes. (2) Coordinates represent the estimated ground-contact point of the detected person, calculated from lower-body keypoints to approximate the actual physical position in the scene. (3) The keypoints array conforms to the COCO 17-joint convention, enabling downstream spatial and behavioral analysis.
Table 2. Mean Average Precision at IoU 0.50 for models used for UNSW intervention observation.
Sitting Action RecognitionBench Detection
mAP *97.898.9
* mean Average Precision.
Table 3. Contextual comparison of sitting action recognition with a recent street-activity model.
Class/MetricSitting Action Recognition (This Study)Street Activity Detection Model [15]
Sitting/Stayer0.9760.48
Standing/Passerby0.9790.87
Car0.82
Micro-mobility0.56
Overall mAP@0.500.9780.68
(1) Values in the left column are average precision per class for our pose-enhanced model on the UNSW dataset. (2) Values in the right column are the published metrics from Salazar-Miranda et al. [15]. (3) Datasets and training procedures differ. This table is for context, not a direct benchmark.
Table 4. Statistical comparison of baseline and pose-enhanced models using independent two-sample t-tests.
MetricPose-Enhanced MeanBaseline MeanImprovement %t Valuep Value
Precision0.8150.627+29.95.131<0.001
Recall0.7640.429+78.24.911<0.001
mAP@500.7860.451+74.55.685<0.001
mAP@50-950.5620.302+86.55.284<0.001
The results compare six pose-enhanced models and six non-pose baseline models, for a total of twelve independent training runs. Each model was trained using a different train-validation-test split ratio ranging from 70-20-10 to 20-20-60 and evaluated on an external test dataset. Reported values represent group means across the six runs for each model type. All improvements are statistically significant at the 0.001 level, confirming the positive effect of pose information on model accuracy and cross-site generalizability.
Table 5. Average number of people per day for each behavior before and after the intervention.
BehaviorBefore InterventionAfter InterventionChange (%)
Visiting5563+14
Staying 1523+360
Sitting115+1400
Socializing 29
1 “Staying” refers to individuals who remain in the space for more than five minutes. This temporal threshold is not intended as a definitive behavioral boundary but as a consistent comparative indicator to evaluate changes in prolonged use of space before and after the intervention. 2 “Socializing” refers to individuals who stay within one meter of another person for more than two minutes. This proximity–duration metric likewise serves as a comparative measure of group interaction rather than an absolute definition, allowing assessment of relative shifts in social activity following the intervention.
Disclaimer/Publisher’s Note: The statements, opinions and data contained in all publications are solely those of the individual author(s) and contributor(s) and not of MDPI and/or the editor(s). MDPI and/or the editor(s) disclaim responsibility for any injury to people or property resulting from any ideas, methods, instructions or products referred to in the content.