


Mapping Materials and Dyes on Historic Tapestries Using Hyperspectral Imaging

Abstract
1. Introduction
2. Materials and Methods
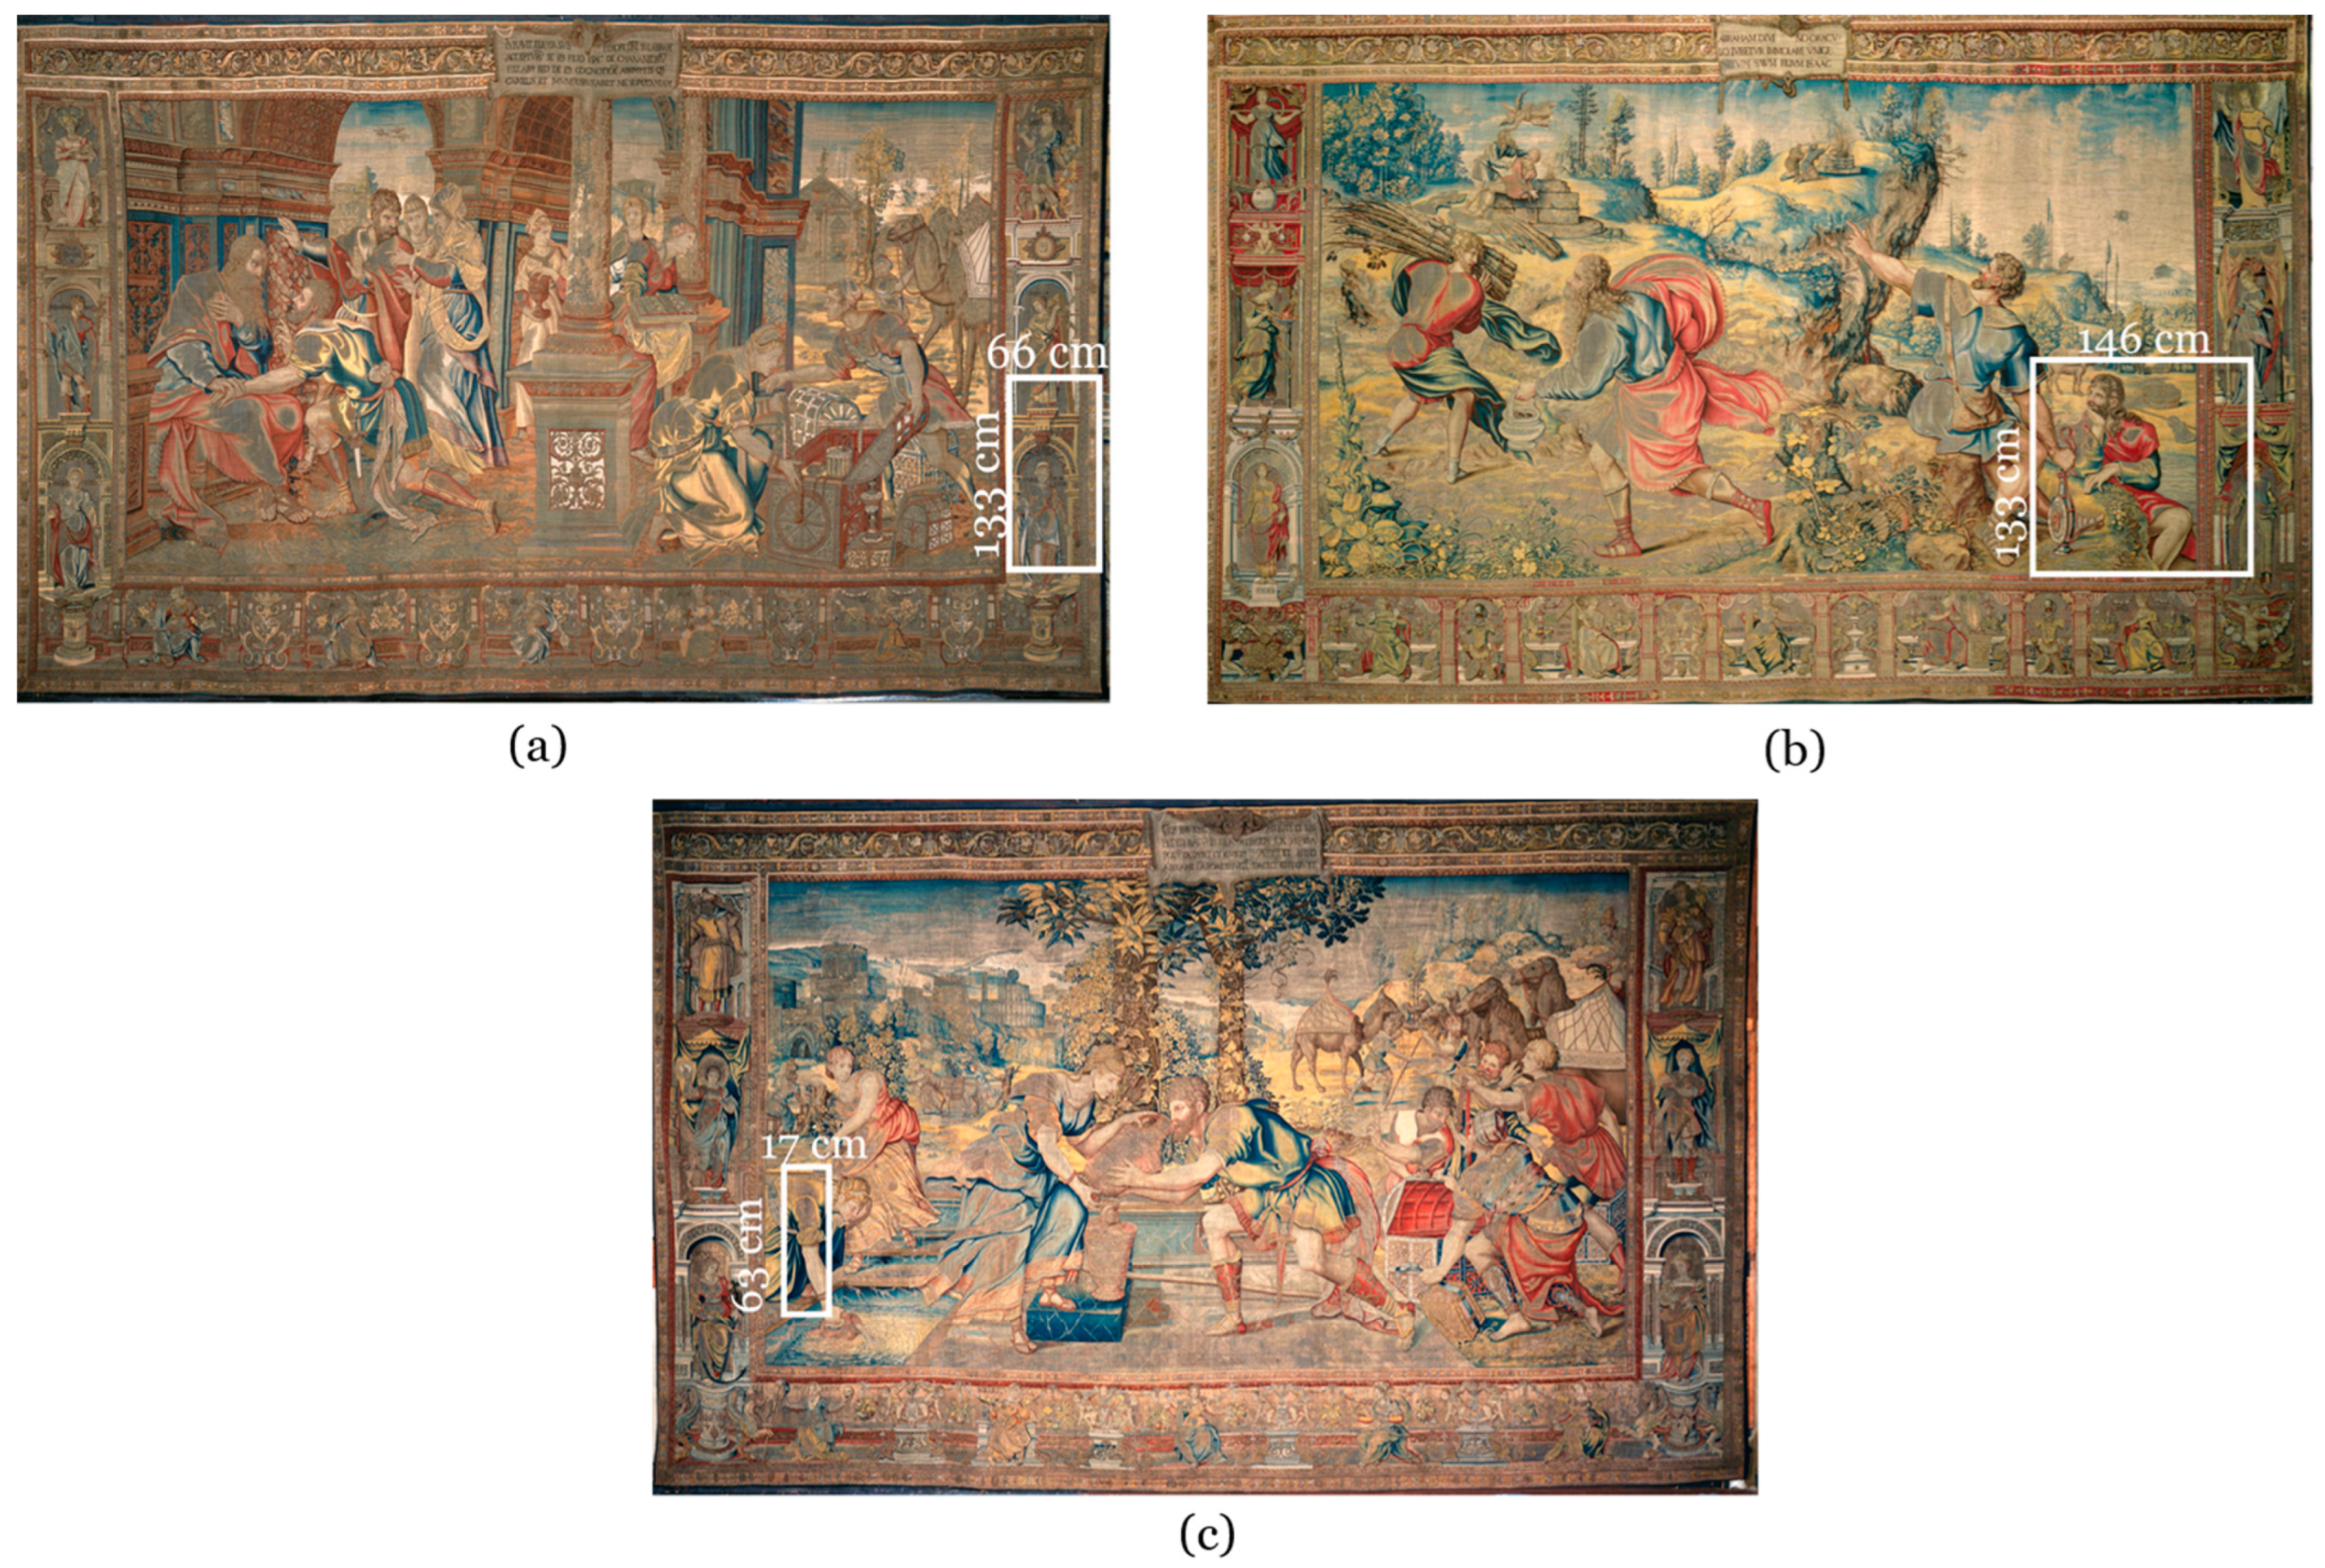
2.1. Historic Tapestries
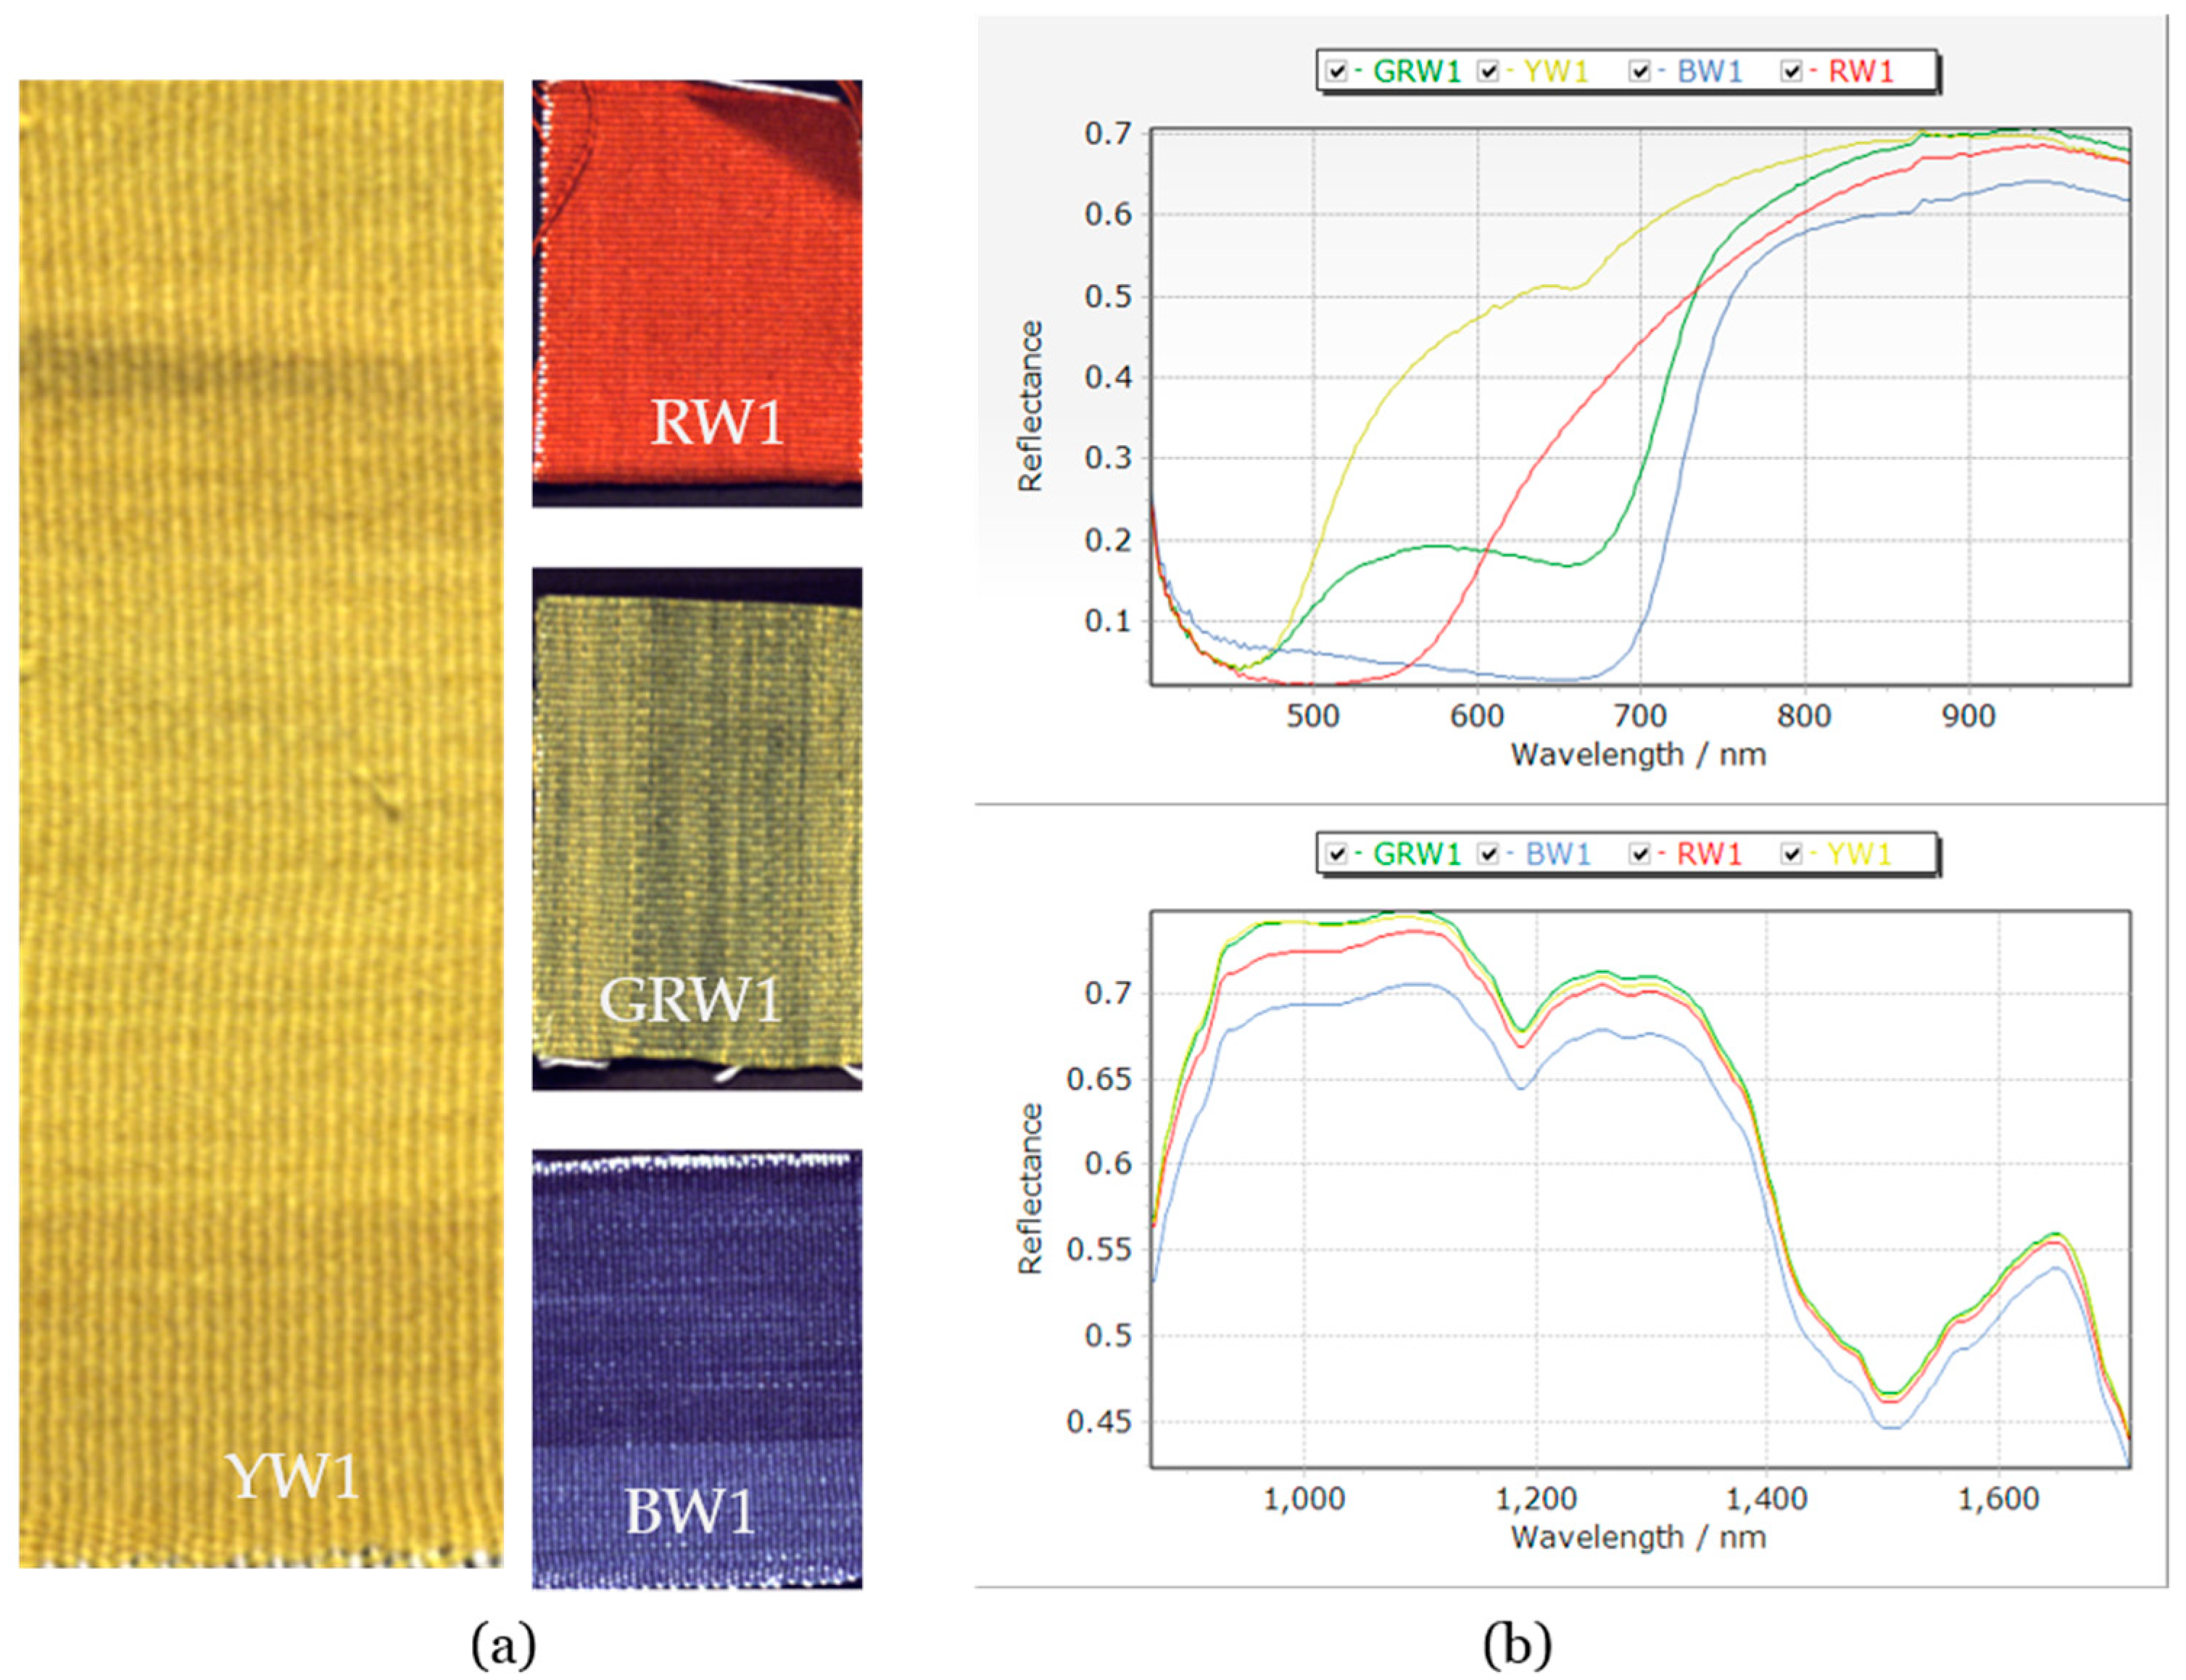
2.2. Reference Samples
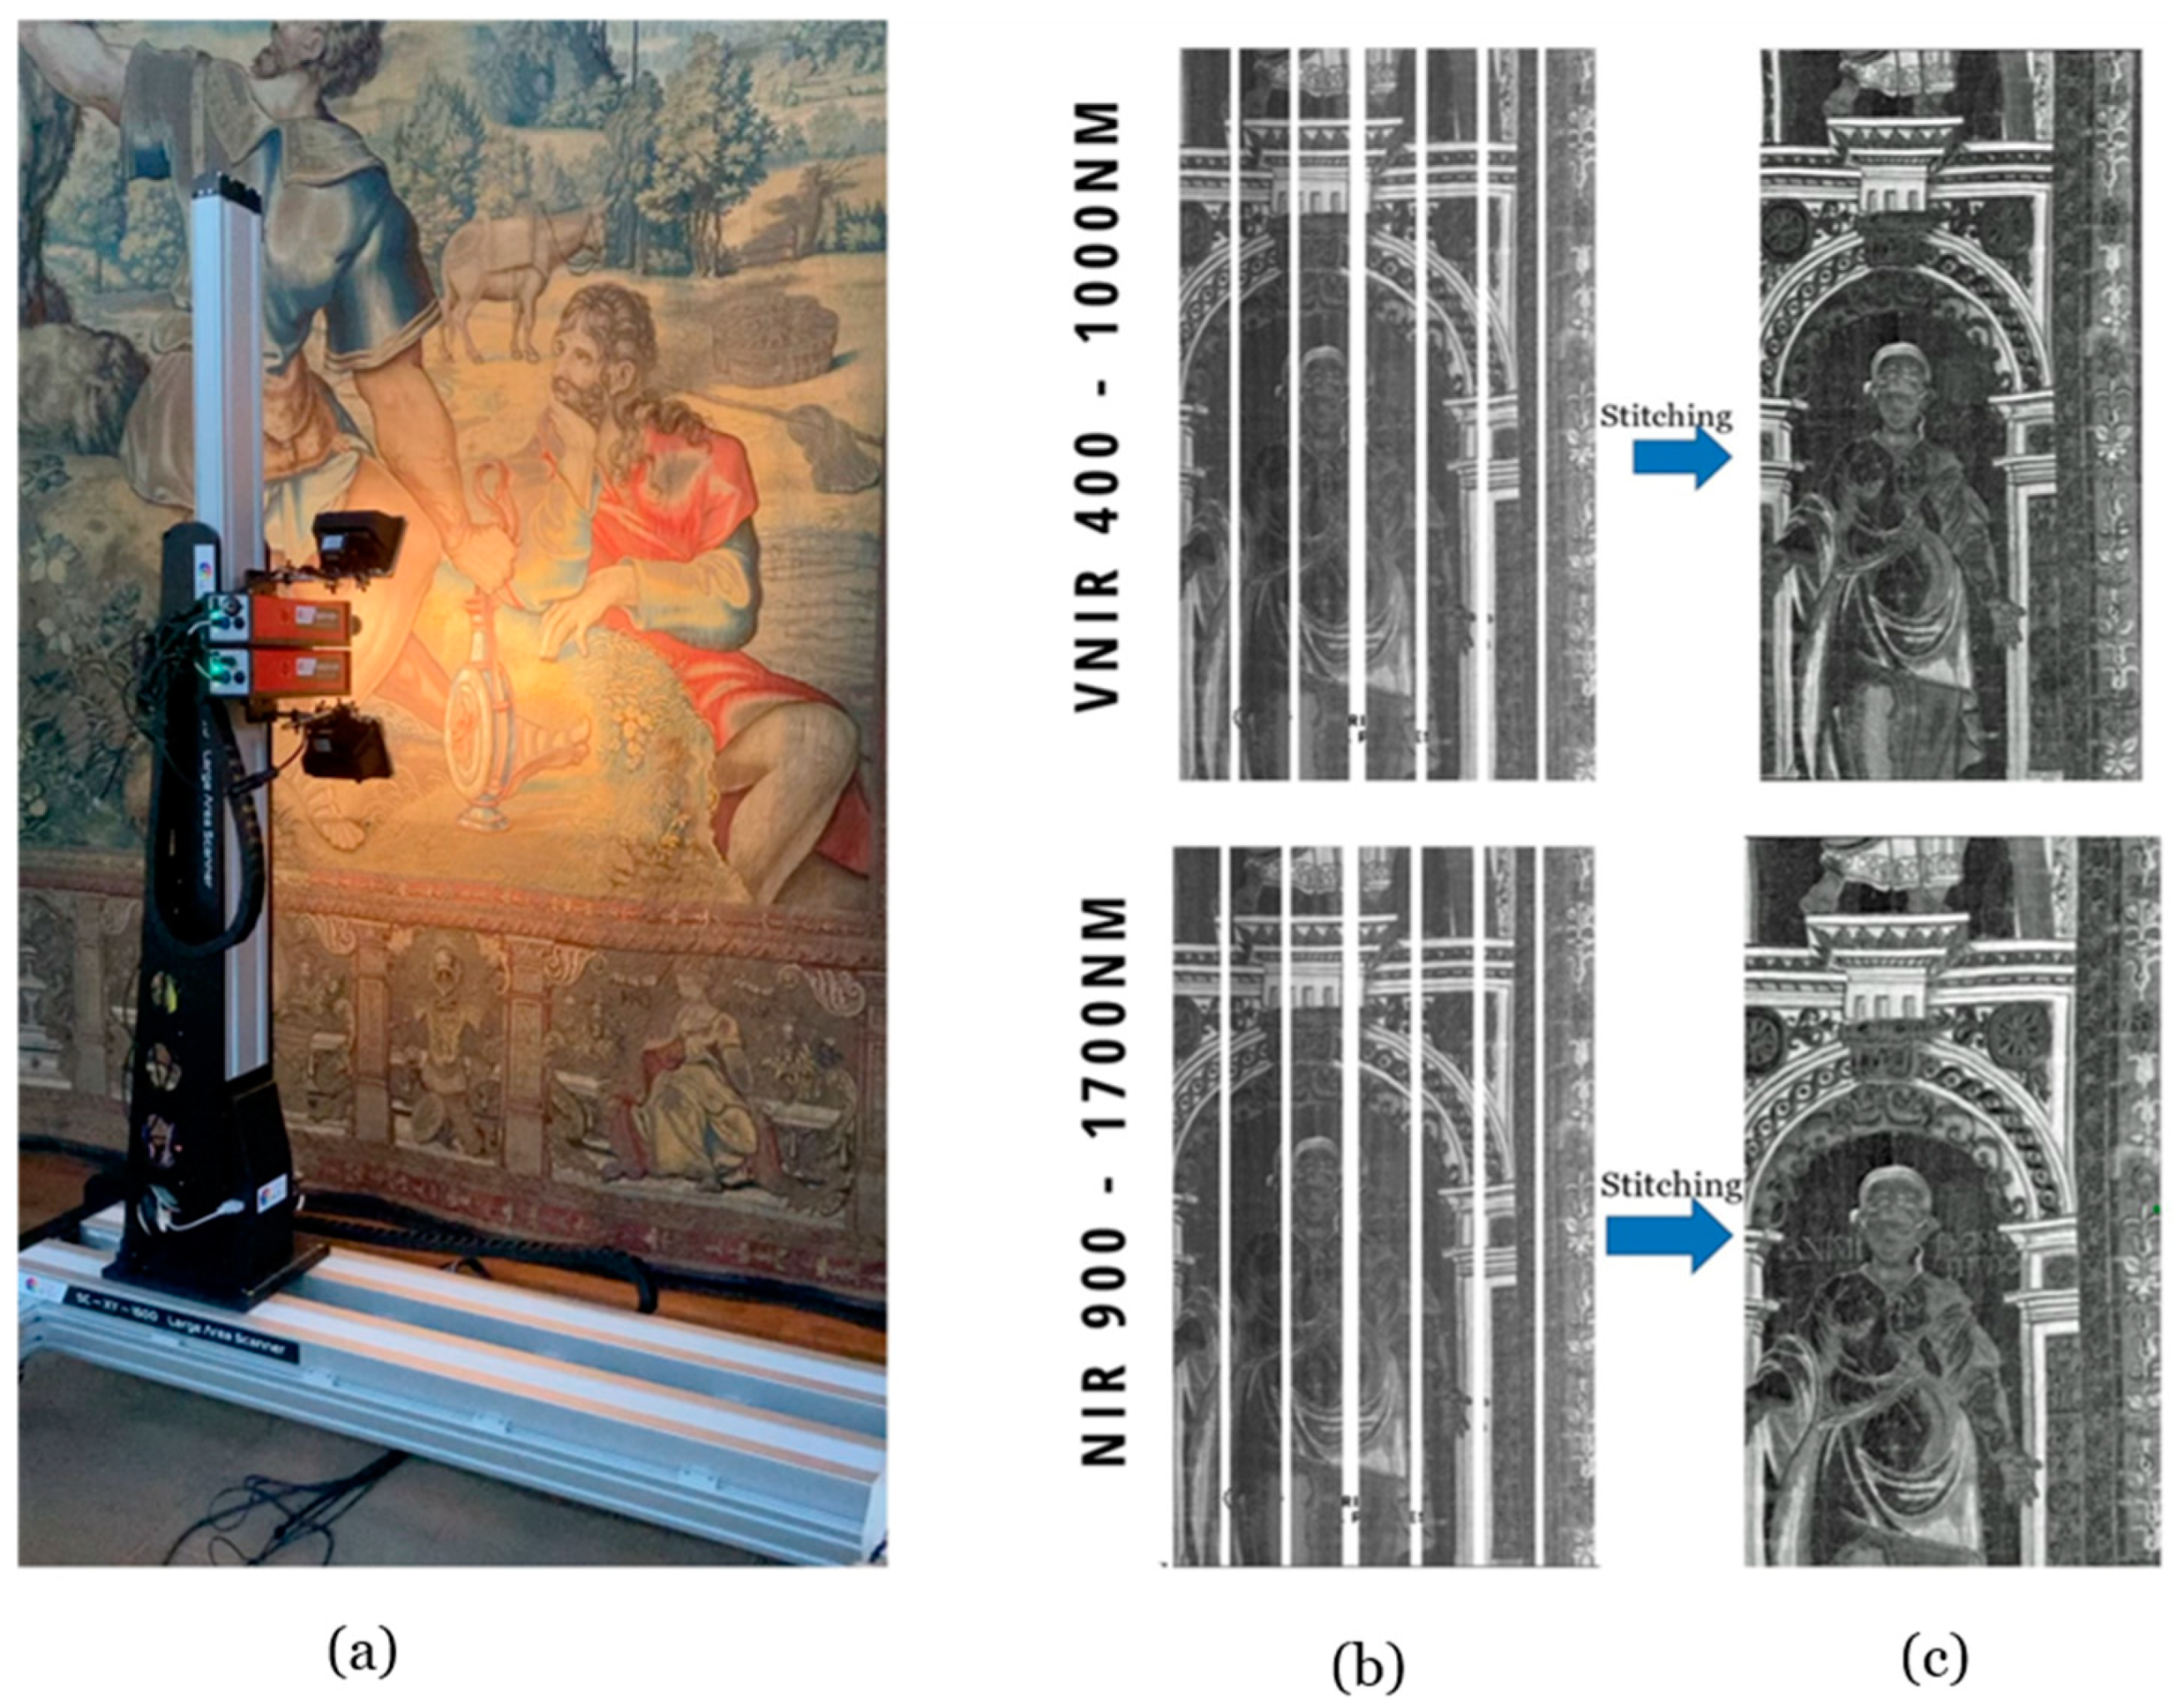
2.3. Hyperspectral Imaging
3. Results
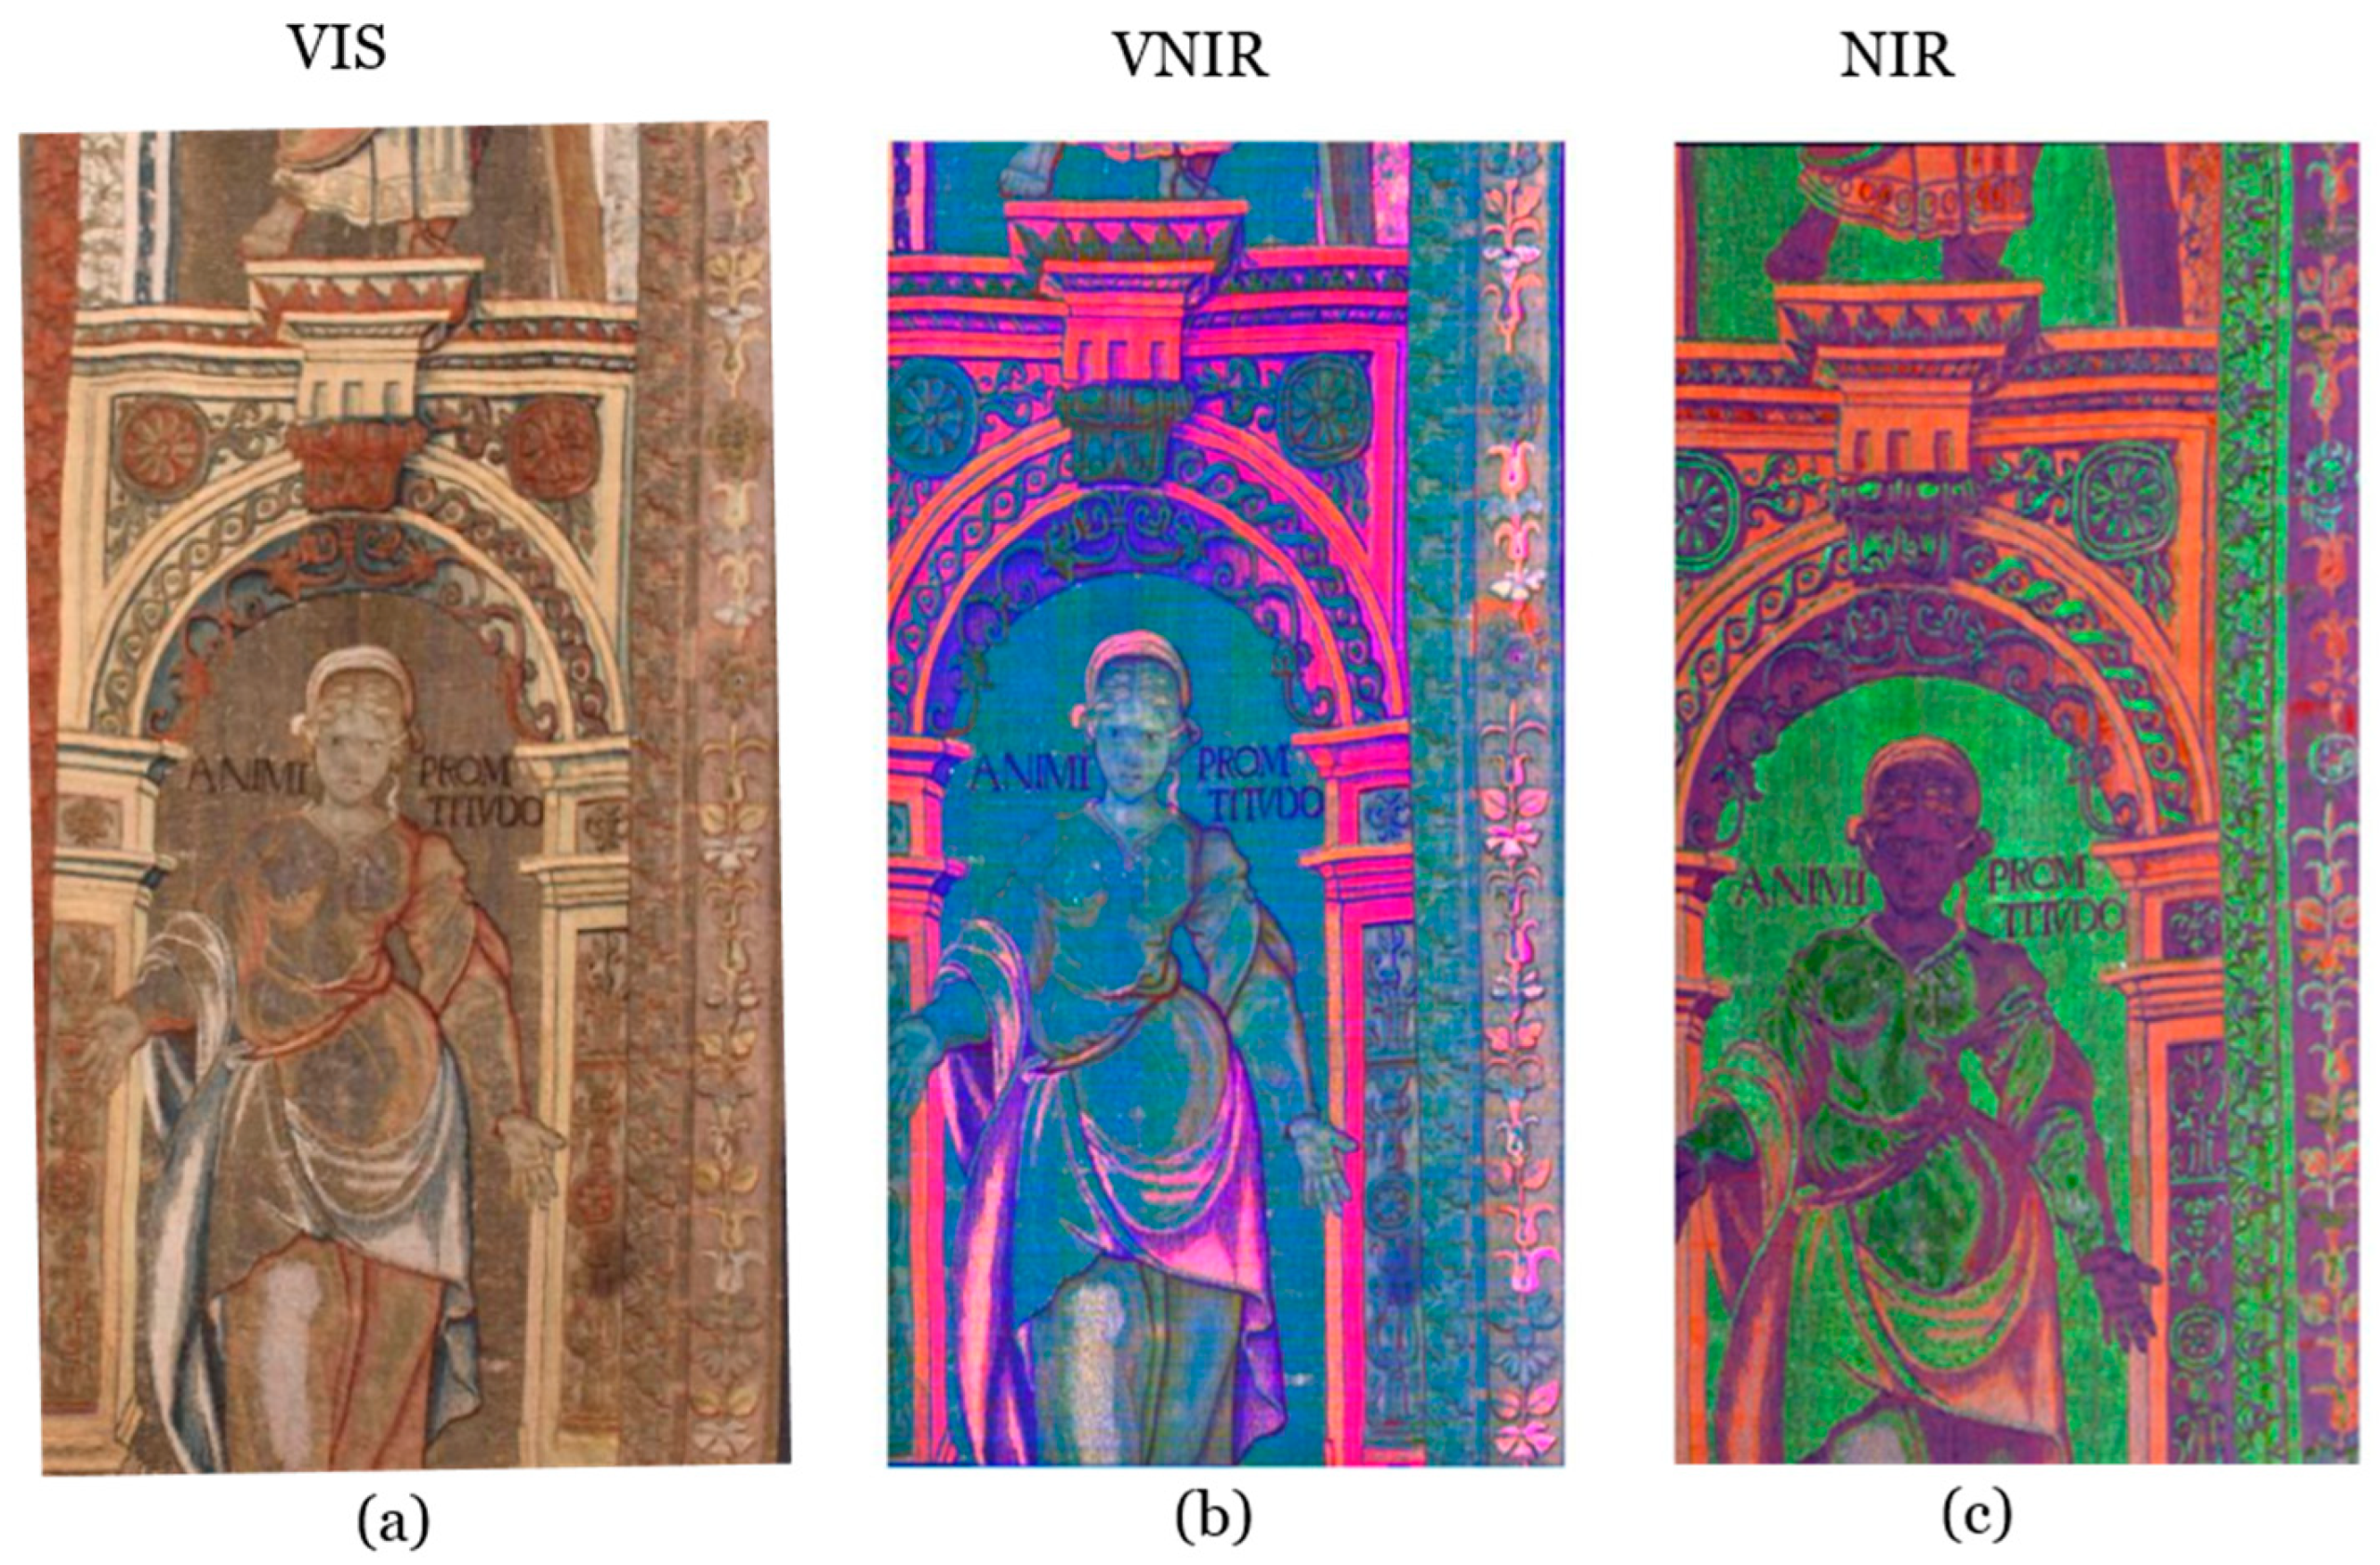
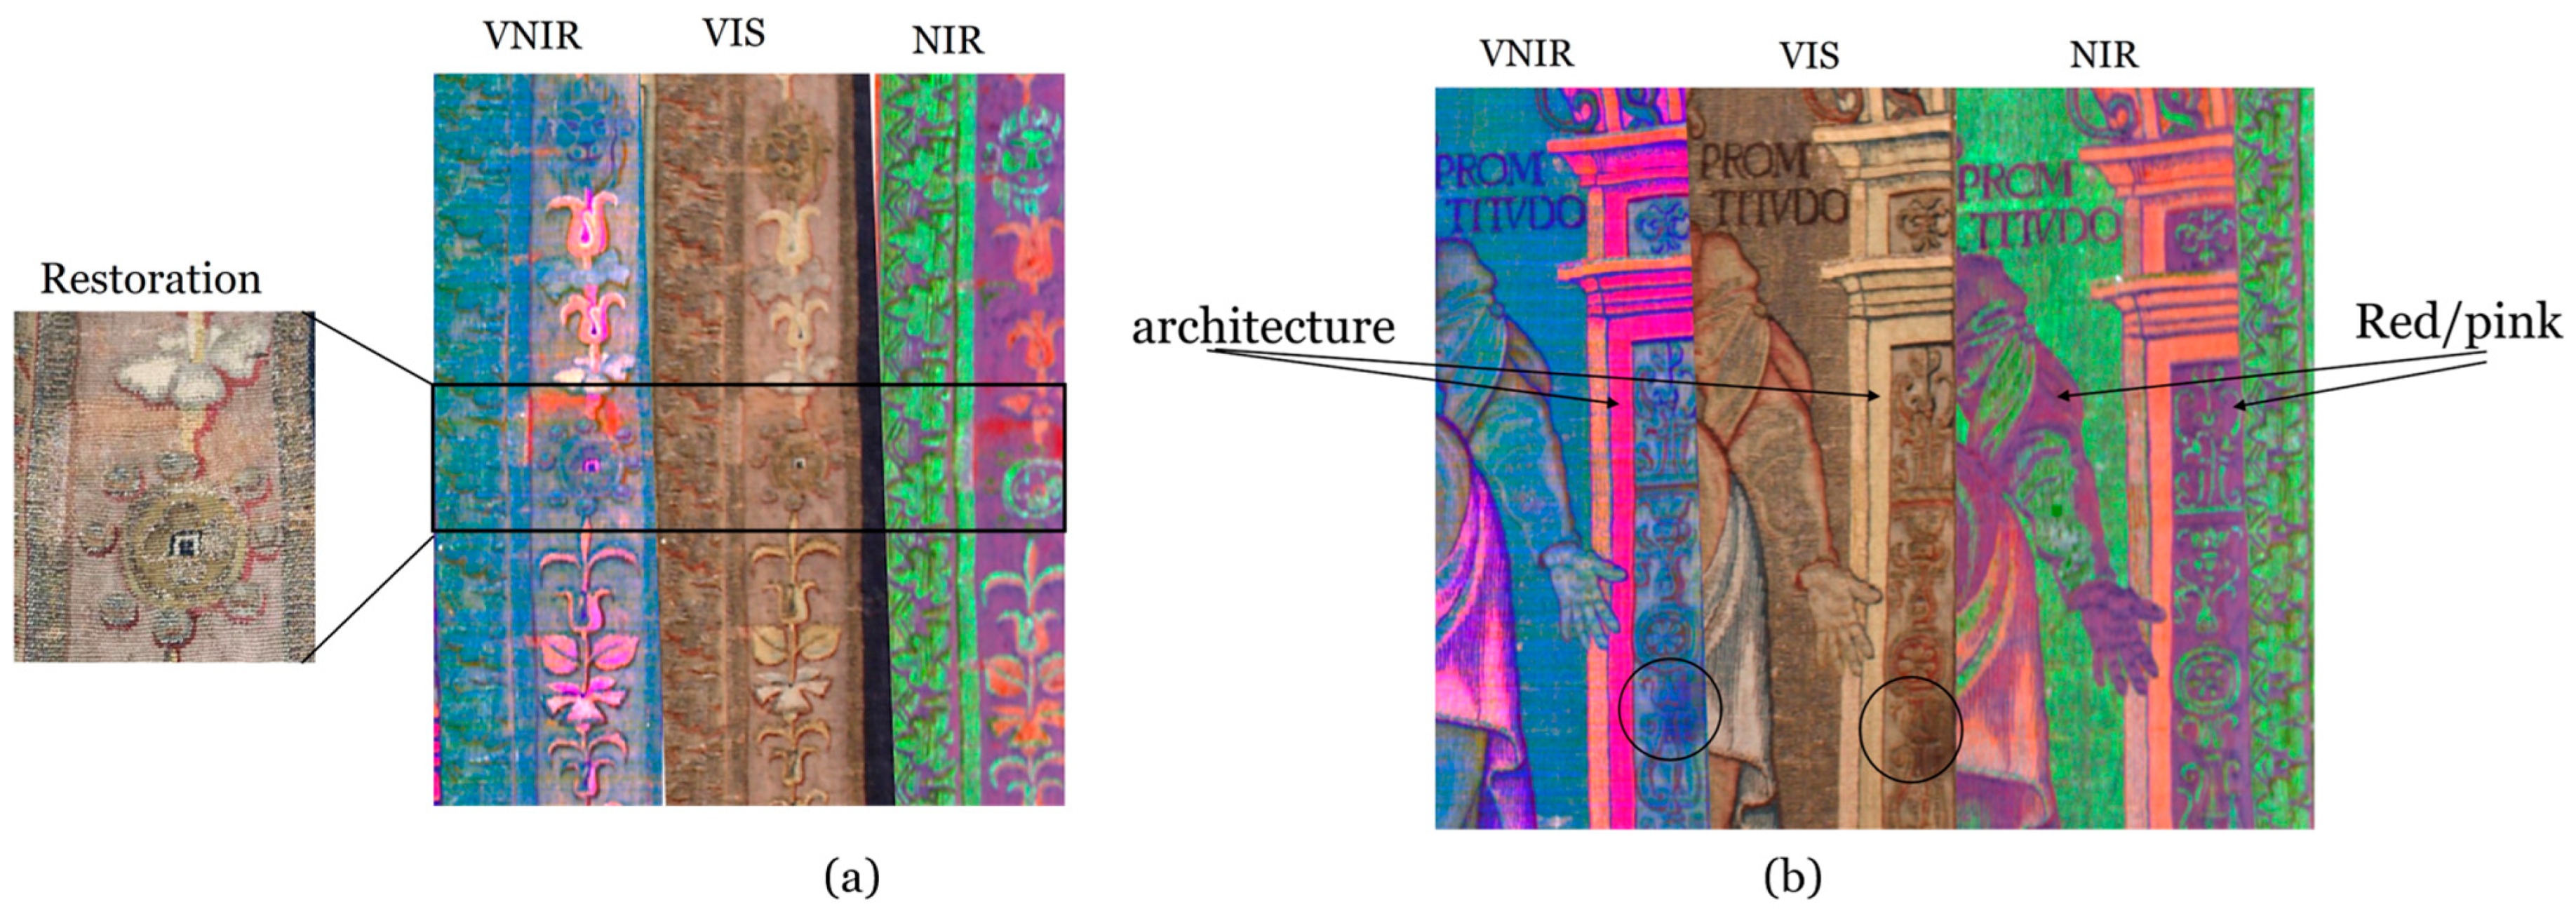
3.1. PCA Analysis
3.2. SAM Analysis
3.2.1. MODHT Samples Analysis and Compilation of Endmember Library
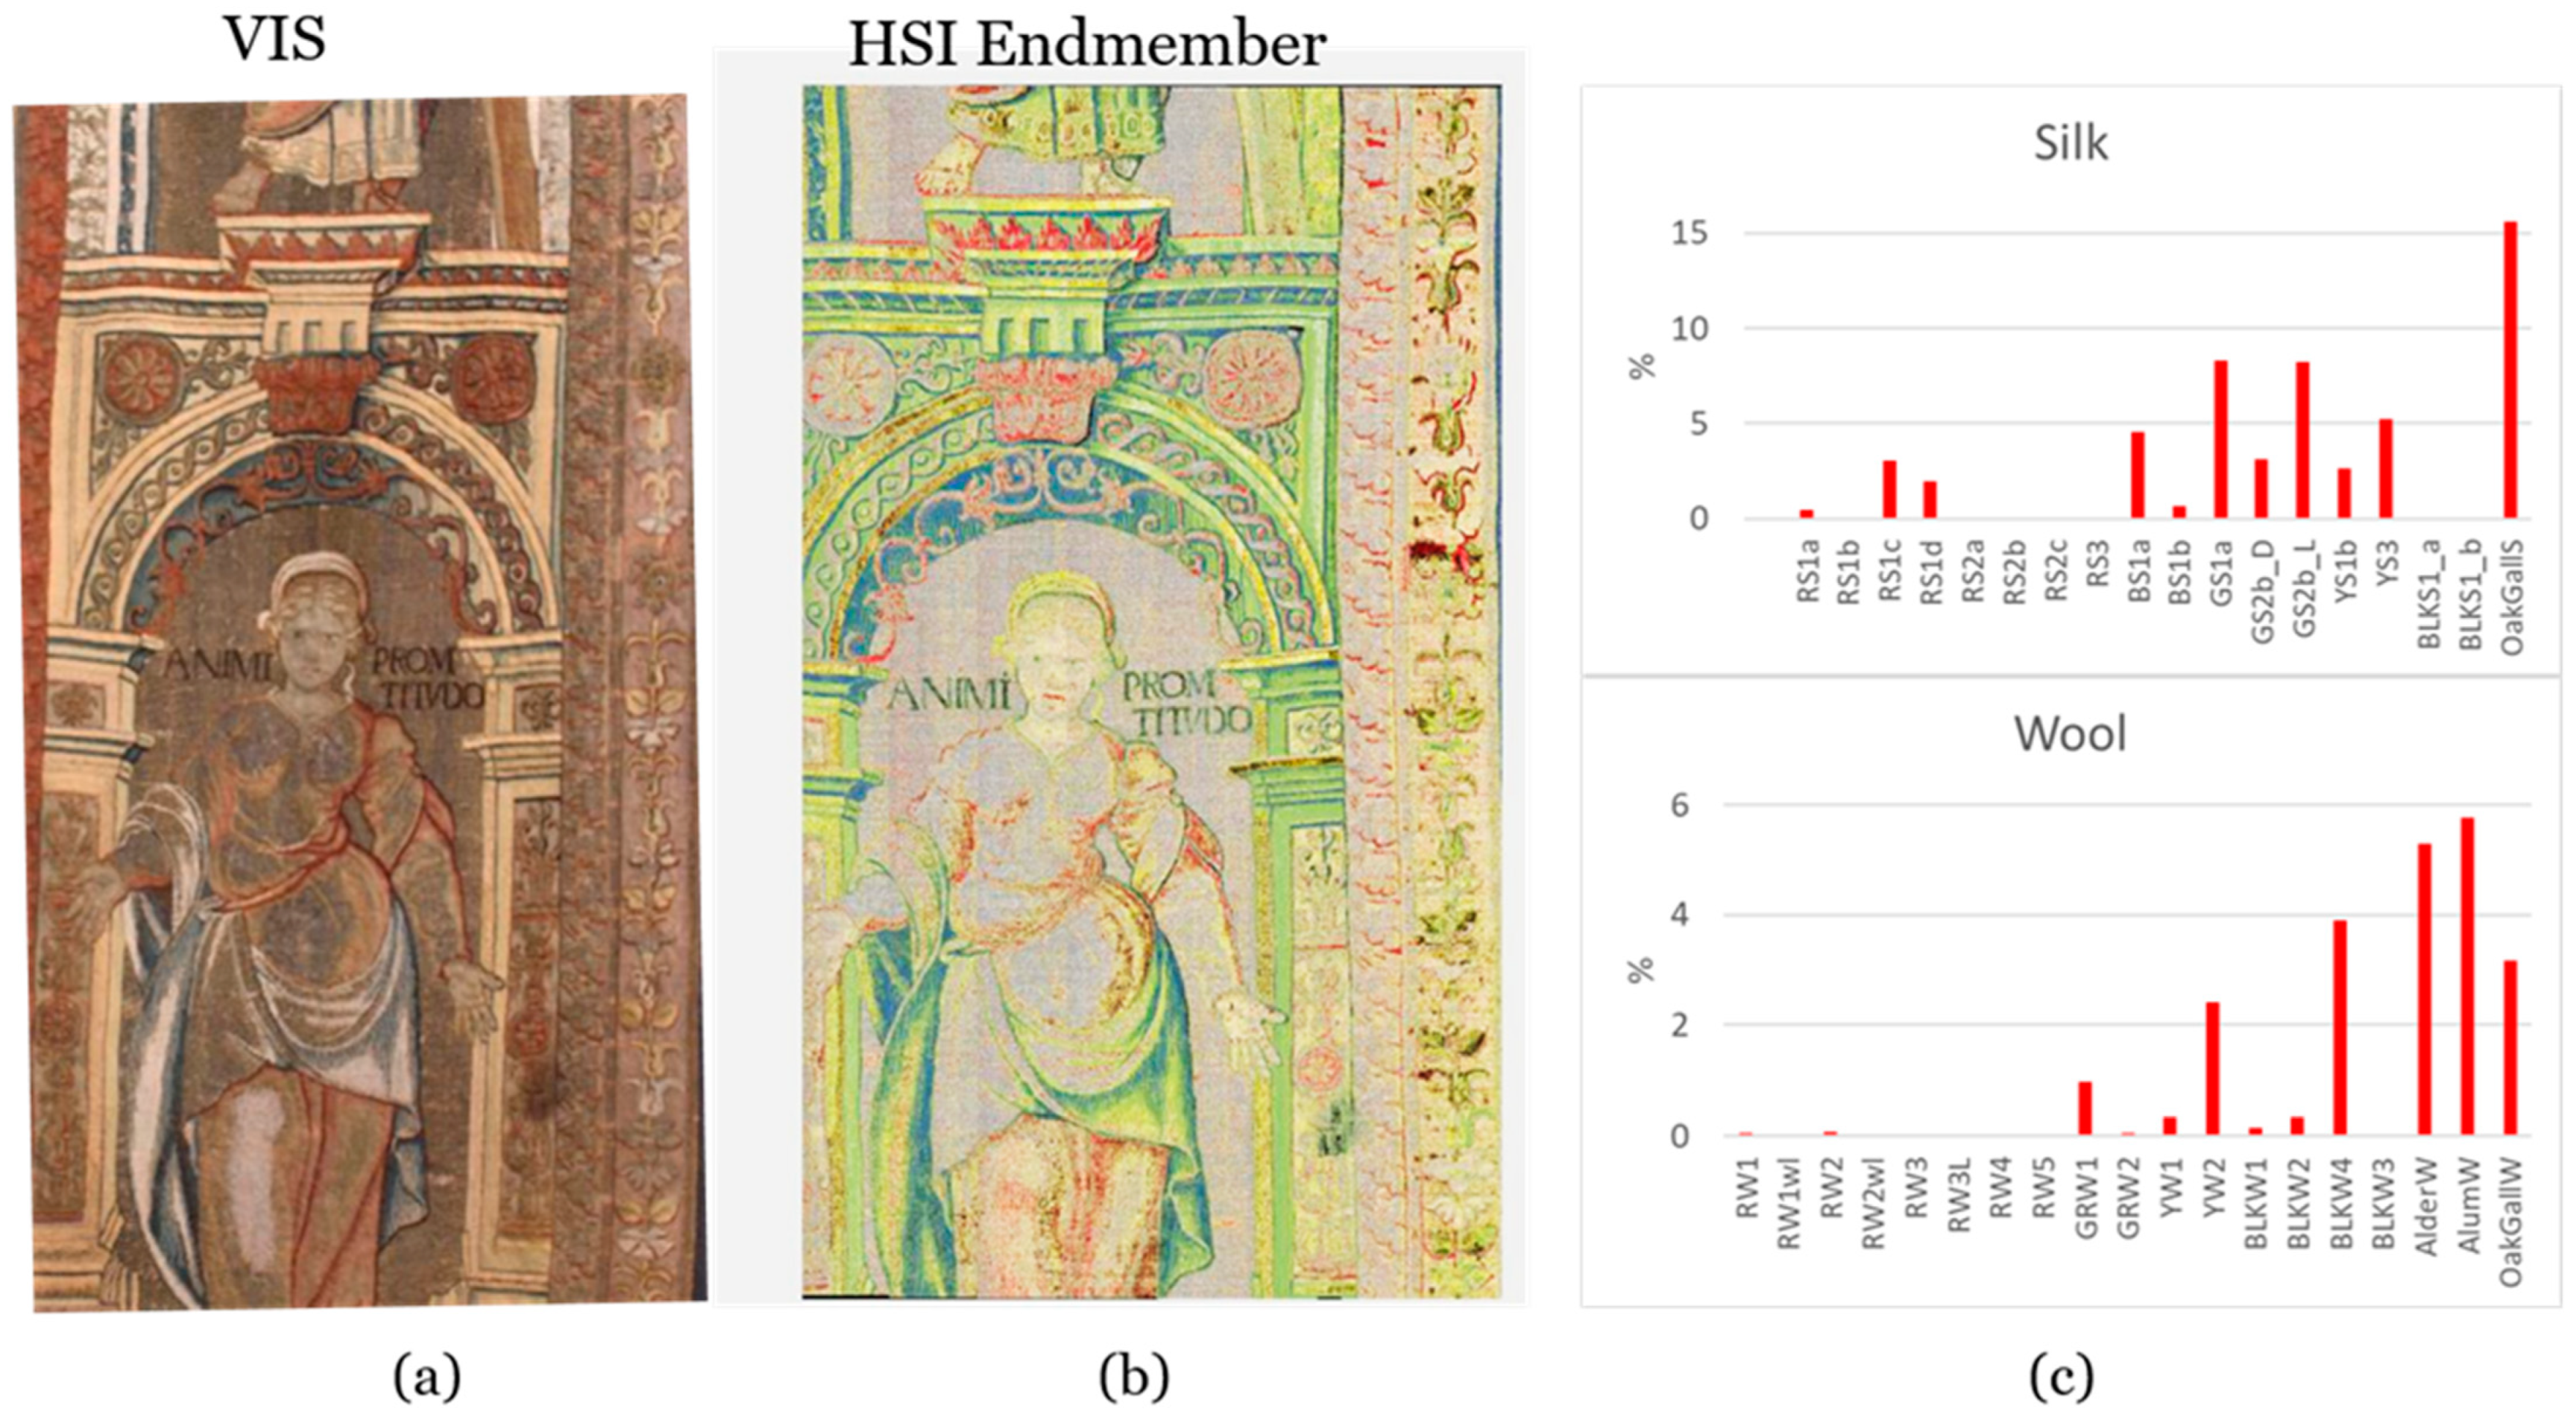
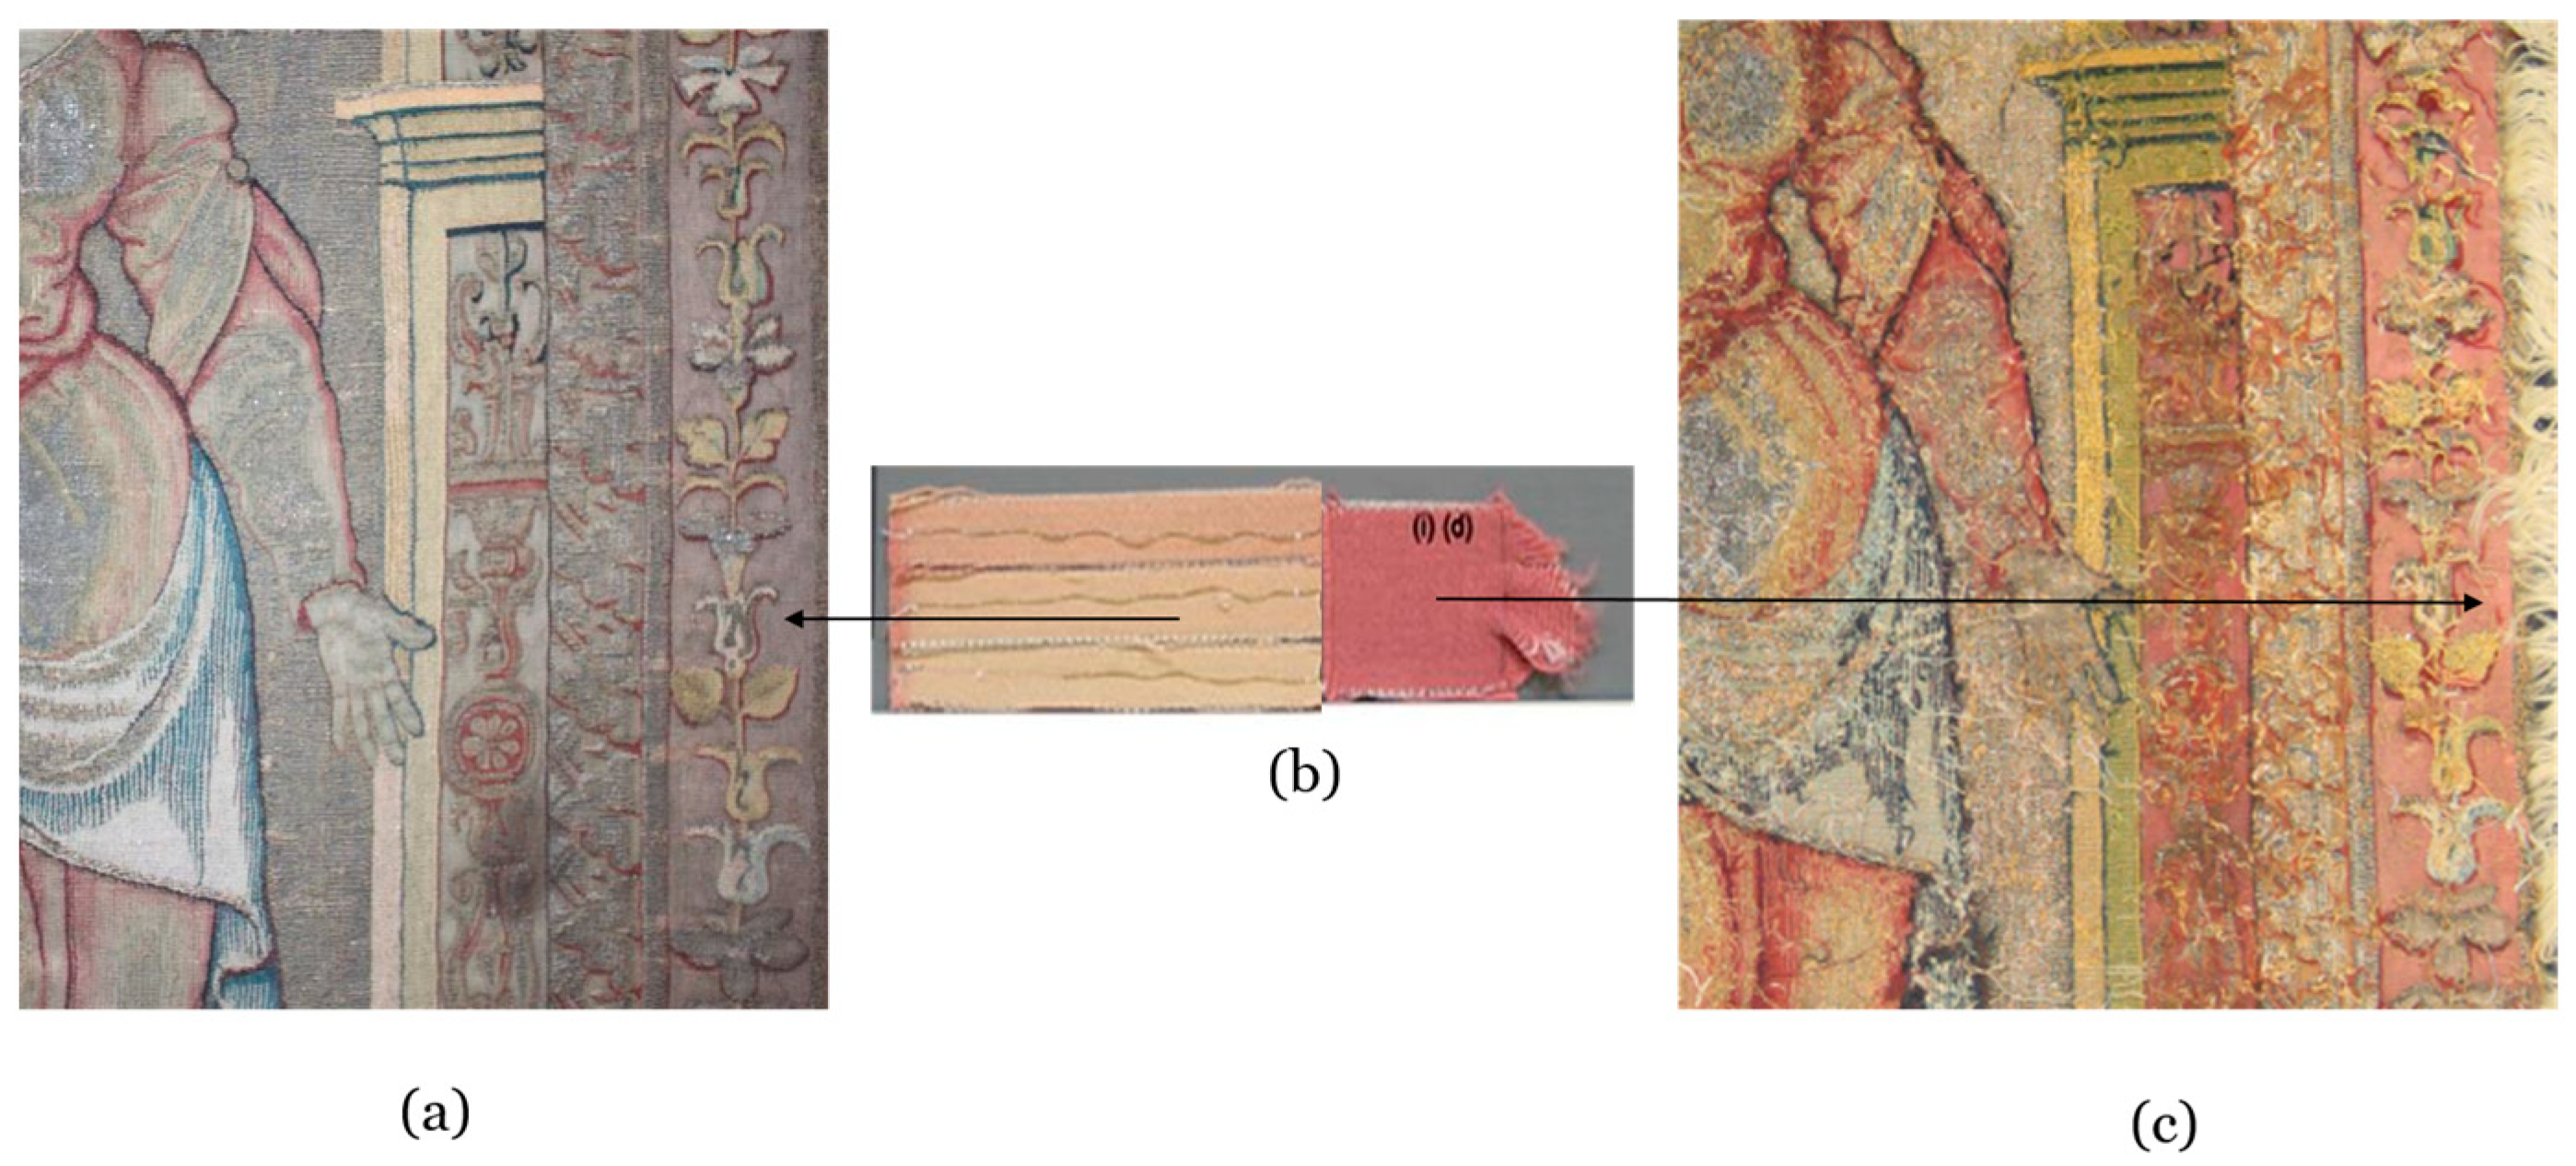
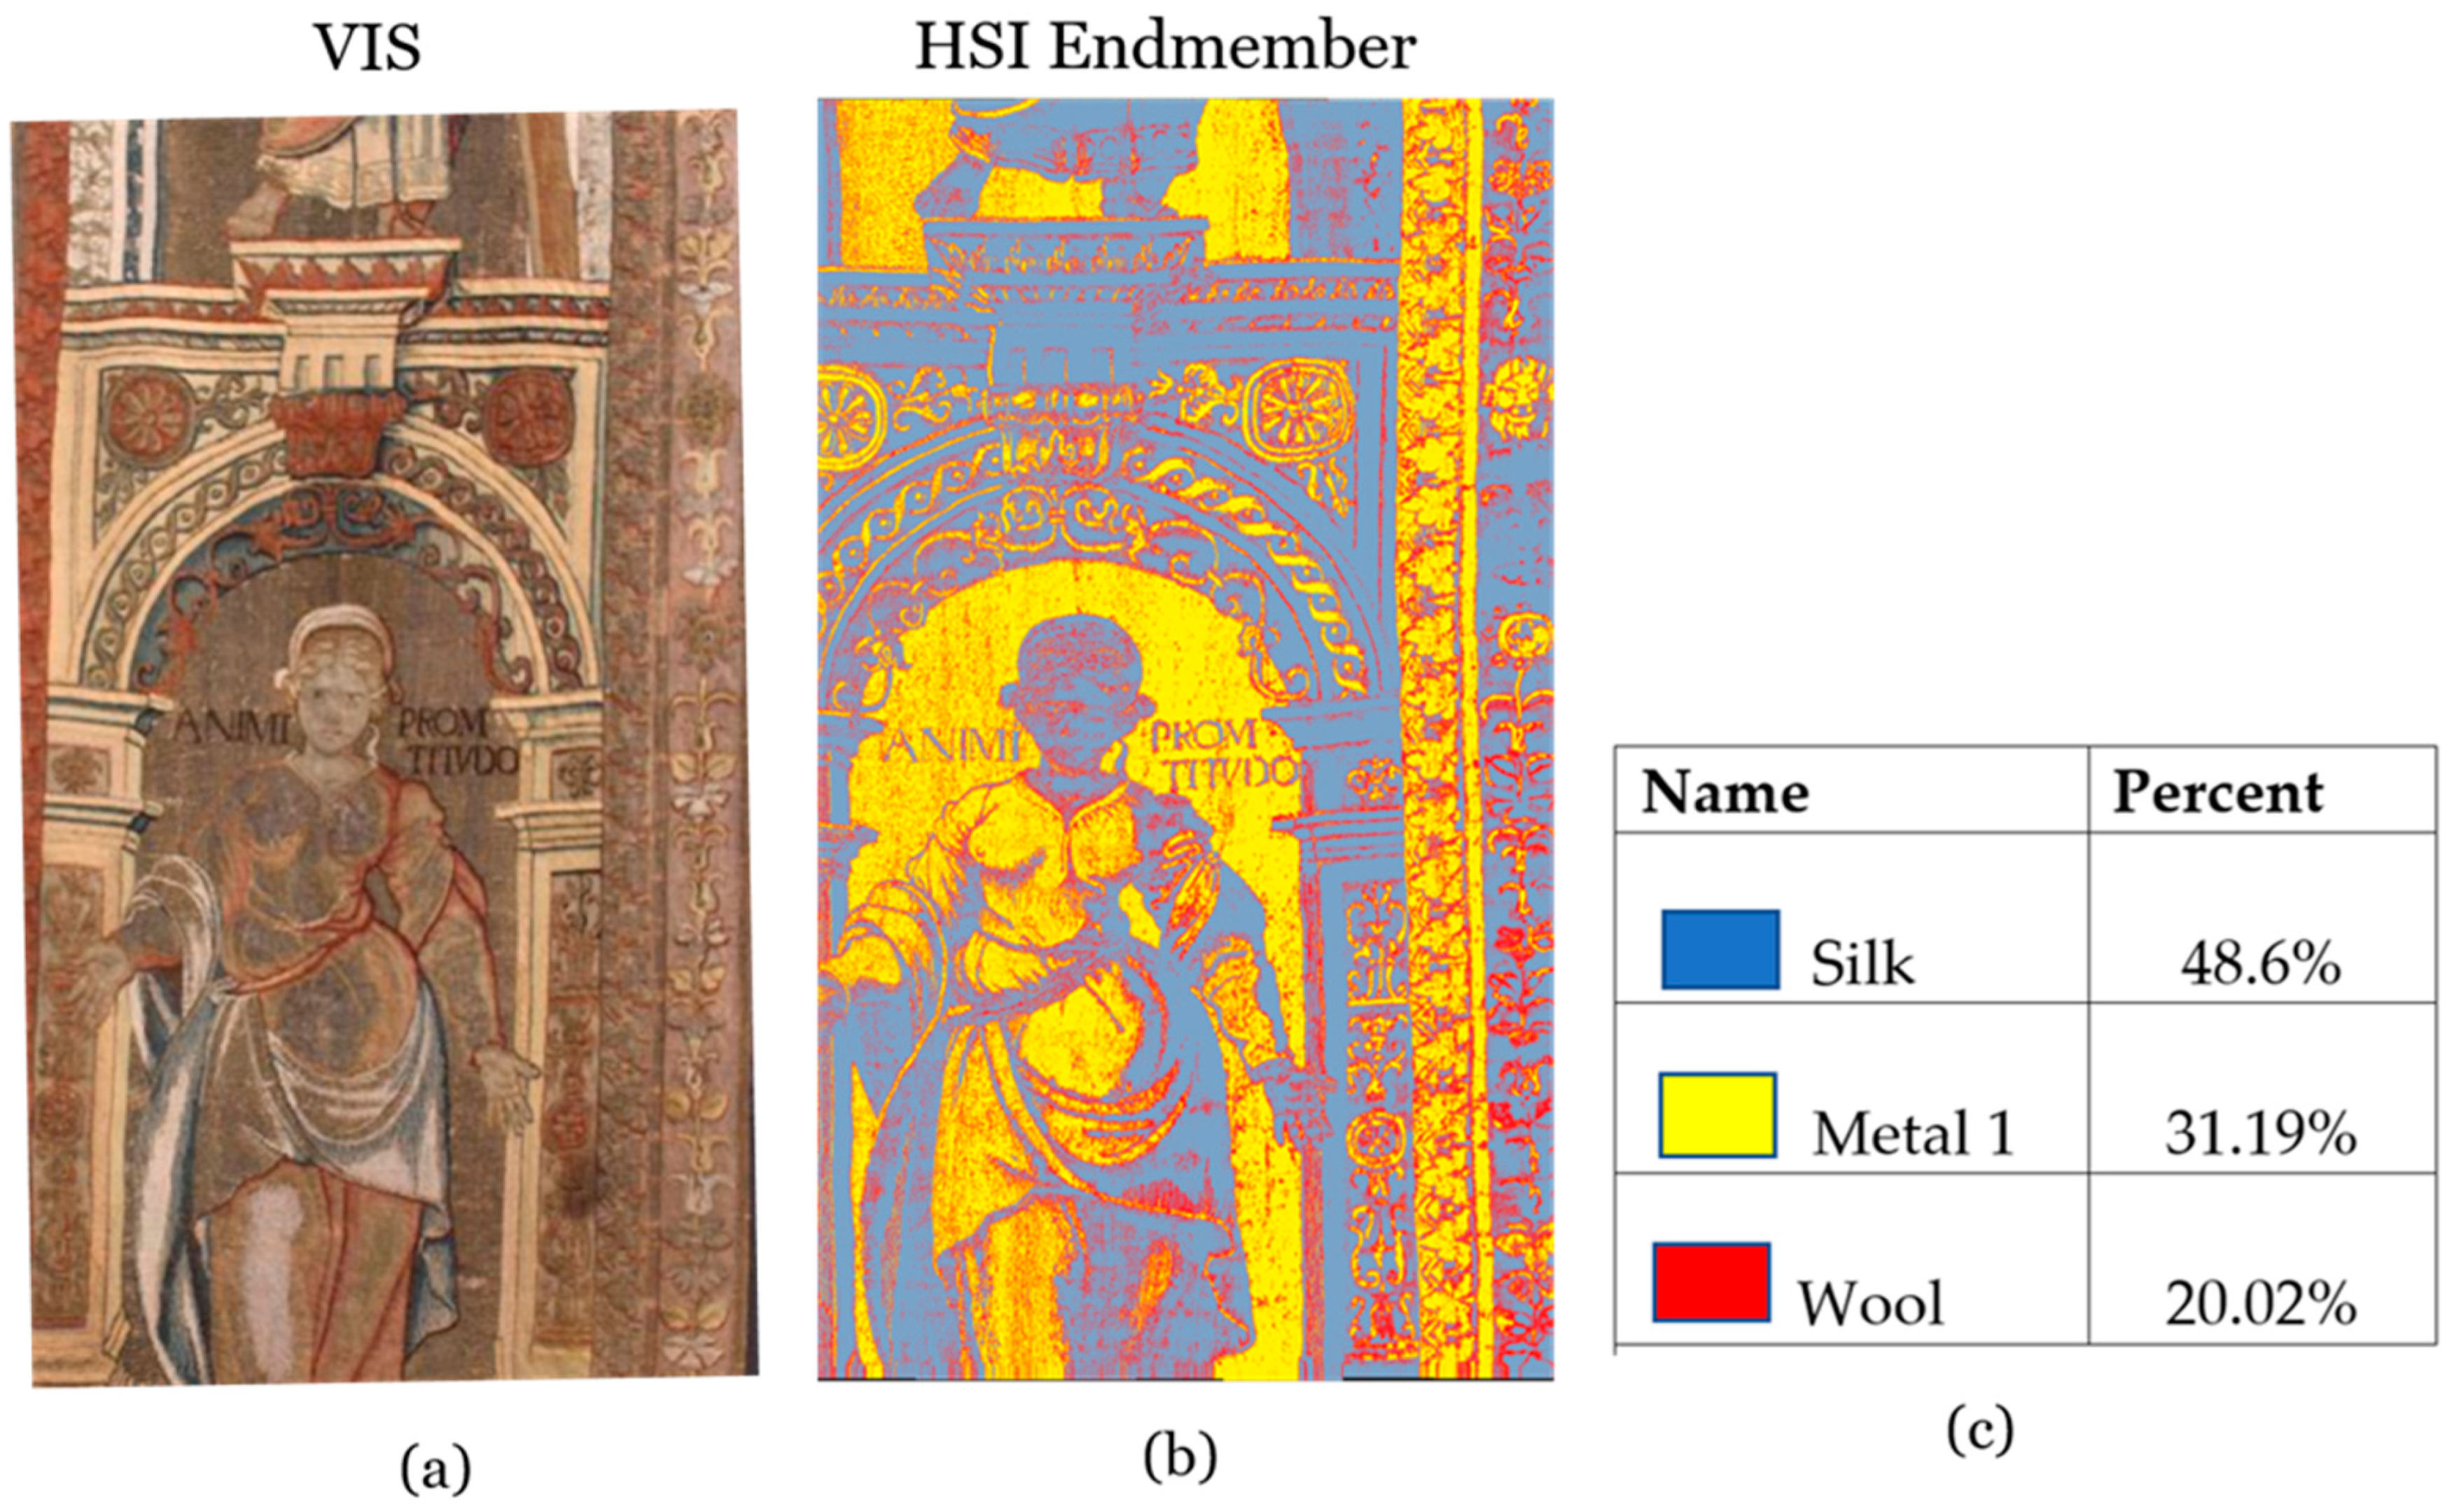
3.2.2. The Oath and Departure of Eliezer
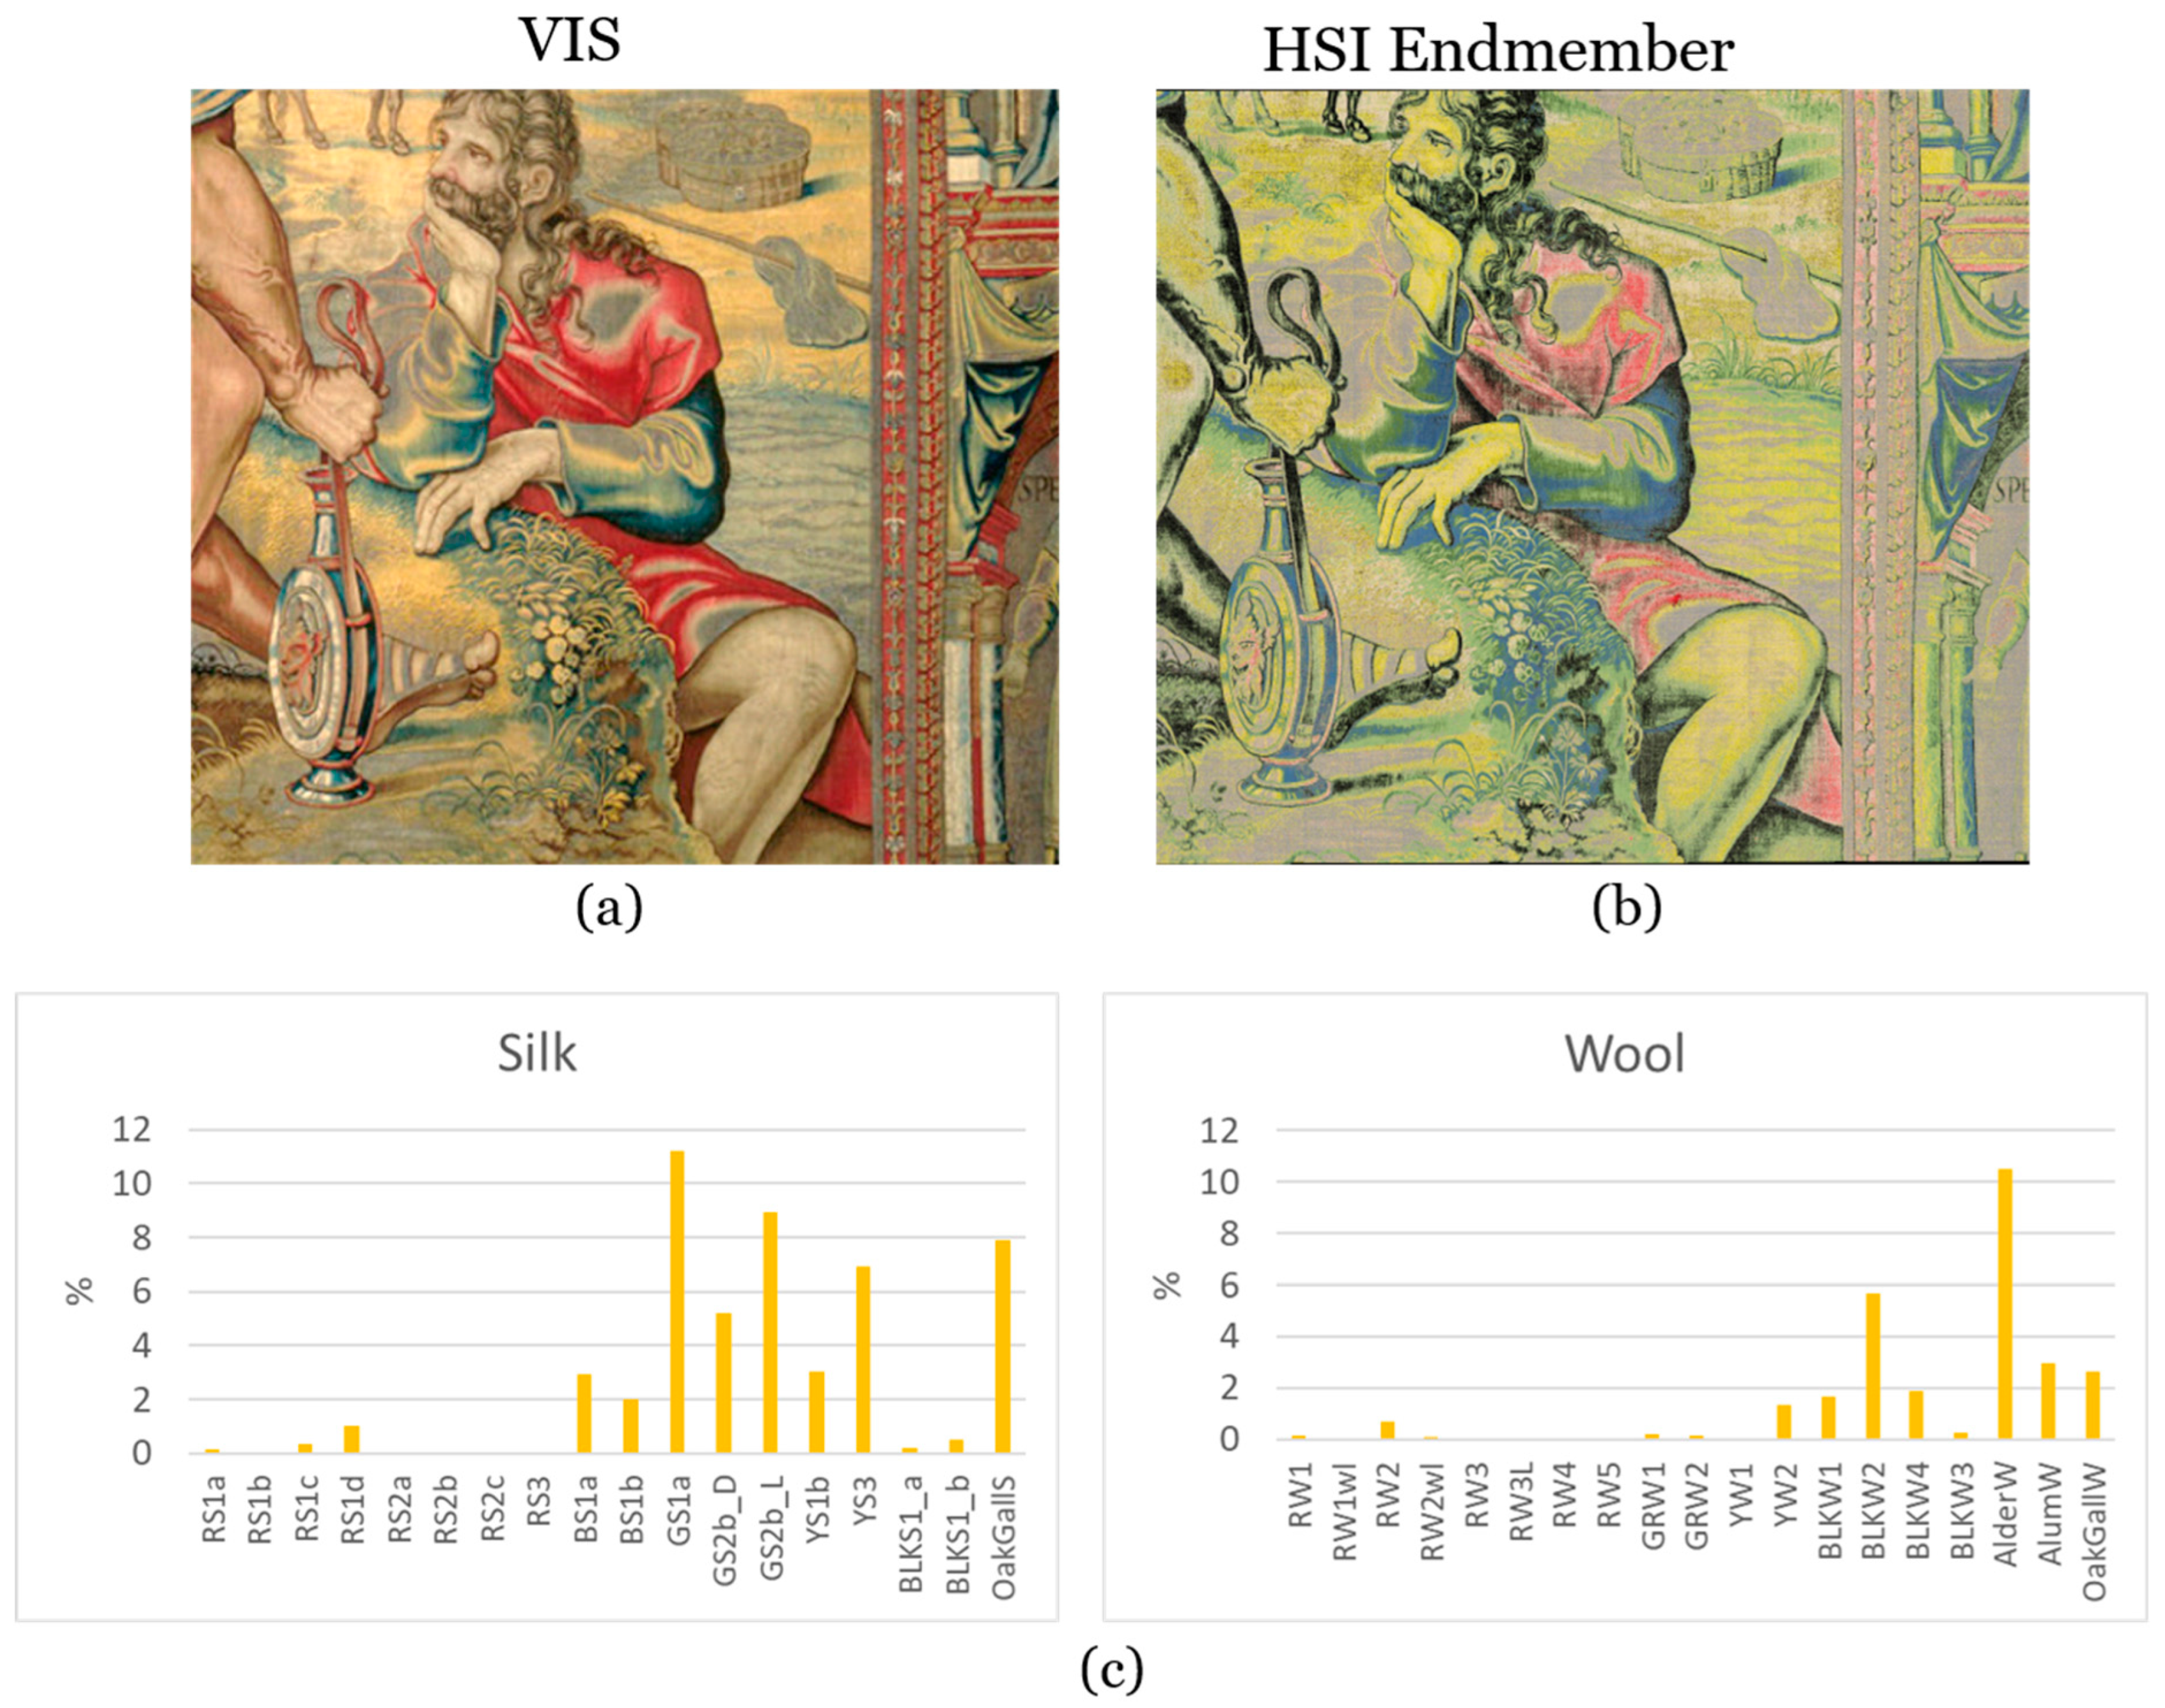
3.2.3. Sacrifice of Isaac
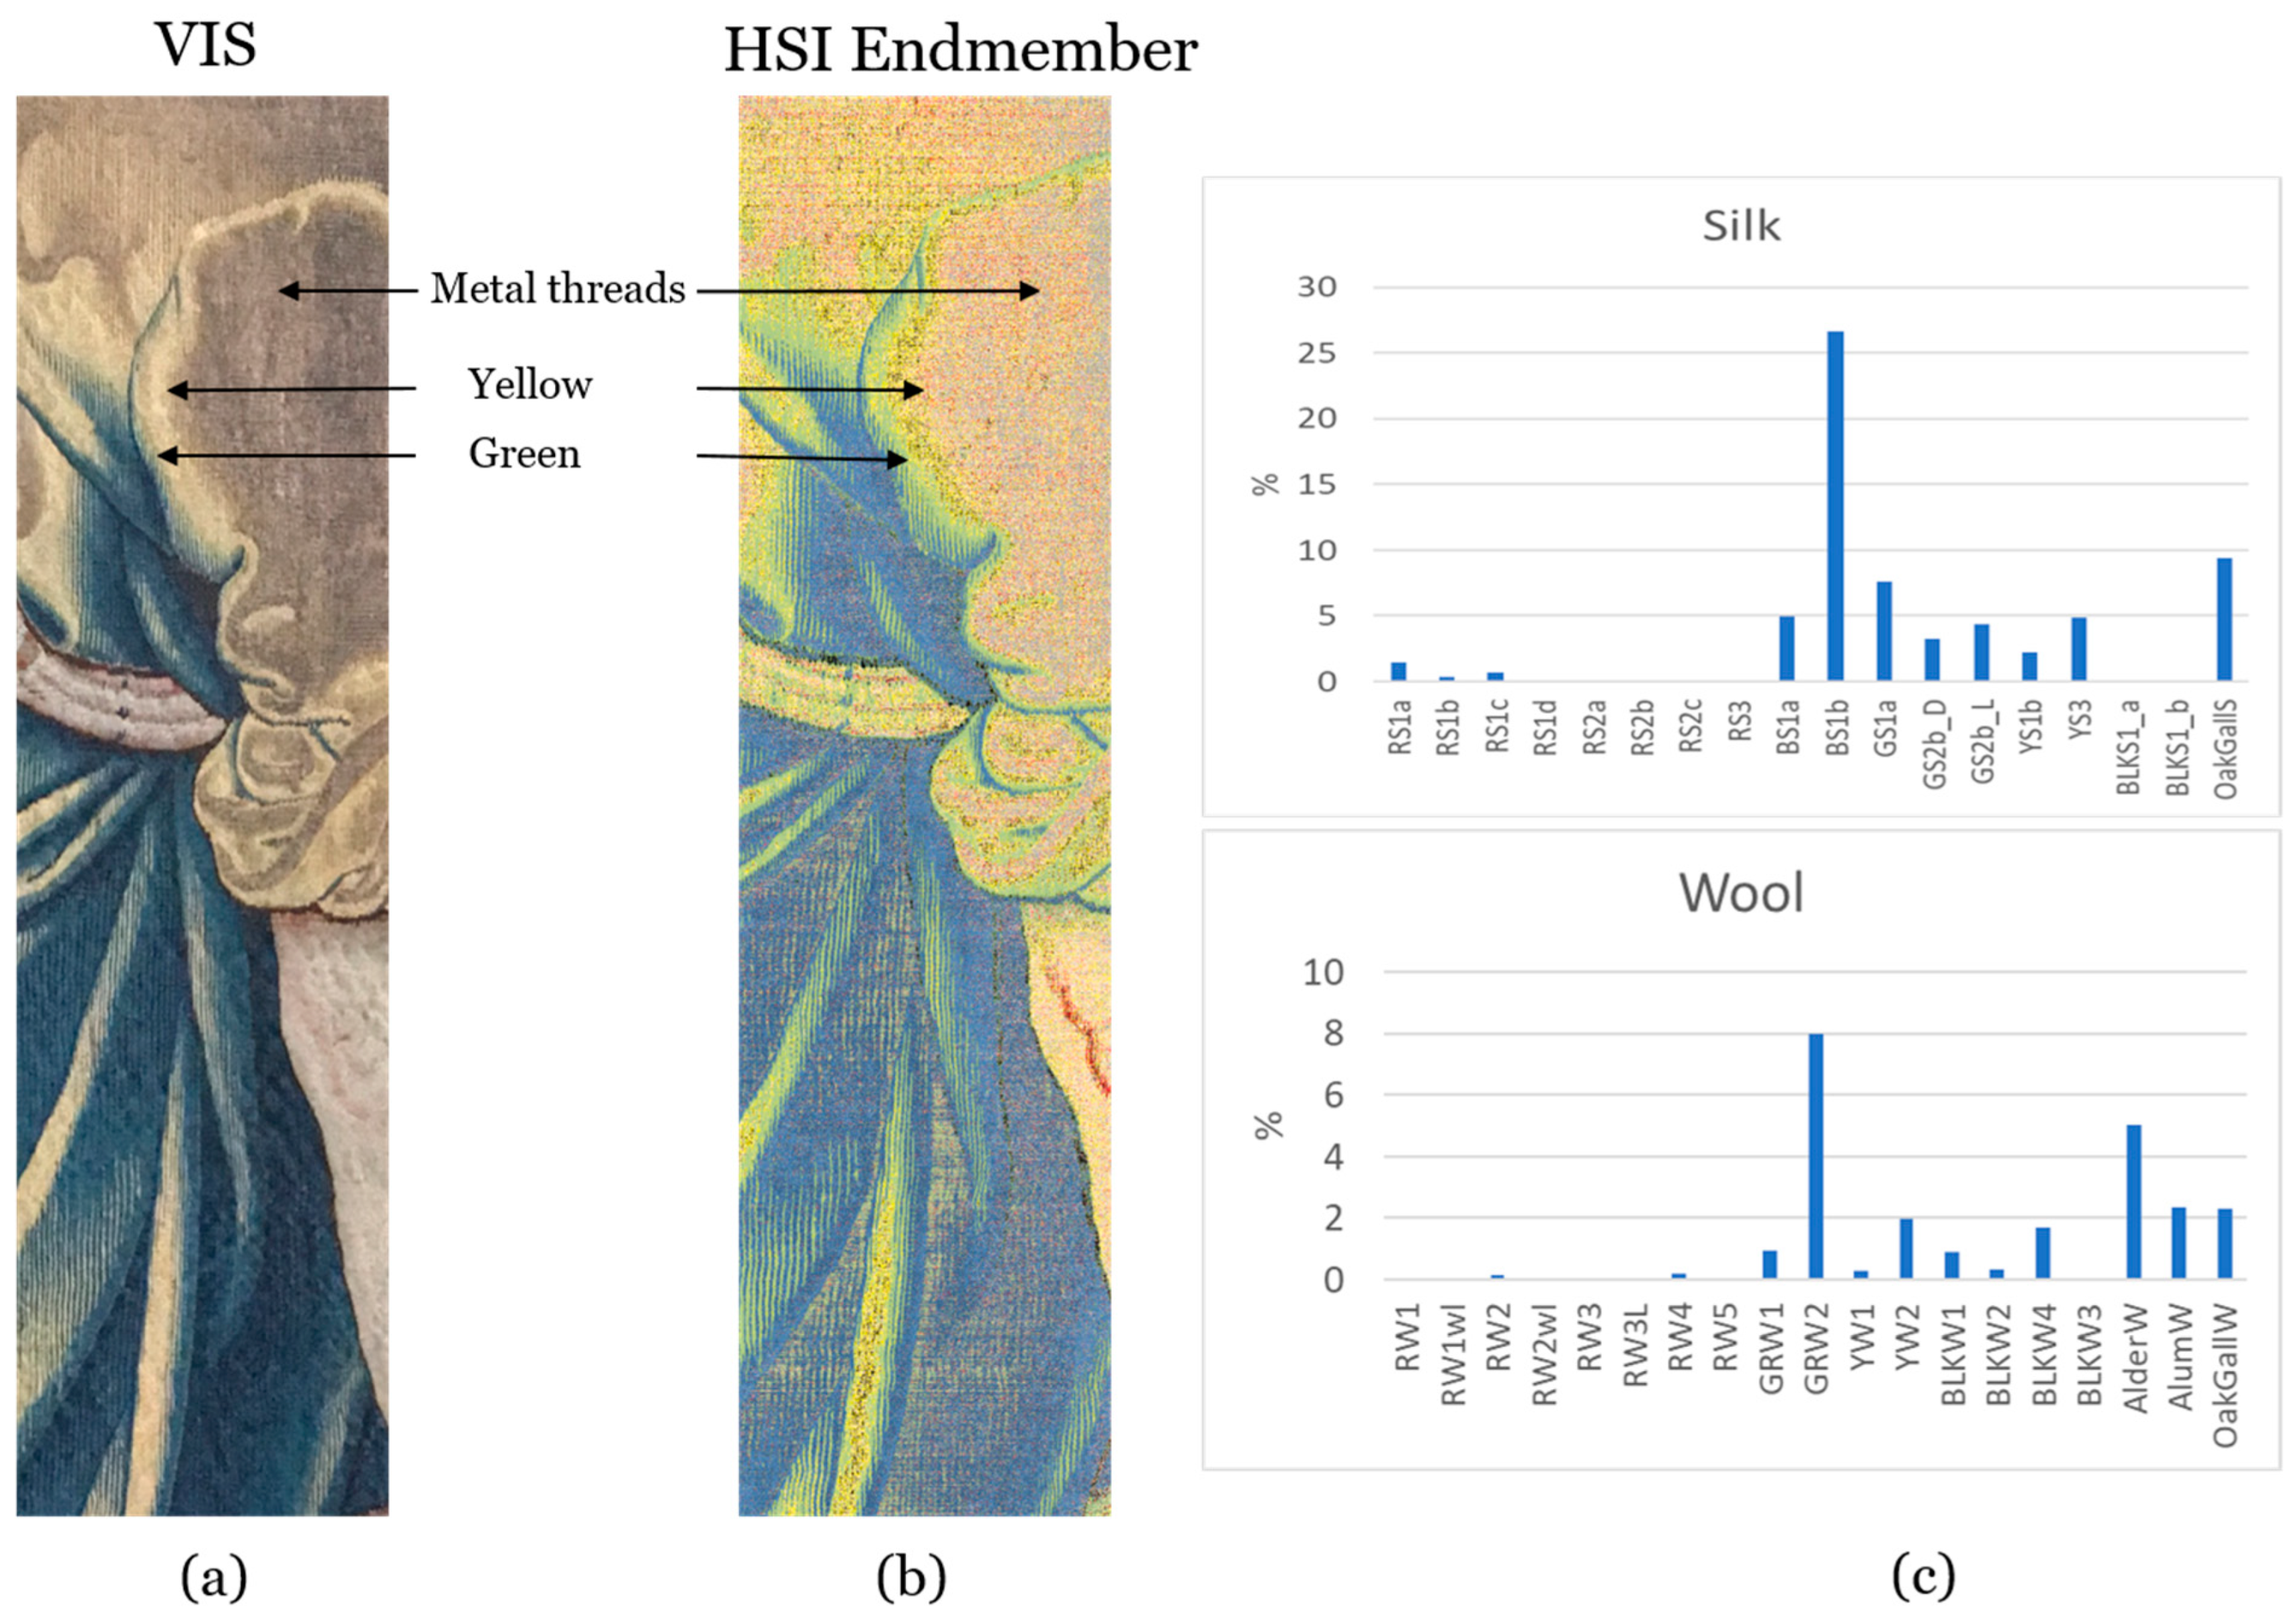
3.2.4. Eliezer and Rebekah at the Well
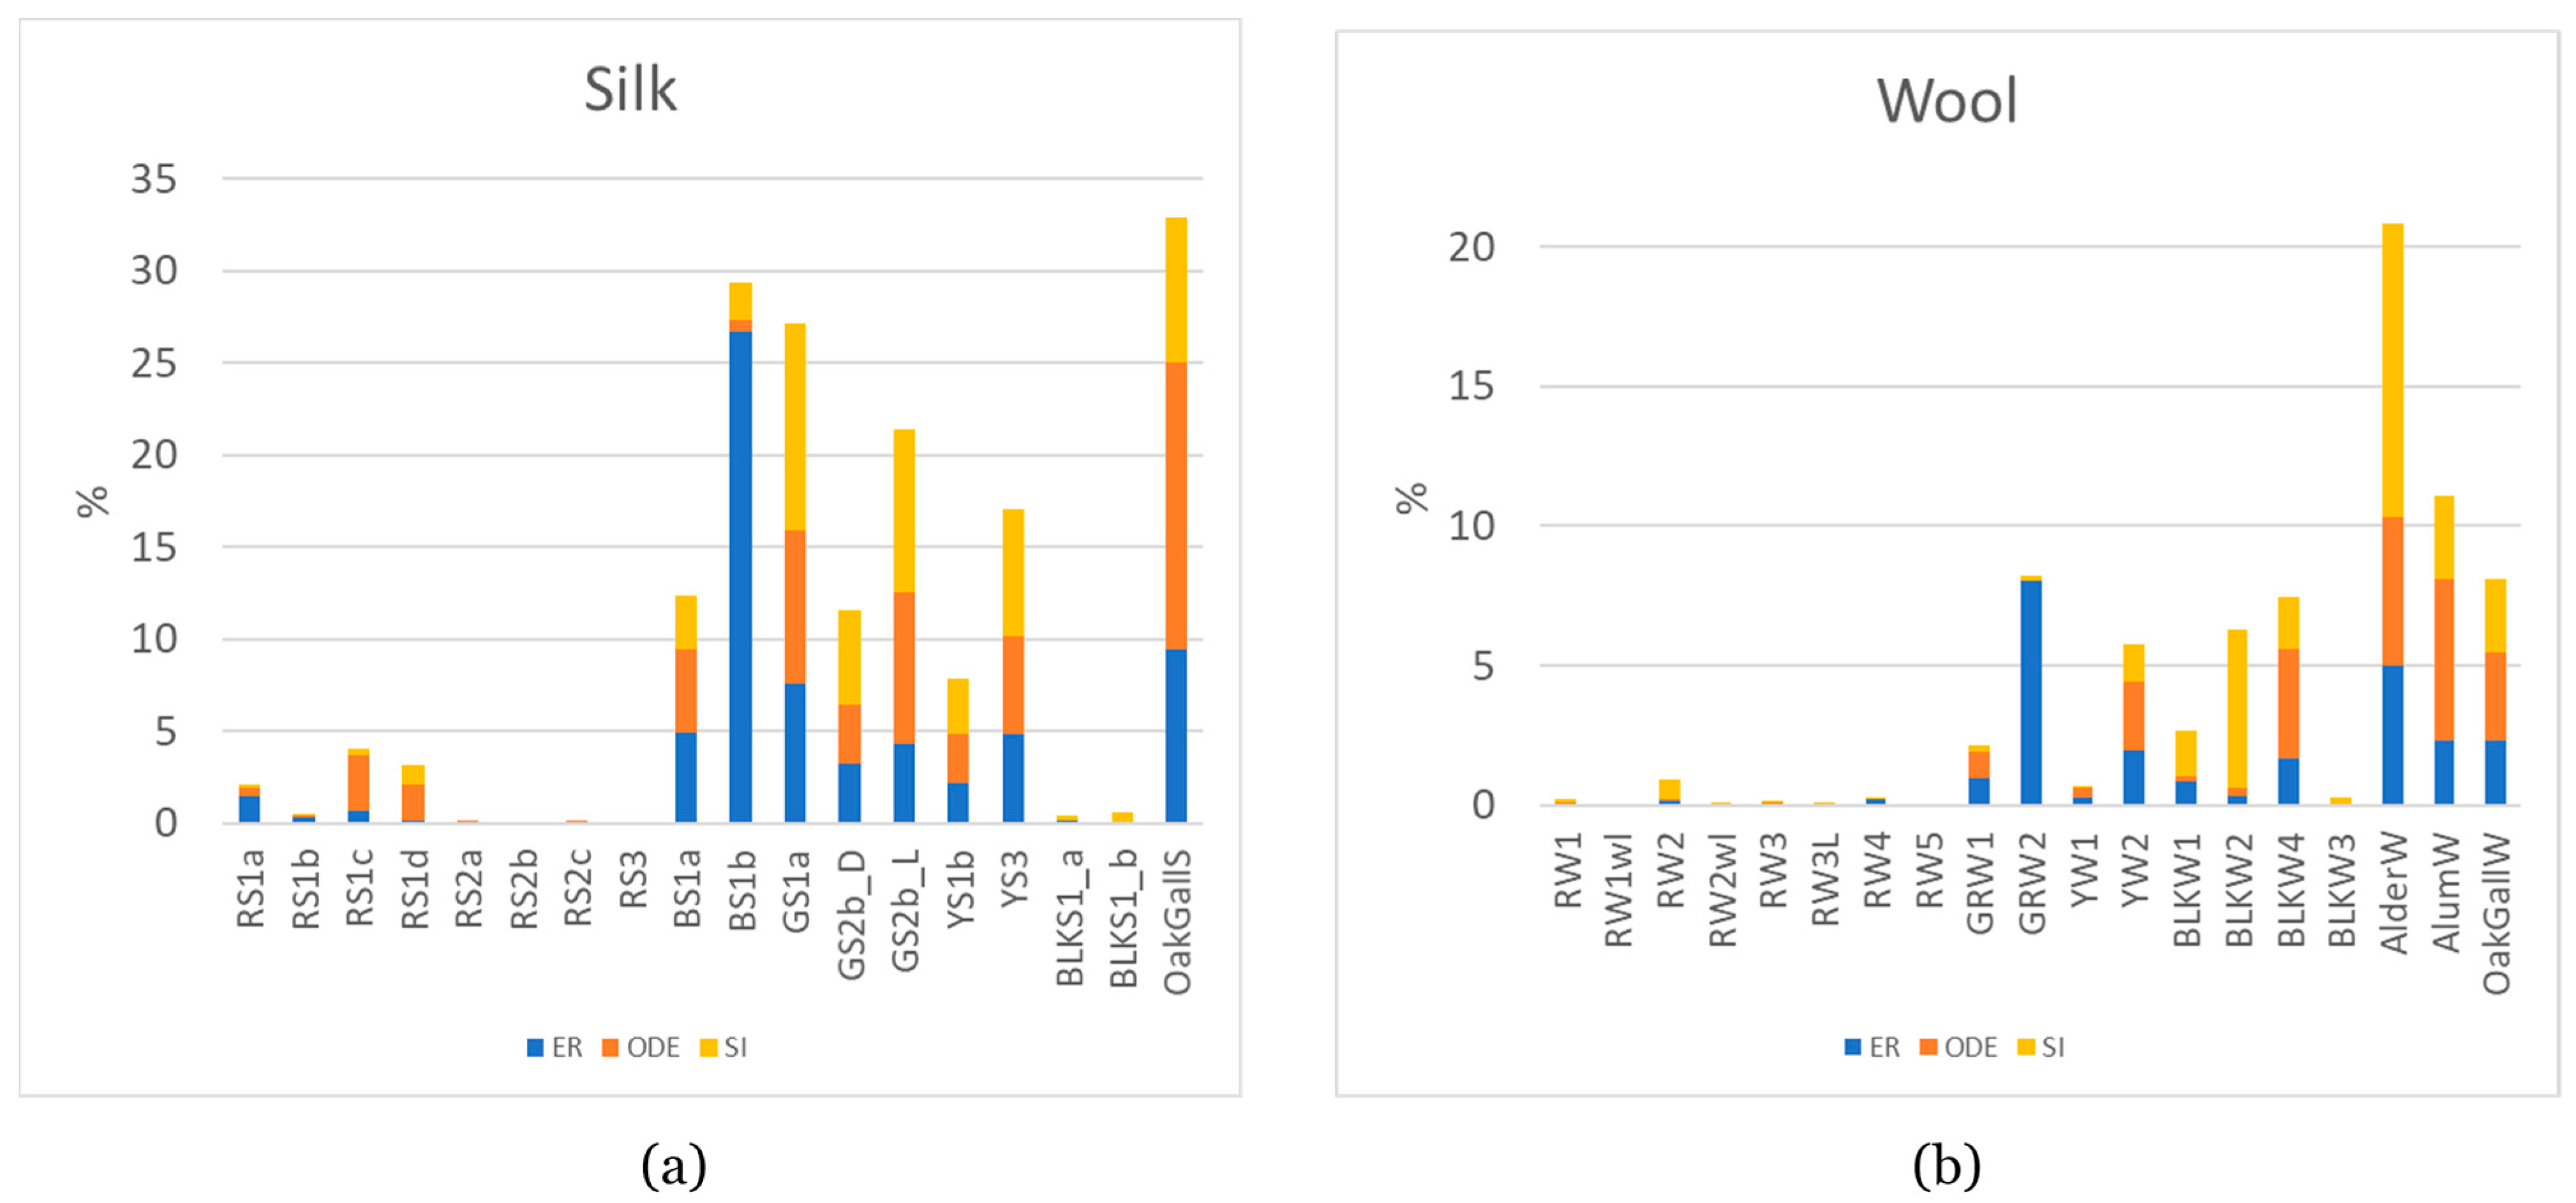
4. Discussion
5. Conclusions
Author Contributions
Funding
Data Availability Statement
Acknowledgments
Conflicts of Interest
Appendix A. End Member Library

| Weft Fiber | Abbreviation | Dyestuff | Mordant | Endmember | Image | HSI |
|---|---|---|---|---|---|---|
| Silk | RS1a | Brazil wood | Alum |  |  |  |
| Silk | RS1b | Brazil wood | Alum |  |  |  |
| Silk | RS1c | Brazil wood | Alum |  |  |  |
| Silk | RS1d | Brazil wood | Alum |  |  |  |
| Silk | RS2a | Madder | Alum |  |  |  |
| Silk | RS2b | Madder | Alum |  |  |  |
| Silk | RS2c | Madder | Alum |  |  |  |
| Silk | RS3 | Cochineal | Alum |  |  |  |
| Silk | GS1b | Woad/weld | Alum |  |  |  |
| Silk | GS2b_L | Weld/woad | Alum |  |  |  |
| Silk | GS2b_D | Weld/woad | Alum |  |  |  |
| Silk | YS1b | weld | Alum |  |  |  |
| Silk | YS3 | Greenweed | Alum |  |  |  |
| Silk | BS1_a | Woad | - |  |  |  |
| Silk | B1_b | Woad | - |  |  |  |
| Silk | Black S1a | FeSO4 | Oak g all |  |  |  |
| Silk | Black S1b | FeSO4 | Oak gall |  |  |  |
| Silk | CON S | - | - |  |  |  |
| Silk | Oak gall S | - | Oak gall |  |  |  |
| Wool | RW1_wl | Madder | Alum |  |  |  |
| Wool | RW1 | Madder | Alum |  |  |  |
| Wool | RW2 | Madder | Oak gall/alum |  |  |  |
| Wool | RW2_wl | Madder | Oak gall/alum |  |  |  |
| Wool | RW3 | Brazil wood | Alum |  |  |  |
| Wool | RW3L | Brazil wood | Alum |  |  |  |
| Wool | RW4 | Cochineal | alum |  |  |  |
| Wool | RW5 | Cochineal | alum |  |  |  |
| Wool | BLKW1 | FeSO4 | Oak gall |  |  |  |
| Wool | BLKW2 | FeSO4 | Oak gall |  |  |  |
| Wool | BLKW3 | FeSO4 | Alder bark |  |  |  |
| Wool | BLKW4 | FeSO4/CuSO4 | Oak gall |  |  |  |
| Wool | BW1 | Woad | - |  |  |  |
| Wool | GRW1 | Weld/woad | Alum |  |  |  |
| Wool | GRW2 | Woad/weld | Alum |  |  |  |
| Wool | Alder W | - | Alder bark |  |  |  |
| Wool | YW1 | Weld | Alum |  |  |  |
| Wool | YW2 | Greenweed | alum |  |  |  |
| Wool | Alum W | - | Alum |  |  |  |
| Wool | Oak gall W | - | Oak gall |  |  |  |
| Wool | Wool blank dyed with lye |  |  |  | ||
| Wool | CON W |  |  |  |
References
- The Story of Abraham Series 1540-43. Available online: https://www.rct.uk/collection/1046/the-story-of-abraham-series (accessed on 7 December 2022).
- Degano, I.; Ribechini, E.; Modugno, F.; Colombini, M.P. Analytical Methods for the Characterization of Organic Dyes in Artworks and in Historical Textiles. Appl. Spectrosc. Rev. 2009, 44, 363–410. [Google Scholar] [CrossRef]
- Rosenberg, E. Characterisation of historical organic dyestuffs by liquid chromatography—Mass spectrometry. Anal. Bioanal. Chem. 2008, 391, 33–57. [Google Scholar] [CrossRef] [PubMed]
- Peggie, D.A. Development and Application of Analytical Methods for the Identification of Dyes on Historical Textiles. Ph.D. Thesis, The University of Edinburgh, Edinburgh, UK, 2006. [Google Scholar]
- Bacci, M. UV-VIS-NIR, FT-IR and FORS Spectroscopies. In Modern Analytical Methods in Art and Archaeology, Chemical Analysis Series; Wiley: New York, NY, USA, 2000; Volume 155, pp. 321–361, Chapter 12. [Google Scholar]
- Tamburini, D.; Dyer, J. Fibre optic reflectance spectroscopy and multispectral imaging for the non-invasive investigation of Asian colourants in Chinese textiles from Dunhuang (7th–10th century AD). Dye. Pigment. 2019, 162, 494–511. [Google Scholar] [CrossRef]
- Tamburini, D.; Dyer, J.; Heady, T.; Derham, A.; Kim-Marandet, M.; Pullan, M.; Luk, Y.-P.; Ramos, I. Bordering on Asian Paintings: Dye Analysis of Textile Borders and Mount Elements to Complement Research on Asian Pictorial Art. Heritage 2021, 4, 4344–4365. [Google Scholar] [CrossRef]
- Dal Fovo, A.; Striova, J.; Pampaloni, E.; Fedele, A.; Morita, M.M.; Amaya, D.; Grazzi, F.; Cimò, M.; Cirrincione, C.; Fontana, R. Rubens’ painting as inspiration of a later tapestry: Non-invasive analyses provide insight into artworks’ history. Microchem. J. 2020, 153, 104472. [Google Scholar] [CrossRef]
- Doherty, B.; Degano, I.; Romani, A.; Higgitt, C.; Peggie, D.; Colombini, M.P.; Miliani, C. Identifying Brazilwood’s Marker Component, Urolithin C, in Historical Textiles by Surface-Enhanced Raman Spectroscopy. Heritage 2021, 4, 1415–1428. [Google Scholar] [CrossRef]
- Pozzi, F.; Poldi, G.; Bruni, S.; De Luca, E.; Guglielmi, V. Multi-technique characterization of dyes in ancient Kaitag textiles from Caucasus. Archaeol. Anthropol. Sci. 2012, 4, 185–197. [Google Scholar] [CrossRef]
- Festa, G.; Christiansen, T.; Turina, V.; Borla, M.; Kelleher, J.; Arcidiacono, L.; Cartechini, L.; Ponterio, R.C.; Scatigno, C.; Senesi, R.; et al. Egyptian metallic inks on textiles from the 15th century BCE unravelled by non-invasive techniques and chemometric analysis. Sci. Rep. 2019, 9, 7310. [Google Scholar] [CrossRef]
- Verhoeven, G. Multispectral and Hyperspectral Imaging. In The Encyclopedia of Archaeological Sciences; John Wiley & Sons: New York, NY, USA, 2018; pp. 1–4. [Google Scholar]
- Liang, H. Advances in multispectral and hyperspectral imaging for archaeology and art conservation. Appl. Phys. A 2012, 106, 309–323. [Google Scholar] [CrossRef]
- Picollo, M.; Cucci, C.; Casini, A.; Stefani, L. Hyper-Spectral Imaging Technique in the Cultural Heritage Field: New Possible Scenarios. Sensors 2020, 20, 2843. [Google Scholar] [CrossRef]
- Cucci, C.; Delaney, J.K.; Picollo, M. Reflectance Hyperspectral Imaging for Investigation of Works of Art: Old Master Paintings and Illuminated Manuscripts. Acc. Chem. Res. 2016, 49, 2070–2079. [Google Scholar] [CrossRef]
- Cucci, C.; Webb, E.K.; Casini, A.; Ginanni, M.; Prandi, E.; Stefani, L.; Vitorino, T.; Picollo, M. Short-wave infrared reflectance hyperspectral imaging for painting investigations: A methodological study. J. Am. Inst. Conserv. 2019, 58, 16–36. [Google Scholar] [CrossRef]
- Delaney, J.K.; Zeibel, J.G.; Thoury, M.; Littleton, R.; Palmer, M.; Morales, K.M.; de la Rie, E.R.; Hoenigswald, A. Visible and Infrared Imaging Spectroscopy of Picasso’s Harlequin Musician: Mapping and Identification of Artist Materials in Situ. Appl. Spectrosc. 2010, 64, 584–594. [Google Scholar] [CrossRef] [PubMed]
- Ricciardi, P.; Delaney, J.K.; Glinsman, L.D.; Thoury, M.; Facini, M.; de la Rie, E.R. Use of visible and infrared reflectance and luminescence imaging spectroscopy to study illuminated manuscripts: Pigment identification and visualization of underdrawings. Opt. Metrol. 2009, 7391, 739106-5. [Google Scholar]
- Mounier, A.; Le Bourdon, G.; Aupetit, C.; Belin, C.; Servant, L.; Lazare, S.; Lefrais, Y.; Daniel, F. Hyperspectral imaging, spectrofluorimetry, FORS and XRF for the non-invasive study of medieval miniatures materials. Herit. Sci. 2014, 2, 24. [Google Scholar] [CrossRef]
- Dill, O.; Vermeulen, M.; McGeachy, A.; Walton, M. Multi-Modal, Non-Invasive Investigation of Modern Colorants on Three Early Modern Prints by Maria Sibylla Merian. Heritage 2021, 4, 1590–1604. [Google Scholar] [CrossRef]
- Retko, K.; Kavčič, M.; Legan, L.; Ropret, P.; Škafar, B.R.; Gao, Y.; Gilchrist, J.; Strlič, M.; Cigić, I.K. Material characterisation of a painted beehive panel by advanced spectroscopic and chromatographic techniques in combination with hyperspectral imaging. Herit. Sci. 2020, 8, 120. [Google Scholar] [CrossRef]
- Sandak, J.; Sandak, A.; Legan, L.; Retko, K.; Kavčič, M.; Kosel, J.; Poohphajai, F.; Diaz, R.H.; Ponnuchamy, V.; Sajinčič, N.; et al. Nondestructive Evaluation of Heritage Object Coatings with Four Hyperspectral Imaging Systems. Coatings 2021, 11, 244. [Google Scholar] [CrossRef]
- Sun, M.; Zhang, D.; Wang, Z.; Ren, J.; Chai, B.; Sun, J. What’s Wrong with the Murals at the Mogao Grottoes: A Near-Infrared Hyperspectral Imaging Method. Sci. Rep. 2015, 5, 14371. [Google Scholar] [CrossRef]
- Sciuto, C.; Cantini, F.; Chapoulie, R.; Cou, C.; De la Codre, H.; Gattiglia, G.; Granier, X.; Mounier, A.; Palleschi, V.; Sorrentino, G.; et al. What Lies Beyond Sight? Applications of Ultraportable Hyperspectral Imaging (VIS-NIR) for Archaeological Fieldwork. J. Field Archaeol. 2022, 47, 522–535. [Google Scholar] [CrossRef]
- De Viguerie, L.; Pladevall, N.O.; Lotz, H.; Freni, V.; Fauquet, N.; Mestre, M.; Walter, P.; Verdaguer, M. Mapping pigments and binders in 15th century Gothic works of art using a combination of visible and near infrared hyperspectral imaging. Microchem. J. 2020, 155, 104674. [Google Scholar] [CrossRef]
- Delaney, J.K.; Conover, D.M.; Dooley, K.A.; Glinsman, L.; Janssens, K.; Loew, M. Integrated X-ray fluorescence and diffuse visible-to-near-infrared reflectance scanner for standoff elemental and molecular spectroscopic imaging of paints and works on paper. Herit. Sci. 2018, 6, 31. [Google Scholar] [CrossRef]
- Grabowski, B.; Masarczyk, W.; Głomb, P.; Mendys, A. Automatic pigment identification from hyperspectral data. J. Cult. Herit. 2018, 31, 1–12. [Google Scholar] [CrossRef]
- Grillini, F.; Thomas, J.-B.; George, S. Comparison of Imaging Models for Spectral Unmixing in Oil Painting. Sensors 2021, 21, 2471. [Google Scholar] [CrossRef] [PubMed]
- Kleynhans, T.; Messinger, D.W.; Delaney, J.K. Towards automatic classification of diffuse reflectance image cubes from paintings collected with hyperspectral cameras. Microchem. J. 2020, 157, 104934. [Google Scholar] [CrossRef]
- Kogou, S.; Shahtahmassebi, G.; Lucian, A.; Liang, H.; Shui, B.; Zhang, W.; Su, B.; van Schaik, S. From remote sensing and machine learning to the history of the Silk Road: Large scale material identification on wall paintings. Sci. Rep. 2020, 10, 19312. [Google Scholar] [CrossRef]
- Vitorino, T.; Casini, A.; Cucci, C.; Melo, M.J.; Picollo, M.; Stefani, L. Non-invasive identification of traditional red lake pigments in fourteenth to sixteenth centuries paintings through the use of hyperspectral imaging technique. Appl. Phys. A 2015, 121, 891–901. [Google Scholar] [CrossRef]
- Polak, A.; Kelman, T.; Murray, P.; Marshall, S.; Stothard, D.J.M.; Eastaugh, N.; Eastaugh, F. Hyperspectral imaging combined with data classification techniques as an aid for artwork authentication. J. Cult. Herit. 2017, 26, 1–11. [Google Scholar] [CrossRef]
- Webb, E.K.; Summerour, R.; Giaccai, J. A case study using multiband & hyperspectral imaging for the identification & characterization of materials on archaeological Andean painted textiles. In Textile Group Postprints; American Institute for Conservation of Historic and Artistic Works: Washington, DC, USA, 2014. [Google Scholar]
- Zhao, H.; Wang, Y.; Liu, S.; Li, K.; Gao, W. Spectral reflectance characterization and fiber type discrimination for common natural textile materials using a portable spectroradiometer. J. Archaeol. Sci. 2019, 111, 105026. [Google Scholar] [CrossRef]
- Peruzzi, G.; Cucci, C.; Picollo, M.; Quercioli, F.; Stefani, L. Non-invasive identification of dyed textiles by using VIS-NIR FORS and hyperspectral imaging techniques. Cult. Sci. Color.-Color Cult. Sci. 2021, 13, 61–69. [Google Scholar]
- Vermeulen, M.; Tamburini, D.; McGeachy, A.C.; Meyers, R.D.; Walton, M.S. Multiscale characterization of shellfish purple and other organic colorants in 20th-century traditional enredos from Oaxaca, Mexico. Dye. Pigment. 2022, 206, 110663. [Google Scholar] [CrossRef]
- Delaney, J.K.; Ricciardi, P.; Glinsman, L.; Palmer, M.; Burke, J. Use of near infrared reflectance imaging spectroscopy to map wool and silk fibres in historic tapestries. Anal. Methods 2016, 8, 7886–7890. [Google Scholar] [CrossRef]
- De La Codre, H.; Daniel, F.; Chapoulie, R.; Servant, L.; Mounier, A. Investigating the materials used in eighteenth-century tapestries from the three French Royal Manufactories: Inputs of hyperspectral approaches. Eur. Phys. J. Plus 2021, 136, 1193. [Google Scholar] [CrossRef]
- De La Codre, H.; Marembert, C.; Claisse, P.; Daniel, F.; Chapoulie, R.; Servant, L.; Mounier, A. Non-invasive characterization of yellow dyes in tapestries of the 18th century: Influence of composition on degradation. Color Res. Appl. 2021, 46, 613–622. [Google Scholar] [CrossRef]
- Quye, A.; Hallett, K.; Carretero, H. Wrought in gold and silk. In Preserving the Art of Historic Tapestries; National Museums Scotland Enterprises Limited.: Edinburgh, UK, 2009. [Google Scholar]
- Campbell, T.P. Henry VIII and the Art of Majesty:Tapestries at the Tudor Court; Yale University Press: Newhaven, Victoria, 2007. [Google Scholar]
- Perkins, R.; Owen, H.; Carr, C.; Hallett, K.; Gibb, I.; Frame, K. Henry VIII’s tapestries revealed. In Proceedings of the ICOM Committee for Conservation, ICOM-CC: 16th Triennial Meeting, ICOM Committee for Conservation, Lisbon, Portugal, 19–23 September 2011; Critério Artes Gráficas: Sao Paolo, Brazil, 2011. [Google Scholar]
- Hacke, A.M. Investigation into the Nature and Ageing of Tapestry Materials. Ph.D. Thesis, University of Manchester, Manchester, UK, 2006. [Google Scholar]
- Peggie, D.A.; Kirby, J.; Poulin, J.; Genuit, W.; Romanuka, J.; Wills, D.F.; De Simone, A.; Hulme, A.N. Historical mystery solved: A multi-analytical approach to the identification of a key marker for the historical use of brazilwood (Caesalpinia spp.) in paintings and textiles. Anal. Methods 2018, 10, 617–623. [Google Scholar] [CrossRef]


| Tapestry Name | Inventory Number | Area of Analysis | |
|---|---|---|---|
| Height (cm) | Width (cm) | ||
| Oath and Departure of Eliezer | 1046.8 | 133 | 63 |
| Sacrifice of Isaac | 1046.9 | 133 | 146 |
| Eliezer and Rebekah at the Well | 1046.5 | 63 | 17 |
| Weft Fibre | Name | Code | Dyestuff | Mordant |
|---|---|---|---|---|
| Silk | Red/Brazilwood | RS1a | Brazil wood | Alum |
| Silk | Red/Brazilwood | RS1b | Brazil wood | Alum |
| Silk | Red (pink)/Brazilwood with lye | RS1c | Brazil wood | Alum |
| Silk | Red (dark pink)/Brazilwood with lye | RS1d | Brazil wood | Alum |
| Silk | Red/S2a, Madder | RS2a | Madder | Alum |
| Silk | Red/S2b, Madder with lye | RS2b | Madder | Alum |
| Silk | Red/S2c, Madder with lye | RS2c | Madder | Alum |
| Silk | Red/Cochineal | RS3 | Cochineal | Alum |
| Silk | Blue light/Woad | BS1a | Woad | - |
| Silk | Blue dark/Woad | BS1b | Woad | - |
| Silk | Green/Woad-Weld | GS1b | Woad/weld | Alum |
| Silk | Green light/Weld-Woad | GS2b_L | Weld/woad | Alum |
| Silk | Green dark/Weld-Woad | GS2b | Weld/woad | Alum |
| Silk | Yellow/Weld | YS1b | weld | Alum |
| Silk | Yellow/Greenweed | YS3 | Greenweed | Alum |
| Silk | Black/FeSO4 | BlkS1_a | FeSO4 | Oak gall |
| Silk | Black/FeSO4 | BlkS1_b | FeSO4 | Oak gall |
| Silk | undyed | CON S | - | - |
| Silk | Alum | Alum S | - | Alum |
| Silk | Oak gall | Oak gall S | - | Oak gall |
| Wool | undyed | CON W | - | - |
| Wool | Red/Madder | RW1 | Madder | Alum |
| Wool | Red/Madder with lye | RW1_wl | Madder | Alum |
| Wool | Red/Madder | RW2 | Madder | Oak gall/Alum |
| Wool | Red/Madder with lye | RW2_wl | Madder | Oak gall/Alum |
| Wool | Red/W3, Brazilwood | RW3 | Brazil wood | Alum |
| Wool | Red/Brazilwood with lye | RW3_wL | Brazil wood | Alum |
| Wool | Red/Cochineal | RW4 | Cochineal | Alum |
| Wool | Red/Cochineal | RW5 | Cochineal | Alum |
| Wool | Blue/Woad | BW1 | Woad | - |
| Wool | Green/Weld-Woad | GRW1 | Weld/woad | Alum |
| Wool | Green/Woad-Weld | GRW2 | Woad/weld | Alum |
| Wool | Yellow/Weld | YW1 | Weld | Alum |
| Wool | Yellow/Greenweed | YW2 | Greenweed | Alum |
| Wool | Black/FeSO4 | BLKW1 | FeSO4 | Oak gall |
| Wool | Black/FeSO4 | BLKW2 | FeSO4 | Oak gall |
| Wool | Black/FeSO4 | BLKW3 | FeSO4 | Alder bark |
| Wool | Black/W4, Cu+FeSO4 | BLKW4 | FeSO4/CuSO4 | Oak gall |
| Wool | Undyed | CON W | - | - |
| Wool | Alder bark tannin | Alder W | - | Alder bark |
| Wool | Alum mordant | Alum W | - | Alum |
| Wool | Oak Gall mordant | Oak gall W | - | Oak gall |
| Tapestry | Number of Strips | Size of One Strip (Pixels) | Size of Composite Image (Pixels) |
|---|---|---|---|
| Oath and Departure of Eliezer | 7 | VNIR; 640 × 4552 NIR; 320 × 3400 | VNIR; 2797 × 4552 NIR; 1971 × 3400 |
| Sacrifice of Isaac | 17 | VNIR; 640 × 4690 | VNIR; 6484 × 4690 |
| Eliezer and Rebekah at the Well | 1 | VNIR; 640 × 2411 |
| Parameter | VNIR | NIR |
|---|---|---|
| Spatial Resolution (mm) | 0.25 | 0.25 |
| Spectral range (n) | 400–1000 | 900–1700 |
| Lens focal length (mm) | 50 | 50 |
| Aperture (f/#) | 2.5 | 2.5 |
| Working distance (mm) | 700 | 700 |
| Scan speed (mm s−1) | 25 mm/s | 25 mm/s |
| Acquisition time (s/line strip) | 15 | 15 |
| Frame rate (fps) | 88.40 | 88.40 |
| Number of bands | 306 | 240 |
| Weft Fibre | Name | Code | Dyestuff | Mordant |
|---|---|---|---|---|
| Silk | Red/Brazilwood | RS1a | Brazil wood | Alum |
| Silk | Red/Brazilwood | RS1b | Brazil wood | Alum |
| Silk | Red (pink)/Brazilwood with lye | RS1c | Brazil wood | Alum |
| Silk | Red (dark pink)/Brazilwood with lye | RS1d | Brazil wood | Alum |
| Silk | Blue light/woad | BS1a | Woad | - |
| Silk | Blue dark/woad | BS1b | Woad | - |
| Silk | Green/woad-weld | GS1a | Woad-weld | Alum |
| Silk | Green light/Weld-woad | GS2b_L | Weld-woad | Alum |
| Silk | Green dark/Weld-woad | GS2b_D | Weld-woad | Alum |
| Silk | Yellow/weld | YS1b | Weld | Alum |
| Silk | Yellow/Greenweed | YS3 | Greenweed | Alum |
| Silk | Black/FeSO4 | BlkS1_a | FeSO4 | Oak gall |
| Silk | Black/FeSO4 | BlkS1_b | FeSO4 | Oak gall |
| Silk | Oak gall | Oak gall S | - | Oak gall |
| Wool | Red/Madder | RW1 | Madder | Alum |
| Wool | Red/Madder | RW2 | Madder | Oak gall/Alum |
| Wool | Red/Cochineal | RW4 | Cochineal | Alum |
| Wool | Green/weld-woad | GRW1 | Weld/woad | Alum |
| Wool | Green/woad-weld | GRW2 | Woad/weld | Alum |
| Wool | Yellow/Weld | YW1 | Weld | Alum |
| Wool | Yellow/Greenweed | YW2 | Greenweed | alum |
| Wool | Black/FeSO4 | BLKW1 | FeSO4 | Oak gall |
| Wool | Black/FeSO4 | BLKW2 | FeSO4 | Oak gall |
| Wool | Black/FeSO4 | BLKW3 | FeSO4 | Alder bark |
| Wool | Black/W4, Cu+FeSO4 | BLKW4 | FeSO4/CuSO4 | Oak gall |
| Wool | Alder bark tannin | Alder W | - | Alder bark |
| Wool | Alum mordant | Alum W | - | Alum |
| Wool | Oak Gall mordant | Oak gall W | - | Oak gall |
Disclaimer/Publisher’s Note: The statements, opinions and data contained in all publications are solely those of the individual author(s) and contributor(s) and not of MDPI and/or the editor(s). MDPI and/or the editor(s) disclaim responsibility for any injury to people or property resulting from any ideas, methods, instructions or products referred to in the content. |
© 2023 by the authors. Licensee MDPI, Basel, Switzerland. This article is an open access article distributed under the terms and conditions of the Creative Commons Attribution (CC BY) license (https://creativecommons.org/licenses/by/4.0/).
Share and Cite
Vlachou-Mogire, C.; Danskin, J.; Gilchrist, J.R.; Hallett, K. Mapping Materials and Dyes on Historic Tapestries Using Hyperspectral Imaging. Heritage 2023, 6, 3159-3182. https://doi.org/10.3390/heritage6030168
Vlachou-Mogire C, Danskin J, Gilchrist JR, Hallett K. Mapping Materials and Dyes on Historic Tapestries Using Hyperspectral Imaging. Heritage. 2023; 6(3):3159-3182. https://doi.org/10.3390/heritage6030168
Chicago/Turabian StyleVlachou-Mogire, Constantina, Jon Danskin, John R. Gilchrist, and Kathryn Hallett. 2023. "Mapping Materials and Dyes on Historic Tapestries Using Hyperspectral Imaging" Heritage 6, no. 3: 3159-3182. https://doi.org/10.3390/heritage6030168
APA StyleVlachou-Mogire, C., Danskin, J., Gilchrist, J. R., & Hallett, K. (2023). Mapping Materials and Dyes on Historic Tapestries Using Hyperspectral Imaging. Heritage, 6(3), 3159-3182. https://doi.org/10.3390/heritage6030168