Article

The Impact of Temperature, Humidity, and Precipitation on COVID-19 Cases: A Study Across National and Subnational Levels in Pakistan

1
Department of Global Health Research, Graduate School of Medicine, Juntendo University, 2-1-1 Hongo, Bunkyo-ku, Tokyo 113-8421, Japan
2
Department of Civil Engineering, Mirpur University of Science and Technology (MUST), Mirpur 10250, Pakistan
3
Department of Civil Engineering, The University of Tokyo, 7-3-1 Hongo, Bunkyo-ku, Tokyo 113-8656, Japan
4
Department of Health and Medical Sciences, The University of Azad Jammu and Kashmir, Muzaffarabad 13100, Pakistan
5
Health Services Academy, Islamabad 44000, Pakistan
6
Central Campus, International Higher School of Medicine, Bishkek 720054, Kyrgyzstan
7
Faculty of Science and Technology, University of Central Punjab, Lahore 54000, Pakistan
*
Author to whom correspondence should be addressed.
Submission received: 11 April 2025 / Revised: 16 May 2025 / Accepted: 11 June 2025 / Published: 23 June 2025

Abstract

Meteorological variables play a significant role in the transmission of viruses such as influenza and the coronavirus pandemic (COVID-19). Previous studies have identified the relationship between changes in meteorological variables, humidity, rainfall, and temperature, and the infection rate of COVID-19 at the national level in Pakistan. However, the current study applied the logistic regression analysis technique to determine such a relationship on a more detailed scale, that is, subnational levels in addition to the national level in Pakistan, using a long-term analysis of two years of COVID-19 data. At the subnational level, the logistic regression analysis technique was applied, with infection rate as the predictive variable. The results showed an increase in the infection rate of COVID-19 with increasing humidity levels. In contrast, an increase in temperature has slowed the spread of COVID-19 cases at both the national and subnational levels. The minimum temperature was statistically significant (p < 0.001) for provinces, KPK and Sindh. Also, two federal territories, AJK and Islamabad, showed statistically significant p-values. At the national level, both maximum temperature and humidity showed such values that is, p < 0.001. We believe that this is the first study conducted in Pakistan to explore the direct and indirect relationship between variables such as temperature (min and max), humidity, and rainfall as predictive parameters for COVID-19 infection rates at a detailed level. The pattern observed in this study can help us predict the future spread of COVID-19, subject to climatic parameters in Pakistan at both the national and subnational levels.

1. Introduction

Almost every country in the world struggled with the COVID-19 pandemic. It has been more than two years since COVID-19 was identified in China, and no one knows when it will end. The tropics and subtropics, as well as arid and semi-arid regions, are severely affected by widespread COVID-19 [1,2,3]. On 30 January 2020, the World Health Organization (WHO) declared the disease outbreak a Public Health Emergency of International Concern and later a pandemic on 11 March. Remedial measures, such as social distancing, followed by lockdowns, were imposed as a strategy to control the spread of the pandemic [4].
The role of meteorological and environmental factors in the transmission of COVID-19 could be limited but they should not be ignored. When an infected person breathes out, droplets and small particles carrying viruses are transmitted to other people. Being a type of virus, severe acute respiratory syndrome coronavirus 2 (SARS-Cov-2) is highly likely to be transmitted through airborne transmission via the eyes, nose, mouth, etc. Beyond person-to-person transmission through direct and indirect contact, studies have shown that meteorological and environmental factors play crucial roles in the transmission and prevention of COVID-19. For example, temperature fluctuations can affect transmission rates by altering the stability of the virus on various surfaces [5]. Symptoms of coronavirus infection resemble those of the flu, and transmission is less likely in hot and humid conditions [6]. Given the similar patterns observed in SARS-Cov-1 infections, health experts speculated that increasing summer temperatures would reduce the spread of COVID-19. Investigations from [7] found a positive correlation between COVID-19 cases and average temperature ranges, while a negative correlation between humidity and rainfall was observed. Furthermore, Ref. [8] identified rainfall (precipitation) as a crucial factor that affects the spread of COVID-19. Therefore, it is vital to investigate the possible impact of changes in meteorological factors on COVID-19 infection rates.
Pakistan is ranked as the fifth most populous country in the world and has a semi-arid and tropical monsoon climate [8,9,10]. By 20 February 2022, the COVID-19 pandemic, which started in late December 2019, reached its fifth peak, with 1.52 million confirmed cases and 30,331 deaths in Pakistan by 21 March 2022 https://www.nhsrc.gov.pk/. Initial epidemiological research has indicated that weather influences the rate of SARS-Cov-2 infections. There is a complex relationship between meteorological variables and mortality, which implies a higher level of COVID-19 exposure. However, previous studies on the association between various meteorological parameters and local-level mortality rates from COVID-19 in Pakistan are scarce [11]. The association between meteorological factors and mortality from COVID-19 has been investigated; however, these studies are geographically limited, mainly focusing on a few cities [7,12]. Therefore, the meteorological data and COVID-19 data were only from a few cities, without accounting for detailed information. Furthermore, the authors mainly used simple approaches, such as descriptive statistics and correlation coefficients [13,14]. However, these simple approaches do not account for heterogeneity in the datasets, which may raise questions about the robustness of the findings [15]. Additionally, most of these studies performed analyses at the national level [15] without accounting for subnational-level variations.
The linear logistic regression (LR) approach has become a standard classification approach, competing with other statistical techniques in many innovative scientific fields [16]. Researchers such as [17] used this technique to identify a connection between meteorological indicators and COVID-19 cases in Pakistan. Logistic regression models, along with the Random Forest technique, were also used by [18] to analyze groundwater potential in China, as groundwater levels tend to vary seasonally and geographically [19]. Shahibi et al. [20] used an LR model to map susceptibility to landslides in the Central Zab basin in Iran. Furthermore, a study conducted by [21] showed that LR performed better than other statistical techniques, such as the Support Vector Machine model, in terms of sensitivity to training samples. Therefore, due to the promising results, we used LR in our study to determine the association between meteorological parameters and cases of COVID-19.
As discussed earlier, previous studies in Pakistan are limited to regions, datasets, and temporal resolutions. Furthermore, they applied techniques different to ours to find a relationship between meteorological and environmental factors and cases of COVID-19. We hypothesize that many environmental and meteorological parameters are correlated with the spread of COVID-19. Therefore, in this study, we propose to evaluate the relationship between meteorological parameters (maximum and minimum temperature, humidity, and rainfall) and cases of COVID-19 at a national and subnational level using the LR approach. This is the first study of its kind in Pakistan, especially at the subnational, provincial, capital, and territorial levels, as an extensive COVID-19 study in Pakistan, especially at the subnational level, is not yet available. Additionally, a daily data length of 365 days was used to predict the relationship between meteorological parameters and COVID-19 cases. Longer datasets have proven to be more effective in improving model performance [22].

2. Materials and Methods
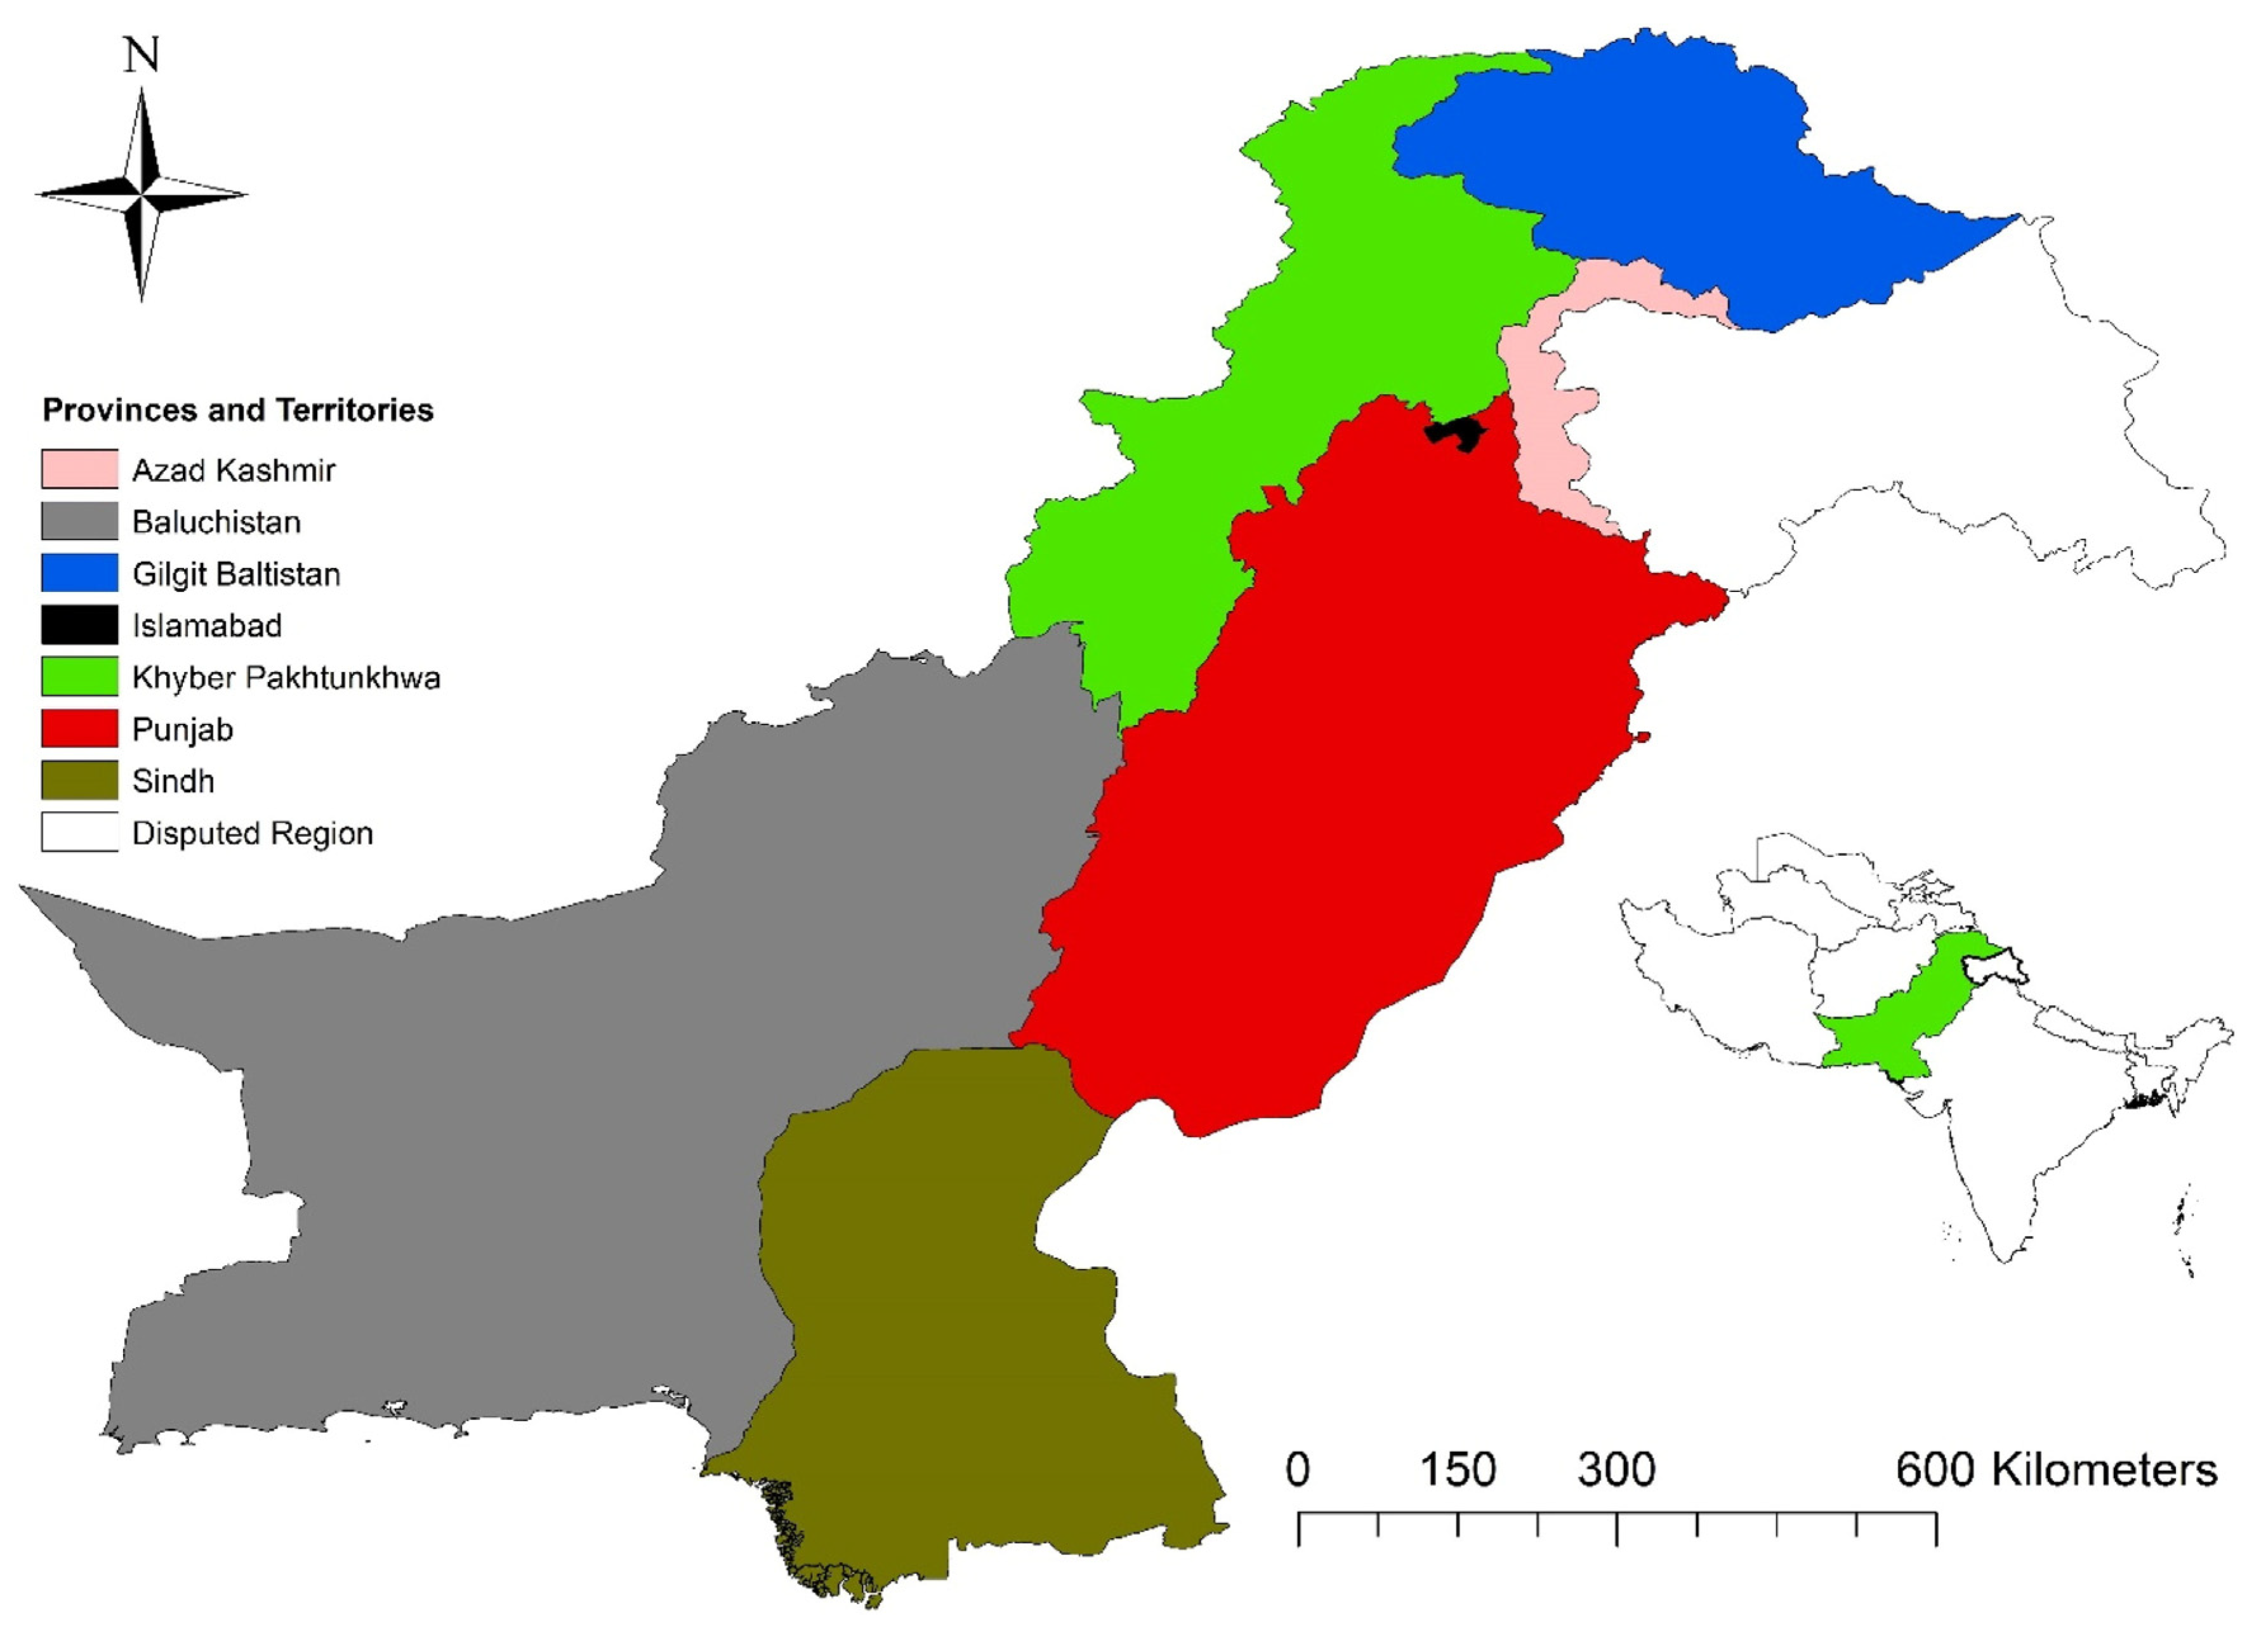
2.1. Study Area

Pakistan lies in South Asia at 30.00 °N and 70.00 °E. It is ranked as the fifth most populous country in the world, with a population of almost 207 million according to a 2017 census conducted by the Pakistan Bureau of Statistics (PBS) (https://www.pbs.gov.pk/content/population-census) accessed 10 January 2021. According to the World Bank, it covers an area of 881,913 square kilometers (https://data.worldbank.org). The subnational level includes four provinces, namely, Sindh, Punjab, Khyber Pakhtunkhwa (KPK), and Baluchistan; two territories, Gilgit-Baltistan (GB) and Azad Kashmir (AJK); and the capital, Islamabad (Figure 1).

2.2. Epidemic Data

We used daily COVID-19 data obtained from the Ministry of National Health Services Regulations and Coordination of the Government of Pakistan (NHSRC) (https://www.nhsrc.gov.pk). We selected daily confirmed and accumulated cases, as well as daily deaths and cases of accumulated deaths from COVID-19 in Pakistan. The daily data (in numbers) were obtained from the beginning of 2021, i.e., from 1 January 2021 to 31 December 2021, for the national-level as well as for the subnational-level cases.

2.3. Meteorological Data

Daily data on meteorological factors, including humidity (%), maximum and minimum temperatures (°C), and rainfall (mm) for the year 2021 were obtained from the Pakistan Meteorological Department (PMD), Islamabad.

2.4. Statistical Analysis

In this study, we used a mixed approach. A linear logistic regression model [23] was used to validate the association between the incidence of COVID-19 and climatic factors. In addition to examining the correlation between various climatic factors, we also assessed their associations. In the regression analysis, the new cases were used as prediction variables, while the input variables included the effects of maximum temperature, minimum temperature, rainfall, and humidity. The data underwent cleaning and recoding before being used for analysis. Subsequently, the data was organized and listed to identify any missing values. Descriptive statistical analysis was performed using frequency and percentage methods. This study used STATA 15 software along with the Spearman rank correlation test; additionally, SPSS Statistics 29 was used to analyze the correlation between meteorological factors and confirmed cases of COVID-19. This statistical tool facilitated quantitative analysis and model development to interpret the data. STATA has previously been employed by numerous researchers [24], producing satisfactory results. The analysis was carried out using a 95% confidence interval (CI) and significant predictive parameters with p-values less than 0.05. STATA 15 was applied for non-spatial and time-series analysis. The overall equation for the analysis is given below.
X   ( N e w   C O V I D - 19   C a s e s ) = α + β 1 X 1 ( M a x .   T e m p e r a t u r e ) + β 2 X 2 ( M i n .   T e m p e r a t u r e ) + β 3 X 3 ( R a i n f a l l ) + β 4 X 4 ( H u m i d i t y )
In the above equation, α is the intercept and β is the coefficient in the case of each input variable. Each β reflects how Y will change with X, which is associated with β when all the other X variables are kept constant. Furthermore, a scheme for the association between meteorological parameters and COVID-19 cases in Pakistan is shown in Figure 2.

3. Results

To determine the relationships among different variables and the prediction of new cases, Pearson’s correlation and regression analyses were performed on COVID-19 data. Data were collected for a period of one year, from January 2021 to December 2021. The association of maximum and minimum temperature, rainfall, and humidity with the prediction of new cases of COVID-19 was observed in this study, and the findings are presented in the following sections.

3.1. National Level

The model performance for nationally confirmed COVID-19 cases in Pakistan is presented in Table 1. The variables of intercept, minimum and maximum temperature, and humidity are seen to have a statistically significant impact on the prediction of new COVID-19 cases. The analysis was carried out using a 95% confidence interval; therefore, the p-value was < 0.05, confirming that the role of the input variable is statistically significant in the prediction of new cases of COVID-19. Studies conducted by [7] had similar findings to ours, that is, temperature is highly associated with the spread of the COVID-19 pandemic. However, we could not find any significance between rainfall and daily cases of COVID-19 at the national level.

3.2. Subnational Level
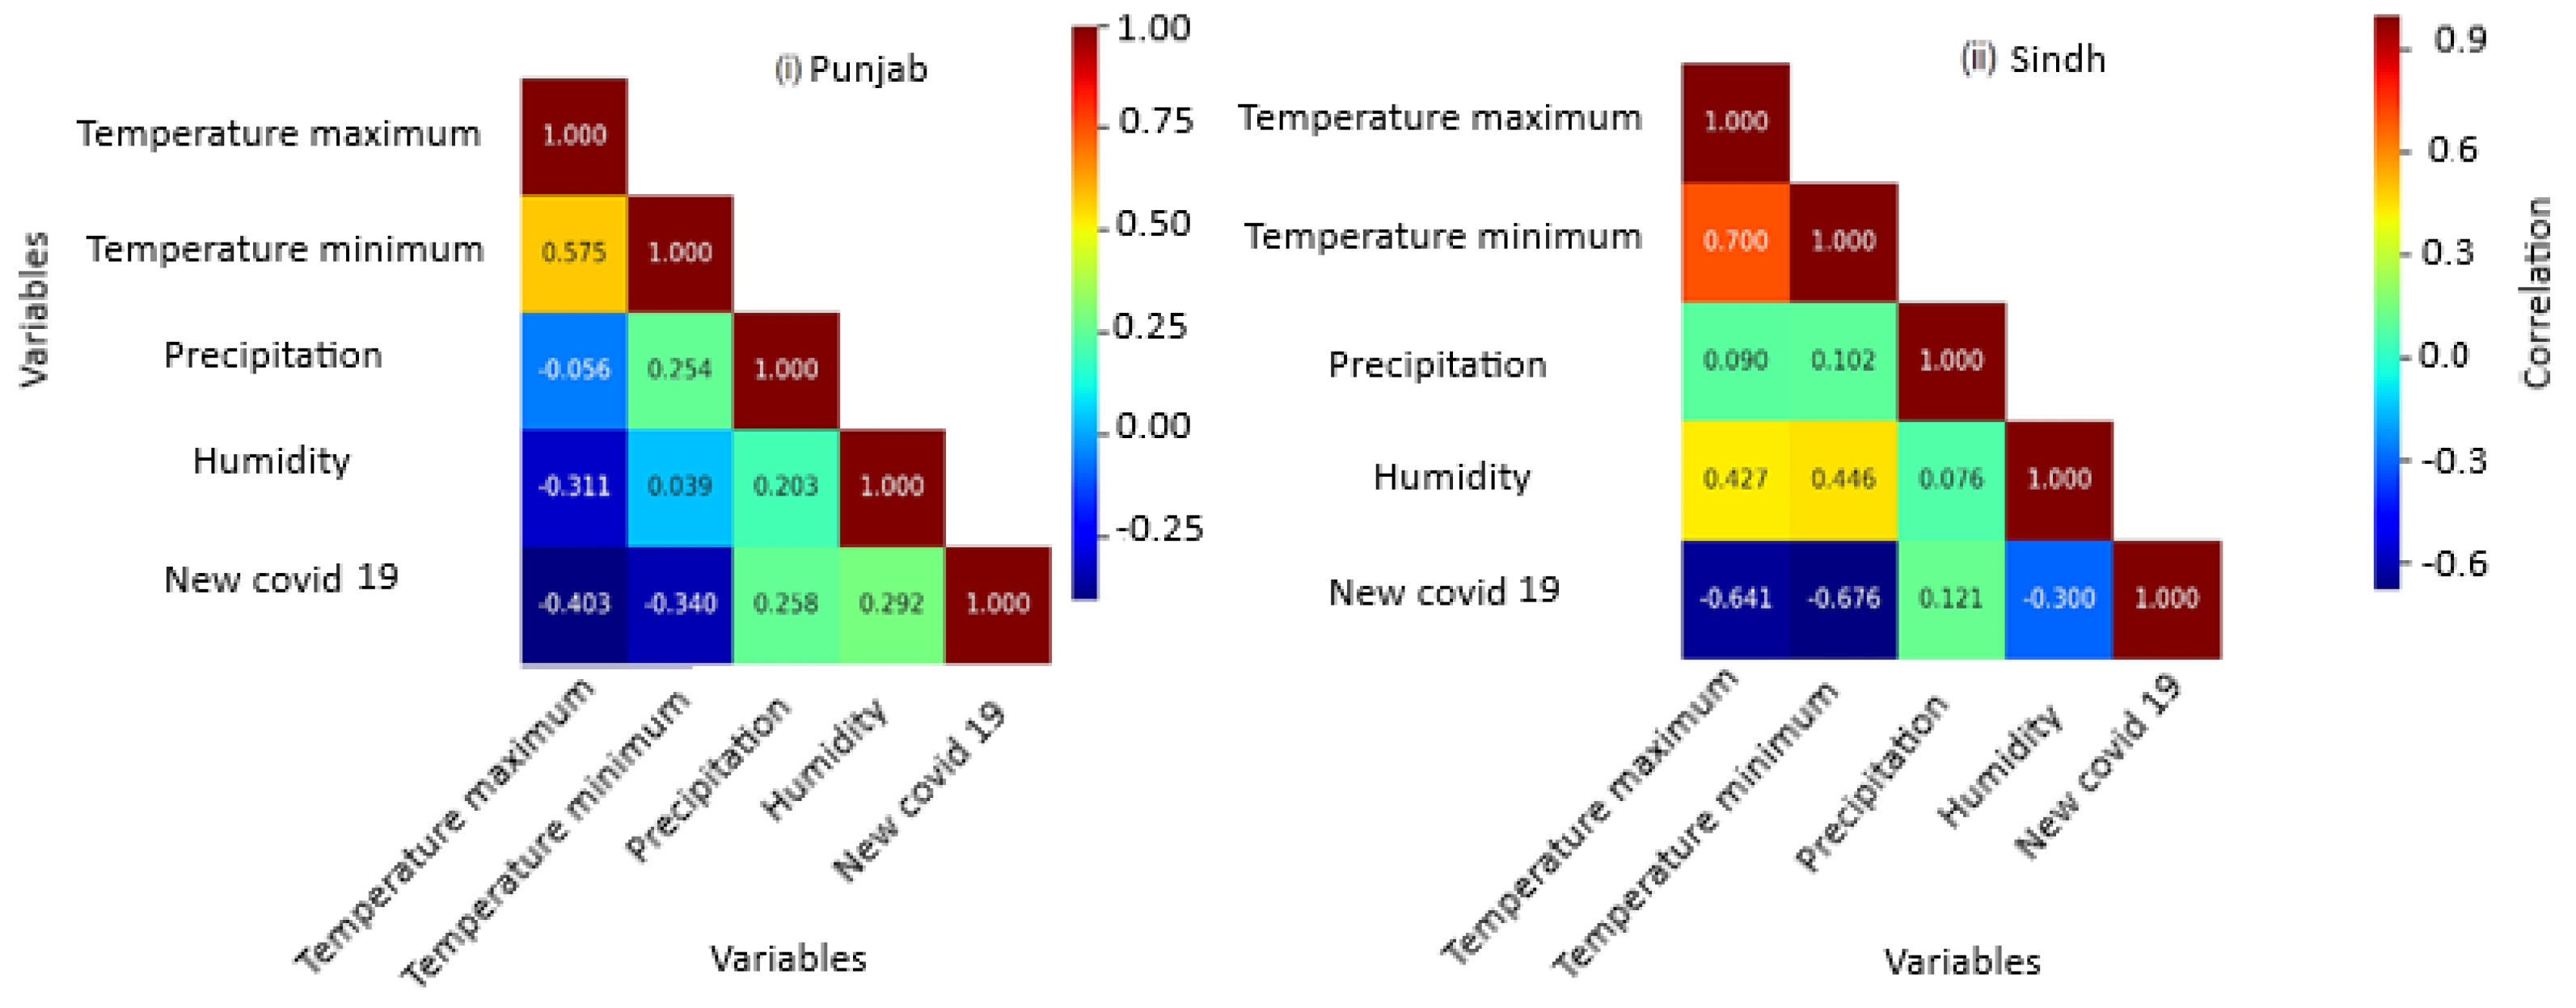
3.2.1. Punjab

Punjab is the most populous and largest province in Pakistan and, accordingly, reported the highest number of confirmed cases of COVID-19 (Figure 3i). Punjab has witnessed two COVID-19 peaks, the first in April and the other in August. Lower daily cases of COVID-19 are observed for months with increased temperature, that is, from May to July. Therefore, increased temperatures help reduce the spread of the COVID-19 pandemic. Findings by [5] and [6] reported that COVID-19 transmission is lowest in hot environments. Additionally, higher daily cases of COVID-19 are observed in August, which receives more rainfall due to the monsoon season, in turn promoting the spread of the pandemic. It is observed that the prediction power of the estimated model is 30.68%. It is imperative to mention that, even if the prediction power is lower, the analysis results show that the variables of intercept, minimum temperature, and rainfall have a statistically significant impact on the prediction of new COVID-19 cases.
Pearson’s correlation is an important analysis technique in which relationships between different variables are determined by checking how they are related directly or indirectly. The results of the analysis presented in Figure 4i show that the impact of temperature on the new cases is negative. This confirms that higher temperatures reduce virus spread, thus limiting its spread. Other researchers have also reported similar findings. For example, Ref. [25] reported that, with increased temperature, the number of new cases of COVID-19 decreased. Several other studies on the relationship between meteorological factors and the global spread of COVID-19 have reported a negative correlation between temperature, morbidity, and mortality from COVID-19 [6]. An increase in the amount of rainfall and humidity increased the number of new cases of COVID-19. This confirms that the spread of the COVID-19 pandemic was directly associated with rainfall and humidity. The detailed results are presented in Table 1.

3.2.2. Sindh

Sindh is the second most populous province in Pakistan, with approximately 47 million people (PBS). Consequently, it has witnessed the second-highest number of COVID-19 cases and deaths in Pakistan. Unlike Punjab, confirmed cases of COVID-19 reached three peaks: in May 2021, July 2021, and August 2021 (Figure 3ii). Lower temperatures were observed in January and February, which could be a reason for the increase in COVID-19 cases, in addition to the intense rainfall in July. Similarly to Punjab, higher temperatures were recorded from May to July, resulting in a lower number of COVID-19 cases in Sindh. Table 1 presents the results of the regression analysis for Sindh. The prediction power of the estimated model is 51.4%, which is quite high compared to the prediction model previously reported for the Punjab case. The results showed that the p-values for almost all predictive parameters were statistically significant (p < 0.05). This prediction confirms that the proposed model tends to predict new cases of COVID-19 in Sindh with an accuracy of more than 50%. The results of the analysis revealed that the intercept, maximum and minimum temperature, and humidity variables were significant predictors of new cases of COVID-19 in Sindh. It is vital to mention that the mortality rate variable was omitted from the analysis because it does not form any significant relationship with any of the other variables in the analysis due to the extremely small mortality values. The detailed results of the prediction using the regression analysis are available in Table 1. The results of the Pearson’s correlation analysis between the different variables in Sindh are shown in Figure 4ii. Similarly to Punjab, the impact of temperature on new cases of COVID-19 is negative in Sindh. In other words, temperature has a negative impact on the spread of the virus. On the contrary, the amount of rainfall and humidity has a direct relationship with the number of cases of COVID-19. It is concluded that an increase in the amount of precipitation and humidity promoted the spread of the virus, increasing the number of new cases of COVID-19 in Sindh province. These findings are in line with the results previously reported by [3].

3.2.3. Islamabad and Other Provinces and Territories

According to the population statistics obtained from PBS, the number of people living in other provinces (KPK and Baluchistan), territories (GB and AJK), and Islamabad is much lower than in provinces such as Punjab and Sindh. Consequently, according to data obtained from the relevant department, it is revealed that the number of cases of COVID-19 is much lower compared to Punjab and Sindh. In KPK, Baluchistan, GB, AJK, and Islamabad, our LR models showed that none of the climatic parameters was significant for the spread of COVID-19 (Table 1). Hence, the low performance of our models could mainly be attributed to the lower number of cases of COVID-19 reported there. According to the studies conducted [26], South America and some Asian countries had relatively lower cases of COVID-19 as they imposed some of the strictest measures. In the regression analysis, no statistically significant association was observed between the variables and the COVID-19 cases. Therefore, the performance of the regression models was highly controlled by the number of cases for each variable. Moreover, most of such areas lie in higher altitudes like GB, AJK, and KPK, etc., which offer lower maximum and minimum temperatures even in June and July compared to Punjab and Sindh. Therefore, a lower number of cases of COVID-19 can be attributed to such mild temperatures, which are not favorable for its spread.

4. Discussion

The incidence of confirmed cases of COVID-19 in Pakistan is among the highest in areas experiencing widespread transmission of COVID-19. This study elucidates the interactions between temperature (minimum and maximum), rainfall, and relative humidity in influencing the spread and mortality of COVID-19 at both the national and subnational levels in Pakistan. Due to its varied topography, the country exhibits a wide range of climatic conditions. A comprehensive analysis was carried out by comparing daily meteorological data, including temperature (minimum and maximum), rainfall, and humidity, with incidence cases of COVID-19 at national and subnational scales in Pakistan.
This study showed that the national and subnational levels, minimum (p < 0.001) and maximum (p < 0.001) temperatures (Punjab, Sindh, and KPK provinces), along with humidity, had a statistically significant association with daily cases of COVID-19 (Table 1). Xie & Zhu (2020) [27] and the findings of Tosepu et al. [28] in Jakarta, Indonesia, confirmed a significant correlation between COVID-19 and temperature. Similarly, a study by Abdulkareem, A.B., et al. [29] supports our findings that temperature is highly related to the spread of the COVID-19 pandemic. Furthermore, the combined effects of COVID-19 and climate variables have exacerbated human health risks and created synergies [30,31].
At the provincial level, lower daily cases of COVID-19 were observed in Punjab for high-temperature months, that is, from May to July. This indicates that higher temperatures resisted the spread of the COVID-19 pandemic. Riddell S et al. [5] found that COVID-19 transmission was the least in hot environments. This phenomenon can also be observed in relatively hot countries; that is, the impact of the spread of COVID-19 was much lower in these regions [30]. In contrast, the impact of rainfall and humidity is directly related to the reporting of new cases of COVID-19.
As a review by Shakil MH et al. [32] highlighted that environmental factors, rainfall during the monsoon could be a reason for the higher daily cases of COVID-19 in Punjab during August [3]. In Sindh, lower temperatures were observed in January and February, which could be a reason for the increase in cases of COVID-19, in addition to heavy rain in July. Similarly to Punjab, lower daily cases of COVID-19 were reported during months with higher temperatures, that is, from May to July. Therefore, it was revealed that an increase in temperature had a negative impact on the spread of the virus. Similar findings have been reported [11] that high temperatures limit the spread of the virus. On the contrary, an increase in the amount of precipitation and humidity promoted the spread of the virus, increasing the number of newly reported cases of COVID-19. Research conducted by Biktasheva (2020) [33] indicates a negative correlation between local air humidity and COVID-19 mortality in federal German states, suggesting that aerosol transmission of the virus is inhibited by elevated humidity levels [34]. Furthermore, high humidity increases indirect transmission pathways of the virus by enhancing the stability of viral particles within droplets and on surfaces [35].
In Baluchistan province and territories, our LR models have shown that none of the climatic parameters were significantly associated with the spread of COVID-19. The number of reported daily cases of COVID-19 was much lower in these areas compared to Punjab and Sindh. Therefore, the low performance of our models could mainly be attributed to the lower number of cases of COVID-19 reported there. Studies have shown that the performance of statistical models was considerably lower due to the lack of a sufficient amount of training data needed to capture the dynamics of COVID-19 cases [21,36].
The findings of this study are consistent across all measures evaluated, and this study offers insights by assessing the influence of meteorological factors on the transmission of COVID-19. Furthermore, the presence of a substantial number of asymptomatic positive cases within the community serves as a significant factor that can significantly alter the results on the meteorological impact of COVID-19 cases. In addition, limitations imposed on daily testing capacities can affect the number of confirmed new cases. Finally, due to its ecological design, this study is limited in its ability to establish causal relationships, as associations observed at an aggregate level may not necessarily correspond to those at an individual level. Our study did not aim to explore other factors that influence the spread and mortality of COVID-19, including social distancing measures, organization of the healthcare system, medical resources, public adherence, and personal hygiene. Investigating these areas further could provide a deeper understanding of how COVID-19 cases relate to climatic factors. Lastly, other machine learning and regression analysis techniques [37] could be sought for detailed information.

5. Conclusions

This study spans a full year after the COVID-19 outbreak, allowing a clearer observation of the seasonal characteristics of the spread of COVID-19 in Pakistan at the local, regional, and provincial levels. The positive correlation between temperature and COVID-19 cases in this study, coupled with the highest incidence of cases in July, underscores the adaptable and persistent nature of COVID-19. However, climatic factors do not operate as isolated variables, as other contributing factors are interconnected, creating a conducive environment for the spread of COVID-19 and exacerbating its impact. This study provides valuable information for policymakers on COVID-19 transmission and its association with meteorological variables for future outbreaks of this type.

Author Contributions

Conceptualization, I.A. and M.A.; methodology, I.A., M.A. and M.Y.; software, I.A., H.A., Y.S. and Z.T.; validation, M.O., I.A., M.A. and A.U.; formal analysis, I.A. and Z.T.; investigation, M.A. and I.A.; resources, M.Y. and A.U.; data curation, M.A., H.S.A. and I.A.; writing—original draft preparation, I.A. and M.A.; writing—review and editing, M.O., Y.S., Z.T., A.U., H.S.A. and M.Y.; visualization, M.A.; supervision, M.Y.; project administration, M.A.; funding acquisition, M.Y. and A.U. All authors have read and agreed to the published version of the manuscript.

Funding

This research received no external funding.

Institutional Review Board Statement

This study received ethical approval (NO:1291/CE/2022) from Mirpur University of Science Technology, Mirpur, 10250, Pakistan.

Informed Consent Statement

Not applicable.

Data Availability Statement

Data can be made available on request.

Acknowledgments

We acknowledge the Ministry of National Health Services Regulations and Coordination, Government of Pakistan and Pakistan Meteorological Department (PMD) for the provision of the COVID-19 pandemic and meteorological data of Pakistan, respectively.

Conflicts of Interest

The authors declare no conflicts of interest.

References

  1. Alqasemi, A.S.; Hereher, M.E.; Kaplan, G.; Al-Quraishi, A.M.F.; Saibi, H. Impact of COVID-19 lockdown upon the air quality and surface urban heat island intensity over the United Arab Emirates. Sci. Total Environ. 2021, 767, 144330. [Google Scholar] [CrossRef]
  2. Gwenzi, W. Dangerous liaisons? As the COVID-19 wave hits Africa with potential for novel transmission dynamics: A perspective. J. Public Health 2022, 30, 1353–1366. [Google Scholar] [CrossRef] [PubMed]
  3. Iqbal, M.M.; Abid, I.; Hussain, S.; Shahzad, N.; Waqas, M.S.; Iqbal, M.J. The effects of regional climatic condition on the spread of COVID-19 at global scale. Sci. Total Environ. 2020, 739, 140101. [Google Scholar] [CrossRef] [PubMed]
  4. Syafarina, I.; Shabrina, A.; Latifah, A.L.; Adytia, D. Evaluation of the Social Restriction and its Effect to the COVID-19 Spread in Indonesia. In Proceedings of the 2021 9th International Conference on Information and Communication Technology (ICoICT), Yogyakarta, Indonesia, 3–5 August 2021. [Google Scholar]
  5. Riddell, S.; Goldie, S.; Hill, A.; Eagles, D.; Drew, T.W. The effect of temperature on persistence of SARS-CoV-2 on common surfaces. Virol. J. 2020, 17, 145. [Google Scholar] [CrossRef] [PubMed]
  6. Ahmed, J.; Jaman, M.H.; Saha, G.; Ghosh, P. Effect of environmental and socio-economic factors on the spreading of COVID-19 at 70 cities/provinces. Heliyon 2021, 7, e06979. [Google Scholar] [CrossRef]
  7. Basray, R.; Malik, A.; Waqar, W.; Chaudhry, A.; Malik, M.W.; Khan, M.A.; Ansari, J.A.; Ikram, A. Impact of environmental factors on COVID-19 cases and mortalities in major cities of Pakistan. J. Biosaf. Biosecurity 2021, 3, 10–16. [Google Scholar] [CrossRef]
  8. Aslam, M.N.; Ashraf, S.; Shrestha, S.; Ali, M.; Hanh, N.C. Climate change impact on water scarcity in the Hub River Basin, Pakistan. Groundw. Sustain. Dev. 2024, 27, 101339. [Google Scholar] [CrossRef]
  9. Ali, M.; Gillani, S.H.; Ali, U. Flash Drought Monitoring in Pakistan Using Machine Learning Techniques and Multivariate Drought Indices. Tech. J. 2024, 3, 717–729. [Google Scholar]
  10. Nguyen, D.T.; Ashraf, S.; Le, M.; Trung, L.Q.; Ali, M. Projection of climate variables by general circulation and deep learning model for Lahore, Pakistan. Ecol. Inform. 2023, 75, 102077. [Google Scholar] [CrossRef]
  11. Irfan, M.; Ikram, M.; Ahmad, M.; Wu, H.; Hao, Y. Does temperature matter for COVID-19 transmissibility? Evidence across Pakistani provinces. Environ. Sci. Pollut. Res. 2021, 28, 59705–59719. [Google Scholar] [CrossRef]
  12. Rehman, A.; Ashraf, F.; Javed, Z.; Hussain, M.; Farooq, T.H.; Shakoor, A.; Shahzad, S.M. The nexus between meteorological parameters and COVID-19 pandemic: Case of Islamabad, Pakistan. Environ. Sustain. 2021, 4, 527–531. [Google Scholar] [CrossRef]
  13. Ali, Q.; Raza, A.; Saghir, S.; Khan, M.T.I. Impact of wind speed and air pollution on COVID-19 transmission in Pakistan. Int. J. Environ. Sci. Technol. 2021, 18, 1287–1298. [Google Scholar] [CrossRef]
  14. Fawad, M.; Mubarik, S.; Malik, S.S.; Ren, J. Statistical analysis of COVID-19 infection caused by environmental factors: Evidence from Pakistan. Life Sci. 2021, 269, 119093. [Google Scholar] [CrossRef] [PubMed]
  15. Briz-Redón, Á.; Serrano-Aroca, Á. The effect of climate on the spread of the COVID-19 pandemic: A review of findings, and statistical and modelling techniques. Prog. Phys. Geogr. Earth Environ. 2020, 44, 591–604. [Google Scholar] [CrossRef]
  16. Raza, A.; Khan, M.T.I.; Ali, Q.; Hussain, T.; Narjis, S. Association between meteorological indicators and COVID-19 pandemic in Pakistan. Environ. Sci. Pollut. Res. 2021, 28, 40378–40393. [Google Scholar] [CrossRef] [PubMed]
  17. Chen, W.; Li, H.; Hou, E.; Wang, S.; Wang, G.; Panahi, M.; Ahmad, B.B. GIS-based groundwater potential analysis using novel ensemble weights-of-evidence with logistic regression and functional tree models. Sci. Total Environ. 2018, 634, 853–867. [Google Scholar] [CrossRef] [PubMed]
  18. Ashraf, S.; Ali, M.; Shrestha, S.; Hafeez, M.A.; Moiz, A.; Sheikh, Z.A. Impacts of climate and land-use change on groundwater recharge in the semi-arid lower Ravi River basin, Pakistan. Groundw. Sustain. Dev. 2022, 17, 100743. [Google Scholar] [CrossRef]
  19. Shahabi, H.; Hashim, M.; Ahmad, B.B. Remote sensing and GIS-based landslide susceptibility mapping using frequency ratio, logistic regression, and fuzzy logic methods at the central Zab basin, Iran. Environ. Earth Sci. 2015, 73, 8647–8668. [Google Scholar] [CrossRef]
  20. Chen, X.; Zhang, X.; Church, J.A.; Watson, C.S.; King, M.A.; Monselesan, D.; Legresy, B.; Harig, C. The increasing rate of global mean sea-level rise during 1993–2014. Nat. Clim. Change 2017, 7, 492–495. [Google Scholar]
  21. Couronné, R.; Probst, P.; Boulesteix, A.-L. Random Forest versus logistic regression: A large-scale benchmark experiment. BMC Bioinform. 2018, 19, 270. [Google Scholar] [CrossRef]
  22. Rencher, A.C. A Review of “Methods of Multivariate Analysis”; Taylor & Francis: Abingdon, UK, 2005. [Google Scholar]
  23. Jaccard, J.; Guilamo-Ramos, V.; Johansson, M.; Bouris, A. Multiple regression analyses in clinical child and adolescent psychology. J. Clin. Child Adolesc. Psychol. 2006, 35, 456–479. [Google Scholar] [CrossRef]
  24. Kitaw, T.A.; Abate, B.B.; Tilahun, B.D.; Azmeraw, M.; Ayele, M.; Lake, E.S.; Zemariam, A.B.; Yilak, G.; Kassa, M.A.; Haile, R.N. Spatial variation, 20-year trends, and determinants of the double burden of wasting and stunting among under-five children in Ethiopia: A geo-spatial and multivariate decomposition analysis (2000–2019). Sci. Rep. 2024, 14, 29539. [Google Scholar] [CrossRef] [PubMed]
  25. Kodera, S.; Rashed, E.A.; Hirata, A. Correlation between COVID-19 morbidity and mortality rates in Japan and local population density, temperature, and absolute humidity. Int. J. Environ. Res. Public Health 2020, 17, 5477. [Google Scholar] [CrossRef]
  26. Zhu, L.; Liu, X.; Huang, H.; Avellán-Llaguno, R.D.; Lazo, M.M.L.; Gaggero, A.; Soto-Rifo, R.; Patiño, L.; Valencia-Avellan, M.; Diringer, B. Meteorological impact on the COVID-19 pandemic: A study across eight severely affected regions in South America. Sci. Total Environ. 2020, 744, 140881. [Google Scholar] [CrossRef] [PubMed]
  27. Xie, J.; Zhu, Y. Association between ambient temperature and COVID-19 infection in 122 cities from China. Sci. Total Environ. 2020, 724, 138201. [Google Scholar] [CrossRef] [PubMed] [PubMed Central]
  28. Tosepu, R.; Gunawan, J.; Effendy, D.S.; Ahmad, L.O.A.I.; Lestari, H.; Bahar, H.; Asfian, P. Correlation between weather and Covid-19 pandemic in Jakarta, Indonesia.”. Sci. Total Environ. 2020, 725, 138436. [Google Scholar] [CrossRef] [PubMed]
  29. Abdulkarem, A.B.; Sani, N.S.; Sahran, S.; Alyessari, Z.A.A.; Adam, A.; Abd Rahman, A.H.; Abdulkarem, A.B. Predicting COVID-19 based on environmental factors with machine learning. Intell. Autom. Soft Comput. 2021, 28, 305–320. [Google Scholar] [CrossRef]
  30. Nundy, S.; Ghosh, A.; Mesloub, A.; Albaqawy, G.A.; Alnaim, M.M. Impact of COVID-19 pandemic on socio-economic, energy-environment and transport sector globally and sustainable development goal (SDG). J. Clean. Prod. 2021, 312, 127705. [Google Scholar] [CrossRef]
  31. Watts, N.; Amann, M.; Arnell, N.; Ayeb-Karlsson, S.; Beagley, J.; Belesova, K.; Boykoff, M.; Byass, P.; Cai, W.; Campbell-Lendrum, D. The 2020 report of the Lancet Countdown on health and climate change: Responding to converging crises. Lancet 2021, 397, 129–170. [Google Scholar] [CrossRef]
  32. Shakil, M.H.; Munim, Z.H.; Tasnia, M.; Sarowar, S. COVID-19 and the environment: A critical review and research agenda. Sci. Total Environ. 2020, 745, 141022. [Google Scholar] [CrossRef]
  33. Biktasheva, I.V. Role of a habitat’s air humidity in COVID-19 mortality. Sci. Total Environ. 2020, 736, 138763. [Google Scholar] [CrossRef] [PubMed]
  34. Ma, Y.; Zhao, Y.; Liu, J.; He, X.; Wang, B.; Fu, S.; Yan, J.; Niu, J.; Zhou, J.; Luo, B. Effects of temperature variation and humidity on the death of COVID-19 in Wuhan, China. Sci. Total Environ. 2020, 724, 138226. [Google Scholar] [CrossRef] [PubMed]
  35. Paynter, S. Humidity and respiratory virus transmission in tropical and temperate settings. Epidemiol. Infect. 2015, 143, 1110–1118. [Google Scholar] [CrossRef] [PubMed]
  36. Zeroual, A.; Harrou, F.; Dairi, A.; Sun, Y. Deep learning methods for forecasting COVID-19 time-Series data: A Comparative study. Chaos Solitons Fractals 2020, 140, 110121. [Google Scholar] [CrossRef]
  37. Kausar, T.; Lu, Y.; Kausar, A.; Ali, M.; Yousaf, A. SD-GAN: A style distribution transfer generative adversarial network for COVID-19 detection through X-ray images. IEEE Access 2023, 11, 24545–24560. [Google Scholar] [CrossRef]
Figure 1. Map of the study area showing all four provinces, two territories, and the capital, Islamabad.
J 08 00021 g001
Figure 2. Proposed scheme of study showing the association between meteorological parameters and the cases of COVID-19 in Pakistan.
J 08 00021 g002
Figure 3. Variation in daily COVID-19 cases with changes in meteorological parameters for (i) Punjab and (ii) Sindh. Other areas are not shown due to their smaller numbers of cases.
J 08 00021 g003
Figure 4. Heatmap showing the correlation between the variables for (i) Punjab and (ii) Sindh.
J 08 00021 g004
Table 1. Linear regression outputs at national and subnational levels for new cases of COVID-19 stratified by mean daily temperature (max and min), rainfall, and humidity.
Max. Temperature (°C)Min. Temperature (°C)Precipitation (mm)Humidity (%)
Coefp95%ClCoefp95%ClCoefp95%ClCoefp95%Cl
National43,169.210.000 29,660.9, 56,677.52−18,713.840.001 −29,876.56 −7551.121−4671.2120.259 −12,797.42, 3454.9912,428.73 0.00012,428.73, 18,357.53
Subnational (Provinces and Federal Territories)
Punjab15.490.0410.66, 30.32−5.960.452−21.5,9.6310.900.0390.57, 21.23−11.700.000−16.32, −7.07
Sindh−41.550.000−54.06, −29.0348.630.00038.40, 58.863.210.643−10.42, 16.852.290.143−0.77, 5.36
KPK3.450.0011.41, 5.48−4.270.000−5.74, −2.801.450.745−7.34, 10.262.880.0140.58, 5.18
Baluchistan1.240.0000.96, 1.53−0.060.594−0.31, 0.182.940.0460.05, 5.48−0.230.051−0.46, 0.00
Federal Territories
Islamabad0.660.113−0.15, 1.48−1.890.000−2.74, −1.041.890.0410.08, 3.70−0.970.190−2.43, 0.48
AJK−2.520.014−4.54, −0.508.010.0005.55, 10.470.820.076−0.08, 1.73−0.180.508−0.74, 0.37
Gilgit-Baltistan0.400.0000.30, 0.500.1220.0110.02, 0.210.610.076−0.06, 1.28−0.080.259−0.23, 0.06
Disclaimer/Publisher’s Note: The statements, opinions and data contained in all publications are solely those of the individual author(s) and contributor(s) and not of MDPI and/or the editor(s). MDPI and/or the editor(s) disclaim responsibility for any injury to people or property resulting from any ideas, methods, instructions or products referred to in the content.

