Abstract
Fuel cells are highly efficient electrochemical devices that convert the chemical energy of fuel directly into electrical energy, while generating minimal pollutant emissions. In recent decades, they have established themselves as a key technology for sustainable energy supply in the transport sector, stationary systems, and portable applications. In order to assess their real contribution to environmental protection and energy efficiency, a comprehensive analysis of their life cycle, Life Cycle Assessment (LCA) is necessary, covering all stages, from the extraction of raw materials and the production of components, through operation and maintenance, to decommissioning and recycling. Particular attention is paid to the environmental challenges associated with the extraction of platinum catalysts, the production of membranes, and waste management. Economic aspects, such as capital costs, the price of hydrogen, and maintenance costs, also have a significant impact on their widespread implementation. This manuscript presents detailed mathematical models that describe the electrochemical characteristics, energy and mass balances, degradation dynamics, and cost structures over the life cycle of fuel cells. The models focus on proton exchange membrane fuel cells (PEMFCs), with possible extensions to other types. LCA is applied to quantify environmental impacts, such as global warming potential (GWP), while the levelized cost of electricity (LCOE) is used to assess economic viability. Particular attention is paid to the sustainability challenges of platinum catalyst extraction, membrane production, and end-of-life material recovery. By integrating technical, environmental, and economic modeling, the paper provides a systematic perspective for optimizing fuel cell deployment within a circular economy.
1. Introduction
Fuel cells are emerging as a key element in the decarbonization of transport and stationary energy, but their sustainable impact critically depends on life cycle assessment (LCA) and the origin of hydrogen [1,2]. Overviews and critical reviews highlight that LCA results are highly sensitive to system boundaries, functional unit, allocation/crediting, and the quality of inventory data [2,3]. In parallel with the methodology, material innovations, and electrochemical features, including degradation mechanisms in Polymer Electrolyte Membrane (PEM) and cathode/anode catalysts, frame the limitations and opportunities for real improvements in operation [3,4,5,6]. Collective assessments indicate that the strategic positioning of fuel cells in the energy transition requires integrated Life Cycle Sustainability Assessment (LCSA)/Techno-Economic Assessment (TEA) approaches and clearly defined scenarios that take into account both environmental and economic indicators [7]. In mobile applications, comparative analyses of Fuel cells electric vehicle (FCEV) vs. Battery electric vehicle (BEV) through the prism of the circular economy, infrastructure and energy mix show conditional superiority according to the regional context and use profile [8]. In stationary systems, advances in catalytic solutions and thermal integration for Solid Oxide Fuel Cells (SOFC) and Combined Heat and Power (CHP) configurations improve resource efficiency and increase overall electrical and thermal efficiency [9], while LCA/TEA comparisons for SOFC cogeneration systematize the trade-offs between efficiency, investment, and fuel base [10]. In transportation, multi-criteria frameworks support the prioritization of H2 pathways according to environmental efficiency, cost, and operational constraints [11]. Circularity of materials and recycling are the second key lever for sustainability. Recycling of Platinum group metals (PGMs) from automotive fuel cells, together with advances in high-temperature PEM membranes, outlines the potential for reducing the footprint in the “production” phase and reducing the dependence on critical raw materials [12,13]. In the context of micro-CHP systems Proton exchange mem-60 brane fuel cells (PEMFC)/SOFC, LCA/TEA studies and innovations for increased durability in PEMFC indicate pathways to lower Levelized Cost of Energy (LCOE)/Cost of Energy (COE) while simultaneously increasing reliability [14,15]. Reviews of critical and strategic feedstocks for electrolyzers/fuel cells complete the picture, mapping risks along the chain and priorities for substitution and high-efficiency recycling [16].
In the transport sector, cross-platform powertrain reviews and sector studies highlight that H2 usage profiles, logistics and climate directly influence the final Global Warming Potential (GWP/kWh) [17,18,19,20,21]. Modern comparative LCAs for shipping support the thesis that the H2 source (grey/blue/green) and the operating mode dominate the results and define “tipping points” in favor of one or another technology [21]. Against this background, the techno-economic challenges of commercialization, as well as classic micro-CHP models, remain the benchmark for parameterization and validation of scenarios, including dynamic loads and wear [22,23,24]. In summary, the framework of this study is based on the following principles: methodological consistency in LCA, such as boundaries, functional unit, allocation/crediting; integration with TEA, so that environmental flows and discount costs are attributed to the same functional unit; sensitivity to Capital Expenditures (CAPEX), H2 price/source and upstream emission factors; material criticality and recycling scenarios to reduce “hot spots”; distinct operating modes (including CHP) to capture the system benefit of recovered heat [1,2,3,4,5,6,7,8,9,10,11,12,13,14,15,16,17,18,19,20,21,22,23,24].
In stationary CHP systems, it is critical whether a system expansion of a reference heat or an energy allocation is applied, in both cases the value of the “credit” changes the order of magnitude of GWP/kWh and COE/LCOE [14,23,24]. Similarly, the choice of net versus gross electricity including the Balance of Plant (BOP’s) own consumers defines the boundaries between engineering and inventory assumptions, which also has an impact on TEA results [14,22,23,24]. Therefore, comparability between studies should be considered with attention to units, normalization, and credits, as well as to uncertainty management [1,2].
An essential aspect is the degradation of the stack and BOP in real-world conditions. Dynamic profile loads and cold starts accelerate aging mechanisms in PEMFCs (membranes, catalysts, mass transfer) and lead to a temporal evolution of efficiency and H2 consumption, which should be reflected in the LCA/TEA through lifetime scenarios [3,4,5,6,24]. In SOFCs, degradation is associated with high-temperature processes (material interactions, cathodic/anodic phenomena), but the high operating temperature also brings a thermodynamic advantage in operation, which explains the observed high overall efficiencies in CHP [9,10]. Thus, the operating profiles and the load regime are a bridge between engineering assumptions and life-cycle indicators.
From a systems perspective, the origin of H2 remains the “main lever”: green H2 exhibits a multiple reduction in GWP compared to grey H2, while blue H2 depends strongly on capture efficiency and upstream methane leakage [11,17,18,19,20,21]. In transport analyses, this manifests itself as “tipping points” where FCEVs outperform BEVs/ Internal Combustion Engines (ICEs) under certain usage, infrastructure, and climate profiles [8,17,18,19,20,21]. In stationary applications, the choice of H2 pathway, together with fuel pricing and system CAPEX, dominates the LCOE/COE and marginal abatement costs [10,14,22,23,24].
Material criticality and the circular economy are the third pillar. Platinum Group Metals (PGMs) account for a significant share of the “production” footprint of PEMFCs, but closed-loop catalyst and Membrane-Electrode Assembly (MEA) recycling can significantly reduce impacts and improve economics at sufficiently high yields and purity of recovered metal [12,13,15]. These interventions are particularly important in conditions of volatile markets and supply risks for critical raw materials [16]. Therefore, design for recyclability (dismantling, minimization of elemental losses, standardized laminates) should be integrated into eco-design frameworks at an early stage [12,13,14,15,16].
Based on the above, we formulate the following research questions:
- (1)
- How do harmonized system boundaries and the choice of crediting/allocation method affect the GWP and LCOE of PEMFCs in CHP?
- (2)
- How do H2 price/source, CAPEX and degradation determine the sensitivity of the results in realistic operating profiles?
- (3)
- How do PGM recycling and design for circularity change the impact and cost profile in the “production” and “end-of-life” phases?
To answer this, we propose an integrated LCA–TEA framework with transparent scenarios and functional units, comparable to [1,2,3,4,5,6,7,8,9,10,11,12,13,14,15,16,17,18,19,20,21,22,23,24].
Figure 1 schematizes the framework and boundaries (cradle-to-grave): materials → stack production/BOP → H2 supply/origin (grey/blue/green) → operation (gross/net power, BOP, useful heat) → end-of-life/recycling; inputs: CAPEX/ Operating Expenditures (OPEX), H2 price/EF, stack parameters (current density, ASR, degradation), outputs: GWP [kgCO2e/kWh], LCOE/COE [lv./kWh], η_el, η_tot. Units: A·m−2 is used in the equations, and [A·cm−2] in the figures.
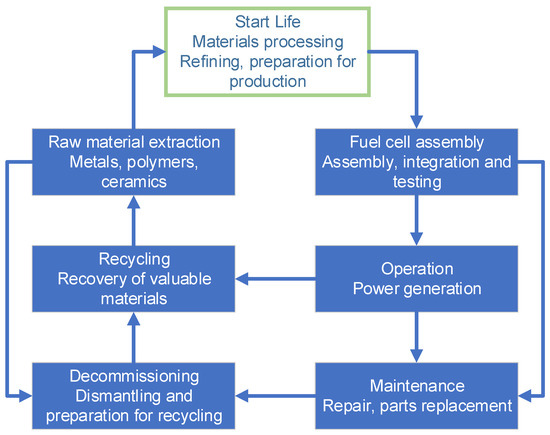
Figure 1.
Life cycle flowchart of a PEM fuel cell system, including materials, operation, maintenance, and end-of-life stages.
2. Literature Review: Fuel Cell LCA
Recent reviews of fuel cell and PEMFC LCA, LCSA systematize the need for harmonized boundaries, clear functional units, and transparent inventory data to avoid incomparable results [25,26]. In the transport sector, LCA of SOFC vehicles versus PEMFC/BEV/ICE and thematic reviews of FCEV in road transport show that technological and infrastructure assumptions are decisive for the final conclusion [27,28]. For the end-of-life phase, the implementation of closed loops for Pt catalysts reduces “hot spots” and improves integral performance [29]. Prospective LCA for SOFC supports eco-design for future configurations and scaling [30], and material/mode/climate sensitivity in cold regions remains key for BEV vs. FCEV comparisons [31]. At the H2 level, summaries of LCA methods/indicators for production highlight the differences between “grey”, “blue” and “green” hydrogen and their impact on the final footprint [32,33,34].
LCA/TEA integration when introducing SOFCs into gas processing operations shows how strongly the system context, such as resources, waste streams, heat demand, changes the balance of impacts [35]. The “whole chain” approach for FCEV reveals the effects of infrastructure and logistics [36], and alternative H2 pathways combine an environmental and cost perspective [37]. Prospective assessments of future SOFC configurations further address material scenarios and production improvements [38]. Life-cycle analyses of FCEV emission reduction intensity formulate the boundary conditions under which the technology is favorable [39].
Reviews of the criticality of materials in H2/Fuel Cell (FC) technologies, including PGMs, remain central to the “production” phase [40]. Comprehensive reviews of H2 production, storage, and use require consistent scenarios and data in the energy sector [41]. Case studies of charging/charging stations with thermodynamic and LCA analysis demonstrate systemic benefits of integrated design [42]. Large-scale BEV vs. FCEV comparisons confirm the role of energy mix and load [43], and systematic reviews of H2 in power generation describe key technological and methodological choices [44]. Assessments of Molten Carbonate Fuel Cells (MCFCs) in power generation and state-of-the-art reviews formulate sources of impacts and mitigation strategies in cogeneration modes [45,46]. Case studies of Pt recycling in PEMFCs identify “hot spots” and potential environmental potentials when high levels of recovery are achieved [47,48]. Early LCAs for alkaline systems in CHP show how recovered heat changes system efficiency and performance interpretation [49]. Combined schemes, such as plasma gasification supplemented with MCFC, demonstrate sensitivity to fuel/waste type and highlight the need for consistent assumptions [50].
Recent reviews of electrolyzer and fuel cell recycling outline a path towards a circular H2 economy, including technology gaps and industry data needs [51]. Historical LCAs of Molten Carbonate Fuel Cell (MCFC) stacks remain useful as a benchmark for methodological verification and comparison in new inventories [52].
Reviews emphasize the need for LCA to go beyond GWP and include other midpoint indicators (acidity, eutrophication, photochemical smog, Particulate Matter (PM), toxicity, resource and possibly endpoint syntheses), applying normalization and clustering for better interpretation [25,26]. This is especially important when comparing PEMFC, SOFC/MCFC and BEV, where the production “hot spots” are distributed differently along the chain [27,28]. Recycling of Pt catalysts in a closed loop has been systematically indicated as an effective measure for reducing impacts at sufficiently high yields and low process energy intensity [29]. The introduction of prospective LCA for SOFCs shows how learning curves and changes in the energy mix can rearrange the “hot spots” over time, pushing production impacts below the threshold of operational benefits [30]. The sensitivity to materials/climate in cold regions is also highlighted in mobile applications, where the BEV vs. FCEV comparison is reversed according to heating load and infrastructure constraints [31]. For H2 production, meta-reviews systematize the differences between grey/blue/green H2 and the importance of co-products, allocation/credits, and time horizons (GWP20/100) [32,33,34].
In industrial contexts, SOFC integration shows a strong dependence on available waste streams, local heat demand, and logistics, which changes the balance of impacts under different scenarios [35]. The “whole industry chain” approach to FCEV and the associated H2 logistic design demonstrate how the infrastructure and distribution of production/storage affect the overall footprint [36]. Alternative H2 guidelines combine environmental and cost criteria, but emphasize the need for comparable assumptions and boundaries [37]. Further prospective studies for future SOFC configurations address material scenarios and more efficient manufacturing practices [38].
Emission reduction intensity assessments for FCEVs articulate the conditions for dominance: low-carbon H2, sufficient annual mileage/load, and operating temperatures that do not impose a disproportionate energy burden [39]. This corresponds to the material criticality in the manufacturing phase, where careful material selection, substitution, and recycling can change the technology rankings [40].
Comprehensive reviews of H2 production/storage/use call for consistent scenarios, up-to-date emission factors, and clear allocation/crediting rules to avoid conclusions driven by methodology rather than technology [41]. Case studies of charging/charging stations and hybrid systems show that integrated design and load management can bring systemic benefits beyond component analysis [42]. Macro-comparisons of BEV vs. FCEV by segment reinforce the role of energy mix, H2 logistics and real-world operating cycle [43], while systematic reviews of H2 in power generation describe technological and methodological choices that need to be harmonized for comparability [44].
MCFC LCA in power generation shows specific sources of impacts and benefits of cogeneration modes; integration of heat consumers is crucial for the final indicators [45]. Identification of hotspots in Pt-recycling in PEMFCs orients interventions to the most significant processes [46]. MCFC state-of-the-art reviews suggest strategies for future mitigation of impacts [47], and early CHP LCAs for alkaline systems demonstrate how recovered heat transforms system efficiency and unit service indicators [48]. The first LCAs of Pt recycling in PEMFCs show tangible benefits in closed loop and high purity of recovered metal [49]. Combined schemes such as plasma gasification and combination with MCFC illustrate sensitivity to fuel/waste type and highlight the need for consistent assumptions and full inventories [50].
Reviews of electrolyzer/fuel cell recycling describe technological trajectories towards a circular H2 economy, but also point out gaps in industrial data and challenges in scaling up [51]. Historical LCAs of MCFC stacks provide benchmarks for methodological verification and for validating modern inventories, especially when comparing across generations of technologies [52].
Conclusion of this review. The convergence of results shows that H2 origin and methodological consistency dominate environmental metrics, while CAPEX/degradation/operational mode drive economic metrics. Circularity is a transversal lever that improves both types of metrics. The present study uses these findings to build a comparable and transparent LCA–TEA framework for PEMFCs, with a focus on clear FUs and boundaries, heat credits/allocation, H2 pathway scenarios, CAPEX sensitivity, material criticality, and recycling.
3. Materials and Methods
For this study, a mathematical model of a fuel cell has been developed, which covers electrochemical processes, energy and mass balance, degradation over time, as well as technical, economic, and environmental indicators within the life cycle. The model applies to both proton exchange fuel cells (PEMFC) and other technologies with appropriate adaptation of the parameters.
Although the presented model was developed specifically for PEMFC systems, some aspects, such as the LCOE structure, degradation accounting, and mass-energy balances, can be adapted for solid oxide fuel cells (SOFCs) with appropriate modifications to reflect high-temperature operation, different material degradation mechanisms, and different plant balance requirements. The stages considered for assessing the life cycle of a fuel cell include the following stages: raw material extraction; production; operation; maintenance and/or replacement; end of life (recycling/disposal). A functional unit has been introduced for qualitative and quantitative metrics. In this study, it is 1 kWh net electricity delivered to the terminals for a period T = 5000 h. The LCA period is based on 100 years for Global Warming Potential (GWP).
Let the power demand be Pload(t) and the net output be Pnet(t). Then the energy balance requirement is:
3.1. Electrochemical Cell/Stack Model
The voltage of a single fuel cell is determined by:
where
- Vcell—cell voltage [V];
- EN—ideal voltage according to the Nernst equation [V];
- ηact—activation losses [V];
- ηohm—ohmic losses [V];
- ηconc—concentration losses [V].
The ideal voltage according to the Nernst equation is calculated as:
where
- E0(T)—standard voltage at temperature T [V];
- R—universal gas constant ();
- T—cell temperature [K];
- F—Faraday constant (96,485 C mol−1);
- —partial pressures of hydrogen, oxygen, and water vapor [atm].
The activation losses, in the Tafel approximation, are determined by:
where
- i—current density [A·m−2];
- i0—exchange current density [A·m−2];
- α—transfer coefficient (dimensionless).
Ohmic losses are determined by:
where
- Rmem—electrical resistance of the membrane [Ω];
- δmem—membrane thickness [m];
- σmem(T,λ)—membrane conductivity [S·m−1] depending on temperature T and degree of hydration λ;
- Aact—active area of the electrodes [m2].
Concentration losses are described by:
where
- n—number of electrons in the reaction (for H2, n = 2);
- ilim—limiting current density [A·m−2].
The power of a fuel stack with N number of fuel cells is determined by:
where
- Ncell—number of cells in the stack;
- Pgross—gross power [W].
The net power after deducting the auxiliary consumers with BOP is:
where Paux = κ0 + κ1. Pgross includes compressors, cooling, and control.
3.2. Hydrogen Consumption and Electrical Efficiency
The molar hydrogen consumption can be determined by:
where Uutil is the utilization coefficient. Mass flow rate . is the molar flow rate of hydrogen [mol·s−1];
For the hourly consumption, we get:
Net electrical efficiency:
For the CHP variant, the useful heat Qth should be added, and we calculate the total and we calculate the total (combined) efficiency as the ratio of net electric output plus useful heat to the chemical energy input of hydrogen.
3.3. Degradation and Reliability
The voltage of a fuel cell decreases over time according to:
where
- Vcell,0—initial voltage [V];
- γ1, γ2—degradation coefficients;
- Nstart/stop—number of on/off cycles;
- β—empirical parameter.
Degradation can also be determined by the reduction in Electrochemically Active Surface Area (ECSA), determined by:
Therefore, the conditions for stack replacement are at or .
The reliability of a fuel cell, described by a Weibull model, representing the probability that the cell will operate without failure up to a given time, is a classic tool in reliability analysis and is used to model the Mean Time Between Failures (MTBF) of systems such as PEMFC or SOFC fuel cells:
3.4. LCA Parameters and Impact Characterization
When assessing GWP, the following can be applied:
where
- GWPprod—emissions during production;
- (t)—mass consumption of hydrogen [kg];
- —emission factor of hydrogen [kgCO2e·kg−1];
- GWPEoL—emissions during end-of-life;
- GWPcredit—credits from recycling.
When using normalization to a functional unit, it can be written:
3.5. Technical and Economic Model (LCOE/COE)
Total present value of costs:
We can determine the electricity produced for the period:
A levelized price is:
If the focus is only on exploitation (purchased hydrogen):
and similarly for expenses: .
3.6. Optimization Statement
Objective 1 (environmental):
To minimize the GWP of the electricity produced [kgCO2e/kWh], taking into account downstream emissions of hydrogen (production, logistics/compression), operational contributions, and applicable credits from recycling and heat substitution in CHP mode. The objective is imposed as a threshold/target (regulatory or design) and guides the choice of H2 mix, setpoint, and heat integration so that the climate impact remains below the permissible level.
Objective 2 (economic):
To minimize the levelized cost of electricity (LCOE), including discounted CAPEX, Operating Expenditures (OPEX), fuel (H2), and stack replacement, assigned to the discounted energy. In CHP, the value of the useful heat is taken as a credit, which effectively lowers the LCOE. Since techno-economic objectives, such as efficiency, size/capital cost and hydrogen price, are usually in conflict with the environmental objective, solutions are sought on the Pareto front or through an ε-constraint approach (e.g., minimizing LCOE provided that GWP ≤ objective).
We acknowledge that the real-world degradation of PEMFCs often exhibits a two-phase pattern, with rapid initial performance loss followed by a slower, quasi-linear phase. In this study, a linear degradation model was used as a first-order approximation for long-term trends and simplicity in LCOE calculation. However, future extensions of the model could incorporate nonlinear degradation kinetics to more accurately reflect the early material restructuring observed in laboratory conditions.
4. Results
The optimization analysis was based on parametric simulations conducted using Python (version 3.10), incorporating electrochemical, thermal, and economic sub-models. The sweet spot was determined by evaluating the trade-off between net system efficiency and total LCOE across a grid of current densities, ranging from 0.1 to 1.0 A.cm−2. The model dynamically adjusted auxiliary loads as a function of output power, allowing identification of operating points that minimize energy cost while maintaining high efficiency.
The results presented in this section are organized to progressively explore the interplay between technical performance, economic viability, and environmental sustainability of fuel cell systems. Figure 2, Figure 3 and Figure 4 focus on the electrochemical performance and component-level characteristics, such as membrane behavior and catalyst loading. Figure 5, Figure 6, Figure 7, Figure 8 and Figure 9 address capital costs (CAPEX), hydrogen pricing, and the resulting Levelized Cost of Electricity (LCOE), including sensitivity analyses. Figure 10, Figure 11, Figure 12, Figure 13 and Figure 14 integrate multiple variables to identify operating regions that balance performance with cost and emissions. Finally, Figure 15, Figure 16, Figure 17 and Figure 18 present optimization results and scenario analyses, synthesizing insights to guide design and policy decisions. This structured approach ensures that each figure contributes to a cohesive understanding of system-level trade-offs and supports the conclusions of the study.

Figure 2.
V–I characteristic of a fuel cell and power density (I–P) curves.
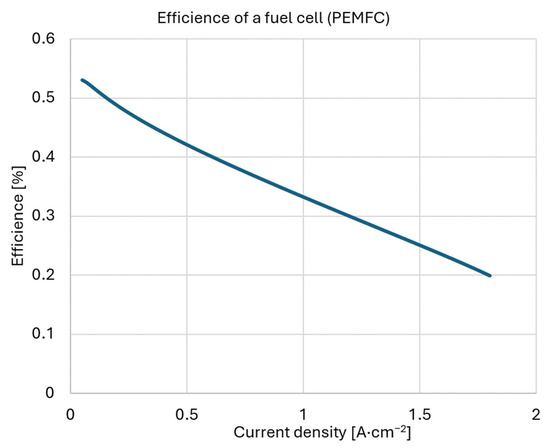
Figure 3.
Efficiency of a fuel cell (PEMFC).
This section presents numerical simulations of a PEMFC stack consisting of 350 cells, each with an active area of 200 cm2, operating at 80 °C. Figure 2 shows the V–I polarization curve and the power density (I–P) of a PEMFC fuel cell as a function of the current density i [A/cm2]. The cell voltage decreases monotonically with increasing i due to activation, ohmic, and concentration losses, and the power density curve has a clear maximum. The gross and net power densities Pgross and Pnet are shown; the difference between them reflects the auxiliary loads (BOP), which increase with load and reduce the net power output. From this curve, an operating point is determined near 50 kW net power, where the electrical efficiency varies from approximately 0.5 to 0.6, depending on the auxiliary system losses described in Equations (7) and (8).
Figure 3 presents the electrical efficiency of a PEMFC as a function of current density. A monotonic decrease in efficiency with increasing current is observed: from about 0.53 at low loads to approximately 0.20 at ~1.8 A·cm−2. This behavior is typical for fuel cells and reflects the increase in activation, ohmic, and concentration losses at high currents. Practical conclusion: the optimal operating region for high efficiency is at moderate current densities, where the trade-off between power and fuel consumption is most favorable.
The degradation analysis with a simplified linear cell voltage drop of 20 µV h−1 illustrates a smooth decrease in net power over 5000 h Figure 4 and Figure 5 determined by (13), which is consistent with expectations for transportation applications and highlights the importance of proper sizing and stack replacement schedule.

Figure 4.
Net power degradation.
Figure 4.
Net power degradation.


Figure 5.
Voltage degradation.
Figure 5.
Voltage degradation.

The system investment costs—CAPEX [Bulgarian lev (BGN)/kW], Figure 6 are studied in a wide range of ≈1200 ÷ 3200 BGN/kW determined by Equation (17). The dense “teeth” are from the connection of discrete levels of CAPEX and mean that for each value in this range, multiple scenarios are generated. This shows the provision of full coverage from low-budget to capital-intensive configurations.

Figure 6.
Sensitivity of the Levelized Cost of Electricity (LCOE) to hydrogen price and capital expenditure (CAPEX).
Figure 6.
Sensitivity of the Levelized Cost of Electricity (LCOE) to hydrogen price and capital expenditure (CAPEX).


Figure 7.
Parametric analysis of the relationship between hydrogen price, CAPEX, and resulting LCOE.
Figure 7.
Parametric analysis of the relationship between hydrogen price, CAPEX, and resulting LCOE.


Figure 8.
CHP mode power.
Figure 8.
CHP mode power.


Figure 9.
CHP modes are recoverable heat.
Figure 9.
CHP modes are recoverable heat.


Figure 10.
Overall efficiency at different degrees of heat recovery.
Figure 10.
Overall efficiency at different degrees of heat recovery.


Figure 11.
CHP mode of fuel cells.
Figure 11.
CHP mode of fuel cells.


Figure 12.
Total heat output at different degrees of heat recovery.
Figure 12.
Total heat output at different degrees of heat recovery.


Figure 13.
Overall efficiency at different flow rates.
Figure 13.
Overall efficiency at different flow rates.


Figure 14.
GWP of the generated electricity.
Figure 14.
GWP of the generated electricity.


Figure 15.
Tornado plot of GWP/kWh sensitivity.
Figure 15.
Tornado plot of GWP/kWh sensitivity.


Figure 16.
GWP contribution of generated electricity.
Figure 16.
GWP contribution of generated electricity.


Figure 17.
Breakdown of the Present Value (NPC).
Figure 17.
Breakdown of the Present Value (NPC).


Figure 18.
COE and LCOE price indicators.
Figure 18.
COE and LCOE price indicators.

LCOE shows the levelized cost of electricity, presented in Figure 7. LCOE—the total cost of the produced energy, normalized per kWh for the entire life cycle (including fuel and stack replacement, with discounting) determined by (19). In the considered scenarios, the values are approximately between 0.07 and 0.175 BGN/kWh, increasing with increasing H2 price. “The dense ‘teeth’ pattern arises from evaluating a range of discrete CAPEX values, each of which is combined with varying values of other input parameters (such as hydrogen price, efficiency, and system load). These combinations result in multiple simulated scenarios per CAPEX level, highlighting how sensitive the Levelized Cost of Electricity (LCOE) is to small variations in CAPEX and hydrogen price. This visual pattern reveals nonlinear behavior and helps identify optimal cost-performance regions.” The dynamic change is from connecting discrete points for different CAPEX levels. Figure 8 shows the relationship between current density and net electrical power of the system in CHP mode. A typical behavior is observed: the power increases with increasing current, reaches a maximum of about 1.5 A m2 (approximately 41 kW), and then begins to decrease. This indicates that at higher loads, the drop in cell voltage and the relative share of auxiliary consumers dominate, which reduces the output. The practical conclusion is that the recommended operating area is slightly to the left of the maximum, where the compromise between power, efficiency, and degradation stress is most favorable; in the presence of a heat demand, the position can be adjusted according to the possibilities for waste heat utilization.
Figure 9 presents the relationship between current density and available/recoverable heat in CHP mode. Four curves are shown: the total available waste heat (Q_waste) and the recoverable at 50%, 70% and 85%. A monotonic, accelerating rise in available heat with increasing current indicates a decline in electrical efficiency at high loads. At i ≈ 1.0 A.cm−2, the potentially recoverable heat is ~30/42/51 kW for 50%/70%/85% heat recovery, respectively; at i ≈ 1.7 A.cm−2 it reaches ~78/109/132 kW. The constant distance between the three curves reflects the proportional recovery concerning Q_waste. The practical conclusion is that the choice of operating point should be coordinated with the heat demand and the heat exchanger capacity/flow; In the case of a limited heating network, it is advisable to operate in the lower part of the range.
Figure 10 presents the overall efficiency in CHP mode (70/40 °C) at different degrees of heat recovery, the electrical efficiency (ηel), and three curves for eta_tot at 50%, 70% and 85% recovery are shown. It is observed that the electrical efficiency monotonically decreases with increasing current approximately from ~0.53 to ~0.20, while the overall efficiency remains high due to the heat share: at 85% it is from ~0.92 to ~0.88; at 70% it is ~0.86 to ~0.76; at 50% it is ~0.76 to ~0.60 in the considered range. This shows that CHP significantly mitigates the degradation of the system efficiency at high loads. In practice, in the presence of a stable heat demand and a 70/40 °C heating network, operation in a wide current range remains energy efficient (above 0.75 at ≥70% recovery), while with limited heat output, it is preferable to maintain lower current densities.
Figure 11 presents the fuel input power as a function of the current density in CHP mode. A strictly linear relationship is observed: with increasing current, the required hydrogen energy input increases proportionally. Linearity is an indicator of constant technological parameters (number of cells, active area, utilization factor) and confirms that the fuel availability and the H2 infrastructure should be sized linearly with the load.
Figure 12 presents the delivered heat power in CHP mode (70/40 °C) as a function of the current density at three coolant flow rates: . A typical network limitation is observed: at lower flow rates, the curves reach a plateau defined by the capacity of approximately ≈32 kW for 0.25 kg/s and ≈63 kW for 0.5 kg/s; the 1.0 limit is not reached in the considered range and the delivered heat increases with the current (up to about 110 kW at the highest values). This behavior shows that the actual heat yield is governed not only by the available waste heat but also by the hydraulic and temperature limitations of the system. To utilize larger heat flows at high loads, a larger flow rate and/or a larger temperature ramp, along with appropriately sized heat exchangers, are necessary.
Figure 13 presents the total efficiency ηtot in CHP mode (70/40 °C) at three coolant flow rates. It is observed that at low current densities, the three curves almost coincide, and the heat network does not limit the process. With increasing current, the curves for 0.25 and 0.5 kg/s reach the network capacity and drop sharply. For 0.25 kg/s, the total efficiency decreases approximately from ~0.82 to ~0.35, and for 0.5 kg/s, from ~0.80 to ~0.52 at the end of the range. At 1.0 kg/s, the limitation is not reached and only a smooth reduction is observed (≈0.85 to ≈0.76), i.e., the system retains high efficiency even at higher loads. To maintain ηtot ≥ 0.75 at high current densities, a flow rate ≥ 1.0 kg/s and/or a larger temperature ramp is required; at lower flow rates, optimal operation should shift to lower current densities.
Figure 14 presents the GWP of the electricity produced for three hydrogen origin scenarios: grey, blue, and green H2 determined by Equation (16). A clear drop in the impact is observed when moving from “grey” to “green” hydrogen: approximately 2.5 × 10⁻⁴ kgCO2e/kWh for grey H2, around 5 × 10⁻⁵ kgCO2e/kWh for blue H2, and close to 1 × 10⁻⁵ kgCO2e/kWh for green H2. This confirms that the H2 production pathway is the dominant factor for the climate impact of the system and that hydrogen decarbonization brings a GWP reduction of the order of ~5 times compared to the “grey” scenario.
Figure 15 presents a tornado plot of the sensitivity of GWP/kWh to the main parameters of the model determined by Equation (16). It is observed that the emission factor of H2 has the greatest influence—its variation (±20%) leads to the largest changes in the climate impact. The current density i and the hydrogen usability Uutil have a medium sensitivity (±10%): their increase increases the specific consumption of H2 and, respectively, GWP/kWh. The ohmic resistance Rasr, has a more limited effect, as it affects indirectly through the voltage and efficiency. The influence of the BOP base load (κ0) is negligible; its change almost does not change the GWP/kWh, because the operational footprint is dominated by the “upstream” emissions of H2, and not by the auxiliary consumers.
Figure 16 presents the GWP contribution of the produced electricity for the three hydrogen origin scenarios (grey, blue, green H2) determined by equation (16). The columns are stacked: the blue segment shows emissions from upstream H2 (production), and the orange segment shows emissions from logistics/compression. The dominance of the upstream component is observed in all cases: for grey H2 the total impact is ~2.7 × 10⁻⁴ kgCO2e/kWh, of which ~90% comes from production and ~10% from logistics; for blue H2 is ~5.5 × 10⁻⁵ kgCO2e/kWh (similar relative share); for green H2 is ~1.1 × 10⁻⁵ kgCO2e/kWh with minimal logistics contribution. The conclusion is that decarbonizing hydrogen production is a key lever for GWP reduction, while the effect of optimizing logistics/compression is of second importance.
Figure 17 presents the breakdown of the Net Present Cost (NPC) for the base case scenario of the model (CAPEX 2000 BGN/kW, H2 = 12 BGN/kg, 4000 h/yr, 10 years, 8% discount, stack replacement in year 6) determined by equation (17). The components CAPEX, OPEX, Present Value (PV), and stack replacement PV, the total NPC, as well as the discounted energy (E_disc_kWh), which serves as the denominator in the LCOE calculation, are shown. It is observed that the fixed items (CAPEX and OPEX) are relatively small compared to the total NPC, which implicitly indicates a dominant contribution of operational flows (fuel) to the costs.
Figure 18 summarizes the key price indicators for the same baseline scenario. The resulting values are LCOE ≈ 0.109 BGN/kWh and COE ≈ 0.085 BGN/kWh, with the higher LCOE reflecting the effect of discounting and the one-time stack replacement determined by (19). The two metrics provide a reference starting point for scenario and sensitivity analysis: a decrease in the price of H2 or CAPEX will directly affect the LCOE, while improvements in efficiency/operating point affect both the energy base (E_disc_kWh) and fuel costs.
5. Discussion
Simulations for a 350-cell PEMFC stack show the expected relationship between current density and cell voltage: with increasing load, ohmic and concentration losses dominate, leading to a drop in voltage and efficiency (Figure 2). The power curve (Figure 2) has a clear maximum, which defines a natural operating range, sufficiently high net power at acceptable efficiency and moderate auxiliary system (BOP) loading. The degradation scenario (Figure 3, Figure 4 and Figure 5) with a linear voltage drop illustrates that even moderate degradation rates lead to a noticeable loss of net power within a few thousand hours, reinforcing the need for optimization of the operating point and stack replacement policy.
A comparison of scenarios for “grey”, “blue”, and “green” hydrogen shows the typical trade-off: lower fuel cost for “grey” H2 leads to a lower LCOE, but the highest carbon footprint (GWP/kWh); “Green” H2 minimizes emissions but increases LCOE, other things being equal (Figure 14, Figure 15 and Figure 16). This dependence is strong because in the analyzed regime, fuel consumption is a leading component of total life cycle costs. From a practical point of view, this means that the transition to “green” H2 must be accompanied by policies to reduce its price (e.g., contracts for difference, guarantees of origin, and direct subsidies), otherwise the implementation will be delayed for economic reasons.
The sensitivity contour LCOE (CAPEX, H2 price) shows almost linear isolines in the considered range, which indicates an approximately additive effect of capital intensity and fuel price on the levelized price of electricity (Figure 17 and Figure 18). The isolines of “equal price” allow for a quick technical and economic diagnosis: for a given target LCOE (e.g., 0.10 ÷ 0.14 BGN/kWh), there are many combinations of CAPEX and H2 price that are equivalent. This is particularly useful in roadmap planning: if CAPEX cannot fall below a certain threshold in the short term, the project can remain economically viable at a lower H2 price and vice versa.
The addition of cogeneration CHP significantly increases the overall efficiency (Figure 8, Figure 9, Figure 10, Figure 11, Figure 12 and Figure 13). With 50 ÷ 85% of the available heat recovered, the overall efficiency can approach 80 ÷ 90% over a wide range of current densities, which improves the energy and economic performance of the system, especially in buildings and industrial applications with constant heat demand.
However, the results with temperature constraints 70/40 °C show that the heat carrier can become a dominant constraint: with insufficient flow rate or a small temperature difference ΔT, a significant part of the waste heat remains unused, which reduces the overall efficiency. The curves for the required flow rate clearly show that with increasing current density, the required flow rate increases. Therefore, thermal integration (sizing of heat exchangers, pumps, network temperatures, and control modes) is a critical element of the design optimization and is no less important than the electrochemical part.
Analytically ηtot = r + (1 − r) (at recovery r) shows that the maximum of the overall efficiency coincides with that of the electrical efficiency, when the heat network is not a constraint. In real conditions, however, temperature and hydraulic constraints limit the heat delivered, which shifts the optimum to lower current densities or requires an increase in or ΔT. This conclusion is essential for operational control: a strategy that simultaneously monitors electrical efficiency and the state of the heat network (flow/temperatures) is better than one that optimizes only the electrical Key Performance Indicator (KPI).
The degradation in the model is presented in a simplified manner, but clearly shows that choosing an operating point outside the zone of excessive concentration losses reduces the rate of voltage drop and hence the frequency of stack replacement. At the system level, the optimal replacement schedule is a function of the value of the energy lost due to degradation, the cost of a new stack and the price of H2, and the electricity that is replaced/sold. The presence of isolines for LCOE facilitates the reconciliation between reliability and economics: higher CAPEX but longer stack life can keep the LCOE in the target range at a sufficiently low H2 price.
Although the operational phase of “green” H2 has a minimal carbon footprint, production remains sensitive to materials (PGM catalysts, membranes, ceramics/metals). The role of recycling is twofold: it reduces the pressure on primary resources and provides emission “credits” that significantly improve the LCA score. Spent stack buy-back policies, standardized platinum extraction processes, and design for disassembly would improve both environmental and economic metrics.
For small and medium-sized enterprises (SMEs) and buildings with heat loads for most of the year, the CHP option is particularly attractive. In integrated PV/battery microgrids, the fuel cell can serve as a dispatchable source that:
- covers peak electrical loads at moderate current densities (maintaining high ηel);
- provides baseload heat supply by utilizing waste heat;
- reduces grid dependency at high prices or low reliability.
Sensitivity analysis helps to make “invest now vs. wait” decisions: if the expected price of “green” H2 drops below a certain threshold in the coming years, the project can be structured in stages, first with a more moderate CAPEX, then with a retrofit to more efficient stacks or lower carbon H2.
The model uses simplified dependencies for transmission limitations and degradation, does not consider humidity dynamics and local phenomena (mass transfer, inhomogeneities), and does not include full stochastics for H2 prices and load. In the CHP part, a detailed heat exchanger/hydraulics with pumping capacities and losses is not modeled. In future work, the following are recommended: stochastic uncertainty analysis (Monte-Carlo) for LCOE/GWP; detailed electrochemical model with diffusion/two-phase effects; joint optimization of the heat and power dispatcher with grid constraints (70/40 °C, ) and experimental validation of the calculations under real load profiles.
The results indicate that the following are key for accelerated deployment:
- Reducing the price of “green” H2 through long-term contracts, access to cheap RES electricity, and storage/logistics infrastructure;
- Capital support (investment grants, accelerated depreciation) that pushes isolines towards lower LCOE at given H2 prices;
- Stack take-back/recycling requirements with material flow tracking and secondary platinum credits.
6. Conclusions
The calculations for the PEMFC stack show a clear maximum of net power and a “sweet spot” operating zone at moderate current densities, in which the electrical efficiency is high and the losses in the auxiliary systems are limited. The sweet spot was identified in the range of 0.3–0.6 A/cm2, where a balance was achieved between high electrical efficiency (above 45%) and manageable parasitic losses. At lower current densities, efficiency is higher but power density is low; at higher values, auxiliary losses increase sharply due to cooling and compression needs. Operation close to the limiting current density worsens the voltage and accelerates the degradation.
The levelized cost of electricity (LCOE) is most sensitive to the price of hydrogen and CAPEX. In the considered scenarios, the LCOE varies approximately in the range of 0.06 ÷ 0.17 BGN/kWh, with the isolines in the plane (CAPEX, price of H2) demonstrating almost linear mutual compensation of the two factors.
The hydrogen source dominates the environmental performance. The transition from “grey” to “green” hydrogen leads to a more than tenfold reduction in specific emissions (GWP/kWh) under comparable operation [53].
The integration of CHP increases the overall efficiency to ~80 ÷ 90% with recovery of 50 ÷ 85% of the waste heat, which significantly improves the energy and economic efficiency in applications with stable heat demand.
The actual heat delivered is limited by the temperature regime (e.g., 70/40 °C) and the flow rate of the heat carrier. The required flow rate curves show a significant increase in requirements at higher current densities, which places demands on the sizing of heat exchangers and pumps.
In the absence of thermo-hydraulic constraints, the maximum of the overall efficiency coincides with that of the electrical one. In conditions of limited flow rate/ΔT, the optimal operating point shifts to lower current densities or requires an increase in and/or the temperature difference.
Even a moderate linear decrease in the cell voltage leads to a noticeable loss of net power within a few thousand hours. A planned stack replacement schedule integrated into the economic calculations (LCOE) is needed, with a minimum power/efficiency threshold.
Recycling of platinum group metals and design for disassembly provide emission and economic credits at the life cycle level and should be built into the design phase.
For buildings and SMEs, the highest value is achieved when integrating with RES and storage (PV/batteries), where fuel cells provide dispatchable electricity and baseload heat supply.
Accelerated deployment requires combined measures: lowering the price of “green” H2 (long-term contracts, guarantees of origin), capital support (grants, accelerated depreciation), and stack take-back/recycling standards.
The presented models simplify the transmission phenomena and degradation and do not include stochastic price/load dynamics. The following are recommended: uncertainty analysis (Monte Carlo) for LCOE/GWP; detailed electrochemical and thermo-hydraulic model for CHP; and joint optimization with real load profiles and experimental validation.
Author Contributions
P.S. and N.H. were involved in the full process of producing this paper, including conceptualization, methodology, modeling, validation, visualization and preparing the manuscript. All authors have read and agreed to the published version of the manuscript.
Funding
This work was supported by the European Regional Development Fund under the “Research In-novation and Digitization for Smart Transformation” program 2021–2027 under Project BG16RFPR002-1.014-0006 “National Centre of Excellence Mechatronics and Clean Technologies”, and the APC was funded by Project BG16RFPR002-1.014-0006.
Data Availability Statement
The original contributions presented in this study are included in the article. Further inquiries can be directed to the corresponding authos.
Acknowledgments
The present research has been carried out under the project BG16RFPR002-1.014-0006 “National Centre of Excellence Mechatronics and Clean Technologies”, funded by the Operational Programme Science and Education for Smart Growth. The obtained results have been processed and analyzed within the framework of the project BG-RRP-2.004-0005 “Improving the research capacity and quality to achieve international recognition and resilience of TU-Sofia (IDEAS)”, funded by the National Recovery and Resilience Plan of the Republic of Bulgaria.
Conflicts of Interest
The authors declare no conflicts of interest.
Abbreviations
The following abbreviations are used in this manuscript:
| BEV | Battery Electric Vehicle |
| BOP | Balance of Plant |
| CAPEX | Capital Expenditures |
| CCS | Carbon Capture and Storage |
| CHP | Combined Heat and Power |
| COE | Cost of Energy |
| ECSA | Electrochemically Active Surface Area |
| FC | Fuel Cell |
| FCEV | Fuel Cell Electric Vehicle |
| GWP | Global Warming Potential |
| LCA | Life Cycle Assessment |
| LCOE | Levelized Cost of Energy |
| MEA | Membrane–Electrode Assembly |
| MCFC | Molten Carbonate Fuel Cell |
| MTBF | Mean Time Between Failures |
| NPC | Net Present Cost |
| ICEs | Internal Combustion Engines |
| OPEX | Operating Expenditures |
| PEMFC | Proton Exchange Membrane Fuel Cell |
| PEM | Polymer Electrolyte Membrane |
| PGM | Platinum Group Metal |
| PM | Particulate Matter |
| Pt | Platinum |
| SOFC | Solid Oxide Fuel Cell |
| TEA | Techno-Economic Assessment/Analysis |
References
- Fontalvo, V.M.; Nelson, G.J.; Pupo-Roncallo, O.; Sanjuan, M.E.; Gómez, H.A. A techno-economic assessment for fuel cells hybrid systems in stationary applications. Int. J. Sustain. Energy 2023, 42, 889–912. [Google Scholar] [CrossRef]
- Puig-Samper, G.; Bargiacchi, E.; Iribarren, D.; Dufour, J. Life-cycle assessment of hydrogen systems: A systematic review and meta-regression analysis. J. Clean. Prod. 2024, 470, 143330. [Google Scholar] [CrossRef]
- Patil, V.; Reshmi, P.; Prajna, S.; Yashaswi, N.; Yashaswini, N.; Haleshappa, D.; Jayarama, A.; Pinto, R. Degradation mechanisms in PEM fuel cells: A brief review. Mater. Today Proc. 2023; in press. [Google Scholar] [CrossRef]
- Zhu, J.; Zhang, W.; Li, Y.; Yue, W.; Geng, G.; Yu, B. Enhancing CO2 catalytic activation and direct electroreduction on in-situ exsolved Fe/MnOx nanoparticles from (Pr,Ba)2Mn2−yFeyO5+δ layered perovskites for SOEC cathodes. Appl. Catal. B Environ. Energy 2019, 268, 118389. [Google Scholar] [CrossRef]
- Zhang, Y.; Xu, Y.; Gan, L. Exsolved metallic iron nanoparticles in perovskite cathode to enhance CO2 electrolysis. J. Solid State Electrochem. 2021, 26, 409–417. [Google Scholar] [CrossRef]
- Xu, M.; Liu, C.; Naden, A.B.; Früchtl, H.; Bühl, M.; Irvine, J.T.S. Electrochemical activation applied to perovskite titanate fibers to yield supported alloy nanoparticles for electrocatalytic application. Small 2022, 19, 2204682. [Google Scholar] [CrossRef]
- Sebbani, I.; Ettouhami, M.K.; Boulakhbar, M. Fuel Cells: A technical, environmental, and Economic outlook. Clean. Energy Syst. 2025, 10, 100168. [Google Scholar] [CrossRef]
- Kumuk, B.; Atak, N.N.; Dogan, B.; Ozer, S.; Demircioglu, P.; Bogrekci, I. Numerical and Thermodynamic Analysis of the Effect of Operating Temperature in Methane-Fueled SOFC. Energies 2024, 17, 2603. [Google Scholar] [CrossRef]
- Draz, U.; Di Bartolomeo, E.; Panunzi, A.P.; Laverdura, U.P.; Lisi, N.; Chierchia, R.; Duranti, L. Copper-Enhanced CO2 electroreduction in SOECs. ACS Appl. Mater. Interfaces 2024, 16, 8842–8852. [Google Scholar] [CrossRef]
- Roy, D.; Samanta, S.; Roy, S.; Smallbone, A.; Roskilly, A.P. Technoeconomic and environmental performance assessment of solid oxide fuel cell-based cogeneration system configurations. Energy 2024, 310, 133145. [Google Scholar] [CrossRef]
- Yu, Y.; Guo, Y.; Ma, T. Prioritizing the hydrogen pathways for fuel cell vehicles: Analysis of the life-cycle environmental impact, economic cost, and environmental efficiency. Energy 2023, 281, 128322. [Google Scholar] [CrossRef]
- Wittstock, R.; Pehlken, A.; Wark, M. Challenges in Automotive Fuel Cells Recycling. Recycling 2016, 1, 343–364. [Google Scholar] [CrossRef]
- Sun, X.; Simonsen, S.; Norby, T.; Chatzitakis, A. Composite Membranes for High Temperature PEM fuel cells and Electrolysers: A Critical review. Membranes 2019, 9, 83. [Google Scholar] [CrossRef] [PubMed]
- Napoli, R.; Gandiglio, M.; Lanzini, A.; Santarelli, M. Techno-economic analysis of PEMFC and SOFC micro-CHP fuel cell systems for the residential sector. Energy Build. 2015, 103, 131–146. [Google Scholar] [CrossRef]
- Abokhalil, A.G.; Alobaid, M.; Makky, A.A. Innovative Approaches to Enhance the Performance and Durability of Proton Exchange Membrane Fuel Cells. Energies 2023, 16, 5572. [Google Scholar] [CrossRef]
- Eikeng, E.; Makhsoos, A.; Pollet, B.G. Critical and strategic raw materials for electrolysers, fuel cells, metal hydrides and hydrogen separation technologies. Int. J. Hydrogen Energy 2024, 71, 433–464. [Google Scholar] [CrossRef]
- Sarathy, S.M.; Nagaraja, S.S.; Singh, E.; Cenker, E.; Amer, A. Review of life cycle assessments (LCA) for mobility powertrains. Transp. Eng. 2022, 10, 100148. [Google Scholar] [CrossRef]
- Latapí, M.; Davíðsdóttir, B.; Jóhannsdóttir, L. Drivers and barriers for the large-scale adoption of hydrogen fuel cells by Nordic shipping companies. Int. J. Hydrogen Energy 2022, 48, 6099–6119. [Google Scholar] [CrossRef]
- Madhav, D.; Wang, J.; Keloth, R.; Mus, J.; Buysschaert, F.; Vandeginste, V. A Review of Proton Exchange Membrane Degradation Pathways, Mechanisms, and Mitigation Strategies in a Fuel Cell. Energies 2024, 17, 998. [Google Scholar] [CrossRef]
- Awad, M.; Bouabid, A.; Almansoori, A.; AlHajaj, A. Analysis of CO2 emissions reduction on the future hydrogen supply chain network for Dubai buses. Int. J. Hydrogen Energy 2023, 54, 256–266. [Google Scholar] [CrossRef]
- Ventayol, A.A.; Lam, J.S.L.; Bai, X.; Chen, Z.S. Comparative life cycle assessment of hydrogen internal combustion engine and fuel cells in shipping. Int. J. Hydrogen Energy 2025, 109, 774–788. [Google Scholar] [CrossRef]
- Wang, J.; Wang, H.; Fan, Y. Techno-Economic challenges of fuel cell commercialization. Engineering 2018, 4, 352–360. [Google Scholar] [CrossRef]
- Hawkes, A.; Brett, D.; Brandon, N. Fuel cell micro-CHP techno-economics: Part 1—Model concept and formulation. Int. J. Hydrogen Energy 2009, 34, 9545–9557. [Google Scholar] [CrossRef]
- Chu, T.; Xie, M.; Yu, Y.; Wang, B.; Yang, D.; Li, B.; Ming, P.; Zhang, C. Experimental study of the influence of dynamic load cycle and operating parameters on the durability of PEMFC. Energy 2021, 239, 122356. [Google Scholar] [CrossRef]
- Chong, J.W.; Hanafiah, M.M. A review of life cycle assessment for fuel cell technologies: Advancing clean energy and climate solutions. Energy Rep. 2025, 13, 6548–6565. [Google Scholar] [CrossRef]
- Mori, M.; Iribarren, D.; Cren, J.; Cor, E.; Lotrič, A.; Gramc, J.; Drobnič, B.; Rey, L.; Campos-Carriedo, F.; Puig-Samper, G.; et al. Life cycle sustainability assessment of a proton exchange membrane fuel cell technology for ecodesign purposes. Int. J. Hydrogen Energy 2023, 48, 39673–39689. [Google Scholar] [CrossRef]
- Heidary, H.; El-Kharouf, A.; Steinberger-Wilckens, R.; Bozorgmehri, S.; Salimi, M.; Golmohammad, M. Life cycle assessment of solid oxide fuel cell vehicles in a natural gas producing country; comparison with proton electrolyte fuel cell, battery and gasoline vehicles. Sustain. Energy Technol. Assess. 2023, 59, 103396. [Google Scholar] [CrossRef]
- Burchart, D.; Przytuła, I. Review of Environmental Life cycle Assessment for fuel cell electric vehicles in road transport. Energies 2025, 18, 1229. [Google Scholar] [CrossRef]
- Todorov, G.; Kamberov, K.; Todorov, T. Thermodynamic Analysis and Optimization of a Regenerative Heat Exchange System for Solid Oxide Electrolyzer-Based Hydrogen Production. Energies 2025, 18, 4424. [Google Scholar] [CrossRef]
- Spreafico, C. Prospective life cycle assessment to support eco-design of solid oxide fuel cells. Int. J. Sustain. Eng. 2024, 17, 379–396. [Google Scholar] [CrossRef]
- Khanna, D.; Gemechu, E.; Mahbub, N.; Joy, J.; Kumar, A. Assessment of life cycle environmental impacts of materials, driving pattern, and climatic conditions on battery electric and hydrogen fuel cell vehicles in a cold region. Environ. Impact Assess. Rev. 2024, 110, 107680. [Google Scholar] [CrossRef]
- Chen, Y.; Guo, W.; Ngo, H.H.; Chen, Z.; Wei, C.; Bui, X.T.; Van Tung, T.; Zhang, H. Ways to assess hydrogen production via life cycle analysis. Sci. Total Environ. 2025, 977, 179355. [Google Scholar] [CrossRef]
- Salim, K.M.A.; Maelah, R.; Hishamuddin, H.; Amir, A.M.; Ab Rahman, M.N. Two Decades of Life Cycle Sustainability Assessment of Solid Oxide Fuel Cells (SOFCs): A Review. Sustainability 2022, 14, 12380. [Google Scholar] [CrossRef]
- Maniscalco, M.P.; Longo, S.; Cellura, M.; Miccichè, G.; Ferraro, M. Critical Review of Life Cycle Assessment of Hydrogen Production Pathways. Environments 2024, 11, 108. [Google Scholar] [CrossRef]
- Al-Khori, K.; Al-Ghamdi, S.G.; Boulfrad, S.; Koç, M. Life Cycle Assessment for Integration of Solid Oxide Fuel Cells into Gas Processing Operations. Energies 2021, 14, 4668. [Google Scholar] [CrossRef]
- Lyu, R.; Wang, Z.; Zhang, Z. Life Cycle Assessment Based on Whole Industry Chain Assessment of FCEVs. Sustainability 2025, 17, 5431. [Google Scholar] [CrossRef]
- Kombargi, N.A.; Bao, B.; Ellis, E.; Hart, D.P. Life-cycle assessment and cost analysis of hydrogen production via aluminum-seawater reactions. Cell Rep. Sustain. 2025, 2, 100407. [Google Scholar] [CrossRef]
- Spreafico, C. Prospective Life Cycle Assessment (LCA) of Future Solid Oxide Fuel Cells (SOFC). SSRN Electron. J. 2023, 4574065. [Google Scholar] [CrossRef]
- Teng, Z.; Tan, C.; Liu, P.; Han, M. Analysis on carbon emission reduction intensity of fuel cell vehicles from a life-cycle perspective. Front. Energy 2023, 18, 16–27. [Google Scholar] [CrossRef]
- Mori, M.; Stropnik, R.; Sekavčnik, M.; Lotrič, A. Criticality and Life-Cycle Assessment of Materials Used in Fuel-Cell and Hydrogen Technologies. Sustainability 2021, 13, 3565. [Google Scholar] [CrossRef]
- Osman, A.I.; Nasr, M.; Mohamed, A.R.; Abdelhaleem, A.; Ayati, A.; Farghali, M.; Al-Muhtaseb, A.H.; Al-Fatesh, A.S.; Rooney, D.W. Life cycle assessment of hydrogen production, storage, and utilization toward sustainability. WIREs Energy Environ. 2024, 13, e526. [Google Scholar] [CrossRef]
- Pourrahmani, H.; Xu, C.; Van Herle, J. The thermodynamic and life-cycle assessments of a novel charging station for electric vehicles in dynamic and steady-state conditions. Sci. Rep. 2023, 13, 11159. [Google Scholar] [CrossRef]
- Syré, A.M.; Shyposha, P.; Freisem, L.; Pollak, A.; Göhlich, D. Comparative Life Cycle Assessment of Battery and Fuel Cell Electric Cars, Trucks, and Buses. World Electr. Veh. J. 2024, 15, 114. [Google Scholar] [CrossRef]
- Rinawati, D.I.; Keeley, A.R.; Takeda, S.; Managi, S. Life-cycle assessment of hydrogen utilization in power generation: A systematic review of technological and methodological choices. Front. Sustain. 2022, 3, 920876. [Google Scholar] [CrossRef]
- Kim, H.; Kim, D.; Hur, T. Life cycle assessment of molten carbonate fuel cell system for power plants. J. Clean. Prod. 2021, 302, 126911. [Google Scholar] [CrossRef]
- Mehmeti, A.; Santoni, F.; Della Pietra, M.; McPhail, S.J. Life cycle assessment of molten carbonate fuel cells: State of the art and strategies for the future. J. Power Sources 2016, 308, 97–108. [Google Scholar] [CrossRef]
- Bauer, T.; Singh, K.; Mandil, G.; Svecova, L.; Dubau, L. Identification of the environmental hotspots of a recycling process—Case study of a Pt PEMFC catalyst closed-loop recycling system evaluated via life cycle assessment methodology. Int. J. Hydrogen Energy 2024, 63, 396–410. [Google Scholar] [CrossRef]
- Duclos, L.; Lupsea, M.; Mandil, G.; Svecova, L.; Thivel, P.; Laforest, V. Environmental assessment of proton exchange membrane fuel cell platinum catalyst recycling. J. Clean. Prod. 2016, 142, 2618–2628. [Google Scholar] [CrossRef]
- Staffell, I.; Ingram, A. Life cycle assessment of an alkaline fuel cell CHP system. Int. J. Hydrogen Energy 2010, 35, 2491–2505. [Google Scholar] [CrossRef]
- Mallick, R.; Vairakannu, P. Life cycle assessment of plasma gasification integrated molten carbonate fuel cell and chemical looping reforming using RDF feedstock. Sustain. Energy Fuels. 2024, 9, 627–639. [Google Scholar] [CrossRef]
- Uekert, T.; Wikoff, H.M.; Badgett, A. Electrolyzer and fuel cell recycling for a circular hydrogen economy. Adv. Sustain. Syst. 2023, 8, 2300449. [Google Scholar] [CrossRef]
- Lunghi, P.; Bove, R. Life cycle assessment of a molten carbonate fuel cell stack. Fuel Cells 2003, 3, 224–230. [Google Scholar] [CrossRef]
- Todorov, G.; Kralov, I.; Koprev, I.; Vasilev, H.; Naydenova, I. Coal Share Reduction Options for Power Generation during the Energy Transition: A Bulgarian Perspective. Energies 2024, 17, 929. [Google Scholar] [CrossRef]


Disclaimer/Publisher’s Note: The statements, opinions and data contained in all publications are solely those of the individual author(s) and contributor(s) and not of MDPI and/or the editor(s). MDPI and/or the editor(s) disclaim responsibility for any injury to people or property resulting from any ideas, methods, instructions or products referred to in the content. |
© 2025 by the authors. Licensee MDPI, Basel, Switzerland. This article is an open access article distributed under the terms and conditions of the Creative Commons Attribution (CC BY) license (https://creativecommons.org/licenses/by/4.0/).