Abstract
Glyphosate (N-(phosphonomethyl) glycine) (GPS) is currently the most commonly used herbicide worldwide, and is generally considered as immobile in soils. However, numerous reports of the environmental occurrence of the herbicide coupled with recent evidence of human toxicity necessitate further investigation as to the behavior of GPS in the soil environment. Batch sorption studies along with miscible displacement experiments were carried out in order to assess the mobility of GPS in two Louisiana agricultural soils; Commerce silt loam and Sharkey clay. Batch results indicated a high affinity of both soils for solvated GPS, with greater affinity observed by the Sharkey soil. GPS sorption in the Commerce soil was most likely facilitated by the presence of amorphous Fe and Al oxides, whereas the high cation exchange capacity of the Sharkey soil likely allows for GPS complexation with surface exchangeable poly-valent cations. Miscible displacement studies indicate that GPS mobility is highly limited in both soils, with 3% and 2% of the applied herbicide mass recovered in the effluent solution from the Commerce and Sharkey soils, respectively. A two-site multi-reaction transport model (MRTM) adequately described GPS breakthrough from both soils and outperformed linear modeling efforts using CXTFIT. Analysis of extracted herbicide residues suggests that the primary metabolite of GPS, aminomethylphosphonic acid (AMPA), is more mobile in both soils, although both compounds are strongly retained.
1. Introduction
Glyphosate (N-(phosphonomethyl) glycine) (GPS) is the active ingredient in several herbicidal formulations and is the most widely used herbicide in the world. Such widespread use can be attributed to the compound’s high weed killing efficiency coupled with its incorporation in agricultural systems utilizing Roundup ready cultivars. Although generally regarded as relatively immobile in soils, several investigations indicate that GPS transport from application sites to the surrounding environment is significant [,,,]. These results coupled with recent evidence of human toxicity [,,,] require further investigation into the mobility of GPS in soils.
Several field studies have been conducted in order to assess the potential for GPS leaching in agricultural settings. Kjær et al. [] conducted an eight-month field trial to assess GPS mobility and detected the herbicide in tile-drained leachates at concentrations that exceeded European Union maximum admissible levels for up to seven days after rainfall events, which the authors attributed to macropore transport. Tiles were located one meter below the ground surface in an area with a shallow water table (1–3 m below the surface), thus it was concluded that well developed soil structure could allow strongly sorbed solutes to contaminate shallow groundwater. GPS contamination of groundwater was also reported by Torstensson et al. [], the magnitude of which was related to application rate, although the majority of applied herbicide was retained in the upper 30 cm of the soil profile. Additionally, Strange-Hansen et al. [] reported leachate concentrations of up to 1300 µg L−1 from various types of gravel commonly used in surfacing applications in Denmark. Despite evidence of GPS mobility in field soils, several studies have indicated very limited leaching potentials. Conducting a lysimeter study over the course of 748 days, Bergström et al. [] recovered only 0.009–0.019% of applied GPS in leachates taken at 1 m below the surface despite high precipitation amounts shortly after application, and Al-Rajab et al. [] recovered only 0.28% of the applied amount from 25 cm below the surface over an 11 month period. It is therefore implied that leaching potential in a field situation is highly dependent upon soil type and structure, a conclusion that is in agreement with others [,].
In order to gain insight upon the physiochemical mechanisms that dictate GPS transport through soils, laboratory studies coupled with numerical modeling have been undertaken. To assess the effect of the pore water velocity, and therefore indirectly the effect of chemical kinetics, Beltran et al. [] obtained GPS breakthrough curves from a sandy soil at different flow rates. The authors applied a model that incorporated a time dependent Fruendlich-type partitioning coefficient to the observed data and concluded that adsorption was limited by diffusion processes. Candela et al. [] applied a two-site model that accounted for equilibrium and kinetic sites along with a first order sink and was able to successfully describe GPS breakthrough from two soils. It was subsequently determined that GPS sorption is a kinetic process dependent on pore-water velocities. Magga et al. [] applied a similar model along with additional terms to estimate microbial biomass dynamics, which yielded a reasonable description of GPS breakthrough from an agricultural soil from Western Greece. Additionally, Zhou et al. [] applied a two-site model accounting for kinetic and irreversible reactions to GPS breakthrough data, however, limitations on the extent of the observed data make it difficult to assess the performance of the model.
The maximum admissible level of GPS in drinking water is 700 µg L−1 according to water quality standards dictated by the US Environmental Protection Agency (EPA) []. In the European Union, concentrations for any single pesticide are not to exceed 0.1 µg L−1, while total pesticide concentrations are not to exceed 0.5 µg L−1 []. The different water quality standards are attributed to varying policies. The European Union uniformly applies water quality standards to all pesticides, whereas the EPA sets limits specific to individual compounds based on toxicity study results.
The goals of this study were (1) to quantify GPS breakthrough from two Louisiana agricultural soils; (2) describe observed data using linear as well as non-linear kinetic modeling; and (3) characterize the distribution of GPS and its primary metabolite AMPA in both soils.
2. Methods
2.1. Soils
In this study, experiments were carried out on two soils of varying physiochemical properties. The first soil, Commerce silt loam, is a fine silty, mixed superactive, thermic Fluvaquentic Endoaquept formed from alluvial deposits on the flood plains of the Mississippi River in the Southeastern United States. This soil is characterized as deep, somewhat poorly drained with moderately slow permeability. Soil specifically used in this study was sampled from the surface horizon (0–5 cm) from the LSU AgCenter Sugarcane Research Station located in St. Gabriel, Louisiana (12 miles south of Baton Rouge). The second soil used in the experiments was Sharkey clay, which is classified as a very fine, smectitic, thermic Chromic Epiaquert. This soil formed from clayey alluvial deposits on low terraces of the Mississippi River and was sampled from the surface horizon (0–5 cm) near Iberville Parish, Louisiana. Soils were air dried and made to pass through a 2 mm sieve prior to experiments. Selected physiochemical properties of both soils are given in Table 1.

Table 1.
Select physiochemical properties of the soils used in this study.
2.2. Sorption
The quantification of the sorption of GPS in the two different soils was carried out following the batch technique described by Selim []. Three grams of soil were weighed into a 40 mL Teflon centrifuge tube and 30 mL of GPS solution at an initial concentration of either 1, 2, 5, 10, or 20 mg L−1 were added to each tube. Input solutions were spiked with 14C labeled GPS (phosphonomethyl group) such that the initial radioactivity of each solution was approximately 1.67 × 10² Bq mL−1. Radiolabeled GPS was purchased from American Radiolabeled Chemicals, St. Louis, MO. All solutions were prepared in 5 mM CaCl2 in order to maintain constant ionic strength. Each initial concentration treatment was repeated in triplicate. Soil/solution mixtures were then individually vortexed for ten seconds and immediately transferred to a platform shaker and were continuously shaken for 24 h. Following this, tubes were removed from the shaker and centrifuged at 5000 rpm for ten minutes. A 1 mL aliquot of supernatant solution was then transferred to a 7 mL scintillation vial whereupon 4 mL of scintillation cocktail (Packard Ultima Gold) were added, and mixtures were subsequently vortexed until thoroughly homogenized. Samples were analyzed on a liquid scintillation counter (LSC) (Perkin Elmer TriCarb 4810 TR, Waltham, MA, USA) using five minute count times. No quench correction was made and radioactivity was recorded as counts per minute. GPS concentrations were determined by the relative radioactivity of the sample to that of the input solution. The amount of sorbed GPS was calculated as the difference between supernatant and initial concentrations.
2.3. Miscible Displacement Studies
In order to investigate the transport behavior of GPS in soils, miscible displacement experiments as described by Selim [] were carried out. Acrylic columns (10 cm length, 6.4 cm inner diameter) were uniformly packed with air dried homogenized soil. Columns were then slowly saturated with 5 mM CaCl2 by upward flow supplied by a variable speed piston displacement pump (Fluid Metering Inc., Syosset, NY, USA). Once a steady state flow regime was established, an approximately 10 pore volume pulse of 50 mg L−1 GPS was applied to the column and was then subsequently leached with 5 mM CaCl2 solution. Effluent was collected with an ISCO Retriever II fraction collector (Teledyne Isco Inc., Lincoln, NE, USA) and GPS concentration in solution was determined by LSC as described above. The pH of the effluent solution was monitored throughout the duration of the experiments. Immediately following the termination of experiments, columns were sectioned into 1 cm increments and residual GPS was extracted from subsamples in duplicate following a modified version of the method described by Miles and Moye []. Three grams of dried soil were weighed into a 40 mL Teflon centrifuge tube and 30 mL of 0.2 M KOH were then added. Tubes were shaken for 24 h and supernatants were sampled and analyzed for radioactivity by LSC as described previously. In an effort to quantify the degradation of GPS in the sorbed phase, concentrations of GPS and AMPA in the extracting solution were also determined by UPLC-MS/MS.
In order to obtain independent estimates of the hydrodynamic dispersion coefficient D, a physical parameter unique to an individual soil column, a one pore volume pulse of tritiated water (3H2O) was applied to each column prior to the application of GPS pulses and subsequently leached with the background solution. Radioactivity of the effluent solution was determined by LSC in a manner identical to that of GPS. Breakthrough curves were modeled using the CXTFIT model [] in the inverse mode, within the STANMOD software package to obtain estimates for D. Physical parameters for transport experiments are given in Table 2.
Table 2.
Physical parameters for miscible displacement experiments.
2.4. UPLC-MS/MS Analysis
As both GPS and AMPA molecules have the 14C labeled phosphonomethyl group, LSC analysis alone cannot discriminate between the two compounds. To do this, samples of extracting solution were analyzed using UPLC-MS/MS with a pre-column derivatization and solid phase extraction (SPE) clean-up procedure.
Fluorescent derivatives of GPS and AMPA were obtained through the labeling of the amine group with 9-fluorenylmethyl chloroformate (FMOC). This was done by combining 1 mL aliquots of supernatant or extract solution with 0.5 mL 5% borate solution and 0.5 mL of 3% FMOC in acetonitrile. This mixture was vortexed and allowed to incubate at room temperature for 30 min. To stop the derivatization reaction, 5 mL of 1% KH2PO4 adjusted to a pH of 3 using 6 N HCl (pH 3 water) was added to each mixture. These were subsequently vortexed and then centrifuged for 5 min at 3500 rpm to separate any potential precipitates.
Derivatitized samples then underwent an SPE clean-up protocol. SPE columns (Oasis HLB 3cc 60 mg cartridge) were placed into a vacuum manifold set-up and conditioned with 3 mL of methanol, followed by 3 mL of deionized water, followed by 3 mL of pH 3 water. Derivatized, centrifuged samples were then loaded onto the column. After the full volume of the sample had been eluted through the cartridge, 5 mL of pH 3 water was applied, and the column was allowed to dry under full vacuum for 30 min. Derivatized GPS and AMPA were then eluted with 7 mL of methanol into 15 mL polypropylene centrifuge tubes. Tubes were then transferred to a 50 °C water bath and were brought to dryness under a stream of N2. The resulting precipitates were then reconstituted with 1 mL of deionized water and filtered through a 0.2 µm PVDF syringe driven filter into auto-sampler vials for UPLC-MS/MS analysis.
Concentrations of GPS and AMPA were quantified using a Waters UPLC-MS/MS (TQD) instrument with Waters MassLynx software. Chromatographic separation was achieved with a Waters Acquity UPLC BEH C18 2.1 × 50 mm 1.7 µm particle column operated at 30 °C with a flow rate of 0.30 mL min−1. Mobile phases of 5 mM ammonium acetate and UPLC grade acetonitrile were applied to the column using a gradient flow protocol. Sample injection volumes were 10 µL and expected retention times for GPS and AMPA were 1.06 and 1.23 min, respectively.
The mass spectrometer was operated with electrospray in the negative-ion mode. The electrospray capillary was set to 2.9 kV and the extractor cone was operated at 2.00 V. The source temperature was set to 110 °C and the desolvation temperature was set at 350 °C. The desolvation gas was nitrogen (500 L h−1) and the collision gas was argon (0.20 mL min−1). The multiple reaction monitoring mode of the degradation patterns m/z 390.9 → 167.9 (GPS) and 332.2 → 109.8 (AMPA) were used for quantification. For verification, the degradation patterns m/z 390.9 → 149.8 (GPS) and 332.1 → 135.9 (AMPA) were used.
2.5. Modeling
2.5.1. Sorption Model
The quantification of the behavior of solutes within reactive matrices commonly employs the use of equilibrium isotherm models in order to partition between sorbed and solution phases. One extensively used model is the Freundlich isotherm, expressed in Equation (1) []:
where S is the sorbed concentration (mg kg−1), Kf is the Freundlich distribution coefficient (Ln mg1−n kg−1), C is the solution concentration (mg L−1), and n is a dimensionless coefficient commonly less than 1.
2.5.2. Linear Modeling
Quantifying the transport and ultimate fate of contaminants in soils and groundwater provides a basis for determining their potential environmental hazard. The results of laboratory miscible displacement studies offer insight upon the physiochemical mechanisms that dictate the behavior of solutes in the subsurface environment and, thus, supply investigators with an initial idea as to the movement of chemicals in a natural or field situation. These studies are critical, as they guide management decisions to maintain the viability of soil and water resources.
The movement of non-reactive solutes in the subsurface is contingent upon three dominant mechanisms []. Convective transport of mass refers to transport of a dissolved chemical along with the pore water as it moves through a soil profile, the magnitude of which is a function of the pore water velocity determined by Darcy’s Law. Another important mechanism is mass flux induced by local concentration gradients, commonly referred to as molecular diffusion and governed by Fick’s Law. This is an active process regardless of whether or not there is a net water flux in the system. The final transport mechanism is dispersion, which is the mixing of the soil solution that is not attributed to molecular diffusion. In soils and geological media, this is brought about by a non-homogenous distribution of flow velocities attributed to the pore size distribution, path length fluctuation (tortuosity), and a flow velocity gradient across the width of a conducting pore (Poiseuille’s Law) []. Consideration of all three of these processes coupled with mass balance yields the following equation for the transport of a non-reactive solute in one dimension []:
where (cm3 cm−1) is the volumetric water content, (mg L−1) is the solution concentration, (cm2 h−1) is the hydrodynamic dispersion coefficient, and (cm3 cm−2 h−1) is the water flux density in the x direction.
In addition to the transport mechanisms discussed above, the behavior of a reactive solute in the subsurface environment is complicated by chemical interactions with the porous matrix. If it is assumed that solute mass within the solution and solid phases are at an instantaneous chemical equilibrium via a linear partitioning coefficient, the one-dimensional transport of a reactive solute is given by the linear convection-dispersion equation []:
where R is a dimensionless retardation factor, (cm h−1) is the pore water velocity (), (g cm−3) is the matrix bulk density, (L kg−1) is the linear partitioning coefficient, (h−1) is the rate coefficient associated with the term which represents a first-order sink within the system. This can be interpreted as irreversible or precipitation reactions, or mass loss from the system due to degradation or volatilization. For conservative solutes, this term is taken as zero. Analytical solutions satisfying a number of initial and boundary conditions are given by Toride et al. [] and incorporated into the CXTFIT model within the STANMOD software package [].
2.5.3. Multi-Reaction and Transport Model
As physiochemical heterogeneity is inherent in soil systems, it is reasonable to expect that a solvated chemical interacts with the soil matrix via a variety of different mechanisms. As such, several approaches to describe solute retention by soils involving the use of multi-reaction models have been introduced [,]. Presented here is the nonlinear multi-reaction model put forth by Selim and Amacher []. Features of this model are that mass exchanges between solution and solid phases can be conceptualized as a system of various retention mechanisms, including non-linear equilibrium and kinetic reactions, along with first-order irreversible sinks. A schematic representation of the conceptualized system is displayed in Figure 1.
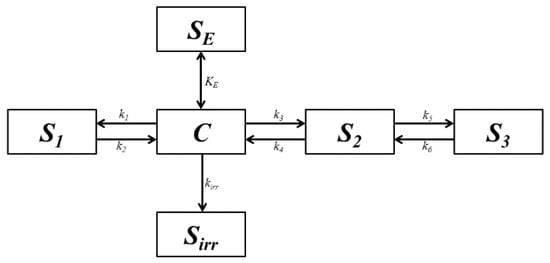
Figure 1.
A schematic conceptualization of the nonlinear multi-reaction model with equilibrium and kinetic reversible sites and kinetic irreversible sites.
Figure 1 implies a system consisting of three general types of reactive sites: (1) equilibrium sites; (2) reversible kinetic sites; and (3) irreversible kinetic sites. Equilibrium sites are always at chemical equilibrium with the solution phase via the partitioning coefficient KE, which is analogous to the Freundlich partitioning coefficient Kf. Reversible kinetic sites are characterized by fractional order kinetics, except for first order kinetics associated with , described by forward and backward rate coefficients. The third type of reactive site is irreversible, where sorption is considered a first-order kinetic process. These types of sites act as a sink for mass within the system, and may be interpreted as inner-sphere complexation or precipitation reactions. The multi-reaction model can be expressed mathematically as a system of differential equations where equilibrium and kinetic sites are given as []:
where (mg kg−1) is the sorbed concentration within the equilibrium sites, , , and (mg kg−1) are the sorbed concentrations within kinetic sites, (mg kg−1) is the sorbed concentration within irreversible sites, (L kg−1) is the equilibrium partitioning coefficient, , , , , , , and (h−1) are rate coefficients, n, m and b are reaction orders, is the volumetric water content (cm3 cm−3) and is the bulk density of the reactive matrix (g cm−3). Given this grouping of reactive sites, the total mass (mg kg−1) in the sorbed phase is expressed as []:
Incorporation of Equations (5)–(9) into Equation (2) yields the multi-reaction transport model (MRTM) describing reactive solute transport under steady-state water flow conditions ( and are spatial and temporal constants within the system) []:
where (mg kg−1) is the solid phase concentration given by Equation (10). In order to simulate measured GPS break through curves, best-fit parameter values are obtained via a least-squares optimization procedure. Criteria for evaluating model performance are the coefficient of determination (r2) and the root mean squared error (RMSE) given by Equation (12) []:
where RSS is the residual sum of squares, N is the number of observations and P is the number of fitted parameters.
3. Results and Discussion
3.1. Sorption
The sorption isotherms of GPS in both soils are displayed in Figure 2 with optimized values of Freundlich coefficients given in Table 3. In general, measured data are well described by the Freundlich model (coefficient of determination values >0.99 in both cases). Optimized values for the Kf coefficient are 158.2 and 395.7 Ln mg1−n kg−1 for the Commerce and Sharkey soil, respectively. These values are indicative of a high affinity of GPS for both matrices and are consistent with those obtained from similar studies performed on a variety of different soils [,,].
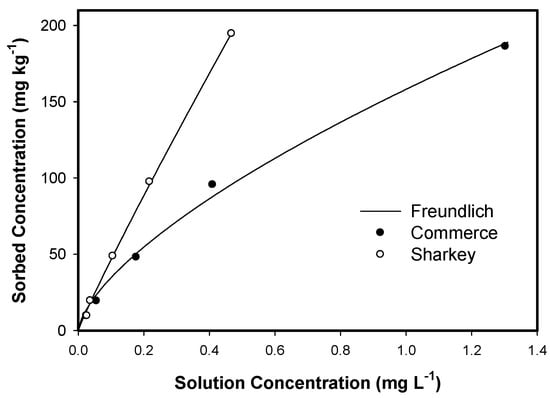
Figure 2.
Measured and fitted Freundlich isotherms of GPS sorption onto Commerce and Sharkey soil.
Table 3.
Optimized values of Freundlich coefficients for GPS sorption onto Commerce and Sharkey soils.
The Freundlich isotherm for the Commerce soil is characterized as highly non-linear (n = 0.66), suggesting a more heterogeneous distribution of site affinities across the range of input concentrations. Because interactions between the solute and high affinity sites are, by definition, more thermodynamically favorable than interactions involving low affinity sites, high affinity sites are occupied first. As these sites are filled, interactions among less energetically favorable sites predominate. This effectively reduces the overall affinity of the reactive matrix with increased GPS loading, resulting in reduced “rates” of partitioning at higher input concentrations. The strong retentive behavior of this soil can be attributed to its relatively high content of amorphous Fe and Al oxides [,,], as determined by extraction with ammonium oxalate. Additionally, the content of crystalline Fe and Al oxides may also lend to the high retentive capacity of this soil. It has been reported widely in the literature that these materials display a high affinity for solvated GPS, where sorption likely occurs via mono or bidentate inner-sphere complexation [,].
GPS sorption onto the Sharkey soil is nearly linear, implying a more homogeneous distribution of site affinities where the “rate” of partitioning of the solute into the solution and sorbed phases is more or less independent of the solution concentration []. A higher value of the Freundlich partitioning coefficient in this soil is indicative of a greater affinity of the Sharkey soil compared to the Commerce. This increased affinity relative to the Commerce soil may be attributed to several physiochemical properties of this matrix. The high cation exchange capacity of this soil may partially explain this result. While performing a regression analysis on 101 different soils, Dollinger et al. [] found that both linear and Freundlich partitioning coefficients were highly dependent upon, and positively correlated with CEC, more so than the content of Fe and Al oxides. De Jonge and de Jonge [] reported increased sorption with increasing ionic strength of the solution, which could potentially be attributed to GPS complexation with surface exchangeable poly-valent cations. Coupling the results of these two studies, enhanced di-valent cation (Ca2+) sorption brought about by the higher CEC of this soil could provide additional surface sites for the sorption of GPS, resulting in a greater affinity. Additionally, Paradelo et al. [] performed a similar regression analysis and determined that GPS adsorption was positively correlated with the clay content of soils, which is consistent with results reported here. Since electrostatic repulsion between the negatively-charged clay surfaces and the herbicide molecule will likely prevent the formation of direct surface complexes, GPS sorption onto clay minerals within this soil likely takes place via ligand exchange with surface coordinated hydroxyl groups on the edge sites of layer silicates []. In accordance with the above discussion involving sorption by the Commerce soil, the relatively high amounts of crystalline Fe and Al oxides in this soil may also largely contribute to the high retentive behavior of the Sharkey soil []. The results of several recent studies have emphasized the importance of organic compounds in the sorption of solvated GPS, which may be of importance here due to the higher amount of organic matter in this soil (as indicated by TOC). It has been demonstrated that GPS interacts strongly with humic and fulvic acids [], as well as with various peptides [], which are abundant in soils. Furthermore, the lower pH of this soil compared to the Commerce likely increases the propensity for the sorption of solution phase GPS [,].
3.2. Transport Studies
3.2.1. Tritium Breakthrough
Tritium breakthrough curves (BTC) from both columns are displayed in Figure 3, with fitted CXTFIT parameters and fraction of recovered radioactivity given in Table 4. In general, the classical convective-dispersive equation (CDE) (Equation (2)) provided a good description of the measured data, with coefficient of determination values of 0.989 and 0.950 for the Commerce and Sharkey soil columns, respectively. The BTC for the Sharkey column is characterized as mostly symmetrical, indicating the presence of a single flow domain. Conversely, the Commerce BTC displays some degree of tailing during leaching, suggesting that physical non-equilibrium conditions may exist. In this case, flow is not restricted to just inter-particle porosity and, therefore, intra-particle diffusion may play a more prominent role. This result is further emphasized by the relatively low recovery of applied radioactivity (~91%) for this column, which can be attributed to limited diffusion of tritium from the intra-particle domain back to the bulk soil porosity. Recovery of applied radioactivity from the Sharkey column (~96%) is indicative of limited mass loss to the intra-particle domain and is, therefore, consistent with the overall shape of the BTC. Although evidence of physical non-equilibrium within the Commerce column exists, the magnitude is such that any major effect on GPS transport is not to be expected. Shapes of tritium BTCs are contrary to expectations, as Sharkey is well known to have highly stable aggregates. Therefore, evidence of physical non-equilibrium was anticipated in the Sharkey column and not in the Commerce column. Additional investigations are needed to further understand the dominant mechanisms of tracer transport in these soils.
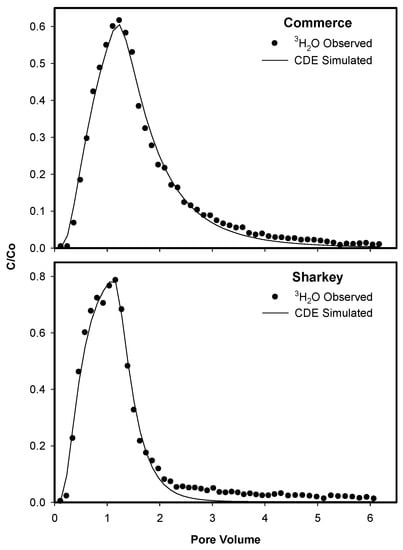
Figure 3.
Measured and CDE simulated tritium breakthrough curves from the Commerce and Sharkey soil columns.
Table 4.
Optimized values for the hydrodynamic dispersion coefficient and fraction of applied radioactivity recovered for both miscible displacement columns.
3.2.2. GPS Breakthrough
GPS BTCs from both soil columns are displayed in Figure 4. Results indicate that GPS mobility in both soils is highly limited due to their high adsorptive capacities, with 3% and 2% of the applied mass recovered in the effluent solution from the Commerce and Sharkey columns, respectively. Although observed breakthrough was very low, GPS mobility in the Commerce soil was greater than that in the Sharkey soil, with peak concentrations ~4% that of the influent solution. In the Sharkey soil, the maximum effluent concentrations were approximately 2% of the influent concentrations. Qualitative differences of GPS mobility in both soils are consistent with trends determined by batch sorption studies, with more limited mobility occurring in a soil with greater GPS affinity. Very low GPS mobility in soils has been well documented in the literature. Monitoring of leachate from 1 m below a field soil over a 2 year period, Kjær et al. [] reported complete retention of GPS within the soil column, and Napoli et al. [] recovered only an average of about 0.82% of applied GPS from the same depth over the course of a year. Additionally, Al-Rajab et al. [] reported less than 0.28% of applied GPS was recovered from a 25 cm soil profile, and Bergström et al. [] recovered only 0.009–0.019% of applied GPS in leachate sampled at 90 cm depth over the course of 748 days. As field conditions are inherently variable, results reported from laboratory studies may provide a more direct comparison to results presented here. Using flow rates similar to those used in this study, Candela et al. [] observed maximum concentrations of GPS in the effluent from a Spanish surface soil at approximately 1% that of the influent concentration, even though columns were only 2 cm long and 150 pore volumes of GPS solution were applied. Significant breakthrough was observed in this study when flow rates were increased by two orders of magnitude; however, it is unclear whether such rates are realistic in a field setting.
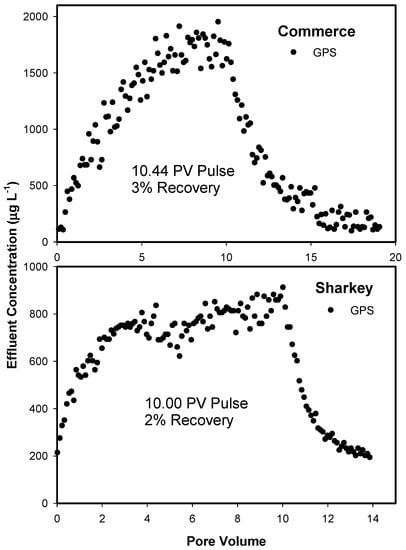
Figure 4.
Measured GPS BTCs from Commerce and Sharkey soil columns.
It is noteworthy that GPS breakthrough from both soil columns is rapid with no apparent lag time, suggesting high connectivity in a small proportion of the pores, which allows for a limited fraction of the bulk pore water (and therefore solvated GPS) to move relatively quickly. Therefore, the observed rapid breakthrough is attributed to physical properties of the system rather than chemical properties. These results are in contrast with other GPS laboratory miscible displacement studies. Using a flow rate greater than those employed here and applying a continuous pulse, Magga et al. [] reported a lag time of over 35 days before any GPS was detected in the effluent solution despite input concentrations twice those used in the current study. However, columns were 80 cm long and, therefore, the proportion of relatively non-tortuous path lengths is expected to be less. Additionally, analytical methods allowed for a lower limit of detection of 0.75 mg L−1, so very low breakthrough concentrations may have gone undetected. Similarly, Beltran et al. [] observed a lag time of approximately 300 pore volumes before GPS breakthrough was detected, although input concentrations were two orders of magnitude lower than those used in this study. Consistent with our results however, Dousset et al. [] observed rapid breakthrough of GPS from vineyard soils with high concentrations of Cu when applying a finite pulse.
3.2.3. Multi-Reaction Transport and Linear Modeling
Measured GPS breakthrough curves along with MRTM and CXTFIT modeling simulations are displayed in Figure 5, with optimized parameter values and evaluative statistics given in Table 5. Upon statistical evaluation of several versions of MRTM, a two site multi-reaction model incorporating reversible and irreversible kinetic sites (Equations (6) and (9)) provided the best description of the data. In general, MRTM was able to describe observed data quite well from both soils with r2 values of 0.97 and 0.90 for the Commerce and Sharkey soils, respectively. Additionally, an ocular assessment of Figure 5 indicates that the model was able to predict the overall shape of each BTC to a reasonable extent as well. Optimized parameter values indicate an order of magnitude higher rate of mass transfer to the solid phase relative to rates of release, with higher rates of sorption onto irreversible sites for the Sharkey soil and similar rates for the Commerce soil. Since GPS retention in both soils was so high and no extensive tailing occurred, this result is expected.
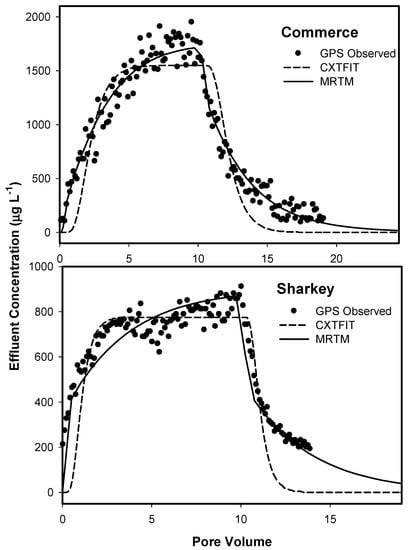
Figure 5.
Measured and MRTM and CXTFIT predicted GPS breakthrough from Commerce and Sharkey soil columns.
Table 5.
Optimized parameter values for CXTFIT and MRTM models.
In general, linear modeling was able to predict the timing and magnitude of the effluent peak to some degree, although peak effluent concentrations were under predicted for both cases. Because the linear model does not account for non-equilibrium release from the solid phase, predicted concentrations in the effluent at the advanced stages of leaching were under predicted. Rates of mass transfer to the conceptual ‘sink’ (values for µ in Equation (3)) were very similar to rate coefficients determined by MRTM, which is expected as mass retention is a dominant mechanism in GPS transport within both soils. Overall, MRTM performed better than linear modeling due to its capability to account for a variety of retention mechanisms.
The MRTM model used in this study is a model that is simpler than those used by Candela et al. [] and Magga et al. []. These scientists both employed models consisting of equilibrium and kinetic sites along with first order sinks and were able to describe GPS breakthrough reasonably well. Zhou et al. [] also used a two-site non-equilibrium model to describe GPS breakthrough, however the dataset was very small (six points) and only adsorption was considered.
3.2.4. Distribution in the Soil Column
Measured GPS distribution obtained from KOH extractions of column sections along with MRTM and CXTFIT predicted distributions are displayed in Figure 6. Consistent with what would be expected for a strongly sorbing solute, the majority of the extracted mass is concentrated near the input port. In fact, 76% and 59% of total herbicide extracted from the columns was recovered from the first 2 cm for the Sharkey and Commerce soils, respectively. Larger quantities of retained GPS observed at lower depths in the Commerce column are reflective of greater herbicide mobility in this soil relative to the Sharkey soil. This finding is in agreement with our batch and BTC results. Recovered mass decreases rapidly with depth, with only minimal GPS recovery from the latter half of the columns for both soils. This distribution profile is consistent with those reported by a number of other studies. While conducting a mobility study through undisturbed soil columns, Okada et al. [] recovered 68% of applied GPS in the top third of a 15 cm column, where Yang et al. [] recovered the majority of GPS and AMPA residues from the upper 2 cm of soil in a field plot study. Landry et al. [] reported that although no residual GPS was extracted after a yearlong field study involving agricultural soils in France, residual AMPA was concentrated in the top half of 20 cm profiles. Similar GPS distribution profiles were also described by Al-Rajab et al. [], where the vast majority of GPS was extracted from the top 5 cm of a 25 cm profile of all three soils at all seven sampling times used in the study.
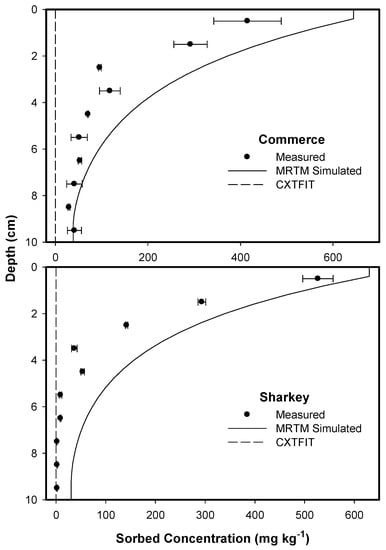
Figure 6.
Measured and MRTM predicted GPS distribution within the Commerce and Sharkey soil columns. Error bars are 95% confidence intervals.
The CXTFIT model fails to predict the distribution of retained GPS in either column, with very low estimates of residual mass. This can be attributed to how the parameter µ is interpreted within the context of Equation (3). As discussed by van Genuchten et al. [], µ is taken as a first-order degradation coefficient when utilizing CXTFIT within the STANMOD software package, and not as a rate coefficient for irreversible retention reactions. Low recovery of applied GPS in the effluent solution is therefore accounted for by relatively large optimized values for µ. Since this is a degradation rate coefficient, residual GPS within the column is not conserved, but is rather taken as mass lost from the system resulting in very low estimates of residual concentrations. Conversely, MRTM predicts the general shape of the distribution curve well, with greater amounts of residual herbicide located in the portion of the column closest to the inlet. The increased performance of this model relative to that of CXTFIT is due to complete conservation of mass throughout the duration of the numerical simulation. Here, there is no mechanism present to account for degradation and any type of mass ‘sink’ within the system is attributed to irreversible reactions. Although the shape of the distribution is approximated to a high degree, MRTM results in a somewhat over-prediction of measured residues, the reason for which is twofold. Extraction efficiencies from the soil are expected to be less than 100%, so measured residual GPS will automatically be less than what actually exists. Additionally, degradation of solid phase GPS is expected, the consequence of which being that mass loss due to biological activity is unaccounted for by MRTM, which will bias predictions higher than the actual amount of residual herbicide. Further effort to modify this model such that degradation is accounted for by the incorporation of various biological functions would improve estimates of residual mass. It is important to note that extraction data is not included in the model optimization procedure, and therefore, the ability of MRTM to estimate the general shape of GPS distribution within the soil profile further lends to the mechanistic validity of the model.
Discrepancies between modeled and measured results brought about by extraction inefficiencies and degradation can be handled by normalizing both data sets based upon calculated center of mass (COM) of GPS in the column, the results of which are given in Table 6. In order to do this, it must be assumed that extraction efficiency and rate of degradation from each column section is the same. The validity of these assumptions is uncertain, as it was determined in a separate study that degradation rates are dependent upon sorbed phase concentrations in the Commerce soil and that no clear trend was evident in the Sharkey soil (Unpublished results). In addition, extraction efficiencies from soil with differential sorbed phase concentrations are expected to be different, as extraction from soils with low sorbed phase concentrations will most likely be lower due to GPS association with higher affinity sites. Yet, this assumption may be valid for the Sharkey soil, as there was a more homogenous distribution of reactive site affinities (Freundlich n closer to 1), whereas the effect of differential extraction efficiencies will be greater in the Commerce soil due to a more heterogeneous distribution of reactive site affinities. However, if it is taken that these assumptions are valid, MRTM over-predicts GPS mobility in the Sharkey soil (predicted COM of 2.29 cm vs. a measured COM of 1.48 cm), and under-predicts the mobility of GPS in the Commerce soil (predicted COM of 2.46 cm vs. a measured COM of 2.64 cm). Additionally, a measured COM deeper in the soil profile for the Commerce soil relative to the Sharkey soil is consistent with observed BTC data and batch sorption results.
Table 6.
MRTM predicted and measured center of mass for GPS distribution within Commerce and Sharkey soil columns.
As biological degradation of GPS in soils is expected to occur over the time period in which these studies were conducted [], efforts were made to quantify the amount of the primary metabolite (AMPA) in the residual extracts. A lack of prolonged measured radioactivity in the effluent solution suggests that the 14C remains associated with the highly reactive phosphonomethyl functional group, indicating that the dominant mechanism of microbial degradation is through the AMPA pathway, consistent with the findings of others [,]. Assuming that degradation beyond AMPA will result in a metabolite lacking the phosphonomethyl group and, therefore, a compound that will be readily mineralized to 14CO2, all measured radioactivity in the extracting solution is taken to be either GPS or AMPA. As such, fractions of both GPS and AMPA determined via UPLC-MS/MS were applied to concentrations determined by LSC to produce GPS and AMPA distribution profiles displayed in Figure 7. Again, assuming that rates of degradation are identical throughout the soil profile despite differential solid phase concentrations of GPS, determining the COM of both compounds provides a basis to assess the mobility of AMPA relative to that of GPS in each soil. Calculated COM based on UPLC-MS/MS analyses are given in Table 7. These results coupled with the above assumption indicate that AMPA is more mobile than GPS in both soils, although to a lesser extent in the Sharkey soil. This is consistent with the findings of Báez et al. [], where reported Kf values for AMPA were lower than those for GPS in six out of eight soils studied. However, these conclusions must be considered carefully, as they are contingent upon the validity of a number of assumptions.
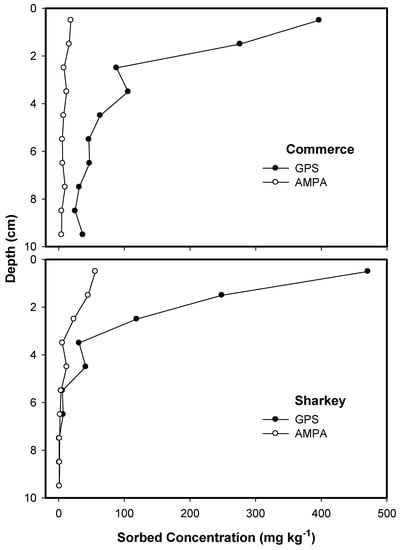
Figure 7.
Distribution of GPS and AMPA within the Commerce and Sharkey soil columns.
Table 7.
Calculated COM for GPS and AMPA within the Commerce and Sharkey soil columns.
4. Conclusions
Batch studies of GPS sorption onto Commerce and Sharkey soils indicate a high affinity of both soils for the herbicide, although Sharkey exhibited a greater affinity. The high GPS retentive behavior of the Commerce soil is most likely due to the greater presence of Fe and Al amorphous oxides, whereas the high CEC of the Sharkey soil is likely responsible for GPS affinity in this matrix. Miscible displacement studies indicate that GPS mobility is highly limited in both Commerce and Sharkey soils, although the herbicide is slightly more mobile in the Commerce soil. A two-site multi-reaction model consisting of reversible and irreversible kinetic sites provided an adequate description of GPS breakthrough data from both soils. Predicted GPS breakthrough from both soils employing linear modeling adequately predicted the timing of peak effluent concentrations, but underestimated the magnitude of the peak in both cases. In general, MRTM outperformed linear approaches to describe GPS BTCs from both soils. Additionally, MRTM was able to accurately predict the general shape of the distribution of residual herbicide in the soil column, with residual mass concentrated towards the inflow point. Characterizing predicted and extracted residual herbicide based on COM calculations indicate that MRTM predictions overestimate the mobility of GPS in the Sharkey soil, whereas it was underestimated in the Commerce soil. Lack of prolonged release of radiolabeled compounds strongly suggests that microbial degradation of GPS is via the AMPA pathway, consistent with results reported by other authors. Assuming that degradation rates of solid phase GPS are constant, a deeper COM of residual AMPA in both soils is an indication of greater mobility of the primary GPS metabolite in the subsurface environment. Subsequent studies involving the development of models that consider additional processes will likely prove useful. For example, the incorporation of additional parameters that account for the degradation of solution and sorbed phase herbicide may improve the description of GPS breakthrough from soil columns, as well as the distribution of residual GPS and AMPA.
Author Contributions
Conceptualization: J.T.P. and H.M.S.; methodology: H.M.S.; formal analysis: J.T.P. and H.M.S.; investigation: J.T.P. and H.M.S.; resources: H.M.S.; data curation: J.T.P.; writing—original draft praparation: J.T.P.; writing—review and editing: J.T.P. and H.M.S.; supervision: H.M.S.; project administration: H.M.S.; funding acquisition: H.M.S.
Funding
Funding was provided from the Louisiana Agricultural Experiment Station.
Acknowledgments
The authors would like to thank Amy Hernandez of the LSU Agricultural Chemistry Department for her assistance in the UPLC-MS/MS analysis.
Conflicts of Interest
The authors declare no conflict of interest.
References
- Battaglin, W.A.; Meyer, M.T.; Kuivila, K.M.; Dietze, J.E. Glyphosate and Its Degradation Product AMPA Occur Frequently and Widely in U.S. Soils, Surface Water, Groundwater, and Precipitation. J. Am. Water Resour. Assoc. 2015, 50, 275–290. [Google Scholar] [CrossRef]
- Ronco, A.E.; Marino, D.J.G.; Abelando, M.; Almada, P.; Apartin, C.D. Water Quality of the main tributaries of the Paraná Basin: Glyphosate and AMPA in surface water and bottom sediment. Environ. Monit. Assess. 2016, 188, 458. [Google Scholar] [CrossRef] [PubMed]
- Poiger, T.; Buerge, I.J.; Bächli, A.; Müller, M.; Balmer, M.E. Occurrence of the herbicide glyphosate and its metabolite AMPA in surface waters in Switzerland determined with on-line solid phase extraction LC-MS/MS. Environ. Sci. Pollut. Res. 2017, 24, 1588–1596. [Google Scholar] [CrossRef] [PubMed]
- Masiol, M.; Gianní, B.; Prete, M. Herbicides in river water across the northeastern Italy: Occurrence and spatial patterns of glyphosate, aminomethylphosphonic acid, and glufosinate ammonium. Environ. Sci. Pollut. Res. 2018, 25, 24368–24378. [Google Scholar] [CrossRef] [PubMed]
- Koller, V.; Furhacker, M.; Nersesyan, A.; Misik, M.; Eisenbauer, M.; Knasmueller, S. Cytotoxic and DNA-damaging properties of glyphosate and Roundup in human-derived buccal epithelial cells. Arch. Toxicol. 2012, 86, 805–813. [Google Scholar] [CrossRef] [PubMed]
- Thongprakaisang, S.; Thiantanawat, A.; Rangkadilok, N.; Suriyo, T.; Satayavivad, J. Glyphosate induces human breast cancer cells growth via estrogen receptors. Food Chem. Toxicol. 2013, 59, 129–136. [Google Scholar] [CrossRef] [PubMed]
- Torretta, V.; Katsoyiannis, I.A.; Viotti, P.; Rada, E.C. Critical Review of the Effects of Glyphosate Exposure to the Environment and Humans through the Food Supply Chain. Sustainability 2018, 10, 950. [Google Scholar] [CrossRef]
- Landrigan, P.J.; Belpoggi, F. The need for independent research on the health effects of glyphosate-based herbicides. Environ. Health-Glob. 2018, 17, 51. [Google Scholar] [CrossRef] [PubMed]
- Kjær, J.; Ernstsen, V.; Jacobsen, O.H.; Hansen, N.; de Jonge, L.W.; Olsen, P. Transport modes and pathways of the strongly sorbing pesticides glyphosate and pendimethalin through structured drained soils. Chemosphere 2011, 84, 471–479. [Google Scholar] [CrossRef] [PubMed]
- Torstensson, L.; Börjesson, E.; Stenström, J. Efficacy and fate of glyphosate on Swedish railway embankments. Pest Manag. Sci. 2005, 61, 881–886. [Google Scholar] [CrossRef] [PubMed]
- Strange-Hansen, R.; Holm, P.; Jacobsen, O.S.; Jacobsen, C. Sorption, mineralization and mobility of N-(phosphonomethyl)glycine (glyphosate) in five different types of gravel. Pest Manag. Sci. 2004, 60, 229–234. [Google Scholar] [CrossRef] [PubMed]
- Bergstöm, L.; Börjesson, E.; Stenström, J. Laboratory and Lysimeter Studies of Glyphosate and Aminomethylphosphonic Acid in a Sand and a Clay Soil. J. Environ. Qual. 2011, 40, 98–108. [Google Scholar] [CrossRef]
- Al-Rajab, A.J.; Amellal, S.; Shiavon, M. Sorption and Leaching of 14C-glyphosate in agricultural soils. Agron. Sustain. Dev. 2008, 28, 419–428. [Google Scholar] [CrossRef]
- Kjær, J.; Olsen, P.; Ullum, M.; Grant, R. Leaching of Glyphosate and Amino-Methylphosphonic Acid from Danish Agricultural Field Sites. J. Environ. Qual. 2005, 34, 608–620. [Google Scholar] [CrossRef] [PubMed]
- Landry, D.; Dousset, S.; Fournier, J.C.; Andreux, F. Leaching of glyphosate and AMPA under two soil management practices in Burgundy vineyards (Vosne-Romanèe, 21-France). Environ. Pollut. 2005, 138, 191–200. [Google Scholar] [CrossRef] [PubMed]
- Beltran, J.; Gerritse, R.G.; Hernandez, F. Effect of flow rate on the adsorption and desorption of glyphosate, simazine, and atrazine in columns of sandy soils. Eur. J. Soil Sci. 1998, 49, 149–156. [Google Scholar] [CrossRef]
- Candela, L.; Álvarez-Benedí, J.; Condesso de Melo, M.T.; Rao, P.S.C. Laboratory studies on glyphosate transport in soils of the Maresme area near Barcelona, Spain: Transport model parameter estimation. Geoderma 2007, 140, 8–16. [Google Scholar] [CrossRef]
- Magga, Z.; Tzovolou, D.; Theodoropoulos, M.A.; Dalkarani, T.; Pikios, K.; Tsakiroglou, C.D. Soil column experiments used as a means to assess transport, sorption, and biodegradation of pesticides in groundwater. J. Environ. Sci. Health B 2008, 43, 732–741. [Google Scholar] [CrossRef] [PubMed]
- Zhou, Y.; Wang, Y.; Hunkeler, D.; Zwahlen, F.; Boillat, J. Differential Transport of Atrazine and Glyphosate in Undisturbed Sandy Soil Column. Soil Sediment Contam. 2010, 19, 365–377. [Google Scholar] [CrossRef]
- US EPA. Table of Regulated Drinking Water Contaminants; US EPA: Washington, DC, USA, 2016.
- Grandcoin, A.; Piel, S.; Baures, E. AminoMethylPhosphonic acid (AMPA) in natural water: Its sources, behavior and environmental fate. Water Res. 2017, 117, 187–197. [Google Scholar] [CrossRef] [PubMed]
- Harrell, D.L.; Wang, J.J. Fractionation and Sorption of Inorganic Phosphorus in Louisiana Calcareous Soils. Soil Sci. 2006, 171, 39–51. [Google Scholar] [CrossRef]
- Selim, H.M. Transport and Fate of Chemicals in Soils: Principals and Applications; CRC: Boca Raton, FL, USA, 2015. [Google Scholar]
- Miles, C.J.; Moye, H.A. Extraction of Glyphosate Herbicide from Soil and Clay Minerals and Determination of Residues in Soils. J. Agric. Food Chem. 1988, 36, 486–491. [Google Scholar] [CrossRef]
- Toride, N.; Leij, F.J.; van Genuchten, M.T. The CXTFIT Code for Estimating Transport Parameters for Laboratory or Field Tracer Experiments; Version 2.1; Research Report No. 137; U.S. Salinity Laboratory, USDA, ARS: Riverside, CA, USA, 1999.
- Parker, J.C.; van Genuchten, M.T. Determining Transport Parameters from Laboratory or Field Tracer Experiments; Bulletin 84-3; Virginia Agricultural Experiment Station: Blacksburg, VA, USA, 1984. [Google Scholar]
- Toride, N.; Leij, F.J.; van Genuchten, M.T. A Comprehensive Set of Analytical Solutions for Nonequilibrium Solute Transport with First-Order Decay and Zero-Order Production. Water Resour. Res. 1993, 29, 2167–2182. [Google Scholar] [CrossRef]
- Šimůnek, J.; van Genuchten, M.T.; Sejna, N.; Toride, N.; Leij, F.J. The STANMOD Computer Software for Evaluating Solute Transport in Porous Media Using Analytical Solutions of Convection-Dispersion Equation; Versions 1.0 and 2.0; IGWMC-TPS-71; International Ground Water Modeling Center, Colorado School of Mines: Golden, CO, USA, 1999. [Google Scholar]
- Selim, H.M.; Davidson, J.M.; Mansell, R.S. Evaluation of a two-site adsorption-desorption model for describing solute transport in soils. In Proceedings of the Summer Computer Simulation Conference, Washington, DC, USA, 12–14 July 1976; Simulation Councils, Inc.: La Jolla, CA, USA, 1976; pp. 444–448. [Google Scholar]
- Selim, H.M.; Amacher, M.C. A second-order kinetic approach for modeling solute retention and transport in soils. Water Resour. Res. 1988, 24, 2061–2075. [Google Scholar] [CrossRef]
- Selim, H.M.; Amacher, M.C. Reactivity and Transport of Heavy Metals in Soils; CRC: Boca Raton, FL, USA, 1997. [Google Scholar]
- Sidoli, P.; Baran, N.; Angulo-Jaramillo, R. Glyphosate and AMPA adsorption in soils: Laboratory experiments and pedotransfer rules. Environ. Sci. Pollut. Res. 2016, 23, 5733–5742. [Google Scholar] [CrossRef] [PubMed]
- Gros, P.; Ahmed, A.; Kuhn, O.; Leinweber, P. Glyphosate binding in soil as revealed by sorption experiments and quantum-chemical modeling. Sci. Total Environ. 2017, 586, 527–535. [Google Scholar] [CrossRef] [PubMed]
- Zhelezova, A.; Cederlund, H.; Senstrom, J. Effect of Biochar Amendment and Ageing on Adsorption and Degradation of Two Herbicides. Water Air Soil Pollut. 2017, 228, 216–229. [Google Scholar] [CrossRef] [PubMed]
- Sprankle, P.; Meggit, W.F.; Penner, D. Adsorption, Mobility, and Microbial Degradation of Glyphosate in the Soil. Weed Sci. 1975, 23, 229–234. [Google Scholar]
- Piccolo, A.; Arienzo, M.; Celano, G.; Mirabella, A. Adsorption and desorption of glyphosate in some European soils. J. Environ. Sci. Health B 1994, 29, 1105–1115. [Google Scholar] [CrossRef]
- Gimsing, A.L.; Szilas, C.; Borggaard, O.K. Sorption of glyphosate and phosphate by variable-charge tropical soils from Tanzania. Geoderma 2007, 138, 127–132. [Google Scholar] [CrossRef]
- Sheals, J.; Sjoberg, S.; Persson, P. Adsorption of Glyphosate on Goethite: Molecular Characterization of Surface Complexes. Environ. Sci. Technol. 2002, 36, 3090–3095. [Google Scholar] [CrossRef] [PubMed]
- Ahmed, A.A.; Leinweber, P.; Kühn, O. Unravelling the nature of glyphosate binding to goethite surfaces by ab initio molecular dynamics simulations. Phys. Chem. Chem. Phys. 2018, 20, 1531–1539. [Google Scholar] [CrossRef] [PubMed]
- Selim, H.M. On the nonlinearity of sorption isotherms of solutes in soils. Soil Sci. 2014, 179, 237–241. [Google Scholar] [CrossRef]
- Dollinger, J.; Dagès, C.; Voltz, M. Glyphosate sorption to soils and sediments predicted by pedotransfer functions. Environ. Chem. Lett. 2015, 13, 293–307. [Google Scholar] [CrossRef]
- De Jonge, H.; de Jonge, L.W. Influence of pH and solution composition on the sorption of glyphosate and prochloraz to a sandy soil. Chemosphere 1999, 39, 753–763. [Google Scholar] [CrossRef]
- Paradelo, M.; Norgaard, T.; Moldrup, P.; Ferrè, T.P.A.; Kumari, K.G.I.D.; Arthur, E.; de Jonge, L.W. Prediction of the glyphosate sorption coefficient across two loamy agricultural fields. Geoderma 2015, 259–260, 224–232. [Google Scholar] [CrossRef]
- Borggaard, O.; Gimsing, A. Fate of glyphosate in soil and the possibility of leaching to ground and surface waters: A review. Pest Manag. Sci. 2008, 64, 441–456. [Google Scholar] [CrossRef] [PubMed]
- Albers, C.N.; Banta, G.T.; Hansen, P.E.; Jacobsen, O.S. The influence of organic matter on sorption and fate of glyphosate in soil—Comparing different soils and humic substances. Environ. Pollut. 2009, 157, 2865–2870. [Google Scholar] [CrossRef] [PubMed]
- Ahmed, A.A.; Gros, P.; Kühn, O.; Leinweber, P. Molecular level investigation of the role of peptide interactions in the glyphosate analytics. Chemosphere 2018, 196, 129–134. [Google Scholar] [CrossRef] [PubMed]
- Okada, E.; Costa, J.L.; Bedmar, F. Adsorption and mobility of glyphosate in different soils under no-till and conventional tillage. Geoderma 2016, 263, 78–85. [Google Scholar] [CrossRef]
- Napoli, M.; Cecchi, S.; Zanchi, C.; Orlandini, S. Leaching of Glyphosate and Aminomethylphosphonic Acid through Silty Clay Soil Columns under Outdoor Conditions. J. Environ. Qual. 2015, 44, 1667–1673. [Google Scholar] [CrossRef] [PubMed]
- Dousset, S.; Jacobson, A.; Dessogne, J.B.; Guichard, N.; Baveye, P.C.; Andruex, F. Facilitated Transport of Diuron and Glyphosate in High Copper Vineyard Soils. Environ. Sci. Technol. 2007, 41, 8056–8061. [Google Scholar] [CrossRef] [PubMed]
- Yang, X.; Wang, F.; Bento, C.P.M.; Meng, L.; van Dam, R.; Mol, H.; Liu, G.; Ritsema, C.J.; Geissen, V. Decay Characteristics and erosion-related transport of glyphosate in Chinese loess soil under field conditions. Sci. Total Environ. 2015, 530–531, 87–95. [Google Scholar] [CrossRef] [PubMed]
- Van Genuchten, M.T.; Šimůnek, J.; Leij, F.J.; Toride, N.; Šejna, M. STANMOD: Model Use, Calibration, and Validation. ASABE 2012, 55, 1353–1366. [Google Scholar] [CrossRef]
- Sviridov, A.V.; Shushkova, T.V.; Ermakova, I.T.; Ivanova, E.V.; Epiktetov, D.O.; Leont’evskii, A.A. Microbial Degradation of Glyphosate Herbicides (Review). Appl. Biochem. Microbiol. 2015, 51, 188–195. [Google Scholar] [CrossRef]
- Báez, M.E.; Espinoza, J.; Silva, R.; Fuentes, E. Sorption-desorption behavior of pesticides and their degradation products in volcanic and nonvolcanic soils: Interpretation of interactions through two-way principal component analysis. Environ. Sci. Pollut. Res. 2015, 22, 8576–8585. [Google Scholar] [CrossRef] [PubMed]
© 2018 by the authors. Licensee MDPI, Basel, Switzerland. This article is an open access article distributed under the terms and conditions of the Creative Commons Attribution (CC BY) license (http://creativecommons.org/licenses/by/4.0/).