Article

Soil Development under Continuous Agriculture at the Morrow Plots Experimental Fields from X-ray Diffraction Profile Modelling

1
CNRS, IRD, IFSTTAR, ISTerre, Univ. Grenoble Alpes, Univ. Savoie Mont Blanc, F-38000 Grenoble, France
2
CNRS, IC2MP, Univ. Poitiers, F-86000 Poitiers, France
3
Dept. Natural Resources and Environmental Sciences, Univ. Illinois at Urbana-Champaign, Urbana, IL 61801, USA
*
Author to whom correspondence should be addressed.
Soil Syst. 2018, 2(3), 46; https://doi.org/10.3390/soilsystems2030046
Submission received: 22 June 2018 / Revised: 31 July 2018 / Accepted: 3 August 2018 / Published: 6 August 2018

Abstract

:
Impact of continuous cropping on clay mineralogy was assessed on a collection of unfertilized soil samples from the Morrow Plots experimental fields covering 110 years of long crop rotations. Evolution of mineralogy was quantitatively determined by fitting X-ray diffraction (XRD) patterns from four size fractions (50–2, 2–0.2, 0.2–0.05 and <0.05 µm) of the surface horizon (0–20 cm). The mineralogy of the three clay subfractions (2–0.2 µm, 0.2–0.05 µm and <0.05 µm) consists mainly of coexisting illite-smectite-chlorite whose compositions range from discrete illite (in the 2–0.2 µm subfraction) to discrete smectite (in the <0.05 µm subfraction). Mixed layers of similar compositions were used to fit XRD data from all clay subfractions. With decreasing size fractions, both the size of the coherent scattering domains and the proportion of illite-rich mixed layers decrease, thus accounting for the higher cation exchange measured in the <0.05 µm subfraction compared to other clay subfractions. The analysis of fine clay subfractions (<0.2 µm or lower) provided key information and constraints to a complete and accurate description of the bulk <2 µm fraction. Additional constraints derived from chemical treatments (K-saturation and heating) proved to be especially useful to propose a reliable structure model for these fine clay subfractions because of their weakly modulated diffraction signature. Mineralogy of all subfractions considered is essentially stable over the studied period (1904–2014), with the relative proportion of the different clay layer types (illite, smectite, kaolinite, chlorite) showing no significant evolution in the bulk <2 µm fraction. A century of continuous cropping thus results essentially in an increase of fine clay particles (<0.05 µm) and a decrease of the 0.2–0.05 µm subfraction, indicative of clay mineral dissolution and consistent with observed increase of cation exchange capacity with time. The relative proportion of the bulk <2 µm fraction is nearly constant over the studied period, indicative of minimal export of clay phases.

1. Introduction

The natural evolution of soils that typically occurs on a centennial-to-millennial time scale may be influenced by agricultural practices within years to decades [1,2,3,4]. The influence of agricultural practices (crop type and rotations, soil preparation, specific inputs) on soil physical and chemical properties has been extensively assessed in the literature. Few of these studies have assessed the evolution of clay mineralogy in field experiments, however, despite the key contribution of clay minerals to plant nutrient supply [5,6,7]. Most of these studies focused on the modifications affecting 2:1 clay minerals. Specifically, potassium (K) incorporation or release from 2:1 clay interlayers may lead to the illitization of vermiculite or smectite layers and to the vermiculitization of mica/illite, respectively. For example, an increase in the proportion of illite layers has been reported in temperate and tropical soils following addition of K fertilizers [4,8,9,10]. By contrast, 126 years of N and K fertilization and liming have only led to marginal modifications of clay mineralogy in the soil under permanent grassland [11]. An increase in the proportion of expandable layers (smectite or vermiculite) at the expense of illite has also been reported as the result of the uptake of mineral nutrients, especially K, by crops [12,13,14,15]. This tendency has, however, not been systematically observed [15,16]. Impact of agricultural practices on clay mineralogy thus appears difficult to predict and the origin of contrasting clay reactivity/resilience remains essentially unknown and could be due, at least partly, to the variability of agricultural practices investigated. Interestingly, dissolution or aluminization processes due to soil acidification by plants have been seldom reported in cultivated soils whereas they are most influential on clay mineralogy in forest soils or upon reforestation [4,11,17]. Laboratory experiments have shown that these processes may also be locally active under agricultural practices [18,19,20]. In addition, the actual extent and influence of soil acidification by plants in the field remains insufficiently documented. Whatever their nature, assessment of pedogenetic processes operating in agricultural soils relies on an accurate description of soil clay mineralogy, which remains a challenge owing to the frequent coexistence of many different phases, poorly crystalline, often interstratified, having closely related compositions [21,22,23,24,25].
Qualitative description of soil clay mineralogy and its evolution upon agricultural practices was derived mainly from X-ray diffraction (XRD) investigation of clay fractions submitted to different treatments [26,27]. This approach relies on the interpretation of intensity and/or position variations of clay mineral 00l reflections following these treatments. This approach is intrinsically limited to sharp, well-defined reflections and does not allow extracting a comprehensive information on (i) extremely small or crypto-crystalline contributions and (ii) complex interstratified contributions owing to their weakly modulated and faint diffraction signatures [28]. Over the last two decades, decomposition of XRD patterns has been combined with simulations of XRD patterns [29,30] to enhance and rationalize the description of soil clay mineralogy and of its evolution as a result of agricultural practices [9,10,15,31,32,33,34]. Despite significant improvements, prompted in particular by the identification of interstratified contributions, this combined approach remains limited as it does not allow a complete quantitative characterization of interstratified clays that may prevail in soils [21,22,23,24,25,35]. The availability of full-profile XRD modelling combined to the multi-specimen approach allowed such a complete and quantitative characterization of interstratified clays [36,37,38]. When used in conjunction with sequential particle size fractionation, this full-profile modelling approach has allowed a comprehensive and quantitative characterization of clay mineralogy in a variety of soils [23,24,25,35].
Using the above methodology, the present study reports on the clay mineralogy in soils from the Morrow Plots experimental fields, established in 1876 on the Urbana-Champaign campus of the University of Illinois (USA). A collection of unfertilized soil samples covering 110 years of agricultural practices with long crop rotations has been probed to minimize the effect of plant growth. A structural model was established for the clay mineralogy of three clay-size subfractions (2–0.2, 0.2–0.05 and <0.05 µm). Evolution of mineralogy was quantitatively determined on these subfractions and on the 50–2 µm fraction of the surface horizon (0–20 cm) to assess the pedogenetic influence of continuous cropping. Mineralogy of the different clay subfractions is essentially stable over the period considered, a century of continuous plant growth resulting essentially in an increase of fine clay particles (<0.05 µm) consistent with evolution of cation exchange capacity. The overall content of the <2 µm fraction remains constant with time, however, indicative of a minimal export of clay particles.

2. Materials and Methods

2.1. Location and Characteristics

Samples were collected from the Morrow Plots (MP) experimental fields, established in 1876 on the Urbana-Champaign campus of the University of Illinois (USA). The soil of the plots is classified as a mesic Aquic Argiudoll (or loessic Flanagan silt loam—USDA soil taxonomy), with a mean annual precipitation of 968 mm and an average temperature of 11 °C over the period of study [39]. For the present study, 2013 and 2014 samples were taken from the top 25 cm of soil during fallow periods after cropping (October) from a subplot of the three-yearly corn-oats-hay rotation plot which had been left unfertilized (RU) since the start of the experiment in 1876. This specific plot has been selected for the present study as it was expected to rank among the least impacted owing to long crop rotations. In addition, samples from RU subplots from 1904, 1957, 1980 and 1997 (0–20 cm horizon) were collected from the MP soil archive at the Department of Agriculture (U. Illinois). These samples were initially taken in the fall after harvest (Bob Dunker—Univ. of Illinois, personal communication). A complete description of the history of the MP experiment can be found in Aref and Wander [40], where RU subplots presented here correspond to the 5NC subplot and U-COH notation.

2.2. Granulometry

Bulk soil samples were first air-dried (50 °C, 24 h) and passed through a 2 mm sieve to remove large fragments of organic material. For samples collected in 2013 and 2014, 10 g was used for the next step, while for older samples the starting quantity was 5 g. The <2 mm fraction was then dispersed in deionized water using sonication and passed through a 50 µm sieve to separate the 2 mm–50 µm and <50 µm fractions. The <50 µm fraction was then dispersed in 2 M NaCl in three repeated 24 h cycles, then the samples were centrifuged and washed by dialyzing in deionized water (18.2 MΩ cm−1) using a 6–8 kD Spectra/Por® dialysis membrane until chloride-free.
Following this, sequential size fractionation was performed using a centrifugation procedure adapted from Hubert et al. [23] using a Beckmann-Coulter Avanti J-20 XP centrifuge. No further treatment was applied to the samples to avoid any structure modification of clay minerals, and especially of the mixed layers and of chloritic layers [26,27,41]. Furthermore, preliminary tests showed that extraction of the <2 µm fraction was most efficient with the sole use of Na-saturation, compared to untreated samples and also to Na-saturated samples previously treated with citrate-bicarbonate-dithionite and H2O2 (data not shown). The 50–2 and <2 µm fractions were obtained from repeated centrifugation until a clear supernatant was obtained (~10 repetitions) using a JS 4.3 swinging bucket rotor. Dispersion via sonication was performed between each centrifugation cycle (30 s per sample). Separation of the 2–0.2, 0.2–0.05 and <0.05 µm subfractions was performed using a JS 24.38 swinging bucket rotor, again until a clear supernatant was obtained (10–15 repetitions). The different subfractions were then dried and weighed. Subfractions were then saturated with either Ca or K using three 24 h saturation cycles with 1 M CaCl2 or KCl, and excess salt removed by dialysis.

2.3. Chemical Analyses

Cation exchange capacity (CEC) analysis was performed on the bulk <2 μm fractions for 1904, 1957 and 2014, and on 2–0.2, 0.2–0.05, and <0.05 µm subfractions of 2014 samples using the cobalt hexamine method [42,43]. The organic component was measured via C, H and N analysis of the <2 μm fractions of these samples, in addition to analysis of major elements via inductively coupled plasma optical emission spectroscopy.

2.4. X-ray Diffraction Analysis

Oriented slides were prepared for XRD analysis by drying overnight at room temperature a pipetted clay slurry covering a glass slide (air-dried samples, Ca-AD notation). Ca-AD slides were analyzed by XRD after which the same slides were exposed to ethylene glycol (EG) vapor overnight at 50 °C and again analyzed with XRD (Ca-EG notation). Heat treatment of slides from K-saturated samples was performed following analysis in the AD state (K-AD notation), with slides heated to 150 and 350 °C for four hours (noted as K-150 and K-350, respectively). After each heating step, slides were allowed to cool to room temperature prior to XRD analysis. XRD patterns were recorded with a Bruker D8 diffractometer equipped with an Anton Paar CHC+ chamber coupled to an MHG Messtechnik humidity controller. Intensities were measured with a Sol-XE Si(Li) solid state detector from Baltic Scientific Instruments using CuKα radiation over the range 2–50° 2θ using a step-size of 0.04° and a counting time of 6 s per step for oriented slides. XRD data were collected at 40% relative humidity (% RH) for Ca-AD and Ca-EG and at 5% RH for K-AD, K-150, and K-350 samples. The sizes of the divergence slit, the two Soller slits and the antiscatter slit were 0.3°, 2.5°, 2.5° and 0.3° respectively. Preparation of 50–2 μm fractions for XRD analysis was performed by milling with ethanol in a McCrone micronizing mill for 8 minutes and random powder XRD was performed on front-loaded preparations using the Bruker D8 over the range 3–90° 2θ with step-size of 0.026° and a counting time of 8 s per step.

2.5. Simulation of XRD Patterns

Mineral identification and full-profile modelling of the XRD profiles of 50–2 μm fractions was carried out using the Rietveld method and the Profex interface for BGMN software [44] over the range 8–90° 2θ. Refined parameters include unit-cell parameters, size of the coherent scattering domains (CSD), site occupancy and preferred orientation. Background was fitted with a six-parameter polynomial. For 2–0.2, 0.2–0.05 and <0.05 μm subfractions simulation was performed between 3.5 and 50° 2θ using the Sybilla program developed by Chevron™ [45] from the mathematical formulation reported by Drits and Tchoubar [46]. This modelling is based on the direct comparison between experimental and calculated 00l XRD reflections, and fitting was done via trial-and-error determination of structure factors to arrive at a single structure model which fits the profiles obtained from both Ca-AD and Ca-EG treatments according to the multi-specimen technique [23,25,35,36,37,38]. Such an approach relies on the differences in layer-to-layer distances and structure factors for expandable layers arising from the different treatments (AD/EG) and yields the proportion or weighted concentration of each independent phase in the sample.
Both discrete and interstratified contributions to the diffracted intensity were considered. In the latter, factors such as layer types, their proportions and stacking sequences have been refined. The model allowed for the presence of smectite with either two, one, or zero planes of interlayer water molecules (noted as S2, S1 and S0 respectively) with layer-to-layer distances of ~15.0, ~12.5 and ~10.0 Å, respectively in the AD state. Under EG solvation, these layer-to-layer distances were set at 16.8 and 12.9 Å for S2 and S1 [47,48]. The z-coordinates of Moore and Reynolds [27] were used for the distribution of atoms within the interlayer space of these layers, except for the distribution of H2O molecules in S2 layers [47,48]. Octahedral Fe occupancy and the number of interlayer cations were also treated as adjustable parameters. Sigma-star (σ*), which represents the distribution of particle orientation [49], was identical for all phases within a given model; however, it was allowed to vary between models for different samples or subfractions [50]. Distribution of CSD sizes was assumed to be log-normal about an adjustable mean value [51].

3. Results

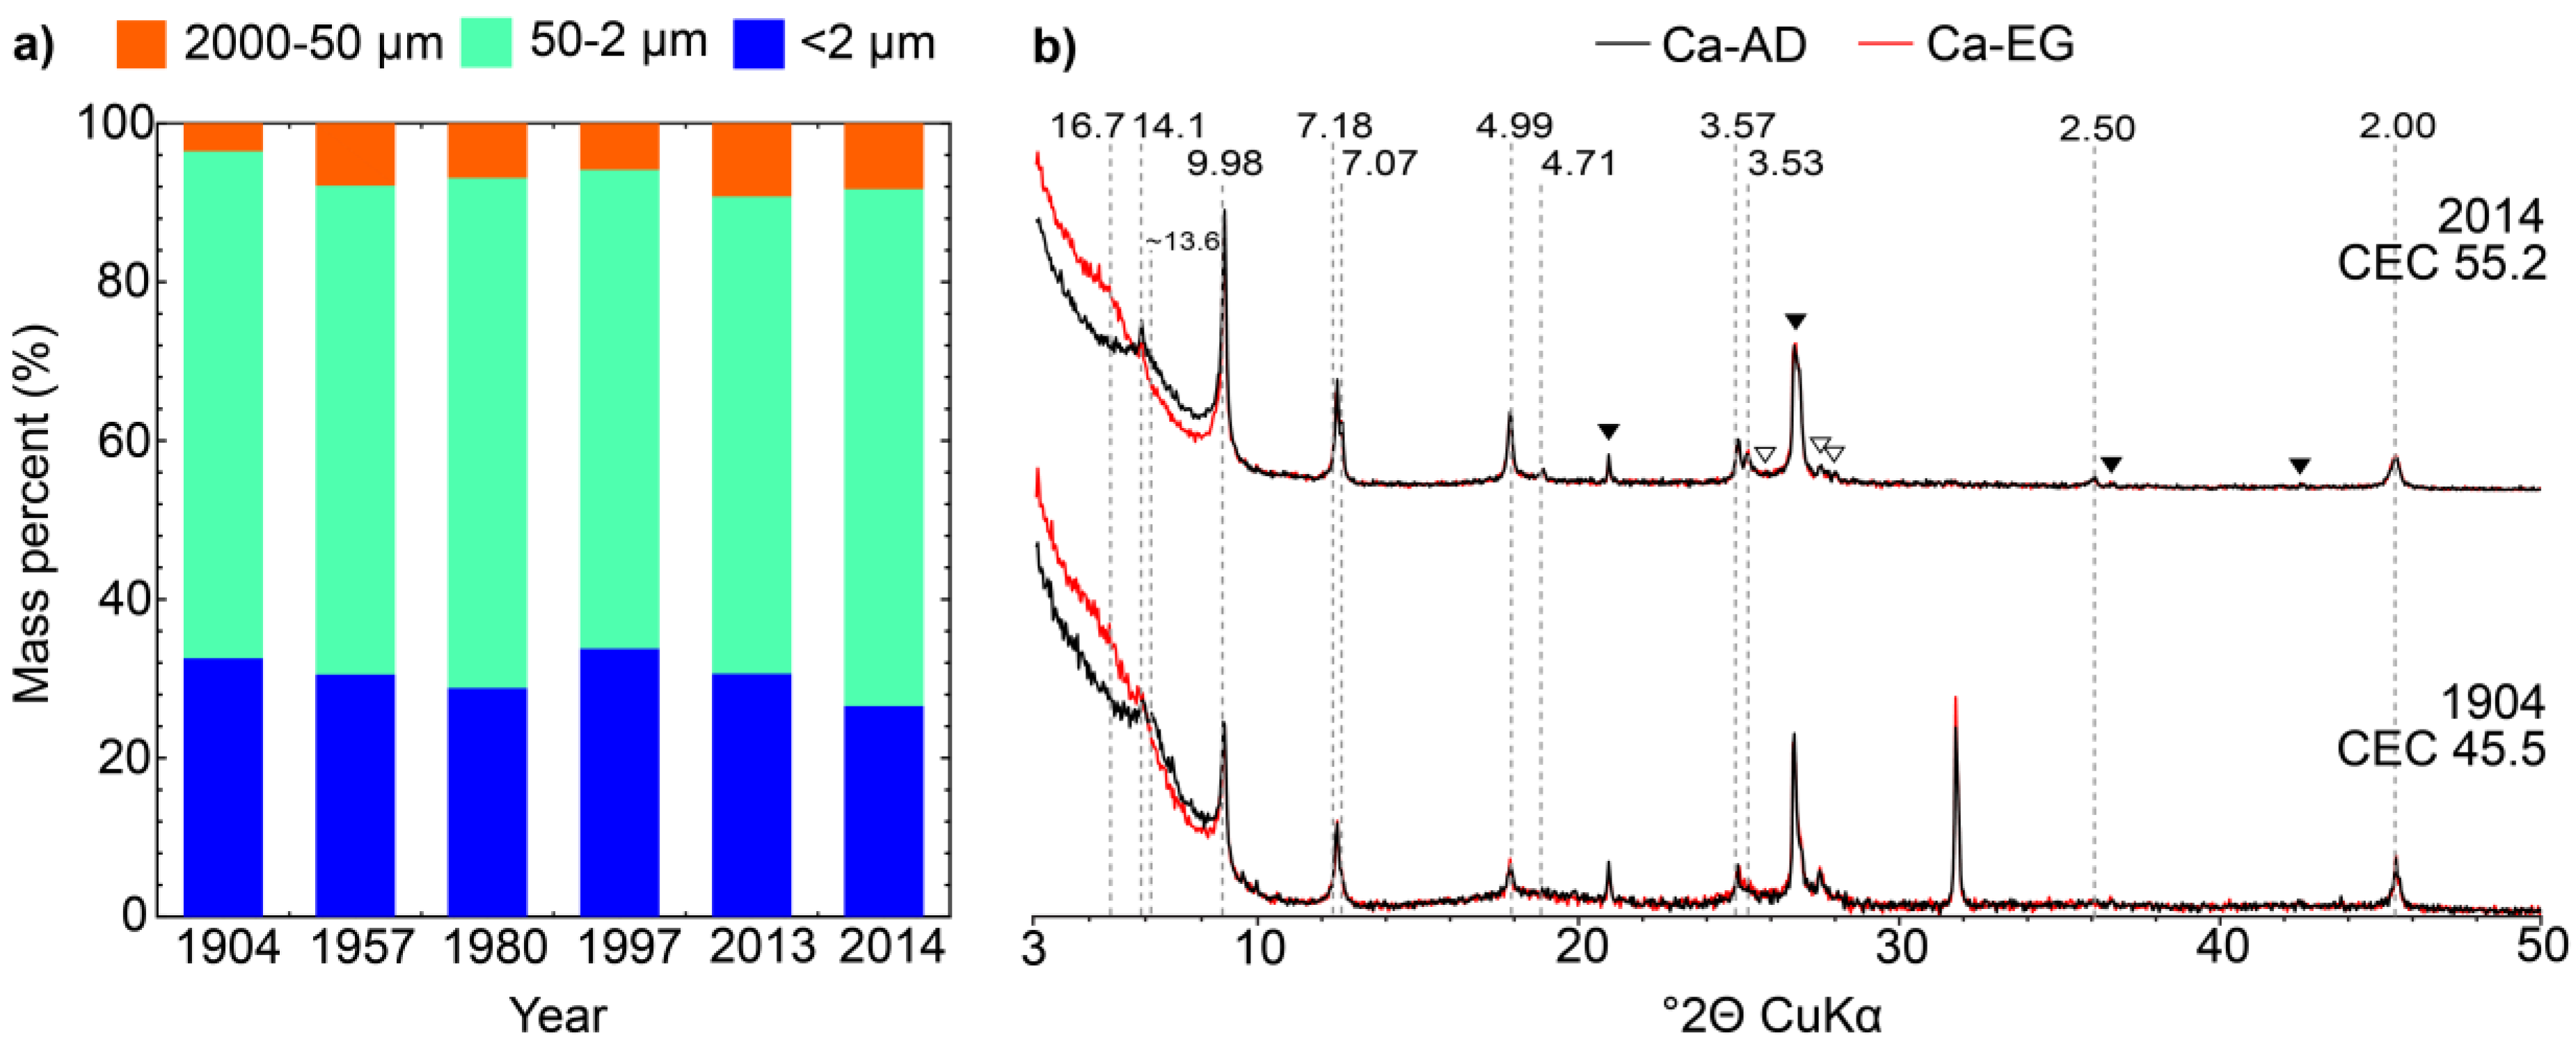
3.1. Mineralogy of the Silt and Clay Fractions

The results of the size-fractionation of samples from 1904 to 2014 are reported in Figure 1, normalized to 100%. Average recovery for all samples was ~95% of the starting weight. The 2 mm–50 μm fraction accounts for 6–8% of the sample mass for all samples from 1957–2014, while the 50–2 μm and <2 μm fractions account for 63–66% and 27–30%, respectively. For 1904 these values are 4, 61 and 35%, respectively, possibly indicating grinding of the sample prior to storage, consistent with the absence of soil aggregates in the sampled jar. The elemental analyses (Table 1) show a slight but systematic decrease in C concentration from 1904 to 2014 while N levels remain relatively constant through the same period, thus leading to a decrease in the C/N ratio. For remaining elements, K, Na, and Si concentrations decrease with time, while those of Al, Fe and Mg increase slightly.
Random powder XRD for the 50–2 µm fractions (Figure S1) indicates the presence of quartz, feldspars (both plagioclases and K-spars), mica, chlorite, and kaolinite, in addition to small reflections associated to calcite, anatase and amphibole. This mineralogical composition is consistent with previous analyses of Rivard et al. [52] for samples from 1904 and 2012 from the MP, although these authors did not report the presence of amphibole or calcite. Older surveys of the Champaign county soils report the presence of these minerals, however [53,54,55,56]. Quantitative phase analysis of 50–2 µm fractions shows they are dominated by quartz (~65–70%), with significant contributions from albite and microcline (10–12 and 10–13% respectively), minor amounts of mica, chlorite, and kaolinite (1–5%) and trace amounts (<1%) of amphibole, calcite and anatase (Figure S1a, Table S1). This mineralogy remained very stable from 1904–2014, notwithstanding some slight variability between different years (Figure S1a, Table S1).
Rivard et al. [52] also noted the presence of illite/muscovite, kaolinite, chlorite, and expandable clay minerals which are present in the investigated samples. To refine the description of these clay minerals, results of XRD analysis of oriented slides prepared from samples <2 µm fractions are shown in Figure 1b. Qualitative analysis of the profiles identifies the presence of quartz and feldspars (Figure 1b, solid black and open triangles, respectively). Discrete illite can be identified through the presence of a rational series of 00l reflections at 9.98, 4.99 and 2.00 Å (the contribution at 3.33 Å is overlapped by that of quartz). Discrete chlorite and kaolinite can also be identified from their rational series of 00l reflections at 14.1, 7.07, 4.71, 3.53 and 2.35 Å (weak) and 7.16, 3.58 and 2.39 Å, respectively; these reflections remain unchanged on EG solvation. The presence of a mixed layer dominated by expandable layers can be identified from the shifts in the peak position of the broad reflection from ~13.6 to ~16.7 Å following EG solvation. Comparison of the XRD patterns of the <2 µm fractions for the samples from 1904 to 2014 shows no systematic variation in either the position or the intensity of the reflections for individual clay phases (Figure 1b). On the contrary, CEC data (Table 1) show an increase of 17% in the CEC from 47–48 cmolc kg−1 in 1904 and 1957 to 55 cmolc kg−1 in 2014 that apparently contradicts the stability of minerals in the clay fraction. An enhanced description of the clay mineralogy is thus necessary to unravel the origin of the measured CEC evolution with time, and subsequent fractionation of the <2 µm was thus performed.

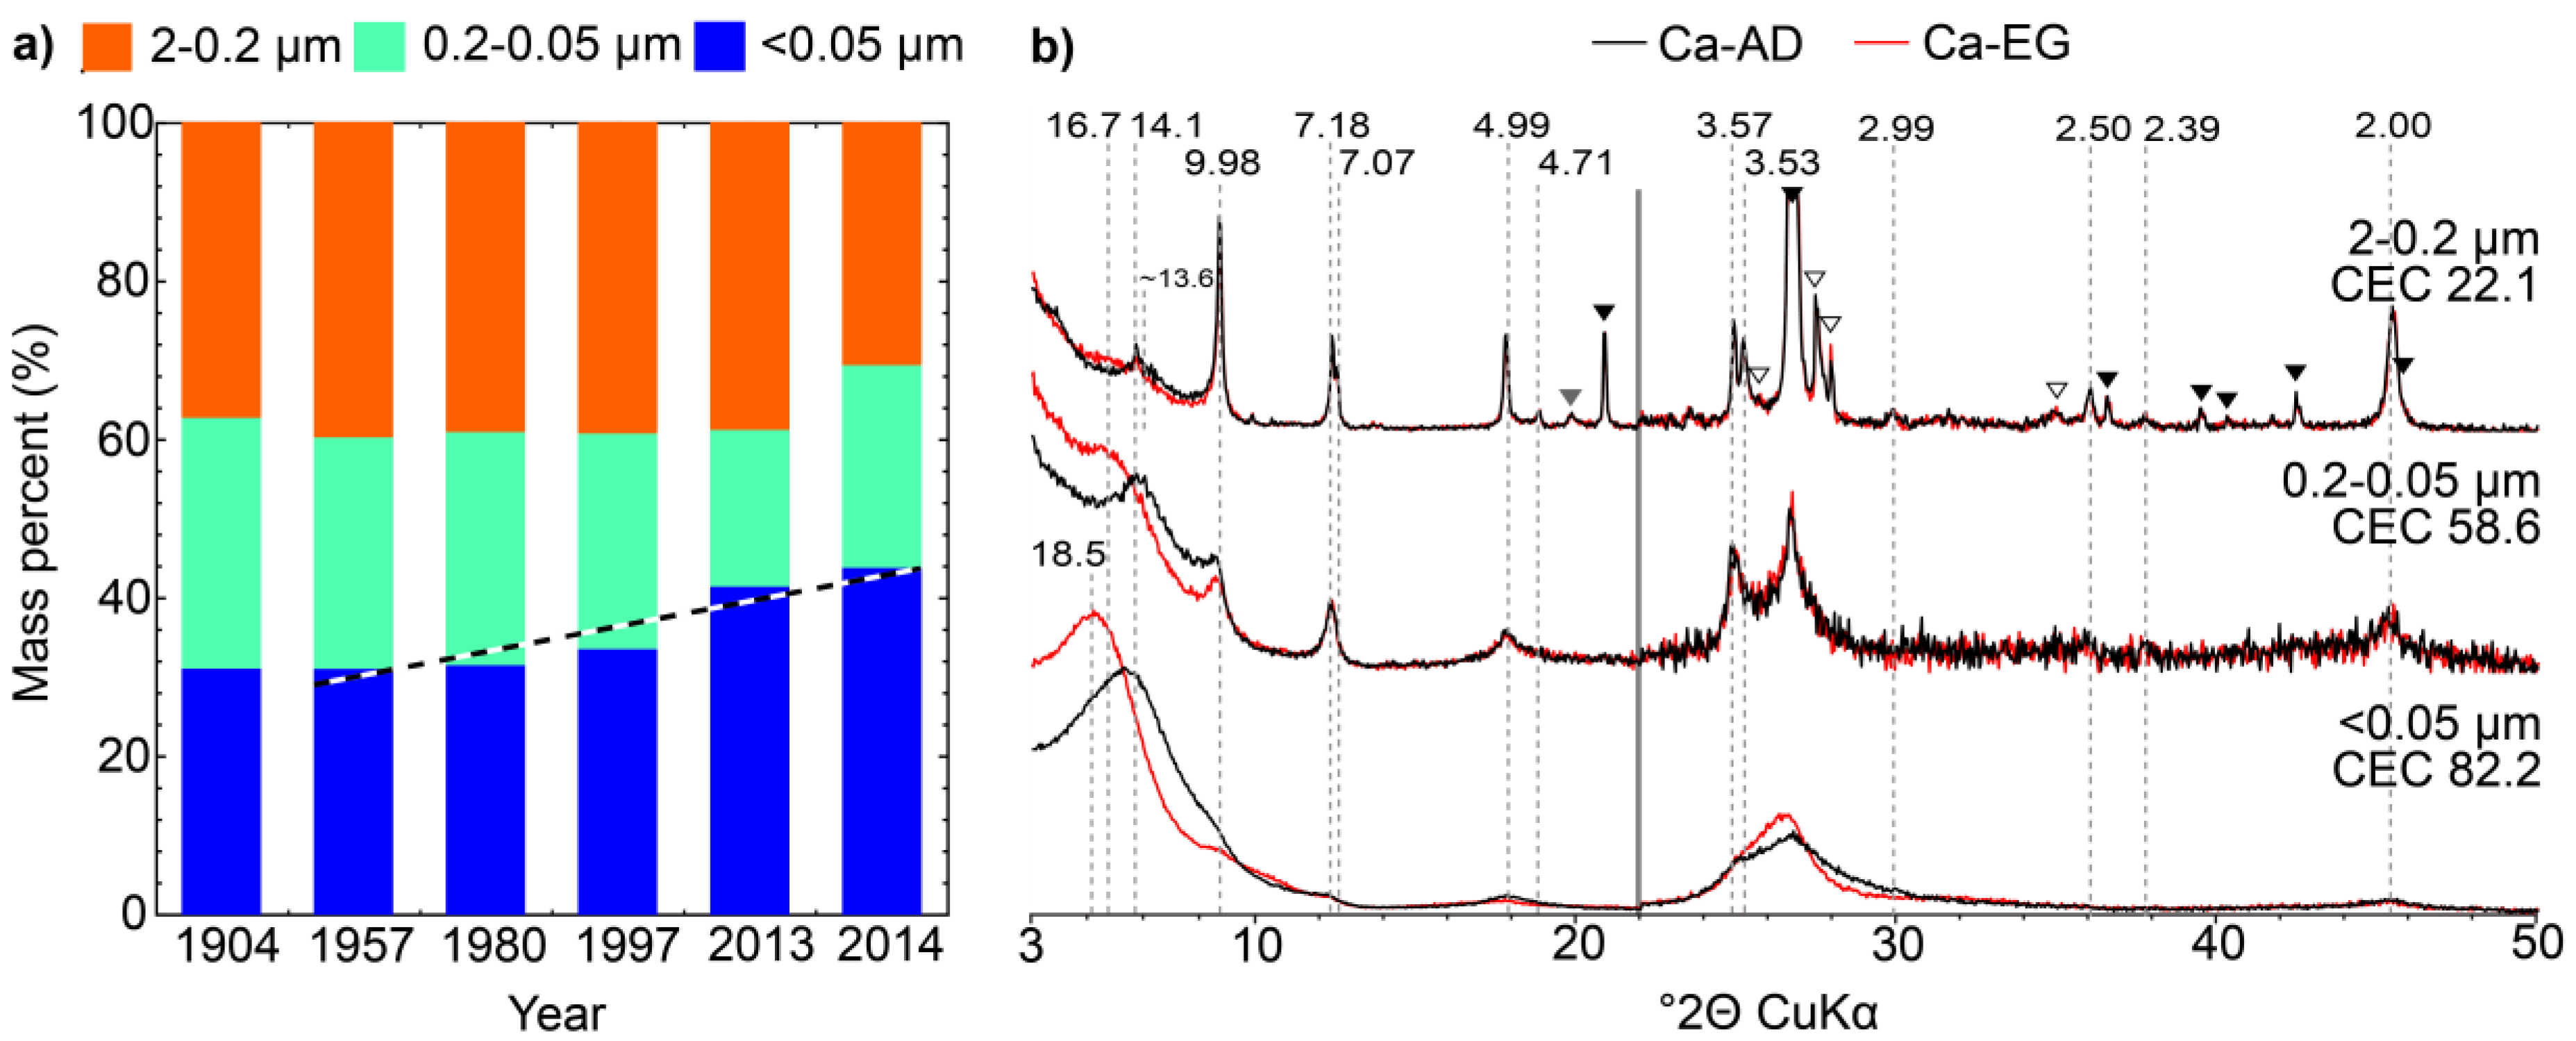
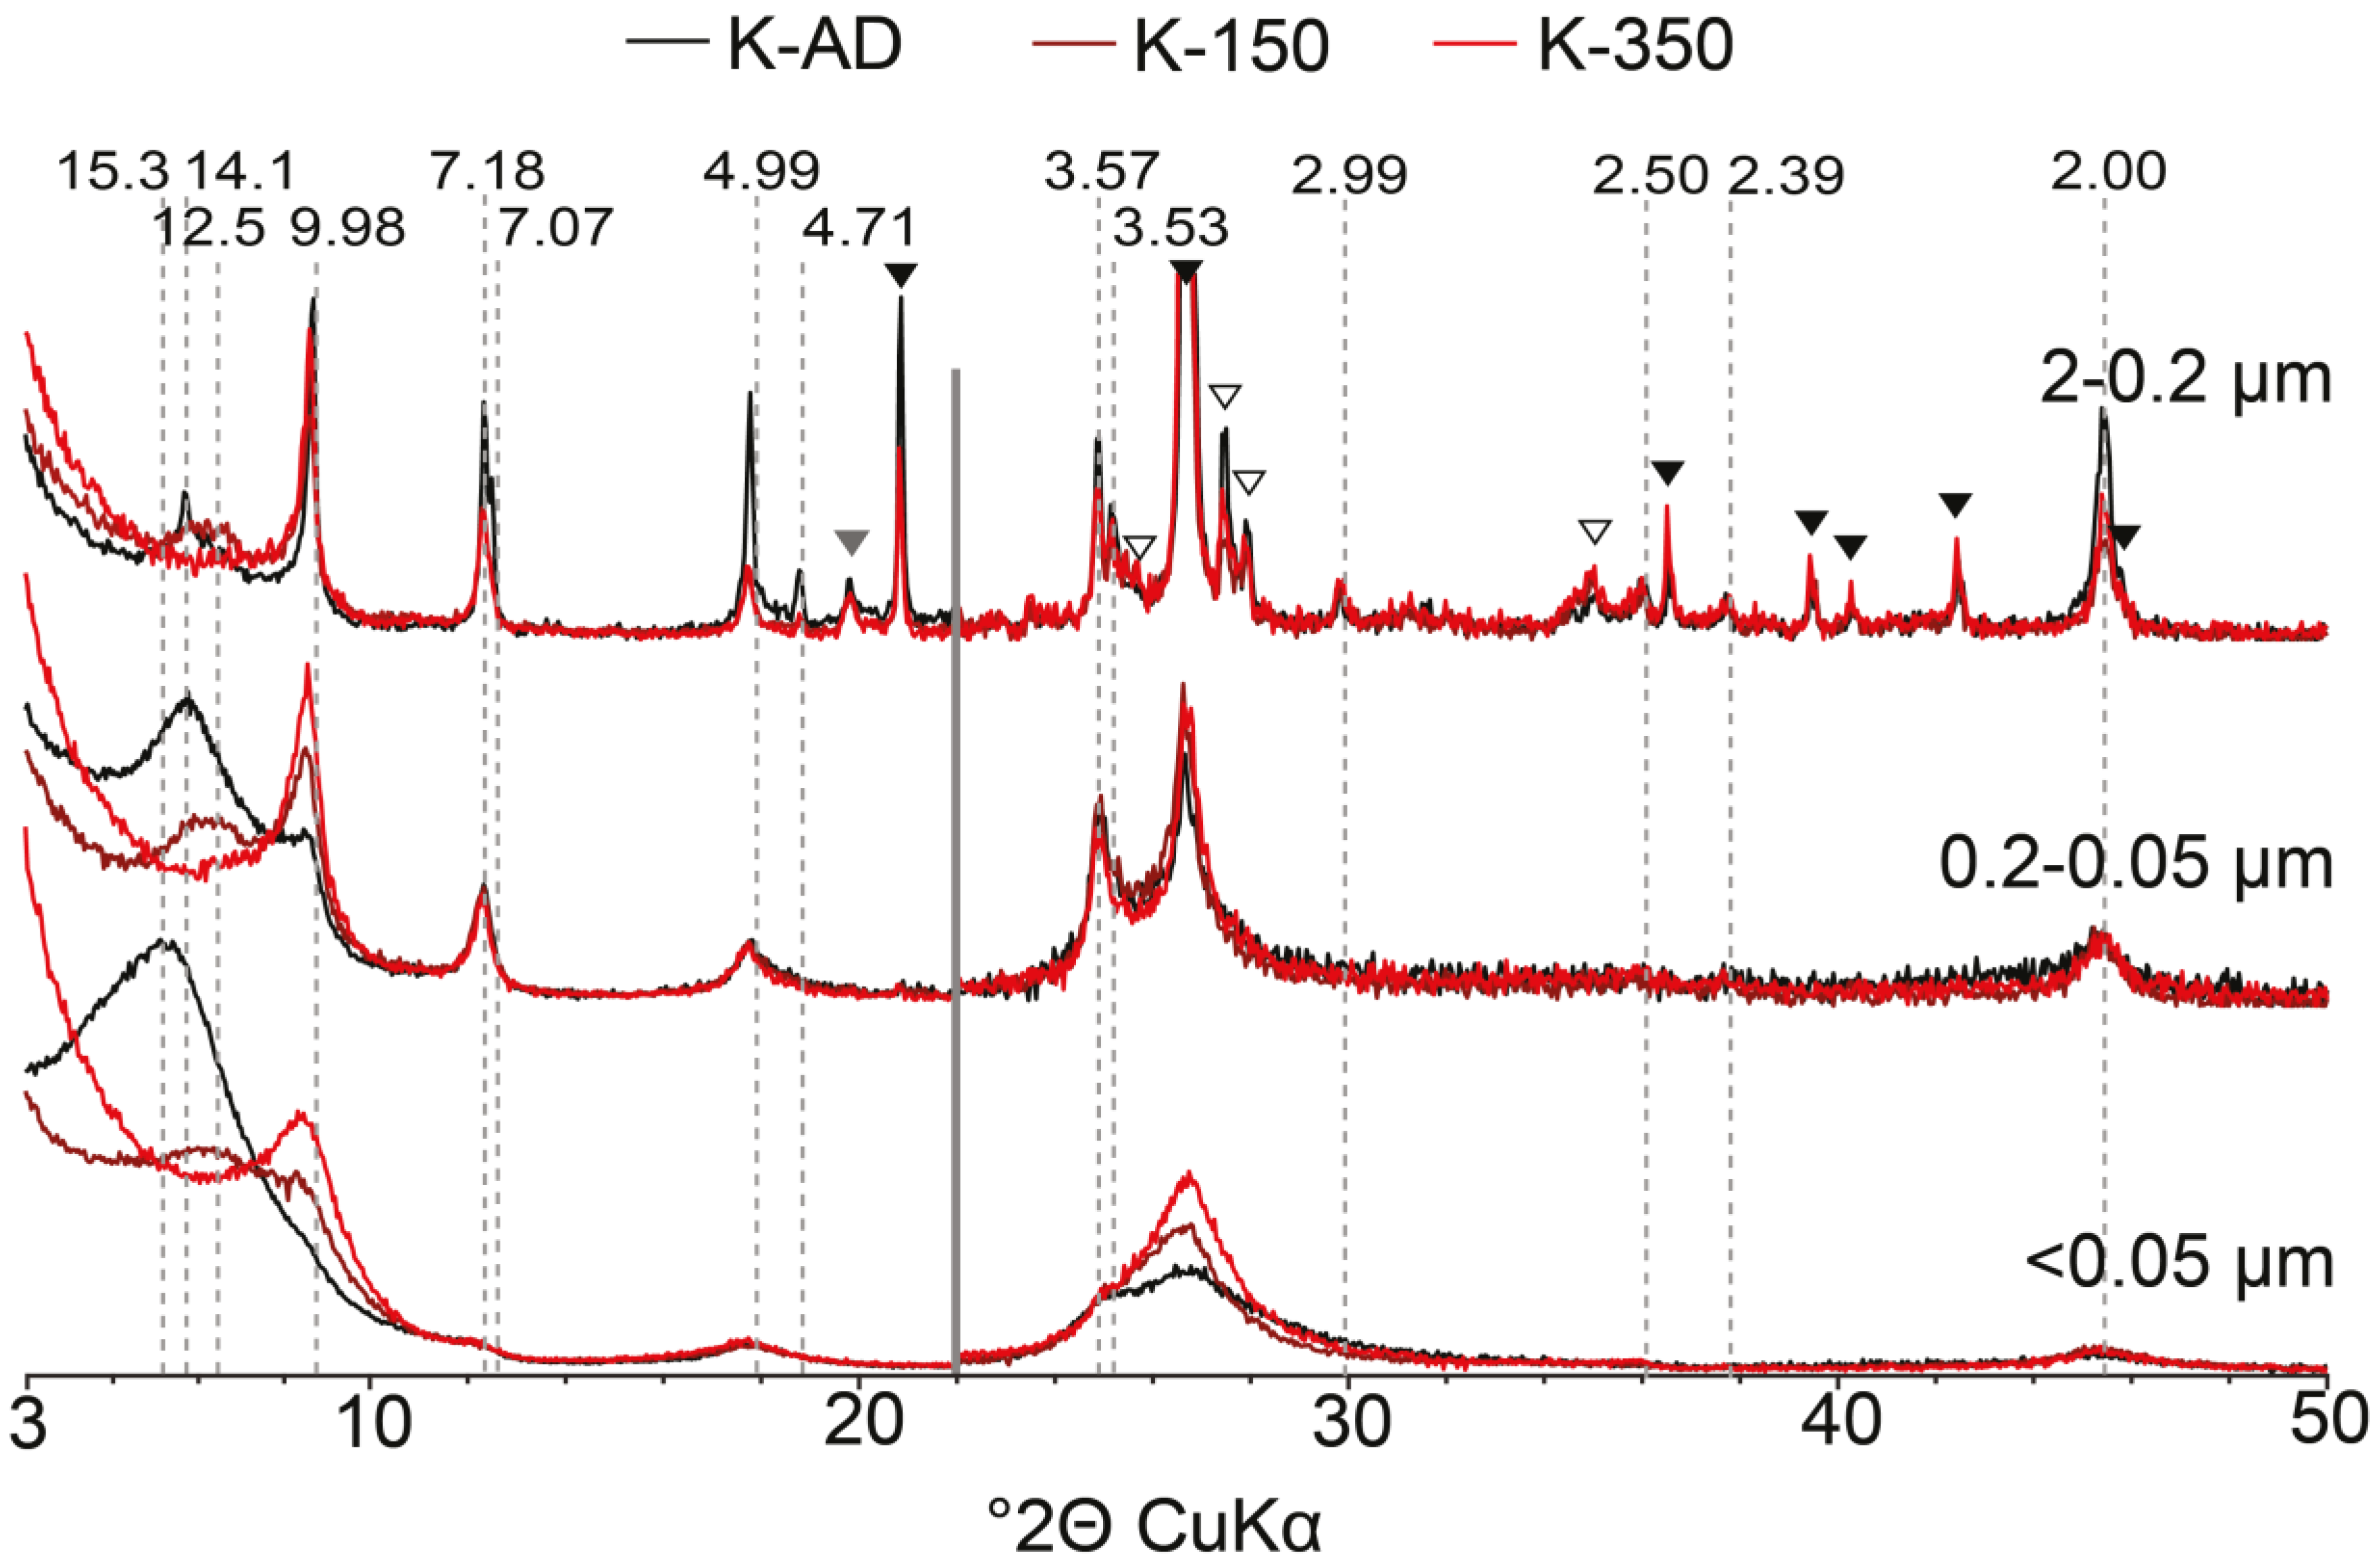
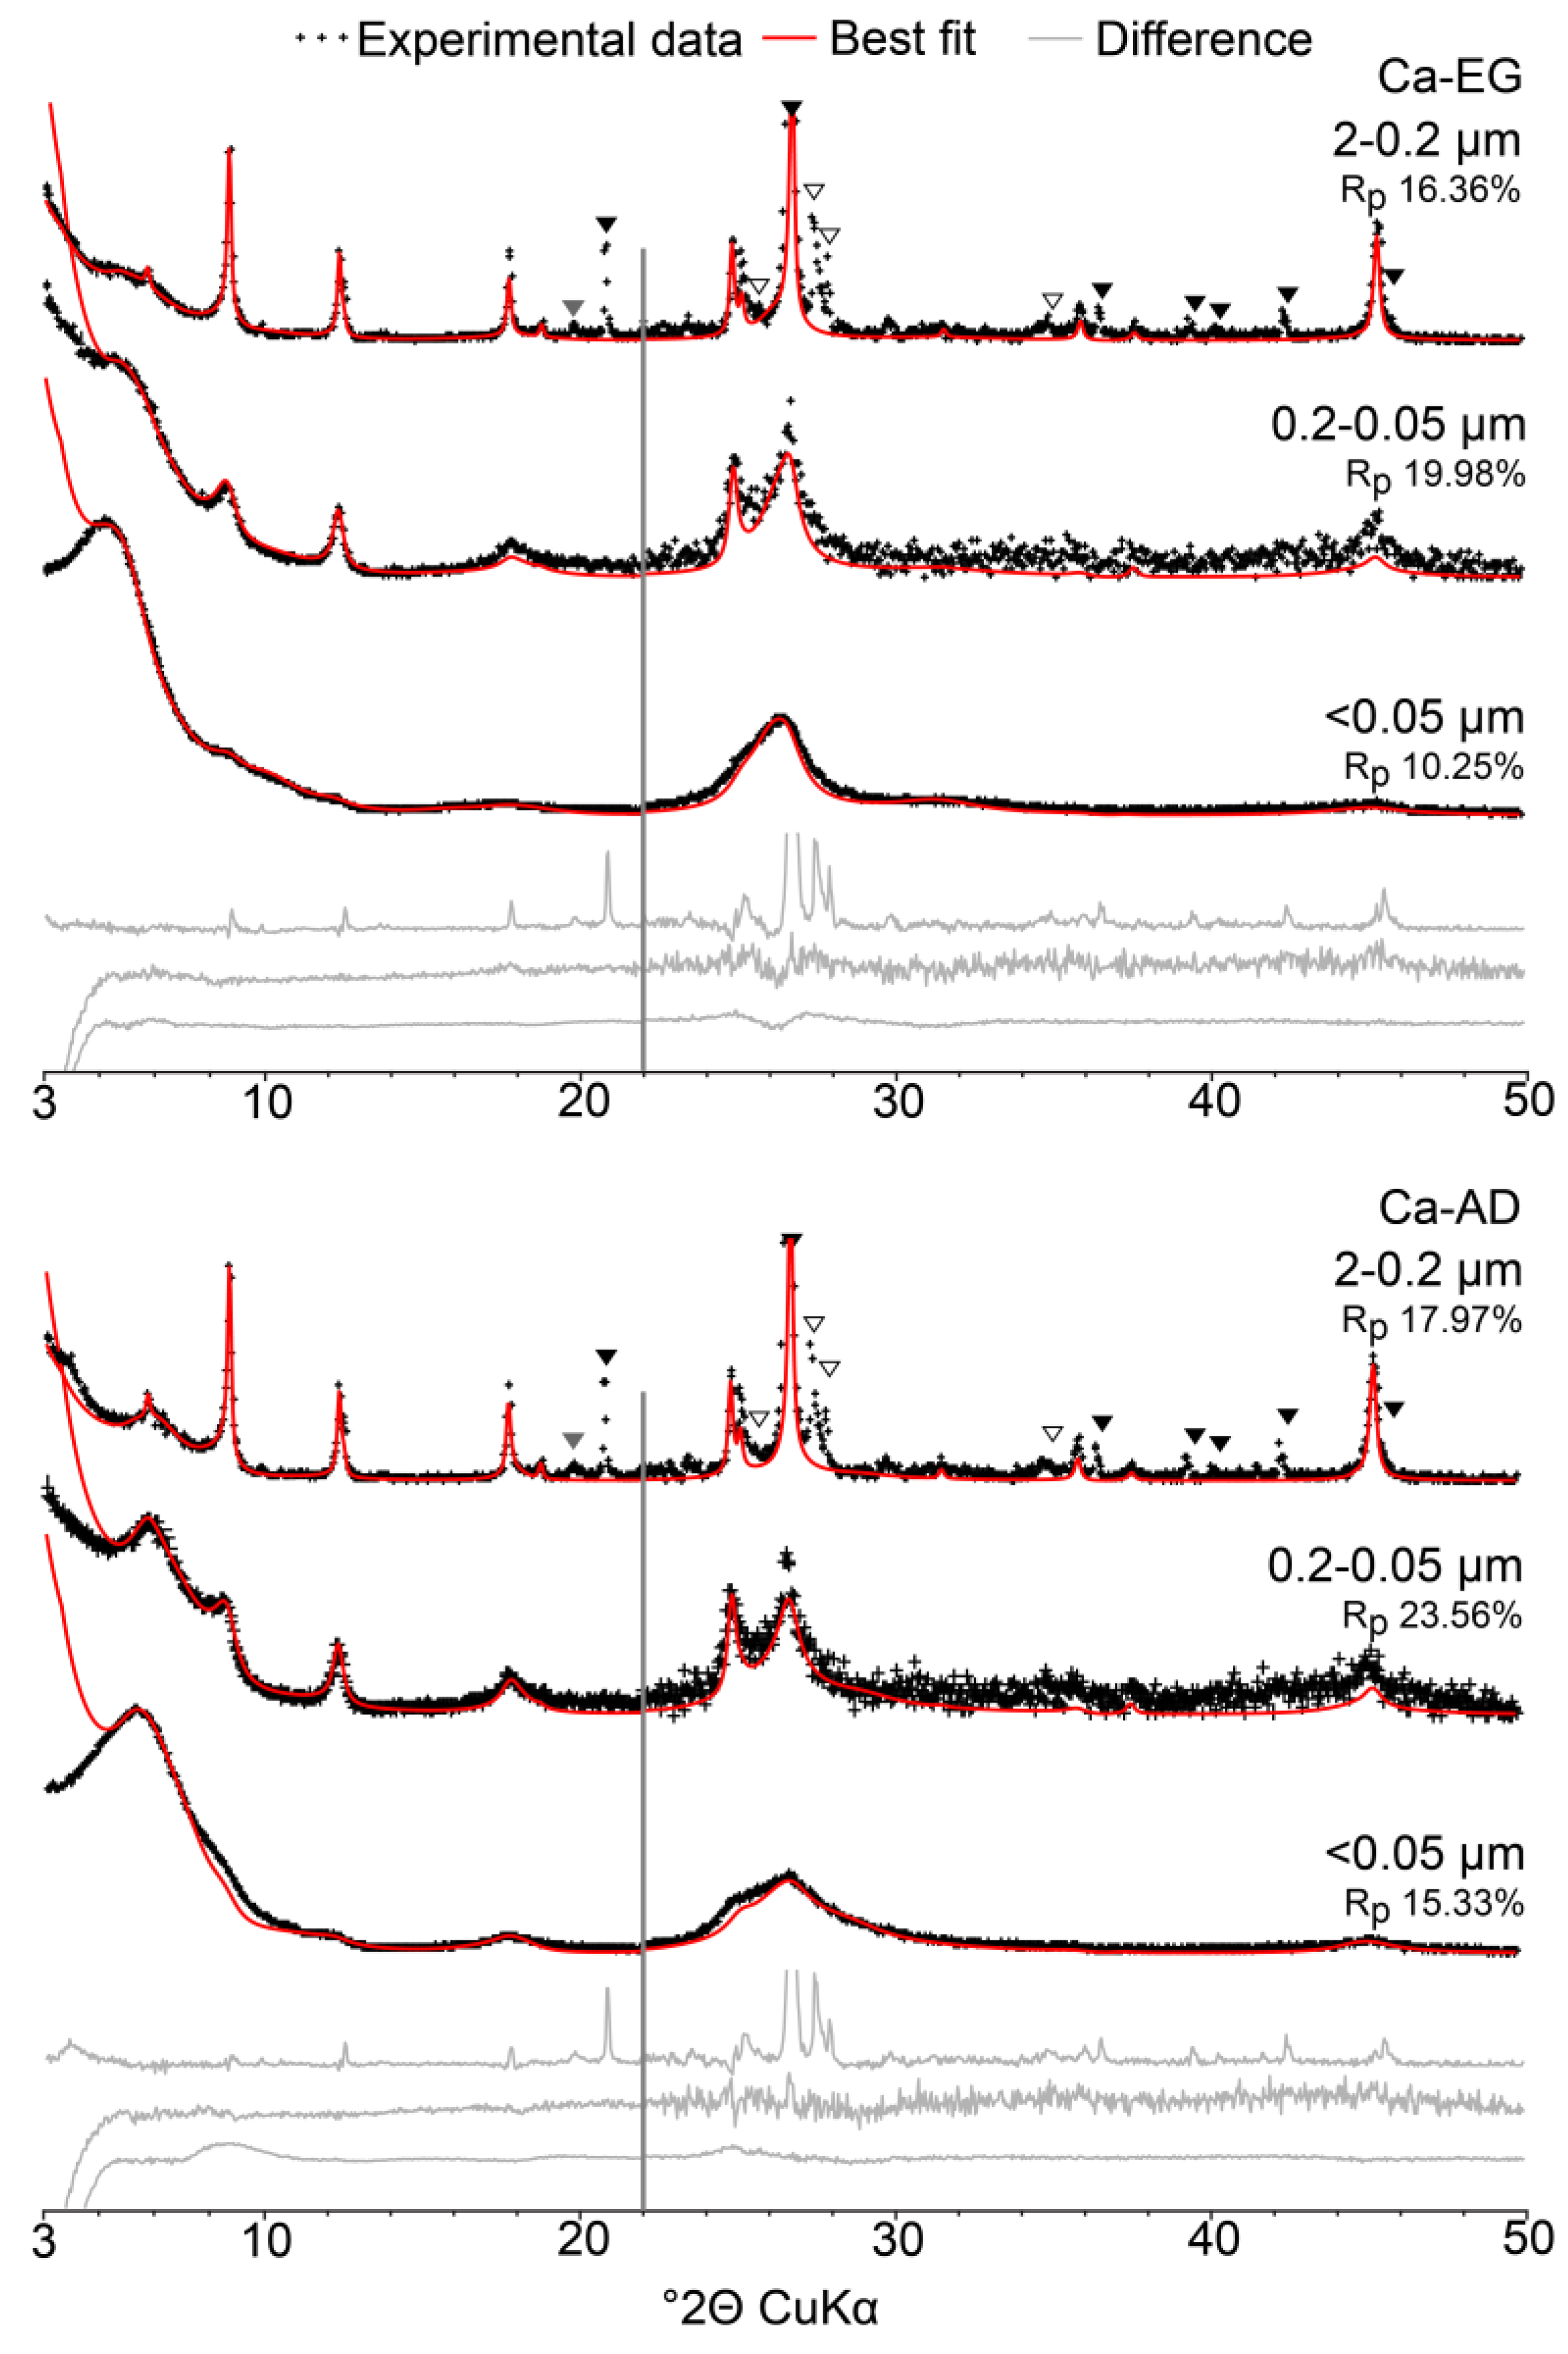
3.2. Qualitative Mineralogy of Clay Subfractions

In the <2 μm subfractions (Figure 2a) the proportion of 2–0.2 μm subfraction is relatively constant at 32–34% for 1957–2014 samples while for 1904 the proportion is 39%, consistent with a possible sample grinding. The proportion of the <0.05 µm subfraction increases almost linearly from 37% in 1957 to 46% in 2013–2014. Consistently, the proportion of 0.2–0.05 μm subfraction decreases from 29% to 22% in the same timeframe. CEC data for 2014 subfractions show a variation with size from 81 cmolc kg−1 for the <0.05 µm subfraction to 14 cmolc kg−1 for the 2–0.2 μm subfraction (Table 2). The CEC measured for the bulk <2 µm fraction of sample 2014 (55.2 cmolc kg−1) is consistent with that calculated as a weighted average of the different subfractions (57.8 cmolc kg−1Table 2). The overall CEC increase with time is thus consistent with the increased proportion of the finest subfraction, which has the highest CEC.
To refine the description of clay minerals in different subfractions, results of XRD analysis of oriented slides are shown in Figure 2b for 2–0.2, 0.2–0.05 and <0.05 µm subfractions of sample 2014. Qualitative analysis of the profiles identifies the presence of quartz and feldspars in the 2–0.2 μm subfractions (Figure 2b, solid black and open triangles respectively). Comparison of XRD patterns from different subfractions shows increasingly broad and asymmetric peaks as size decreases, an indication of decreasing CSD size and/or interstratification, the finest subfractions showing no sharp, well-defined reflections. Both 0.2–0.05 and <0.05 μm subfractions show significant expansion after EG solvation and a large collapse in the K-150 state (Figure 3) which both indicate a greater proportion of expandable 2:1 layers compared to the 2–0.2 µm subfraction, consistent with CEC data.
As for the bulk <2 µm fraction, discrete illite can be identified in the 2–0.2 µm subfraction through the presence of a rational series of 00l reflections at 9.98, 4.99 and 2.00 Å. In the 0.2–0.05 µm subfraction, these reflections are shifted to 10.07 and 4.96 Å in the Ca-AD state and expand further to 10.13 and 4.99 Å, respectively, on EG solvation. This latter shift indicates some interstratification with expandable layers. This phase is indicated by a shoulder centered on ~10 Å in the <0.05 μm subfraction. Discrete chlorite and kaolinite can also be identified in the 2–0.2 µm subfraction from their rational series of 00l reflections. Low-angle asymmetry of the kaolinite reflection at 7.25 Å (see for example the 0.2–0.05 µm subfraction in Figure 2b) suggests the possible presence in the two finest subfractions of a kaolinite-illite (KI) as previously reported [23,24,25]. As in the bulk <2 µm fraction, the presence of a mixed layer dominated by expandable layers can be identified in the 2–0.2 µm subfraction from the shift in the peak position of the broad reflection from ~13.6 to ~16.7 Å following EG solvation. In the 0.2–0.05 µm subfraction, a similar mixed layer also induces a broad maximum at ~13.6 Å in the AD state that shifts to ~16.7 Å after EG solvation. Mixed layers are also responsible for the reflection at ~15.3 Å (Ca-AD; Ca-EG ~18.5 Å) in the <0.05 µm subfraction. Although the initial position of the 001 reflection (AD and EG states) is consistent with the random interstratification of illite and expandable layers, its progressive shift towards 10 Å following K-saturation and heating (Figure 3) indicates the additional presence in the mixed layer of layers chloritic in nature as the hydroxy-interlayer sheet, whose completeness may be variable, prevents direct complete collapse of the interlayer space [57,58,59]. After heating to 150 °C, only part of the expandable and chloritic layers collapse leading to the presence of a broad maximum between ~12 and ~14 Å for all subfractions (Figure 3). After heating to 350 °C, most of the expandable and chloritic layers fully collapsed giving rise to a maximum centered on ~10 Å. This progressive collapse also suggests differing layer-type compositions between mixed layers, as it may reflect variations in smectite dehydration behavior or, more likely, differences in the proportion of chloritic layers. However, the exact nature of mixed layers cannot be ascertained from this qualitative description and simulation of complete XRD profiles is necessary to obtain this information. Quantitative profile fitting was thus performed to unravel possible subtle mineralogical evolution of these subfractions.

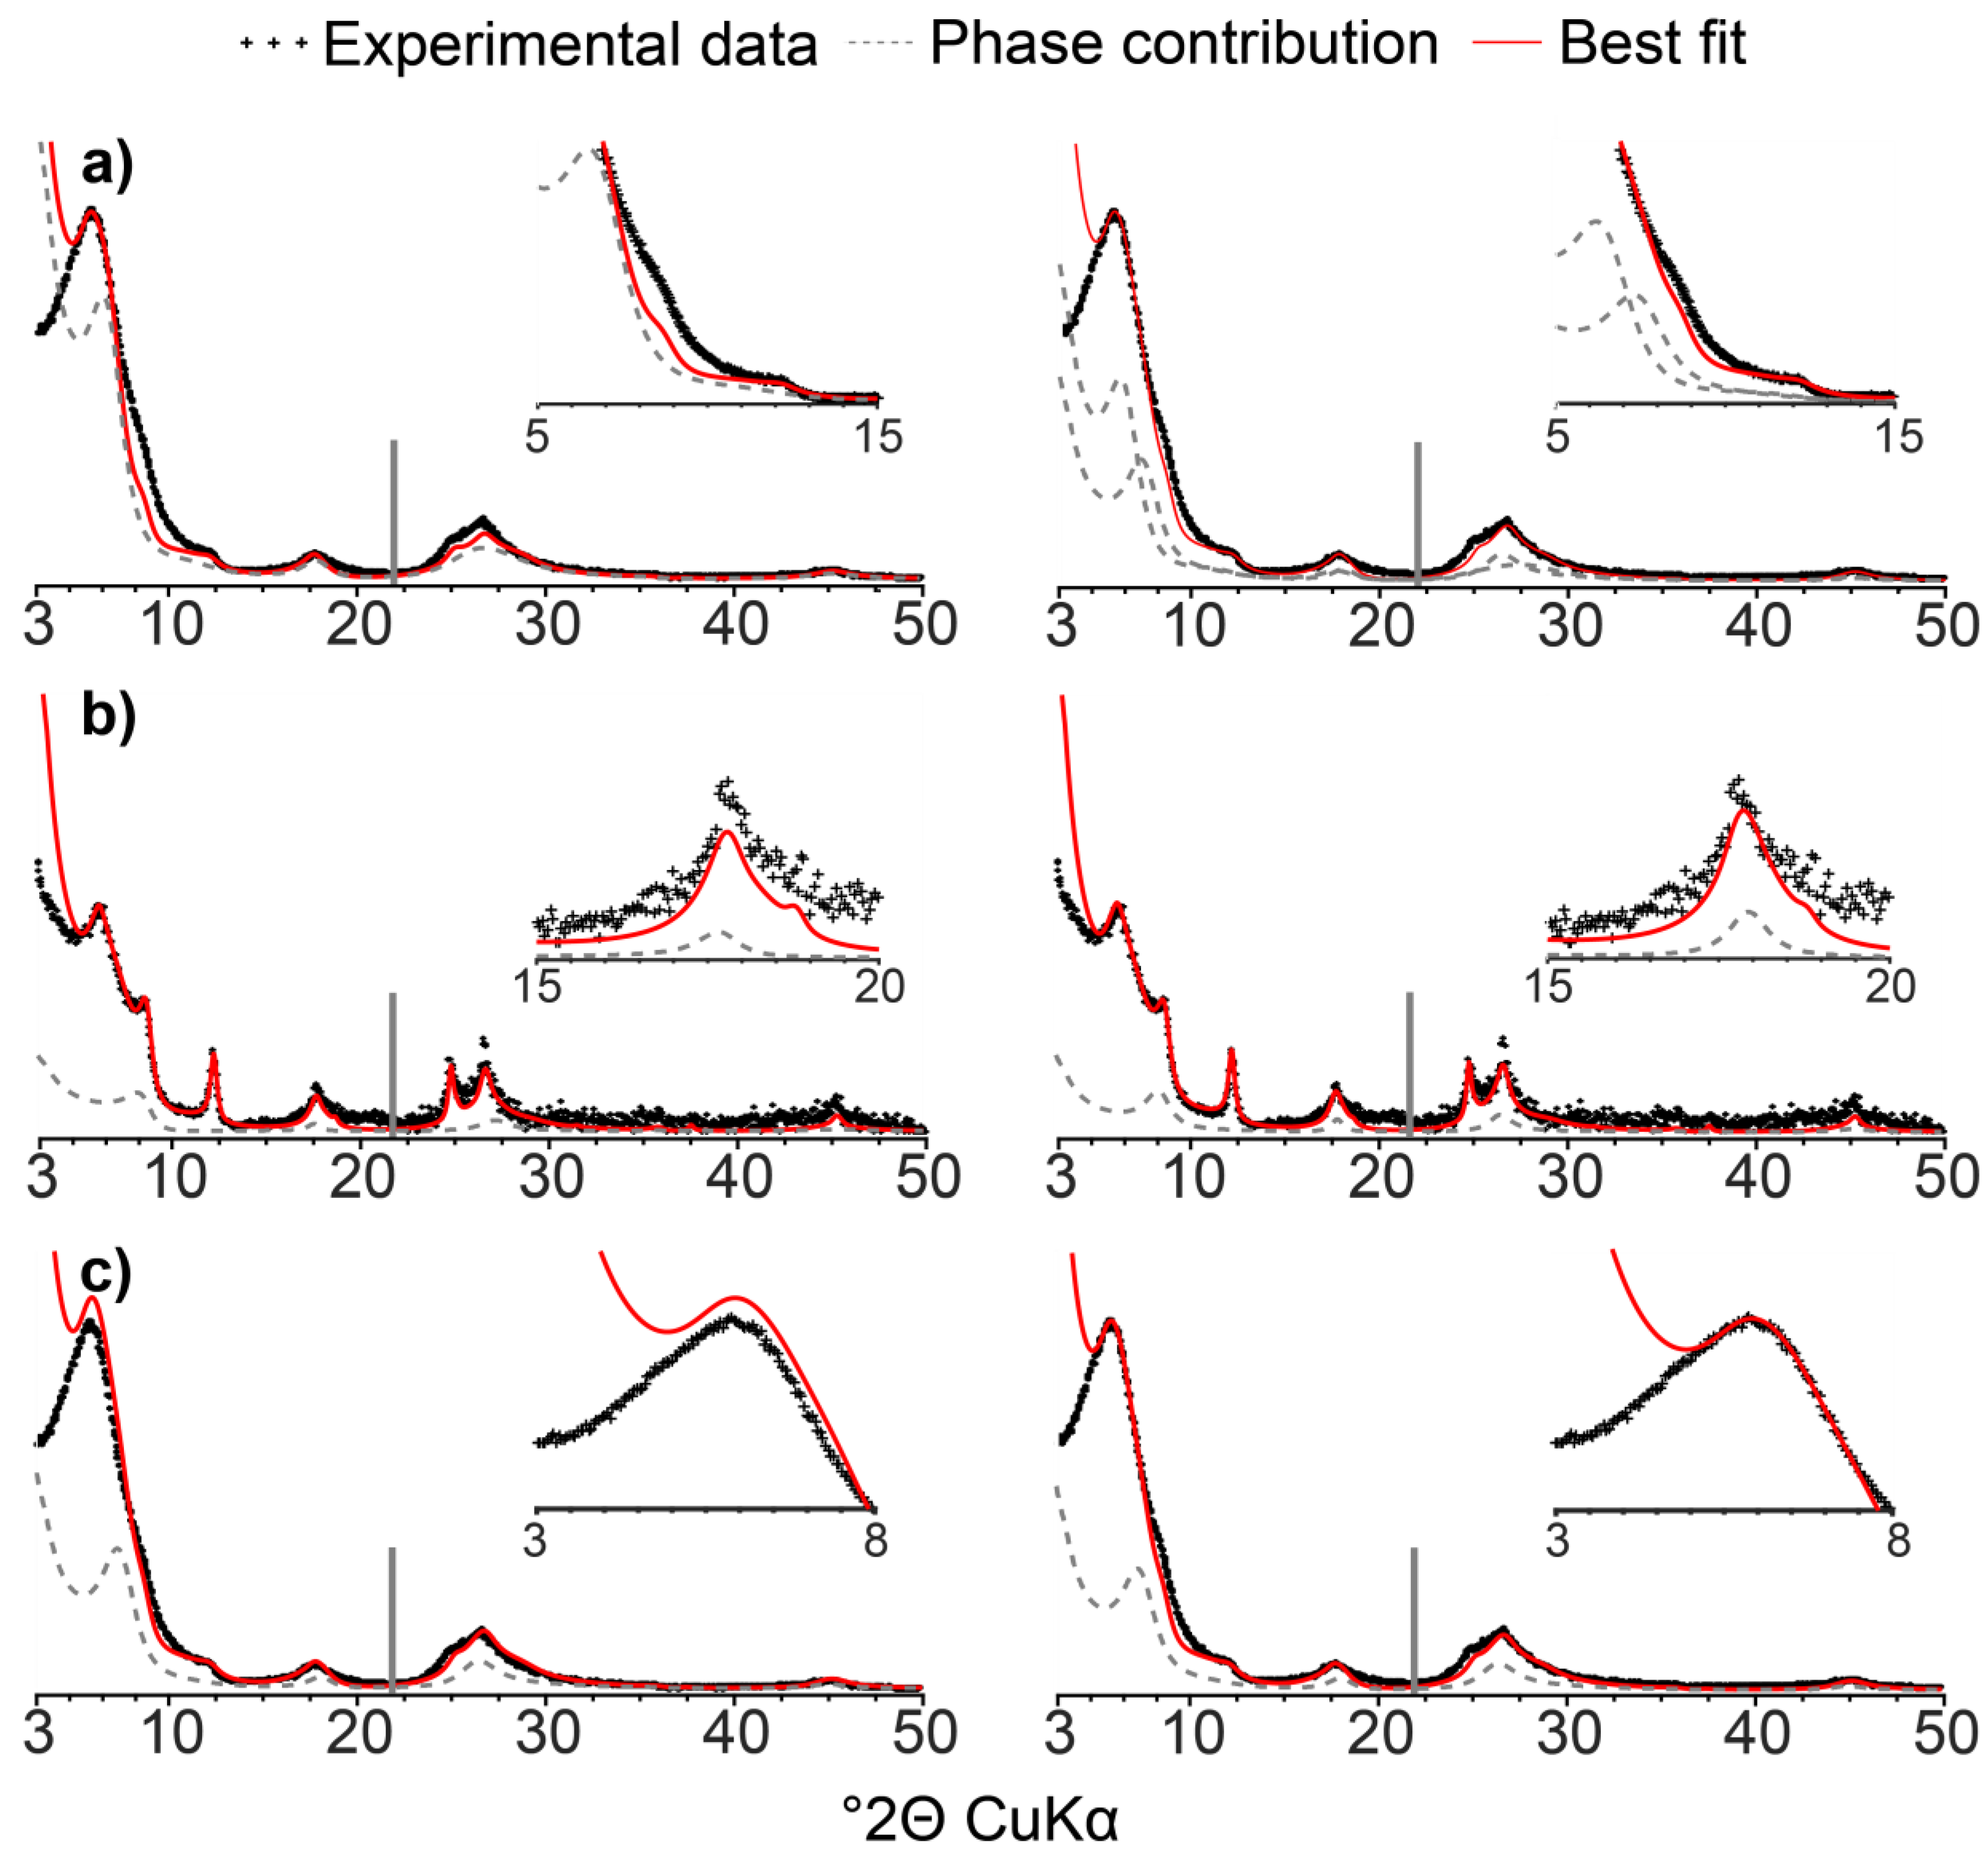
3.3. Quantitative Mineralogy of Clay Subfractions

As comparison of the XRD patterns for all the subfractions for the samples from 1904 to 2014 shows no systematic variation in either the position or the intensity of the reflections for individual clay phases (data representative of the <0.05 µm subfraction in Figure 4), full-profile modelling of clay subfractions will be exemplified for sample 2014. For <2 µm subfractions, a comparison between experimental and calculated XRD patterns is shown in Figure 5 and details of the complete structure models are reported in Table 3. Individual contributions to XRD patterns of the different subfractions are shown in Figure S2. Up to seven mixed layers were introduced to fit XRD data, in addition to the four discrete phases of illite, chlorite, kaolinite and smectite. Relative proportions of the different contributions to the diffracted intensity are reported in Table 4.
For modelling the <0.05 µm subfraction, an illite-S2-S1-chlorite (ISSCh) was introduced to account for the broad maximum at ~10 Å (Ca-AD pattern). Wa, which expresses the proportion of the first layer type in a given mixed layer (in this case illite), was optimized at ~90% (phase notation ISSCh 90). The presence of both S2 and chloritic layers was necessary to properly replicate the position of this maximum in both AD and EG states. A second ISSCh dominated by smectite layers accounts for the maximum at ~15.3 Å and the broad low-intensity shoulder centered on 3.10 Å (Ca-AD state). The position of the low-angle reflection in the AD specimen (~15.3 Å) and its shift to ~18.5 Å upon EG solvation is indicative of an essentially expandable contribution. A small proportion of chloritic layers were introduced, however, due to the non-complete collapse of K-150 samples to ~10 Å. This mixed layer also contains ~5% illite layers (ISSCh 5). Two additional ISSCh (ISSCh 50 and ISSCh 35) were considered to account for the broad and weakly modulated high-intensity range between the previous two contributions at ~10 and ~15.3 Å (Ca-AD pattern—Figure S2). ISSCh 50 also significantly contributes to reflections at 4.90 and 3.38 Å (Ca-AD state), whereas ISSCh 35 provides a significant contribution to the broad reflection centered on 8.50 Å (Ca-EG state) and to the reflection at ~3.38 Å (both Ca-AD and Ca-EG states). Most of these mixed layers contained chloritic layers to account for the incomplete collapse of the 001 reflection between ~12 and ~14 Å following K-150 treatment. Finally, a pure smectite with extremely low CSD size was necessary to account for the shoulder at 20.30 Å (Ca-EG), and a minor KI contribution (Wa = 80) was hypothesized to explain the asymmetric kaolinite peak tails at 7.25 and 3.52 Å (Figure S2). To reproduce the apparent irrationality of the spacing, partial segregation was assumed between the two layer types (KI R1 notation).
For 0.2–0.05 µm subfractions, contributions with very similar compositions and augmented CSD sizes were used together with an additional ISSCh with Wa ~80 (ISSCh 80). This latter contribution allowed fitting the low-angle broadening of the sharper 10 Å reflection, compared to the <0.05 µm pattern (Figure S2). Discrete kaolinite was also introduced to account for the rational series of reflections at 7.16, 3.58 and 2.39 Å. Finally, due to the presence of shoulders at 4.76 and 3.51 Å an illite-chlorite, with few illite layers (ICh, Wa = 3) was introduced. For the 2–0.2 µm subfraction, discrete illite was also introduced to account for the rational peak series previously described; the proportion of illite layers in ICh was also decreased compared to the 0.2–0.05 µm subfraction. The relative proportions of all contributions are reported in Table 4. For each contribution, proportions determined for Ca-AD and Ca-EG states agree within 5%, bringing strong constraints to the structure model which can thus be treated with reasonable confidence. There is however some misfit on either side of the 001 reflection at ~10 Å and again at ~3.53 Å in Ca-AD state for the <0.05 µm subfractions of all samples which suggests that the optimized model does not fully account for sample complexity.
Similar contributions were used to model all the <2 µm subfractions from 1904–2014, with only limited modifications of their composition (layer-type proportions) and CSD sizes. Optimized proportions of the different contributions (Figure S3, Table S2) show considerable, but not systematic, variations over the period studied. In particular, the 2–0.2 µm subfractions of 1957 and 2014 contains less discrete illite than the other 2–0.2 µm subfractions, whereas those of 1904 and 1997 contain more discrete illite. The amounts of discrete chlorite, discrete kaolinite and KI do not show any significant changes within 2–0.2 µm subfractions (Table S2). While discrete illite content decreases in the 0.2–0.05 µm subfractions between 1957 and 2014, this change is limited and accompanied by a concurrent increase in the proportion of ISSCh 90, the overall contribution of both phases being about stable over the study period. With time, the proportion ISSCh 50 and ISSCh 35 appear to increase slightly in the <0.05 µm subfraction (Figure S3, Table S2), but again this effect may not be significant. Finally, compositions and proportions of the various contributions to diffracted intensity also confirm the qualitative assessment of decreasing expandability with increasing size, discrete illite dominating the 2–0.2 μm subfractions.

4. Discussion

4.1. Validity of the Proposed Structure Model

The modelling of XRD data from different clay subfractions provides quantitative compositional information on discrete and interstratified phases present in the soil clay fraction. A satisfactory replication of XRD data was achieved for all subfractions, with minor misfits only over 8–10 and 24–26° 2θ ranges in AD conditions for <0.05 µm subfraction, and between 24 and 26° 2θ for the same subfraction under EG treatment. XRD data modelling highlights a complex mineral assemblage with the coexistence of various mixed layers with close compositions. The actual presence of such contributions is validated using the multi-specimen method and of contributions having similar compositions, and contrasting CSD sizes, for all subfractions. The complexity of the proposed structure model (coexistence of mixed layers with close compositions, systematic presence of chloritic layers in multicomponent ISSCh mixed layers, etc.) may require further justification, however. Fitting the structure model to XRD data obtained from different treatments (mainly Ca-AD/EG in the present study) can be used also to assess the sensitivity of the model to the actual presence and composition of mixed layers. In particular, the necessity of both ISSCh 35 and 50 contributions can be assessed by substitution with a phase of intermediate composition and CSD size between the two used in the best-fit model of the <0.05 µm subfraction. This substitution increases the misfit in the 8–10° 2θ range and does not allow to replicate the breadth of the 001 reflection. Misfit in the region of 24–26° 2θ is also increased (Figure 6a). Similarly, when chloritic layers are replaced by smectite (S2) ones in ISSCh 80, not only is the fit of the ~10 Å maximum degraded in AD conditions, but the 15–20° 2θ reflection is affected by broadening and positional shift to lower angles compared to the best fit (Figure 6b). Furthermore, the model is sensitive to the actual structure of interstratified layers. For example, when interlayer occupancy of brucite sheets in chloritic layers in ISSCh 50 was decreased from 5.4 to 4.9 (per O20(OH)16—a variation of 10%), misfit in the intensity of the 001 maxima is observed, in addition to a slight increase of the misfit in the 7–10 Å region (Figure 6c). In the present case, comparison of XRD data obtained not only for Ca-AD and Ca-EG treatments, but also for K-150 treatment provide additional information on the presence of chloritic layers in complex ISSCh. In particular, this additional treatment allows rejecting the structure model initially proposed by Khan et al. [60], as the major contribution of K-Exp to the XRD pattern of the <0.05 µm subfraction proposed by these authors is not consistent with the observed positional shift observed upon K-saturation and heating (Figure 3). More specifically, the absence of any increase in intensity over the 9–12 °2θ range, that is in between the positions corresponding to periodic kaolinite and periodic collapsed K-saturated smectite as expected for the interstratification of these two layer types [28,46,61], substantiates this rejection. Such additional constraints derived from K-saturation and heating, a common chemical treatment in mineralogical analysis [57], are especially useful when fitting weakly modulated XRD patterns obtained from the finest clay subfractions. Evolution of peak position upon K-saturation and heating is especially useful to differentiate interstratification of expandable layers with non-expandable 1:1 or 2:1 layers that may result in similar XRD patterns [23,24,25,60]. Specifically, K-saturation and heating would result in low- and high-angle asymmetry of the maximum at ~10 Å for I-Exp and K-Exp, respectively. When properly completed by such additional constraints, the fitting of XRD data obtained by sequential fractionation allows to conclusively identify the presence of mixed layers and to determine their composition, information that is unobtainable when considering the bulk <2 µm fraction.

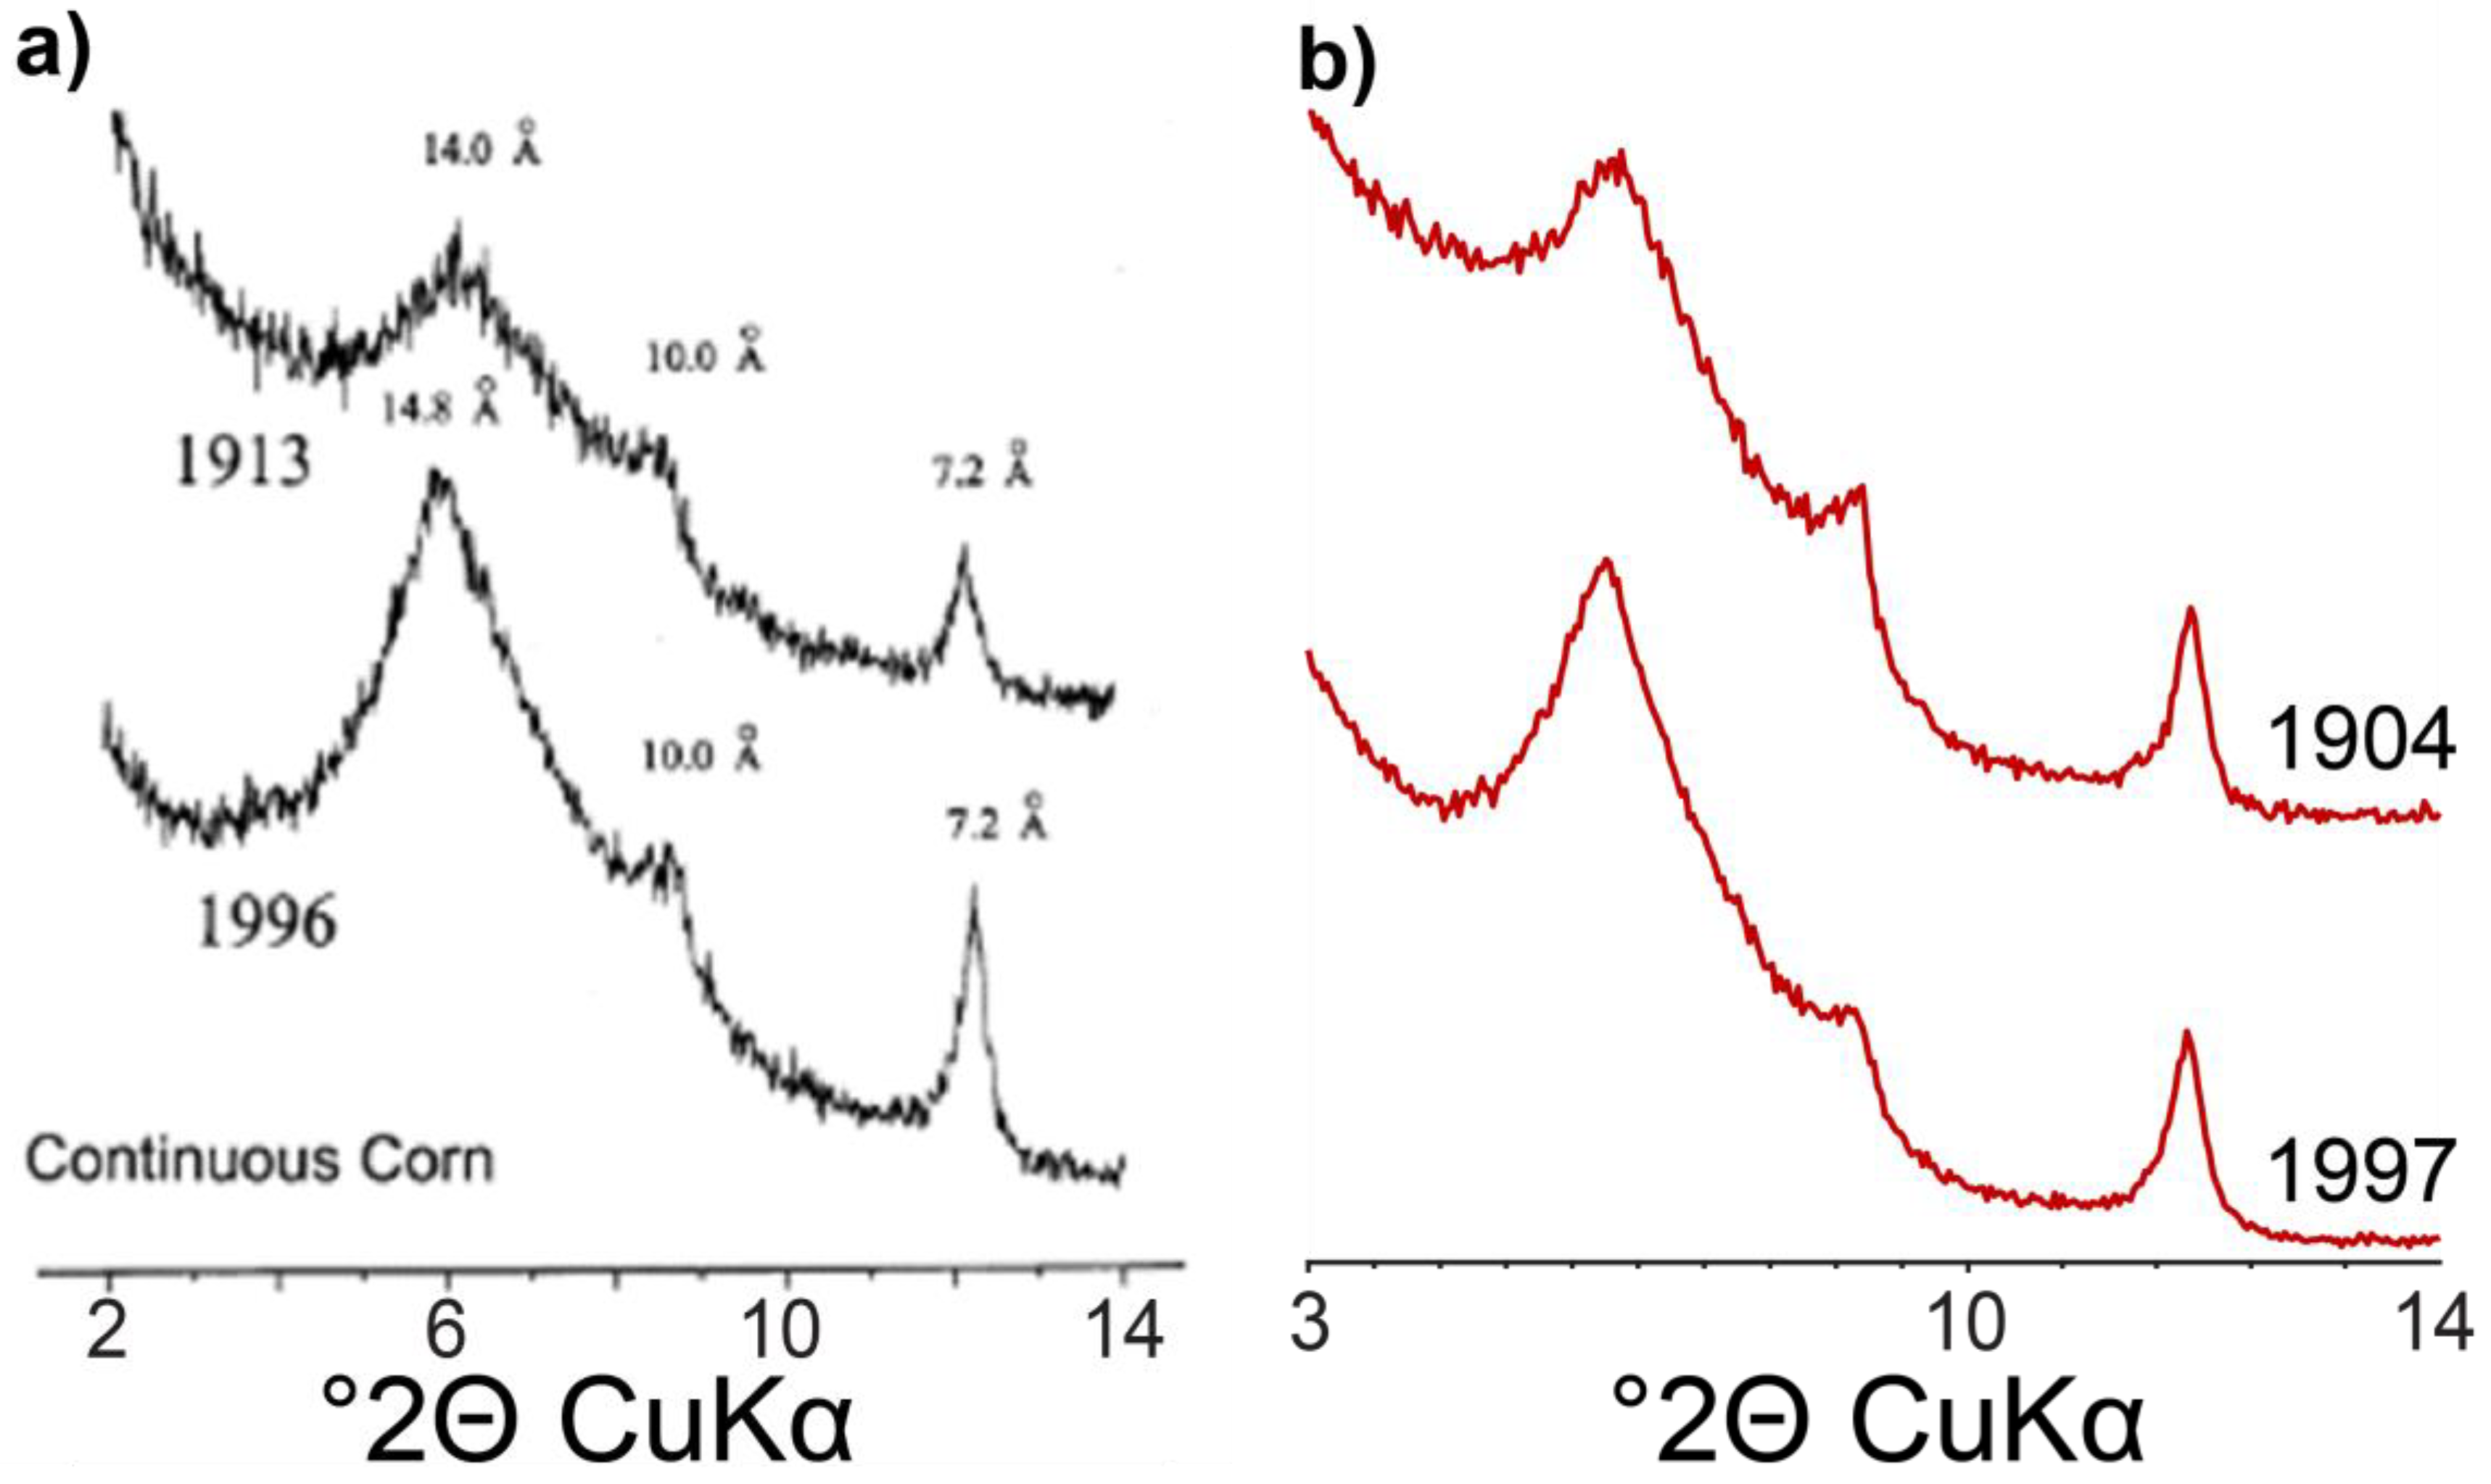
4.2. Comparison with Previous Assessment of the Mineralogy of the MP

Clay mineralogy of the MP was previously investigated by Velde and Peck [15] to decipher the influence of cultivation practices on the weathering of soil clay minerals. Their study, performed using the peak decomposition method, proposed a structure model based on comparisons of AD and EG XRD patterns. Please note that although XRD data from <2 µm fractions obtained by Velde and Peck resemble that of 0.2–0.05 µm subfractions obtained in the present study (Figure 7), the contribution of the finest <0.05 µm subfraction is essentially overlooked. To replicate AD patterns, the authors used four different contributions: two randomly interstratified illite-smectite, one rich in smectite (smectite-IS, WI < 50) and the other rich in illite (illite-IS, WI = 60), and two contributions described as well- and poorly-crystallized mica/illite. The authors were not able to reproduce experimental data in the EG state using the same contributions, as the description of the first low-angle complex maximum was reduced to a single IS contribution, in addition to the two illite contributions. In the present study, the full-profile modelling resolves the 001 reflection into the contributions from different ISSCh and permits refinement of their compositions to include chloritic layers. Qualitative interpretation of XRD data is unable to obtain this information, as qualitative assessment is limited to the identification of well-defined reflections which tend to be from discrete and/or well-crystallized clay mineral phases and <0.05 µm contributions are essentially overlooked. As these results show, the <0.05 µm subfraction is dominated by mixed layers with small CSD sizes which are not detected by analysis of <2 µm fractions due to their broad, diffuse reflections although they account for 35–45% of the <2 µm sample mass. The full-profile method is also able to progress beyond the description of well- and poorly-crystallized illite to identify illite-dominated mixed layers with the presence of minor chloritic and/or smectite layers (ISSCh 80 and 90). Furthermore, the full-profile model allows quantifying the contributions of kaolinite and KI required by the subtle variation of higher-angle maxima. While the general observation of abundant 2:1 clay minerals reported in the present study is consistent with previous results [15], the full-profile modelling provides a more comprehensive picture of the nature of the soil clay mineral assemblage, and in particular of the nature, composition, and relative proportions of the mixed layers.

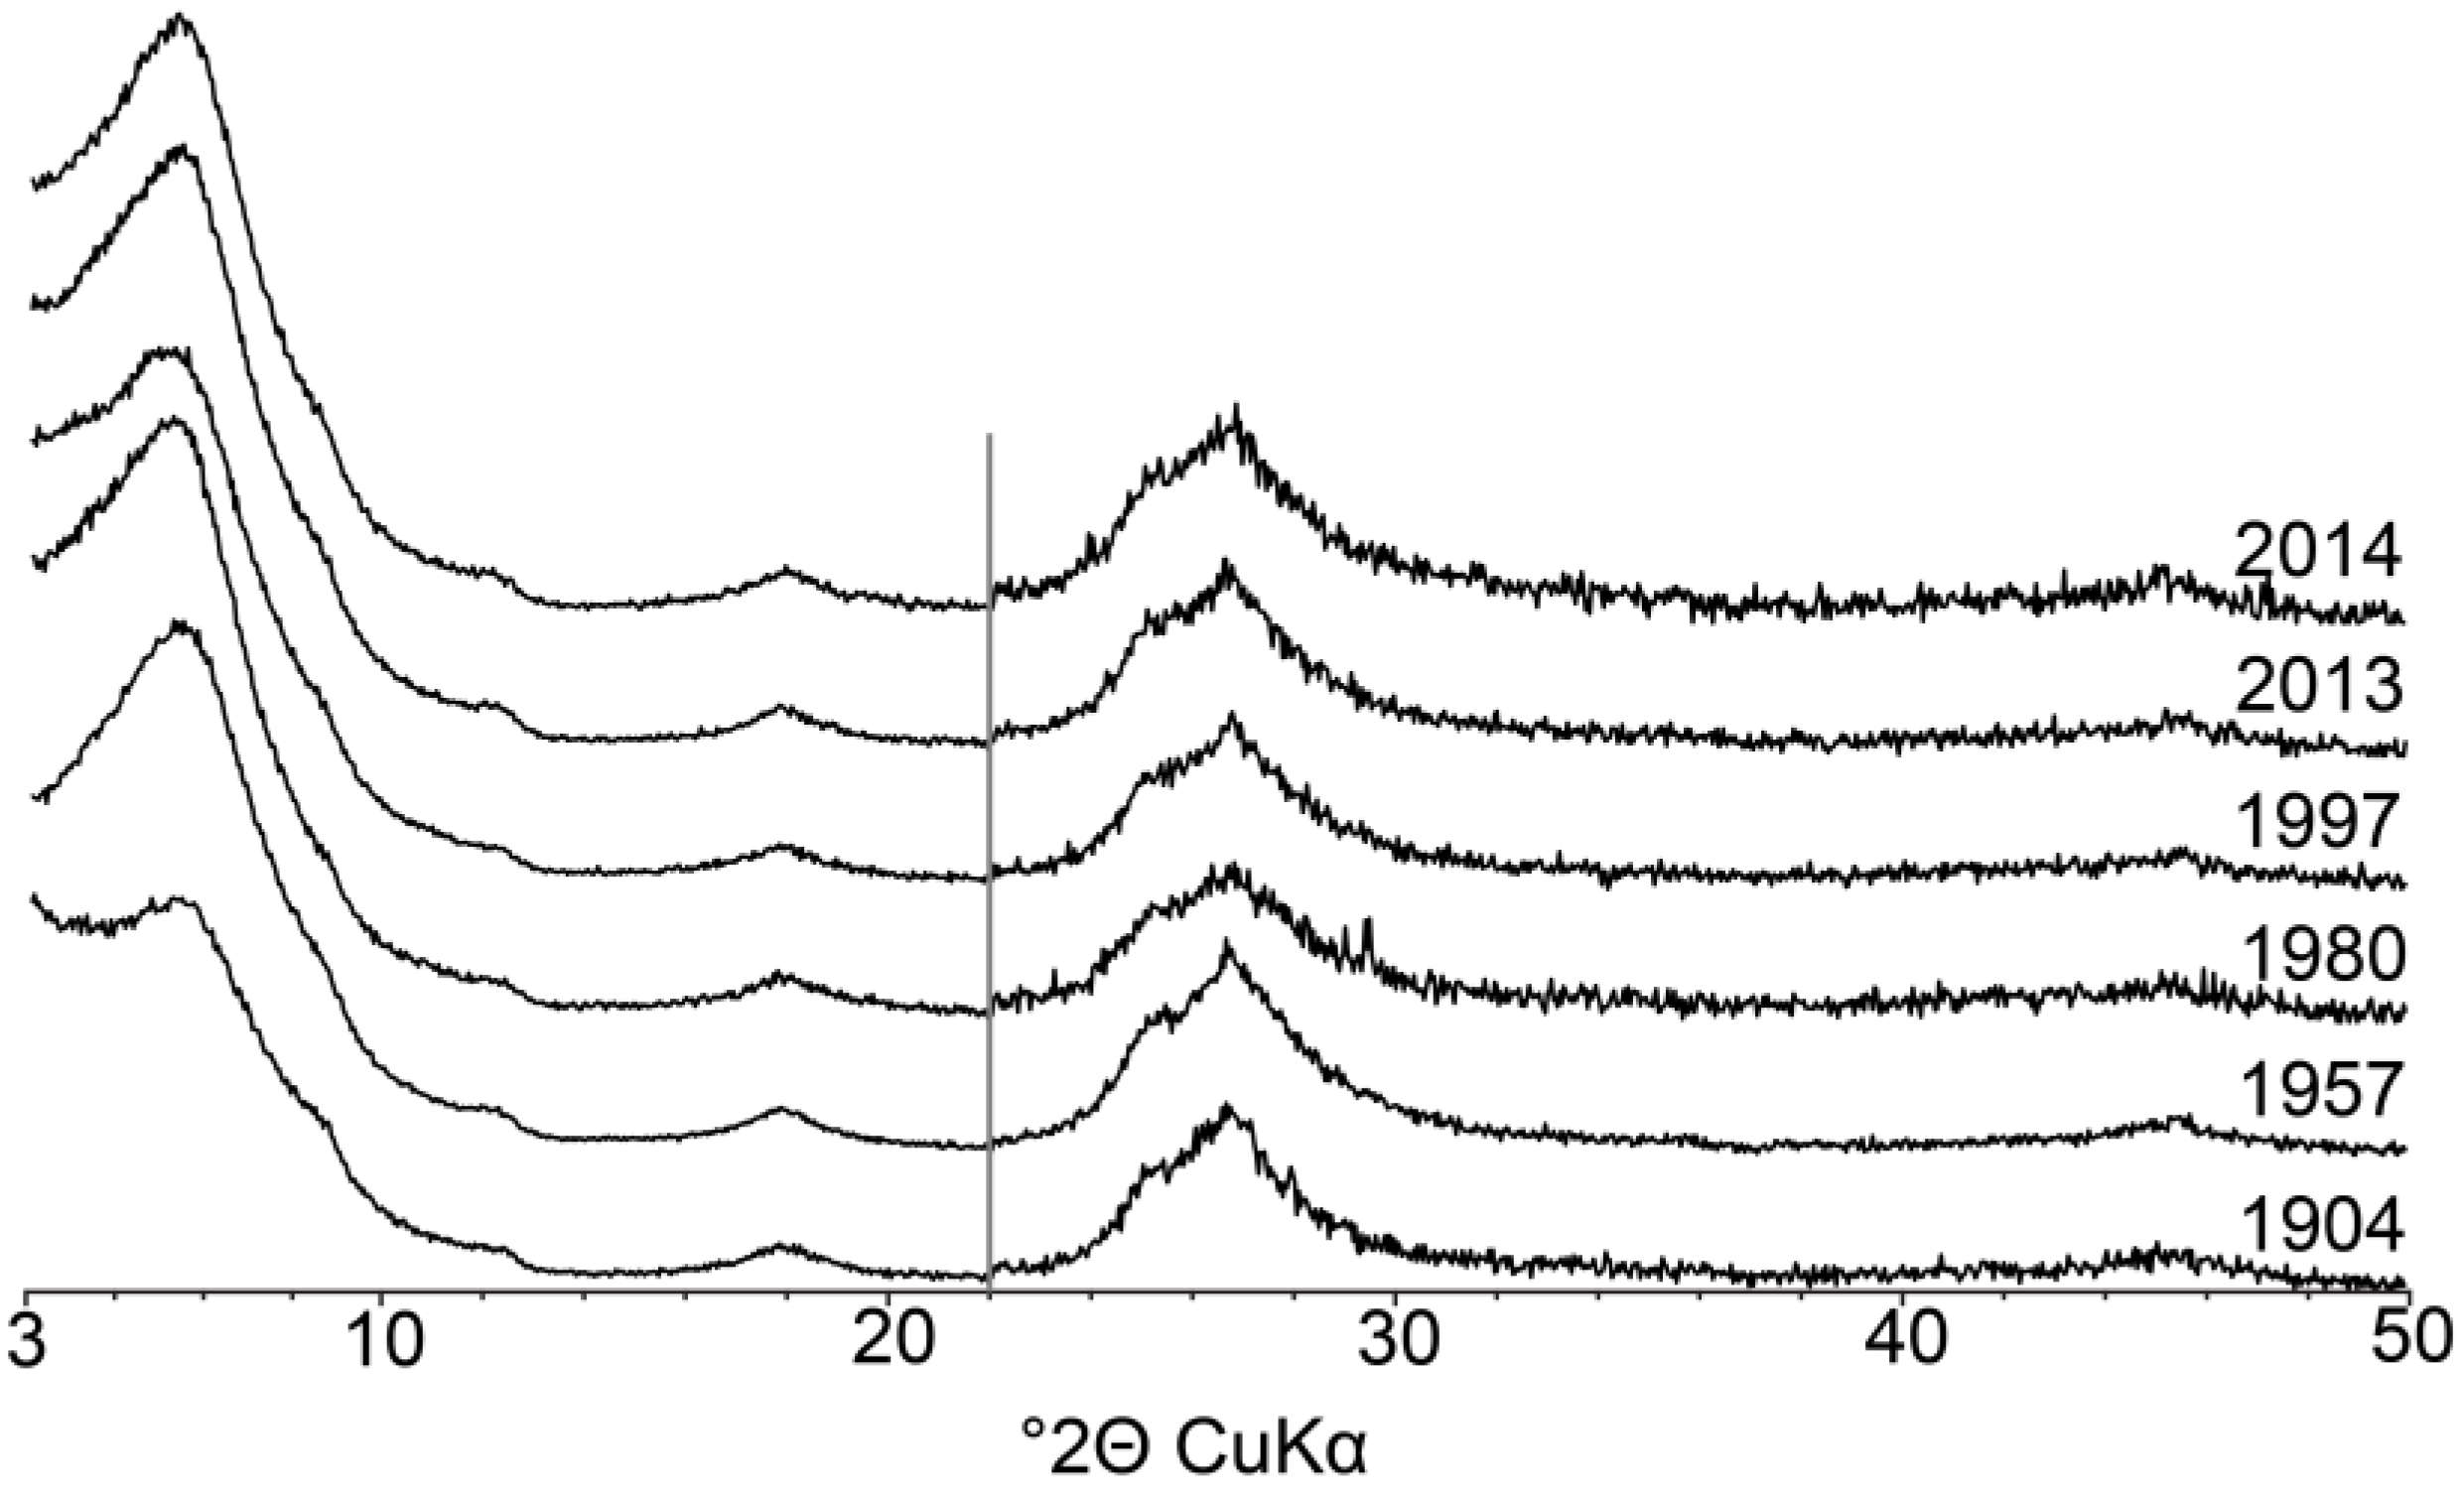
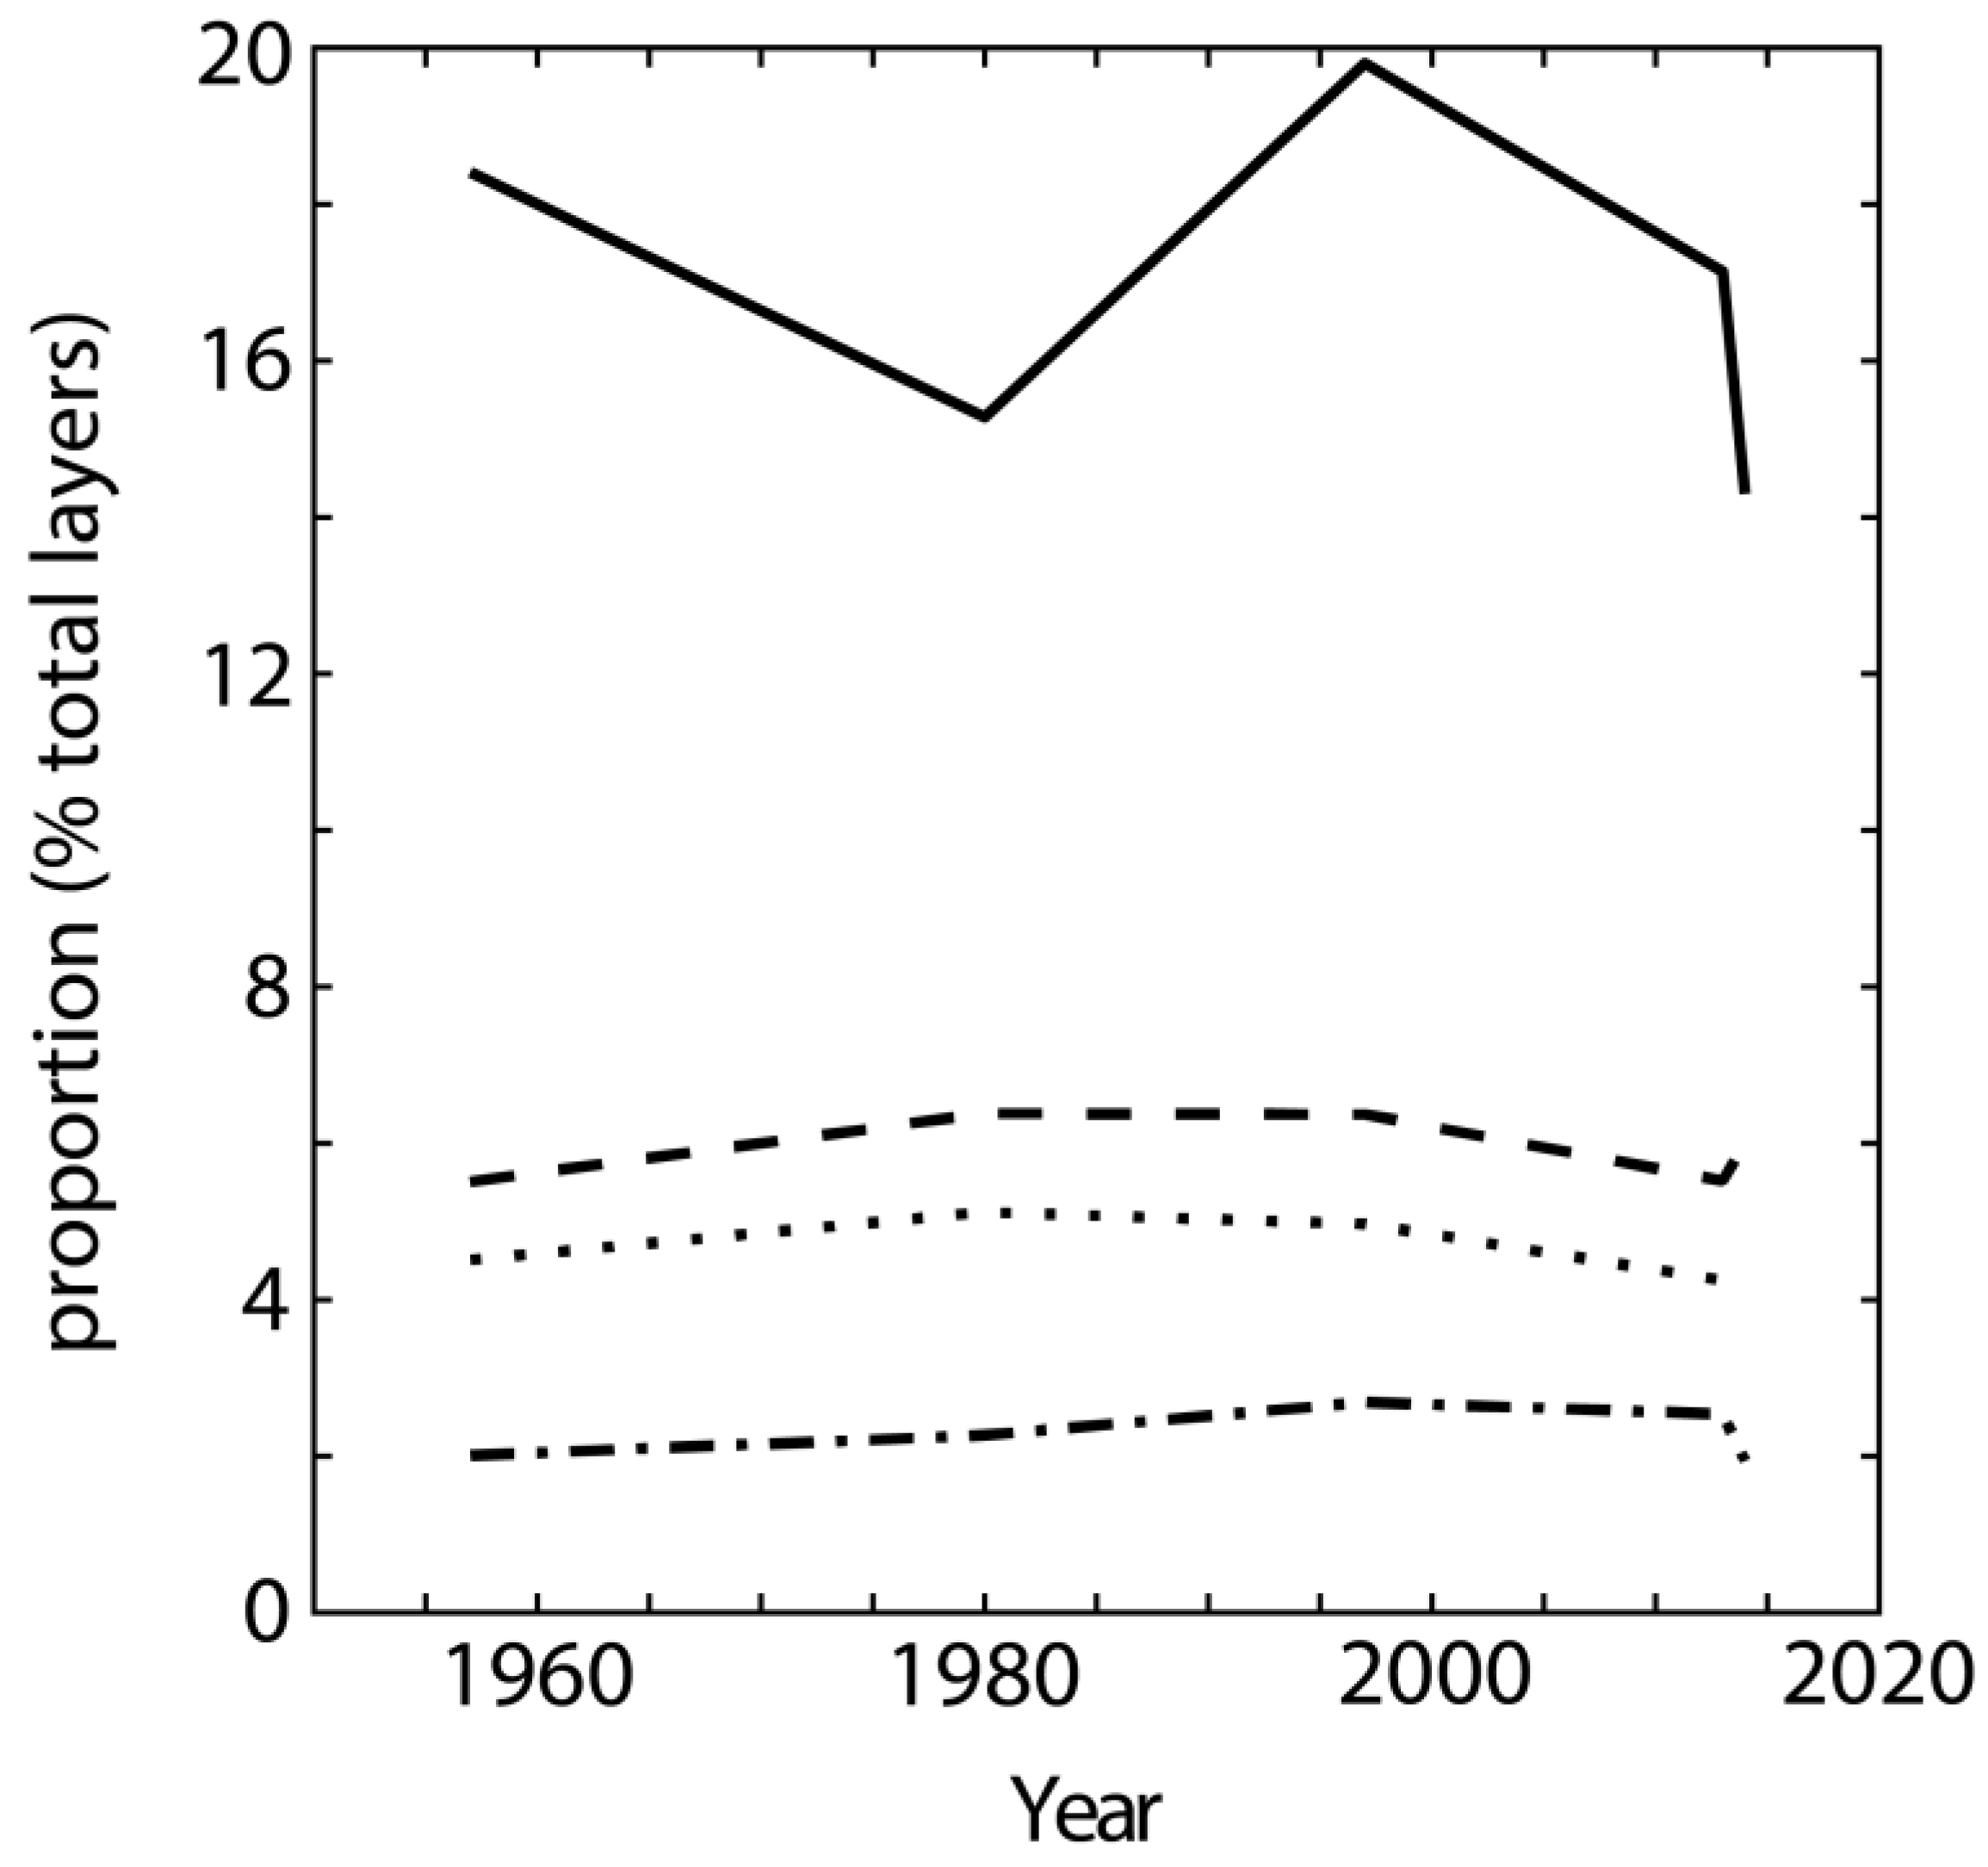
4.3. Evolution of Clay Mineralogy over Time

Despite the small size of subplots (~50 m2), there is considerable scatter in both the granulometry of samples and the proportions of the different mineral phases. Specifically, the granulometry of 1904 samples shows reduced proportions of 2 mm–50 μm fraction, compared to all other samples, in addition to increased proportions of <2 μm subfractions. This trend appears significant when results from all subplots, not solely those from RU samples (data not shown), are considered jointly. Consistent with its extremely fine-grained character, this indicates that 1904 sample was ground before being stored, consistent with the absence of soil aggregates in the sampled jar. Consequently, the following discussion concerns primarily 1957–2014 samples.
The overall proportion of the <2 µm fraction remains essentially stable over time, as levels are 31% in 1957 and 2013, with limited variations in other years (Figure 1a). These values are slightly higher than those reported previously [62], that ranged 24.5–26.5%. In the present study, experimental procedure was optimized to favor sample dispersion and extraction of the clay-size fraction, possibly accounting for the enhanced recovery. Stability with time suggests that export of clay particles has not occurred to a significant extent at the MP despite the presence of drainage tiles between plots.
The results of XRD profile modelling indicate a constant proportion of chloritic, or hydroxy-interlayered, layers over time (Figure 8), although acidification of the rhizosphere is known to induce the formation of such layers [63,64,65,66]. Reported pH values for surface soils in unfertilized subplots range from 5.0 to 5.5 [40,67], at the upper end of the 2–5 pH range frequently reported as typical for clay mineral aluminization [57,63,68,69]. Furthermore, despite 60 years of continuous cropping (1957–2014), XRD profile modelling shows no specific plant-related effects, such as the transformation of illite-like layers due to potassium uptake by plants [13,18,19,70,71], in the clay subfractions. While variations in peak position and profile in XRD data for the current study were observed, these variations did not translate quantitatively using the full-profile modelling method (Figure 8). This mineral stability is consistent with the conclusions of Velde and Peck for RU samples from the MP [15]. It is similar also to that reported from the qualitative analysis of XRD data for samples from the Rothamsted (UK) field experiment [11,16]. This suggests a minor influence of the corn-oats-hay crop rotation over the period considered.
Although no significant mineralogical evolution is observed in the clay fraction of the MP RU subplots, the CEC of the <2 µm fraction increases significantly from 47.9 to 55.2 cmolc kg−1 (Table 1—1957 to 2014, respectively). This change occurs in conjunction with a slight decrease in the C/N ratio (Table 1), that can only account for a limited part of the observed change in CEC. The increase in CEC should rather be related to the observed increase in the proportion of the finest (<0.05 µm) clay subfraction that accounts for 31% of the total <2 µm fraction in 1957 and ~42% in 2013–2014 (Figure 2a). The CEC measured for the bulk <2 µm fraction of sample 2014 (55.2 cmolc kg−1) is consistent indeed with that calculated as a weighted average of the different subfractions (57.8 cmolc kg−1Table 2), the finest subfraction having the highest smectite content and the highest CEC among clay-size subfractions. The contributions to all subfractions being essentially similar in composition, the observed evolution in grain size likely takes place through dissolution of the phases present in the coarser 2–0.2 and 0.2–0.05 µm subfractions rather than through their alteration or transformation. The breakdown of micro-aggregates initially present in these coarser subfractions could also account, at least partially, for the granulometric and CEC evolutions observed with time. Although the relative proportion of carbonates is minor and despite the slightly acidic soil pH, these minerals are present in all studied samples, however, including the most recent ones (Table S1), thus pleading for a minimal effect. Aggregate breakdown induced by organic removal also appears to play a minimal role in the observed evolutions. The steady decrease in C content from 1904–2014 is indeed essentially disconnected from the CEC increase, that occurs mainly from 1957–2014 (Table 1). The observed CEC increase is more likely induced by the increased nutrient demand related to the increased yields observed since the mid-1950s [40]. Given that the RU subplots receive no external fertilizer inputs, they are reliant on minerals to meet their nutritional needs. In this restricted context, dissolution may be favored not only by the uptake of potassium by crops, but also by that of silicon (Si) and other mineral nutrients (Fe, Mg, Mn) [6,72,73,74]. While not considered an essential nutrient for plants, improved bioavailability of Si has been linked to improved yields in some soils, and cereal crops can accumulate up to several percent of silicon in their tissues which may also favor dissolution [75,76,77,78].

5. Conclusions

The modelling approach used in the present study stands as the optimal, and likely the sole, method allowing a quantitative description of soil clay mineralogy. Furthermore, the analysis of fine clay subfractions (<0.2 µm or lower) provides key information and constraints for a complete and accurate description of the bulk clay-size fraction (<2 µm). Although the fine clay subfractions may represent a major fraction of the bulk clay fraction (0.2–0.05 and <0.05 µm subfractions represent 26 and 44% of the total <2 µm fraction, respectively, in the present soil samples) their contribution may easily be overlooked owing to their weak and poorly modulated diffraction signatures. Additional constraints derived from chemical treatments common in soil mineralogy (K-saturation, heating, etc.) are especially useful to assess the reliability of structure model obtained from XRD profile modelling on these fine clay subfractions. The quantitative mineralogical analysis performed on samples from the MP (RU subplot) indicates no significant variation of clay mineralogy over the studied period (1904–2014). The relative proportion of the different clay layer types (illite, smectite, kaolinite, chlorite) is about constant in the bulk <2 µm fraction, whereas the evolution observed in clay subfractions is essentially linked to the granulometric evolution. Whereas the relative proportion of the bulk <2 µm fraction is about constant over the studied period, thus indicating minimal, if any, export of clay phases, the relative proportion of the <0.05 µm subfraction increases, essentially at the expense of the 0.2–0.05 µm subfraction, indicative of clay mineral dissolution. This granulometric evolution accounts for the observed increase of CEC over time.

Supplementary Materials

The following are available online at https://www.mdpi.com/2571-8789/2/3/46/s1, Figure S1: Quantitative phase analysis of the 50–2 µm fraction for 1904–2014 samples, Figure S2: Elementary contributions to the intensity diffracted by the different clay subfractions of sample 2014, Figure S3: Relative proportions of the different contributions used to fit experimental XRD patterns of sample 2014, Table S1: Relative proportions of mineral contributions used to fit experimental XRD patterns of the 50–2 µm fraction for 1904–2014 samples, Table S2: Relative proportions of the different contributions used to fit experimental XRD patterns of <2 µm subfractions for 1904–2014 samples.

Author Contributions

B.L. and F.H. conceived and designed the study; E.B. performed all the modelling with the assistance of F.H.; M.M.W. provided access to the Morrow plots including the historical sample collection, and offered insightful information on the Plots; E.B., F.H. and B.L. interpreted the data; E.B. and B.L. wrote the article.

Acknowledgments

Financial support from INSU/EC2CO program to FH and BL is acknowledged (Project Claie, 2015–2016). ISTerre is part of Labex OSUG@2020 (ANR10 LABX56). Financial support from the French Clay Group and AIPEA to attend the MECC 2014 and the ICC 2017 conferences is gratefully acknowledged (EB). Chemical analyses of the mineral fractions and CHN analyses were performed at the Service d’Analyse des Roches et Minéraux (Nancy–France) and at the Institut de Chimie des Substances Naturelles (Gif s/Yvette–France), respectively.

Conflicts of Interest

The authors declare no conflict of interest. The founding sponsors had no role in the design of the study; in the collection, analyses, or interpretation of data; in the writing of the manuscript, and in the decision to publish the results.

References

  1. Meunier, A. Clays; Springer: Berlin/Heidelberg, Germany, 2005; p. 472. [Google Scholar]
  2. Velde, B.; Barré, P. Soils, Plants and Clay Minerals; Springer: Berlin/Heidelberg, Germany, 2009; p. 349. [Google Scholar]
  3. Velde, B.; Meunier, A. The Origin of Clay Minerals in Soils and Weathered Rocks; Springer: Berlin/Heidelberg, Germany, 2008; p. 406. [Google Scholar]
  4. Cornu, S.; Montagne, D.; Hubert, F.; Barré, P.; Caner, L. Evidence of short-term clay evolution in soils under human impact. CR Geosci. 2012, 344, 747–757. [Google Scholar] [CrossRef]
  5. Sparks, D.L. Potassium dynamics in soils. In Advances in Soil Science; Stewart, B.A., Ed.; Springer: New York, NY, USA, 1987; pp. 1–63. [Google Scholar]
  6. Marschner, H. Mineral Nutrition of Higher Plants, 2nd ed.; Academic Press: London, UK, 1995; p. 889. [Google Scholar]
  7. Mengel, K.; Kirkby, E.A.; Kosegarten, H.; Appel, T. Principles of Plant Nutrition; Springer: Dordrecht, The Netherlands, 2001; p. 849. [Google Scholar]
  8. Bortoluzzi, E.C.; Santos, D.R.D.; Kaminski, J.; Gatiboni, L.C.; Tessier, D. Alterações na mineralogia de um argissolo do Rio Grande do Sul submetido à fertilização potássica. Rev. Bras. Ciência Solo 2005, 29, 327–335. [Google Scholar] [CrossRef]
  9. Pernes-Debuyser, A.; Pernes, M.; Velde, B.; Tessier, D. Soil mineralogy evolution in the INRA 42 Plots experiment (Versailles, France). Clays Clay Miner. 2003, 51, 577–584. [Google Scholar] [CrossRef]
  10. Barre, P.; Montagnier, C.; Chenu, C.; Abbadie, L.; Velde, B. Clay minerals as a soil potassium reservoir: Observation and quantification through X-ray diffraction. Plant Soil 2008, 302, 213–220. [Google Scholar] [CrossRef]
  11. Tye, A.M.; Kemp, S.J.; Poulton, P.R. Responses of soil clay mineralogy in the Rothamsted Classical Experiments in relation to management practice and changing land use. Geoderma 2009, 153, 136–146. [Google Scholar] [CrossRef] [Green Version]
  12. Møberg, J.P.; Dissing Nielsen, J. Mineralogical changes in soils used for Potassium-depletion experiments for some years in pots and in the field. Acta Agric. Scand. 1983, 33, 21–27. [Google Scholar] [CrossRef]
  13. Tributh, H.; Boguslawski, E.V.; Lieres, A.V.; Steffens, D.; Mengel, K. Effect of Potassium removal by crops on transformation of illitic clay minerals. Soil Sci. 1987, 143, 404–409. [Google Scholar] [CrossRef]
  14. Bain, D.C.; Griffen, D.T. Possible effects of land use on the clay mineralogy of a brown forest soil. Clay Miner. 2002, 37, 663–670. [Google Scholar] [CrossRef]
  15. Velde, B.; Peck, T. Clay mineral changes in the Morrow experimental plots, University of Illinois. Clays Clay Miner. 2002, 50, 364–370. [Google Scholar] [CrossRef]
  16. Singh, B.; Goulding, K.W.T. Changes with time in the potassium content and phyllosilicates in the soil of the Broadbalk continuous wheat experiment at Rothamsted. Eur. J. Soil Sci. 1997, 48, 651–659. [Google Scholar] [CrossRef]
  17. Caner, L.; Joussein, E.; Salvador-Blanes, S.; Hubert, F.; Schlicht, J.F.; Duigou, N. Short-time clay-mineral evolution in a soil chronosequence in Oléron Island (France). J. Plant Nutr. Soil Sci. 2010, 173, 591–600. [Google Scholar] [CrossRef]
  18. Hinsinger, P.; Elsass, F.; Jaillard, B.; Robert, M. Root-induced irreversible transformation of a trioctahedral mica in the rhizosphere of rape. J. Soil Sci. 1993, 44, 535–545. [Google Scholar] [CrossRef]
  19. Hinsinger, P.; Jaillard, B. Root-induced release of interlayer potassium and vermiculitization of phlogopite as related to potassium-depletion in the rhizosphere of ryegrass. J. Soil Sci. 1993, 44, 525–534. [Google Scholar] [CrossRef]
  20. Norouzi, S.; Khademi, H. Ability of alfalfa (Medicago sativa L.) to take up potassium from different micaceous minerals and consequent vermiculitization. Plant Soil 2010, 328, 83–93. [Google Scholar] [CrossRef]
  21. Jackson, M.L.; Whittig, L.D.; Vanden Heuvel, R.C.; Kaufman, A.; Brown, B.E. Some analyses of soil lontmorillonite, vermiculite, mica, chlorite, and interstratified layer silicates. Clays Clay Miner. 1953, 2, 218–240. [Google Scholar] [CrossRef]
  22. Jackson, M.L. Interlayering of expansible layer silicates in soils by chemical weathering. Clays Clay Miner. 1962, 11, 29–46. [Google Scholar] [CrossRef]
  23. Hubert, F.; Caner, L.; Ferrage, E.; Meunier, A. Unraveling complex <2 µm clay mineralogy from soils using X-ray diffraction profile modeling on particle-size sub-fractions: Implications for soil pedogenesis and reactivity. Am. Mineral. 2012, 97, 384–398. [Google Scholar] [CrossRef]
  24. Dumon, M.; Tolossa, A.R.; Capon, B.; Detavernier, C.; Van Ranst, E. Quantitative clay mineralogy of a Vertic Planosol in southwestern Ethiopia: Impact on soil formation hypotheses. Geoderma 2014, 214, 184–196. [Google Scholar] [CrossRef]
  25. Viennet, J.-C.; Hubert, F.; Ferrage, E.; Tertre, E.; Legout, A.; Turpault, M.-P. Investigation of clay mineralogy in a temperate acidic soil of a forest using X-ray diffraction profile modeling: Beyond the HIS and HIV description. Geoderma 2015, 241, 75–86. [Google Scholar] [CrossRef]
  26. Jackson, M.L. Soil Chemical Analysis—Advanced Course; UW-Madison Libraries Parallel Press: Madison, WI, USA, 1956. [Google Scholar]
  27. Moore, D.M.; Reynolds, R.C. X-ray Diffraction and the Identification and Analysis of Clay Minerals; Oxford University Press: Oxford, UK, 1997; p. 378. [Google Scholar]
  28. Lanson, B. Modelling of X-ray diffraction profiles: Investigation of defective lamellar structure crystal chemistry. In Layered Mineral Structures and Their Application in Advanced Technologies; Brigatti, M.F., Mottana, A., Eds.; Mineralogical Society Great Britain & Ireland: London, UK, 2011; pp. 151–202. [Google Scholar]
  29. Reynolds, R.C. NEWMOD: A Computer Program for the Calculation of One-Dimensional Patterns of Mixed-Layered Clays, RC Reynolds, 8 Brook Road. Hanover NH 1985. Available online: https://newmod-for-clays.com/ (accessed on 31 July 2018).
  30. Lanson, B. Decomposition of experimental X-ray diffraction patterns (profile fitting): A convenient way to study clay minerals. Clays Clay Miner. 1997, 45, 132–146. [Google Scholar] [CrossRef]
  31. Barre, P.; Velde, B.; Abbadie, L. Dynamic role of “illite-like” clay minerals in temperate soils: Facts and hypotheses. Biogeochemistry 2007, 82, 77–88. [Google Scholar] [CrossRef]
  32. Li, D.-C.; Velde, B.; Li, F.-M.; Zhang, G.-L.; Zhao, M.-S.; Huang, L.-M. Impact of Long-Term Alfalfa Cropping on Soil Potassium Content and Clay Minerals in a Semi-Arid Loess Soil in China. Pedosphere 2011, 21, 522–531. [Google Scholar] [CrossRef]
  33. Mouas-Bourbia, S.; Barre, P.; Boudiaf-Nait Kaci, M.; Mouffok, M.; Rebbouh, M.; Kessouri, L.; Ouahab, H.; Derridj, A.; Velde, B. Influence of Olea europea L. and Ficus Carrica L. fine root activity on the K biodisponibility and clay mineralogy of the rhizosphere. Eur. J. Soil Sci. 2015, 4, 220–226. [Google Scholar] [CrossRef]
  34. Adamo, P.; Barré, P.; Cozzolino, V.; Di Meo, V.; Velde, B. Short term clay mineral release and re-capture of potassium in a Zea mays field experiment. Geoderma 2016, 264, 54–60. [Google Scholar]
  35. Hubert, F.; Caner, L.; Meunier, A.; Lanson, B. Advances in characterization of soil clay mineralogy using X-ray diffraction: From decomposition to profile fitting. Eur. J. Soil Sci. 2009, 60, 1093–1105. [Google Scholar] [CrossRef] [Green Version]
  36. Drits, V.A.; Sakharov, B.A.; Lindgreen, H.; Salyn, A. Sequential structure transformation of illite-smectite-vermiculite during diagenesis of Upper Jurassic shales from the North Sea and Denmark. Clay Miner. 1997, 32, 351–371. [Google Scholar] [CrossRef]
  37. Sakharov, B.A.; Lindgreen, H.; Salyn, A.; Drits, V.A. Determination of illite-smectite structures using multispecimen X-ray diffraction profile fitting. Clays Clay Miner. 1999, 47, 555–566. [Google Scholar] [CrossRef]
  38. Sakharov, B.A.; Lindgreen, H.; Salyn, A.L.; Drits, V.A. Mixed-layer kaolinite-illite-vermiculite in North Sea shales. Clay Miner. 1999, 34, 333–344. [Google Scholar] [CrossRef]
  39. MRCC. Cli-MATE: Midwestern Regional Climate Centre Application Tools Environment. Available online: http://mrcc.isws.illinois.edu/CLIMATE/ (accessed on 20 June 2018).
  40. Aref, S.; Wander, M.M. Long-term trends of corn yield and soil organic matter in different crop sequences and soil fertility treatments on the Morrow Plots. Adv. Agron. 1998, 62, 153–198. [Google Scholar]
  41. Mikutta, R.; Kleber, M.; Kaiser, K.; Jahn, R. Review: Organic matter removal from soils using hydrogen peroxide, sodium hypochlorite, and disodium peroxodisulfate. Soil Sci. Soc. Am. J. 2005, 69, 120–135. [Google Scholar] [CrossRef]
  42. Orsini, L.; Remy, J. Utilisation du chlorure de cobaltihexamine pour la détermination simultanée de la capacité d’échange et des bases échangeables des sols. Bull. AFES Sci. Sol. 1976, 4, 269–275. [Google Scholar]
  43. Dohrmann, R.; Kaufhold, S. Three new, quick CEC methods for determining the amounts of exchangeable Calcium cations in calcareous clays. Clays Clay Miner. 2009, 57, 338–352. [Google Scholar] [CrossRef]
  44. Doebelin, N.; Kleeberg, R. Profex: A graphical user interface for the Rietveld refinement program BGMN. J. Appl. Cryst. 2015, 48, 1573–1580. [Google Scholar] [CrossRef] [PubMed]
  45. Aplin, A.C.; Matenaar, I.F.; McCarty, D.K.; van Der Pluijm, B.A. Influence of mechanical compaction and clay mineral diagenesis on the microfabric and pore-scale properties of deep-water Gulf of Mexico Mudstones. Clays Clay Miner. 2006, 54, 500–514. [Google Scholar] [CrossRef]
  46. Drits, V.A.; Tchoubar, C. X-ray Diffraction by Disordered Lamellar Structures: Theory and Applications to Microdivided Silicates and Carbons; Springer: Berlin, Germany, 1990; p. 371. [Google Scholar]
  47. Ferrage, E.; Lanson, B.; Malikova, N.; Plancon, A.; Sakharov, B.A.; Drits, V.A. New insights on the distribution of interlayer water in bi-hydrated smectite from X-ray diffraction profile modeling of 00l reflections. Chem. Mater. 2005, 17, 3499–3512. [Google Scholar] [CrossRef] [Green Version]
  48. Ferrage, E.; Lanson, B.; Sakharov, B.A.; Drits, V.A. Investigation of smectite hydration properties by modeling experimental X-ray diffraction patterns: Part I. Montmorillonite hydration properties. Am. Mineral. 2005, 90, 1358–1374. [Google Scholar] [CrossRef] [Green Version]
  49. Reynolds, R.C. The Lorentz-polarization factor and preferred orientation in oriented clay aggregates. Clays Clay Miner. 1986, 34, 359–367. [Google Scholar] [CrossRef]
  50. Dohrmann, R.; Rüping, K.B.; Kleber, M.; Ufer, K.; Jahn, R. Variation of preferred orientation in oriented clay mounts as a result of sample preparation and composition. Clays Clay Miner. 2009, 57, 686–694. [Google Scholar] [CrossRef]
  51. Drits, V.A.; Srodon, J.; Eberl, D.D. XRD measurement of mean crystallite tickness of illite and illite/smectite: Reappraisal of the Kubler index and the Scherrer equation. Clays Clay Miner. 1997, 45, 461–475. [Google Scholar] [CrossRef]
  52. Rivard, C.; Lanson, B.; Cotte, M. Phosphorus speciation and micro-scale spatial distribution in North-American temperate agricultural soils from micro X-ray fluorescence and X-ray absorption near-edge spectroscopy. Plant Soil 2016, 401, 7–22. [Google Scholar] [CrossRef]
  53. Fehrenbacher, J.B.; Walker, G.O.; Wascher, H.L. Soils of Illinois. Bulletin 1967, 725, 47. [Google Scholar]
  54. Willman, H.B.; Glass, H.D.; Frye, J.C. Mineralogy of glacial tills and their weathering profiles in Illinois: Part I. Glacial tills. Illinois State Geol. Surv. Circ. 1963, 347, 1–55. [Google Scholar]
  55. Mount, H.R. Soil Survey of Champaign County, Illinois; USDA Soil Conservation Service: Urbana-Champaign, IL, USA, 1982; p. 178.
  56. Endres, T.J. Soil Survey of Champaign County, Illinois; USDA Natural Resources Conservation Service: Urbana-Champaign, IL, USA, 2002; p. 287.
  57. Barnhisel, R.I.; Bertsch, P.M. Chlorites and hydroxy-interlayered vermiculite and smectite. In Minerals in Soil Environments; Dixon, J.B., Weed, S.B., Eds.; Soil Science Society of America: Madison, WI, USA, 1989; pp. 729–788. [Google Scholar]
  58. Douglas, L.A. Vermiculites. In Minerals in Soil Environments; Dixon, J.B., Weed, S.B., Eds.; Soil Science Society of America: Madison, WI, USA, 1989; pp. 635–728. [Google Scholar]
  59. Lanson, B.; Ferrage, E.; Hubert, F.; Prêt, D.; Mareschal, L.; Turpault, M.-P.; Ranger, J. Experimental aluminization of vermiculite interlayers: An X-ray diffraction perspective on crystal chemistry and structural mechanisms. Geoderma 2015, 249, 28–39. [Google Scholar] [CrossRef]
  60. Khan, T.B.; Lanson, B.; Hubert, F.; Findling, N.; Rivard, C.; Wander, M.M. Influence of cropping practices on cly mineralogy: Insights from the Morrow plots experimental fields. In Proceedings of the Clay Minerals Society 50th Annual Meeting, Urbana-Champaign, IL, USA, 6–10 October 2013; p. 121. [Google Scholar]
  61. Méring, J. L’interférence des rayons-X dans les systèmes à stratification désordonnée. Acta Crystallogr. 1949, 2, 371–377. [Google Scholar] [CrossRef]
  62. Odell, R.T.; Melsted, S.W.; Walker, W.M. Changes in organic Carbon and Nitrogren of Morrow plots soils under different treatments, 1904–1973. Soil Sci. 1984, 137, 160–171. [Google Scholar] [CrossRef]
  63. Robert, M.; Razzaghe, M.; Ranger, J. Le rôle du facteur biologique dans la podzolisation. Etudes expérimentales sur les mécanismes géochimiques et les évolutions minéralogiques. In Podzols et Podzolisation; Righi, D., Chauvel, A., Eds.; AFES: Plaisir, France, 1987; pp. 207–223. [Google Scholar]
  64. Ranger, J.; Dambrine, E.; Robert, M.; Righi, D.; Felix, C. Study of current soil-forming processes using bags of vermiculite and resins placed within soil horizons. Geoderma 1991, 48, 335–350. [Google Scholar] [CrossRef]
  65. Righi, D. Characterization of hydroxy-interlayered vermiculite and illite/smectite interstratified minerals from the weathering of chlorite in a cryorthod. Clays Clay Miner. 1993, 41, 484–495. [Google Scholar] [CrossRef]
  66. Turpault, M.P.; Righi, D.; Uterano, C. Clay minerals: Precise markers of the spatial and temporal variability of the biogeochemical soil environment. Geoderma 2008, 147, 108–115. [Google Scholar] [CrossRef]
  67. DeTurk, E.E. Changes in the soil of the Morrow Plots which have accompanied long-continued cropping: An abstract. Soil Sci. Soc. Am. J. 1939, 3, 83–85. [Google Scholar] [CrossRef]
  68. Rich, C.I. Aluminium in interlayers of vermiculite. Soil Sci. Soc. Am. J. 1960, 24, 26–32. [Google Scholar] [CrossRef]
  69. Rich, C.I. Hydroxy interlayers in expansible layer silicates. Clays Clay Miner. 1968, 16, 15–30. [Google Scholar] [CrossRef]
  70. Dissing Nielsen, J.; Møberg, J.P. The influence of K-depletion on mineralogical changes in pedons from two field experiments and in soils from four pot experiments. Acta Agric. Scand. 1984, 34, 391–399. [Google Scholar] [CrossRef]
  71. Barre, P.; Velde, B.; Fontaine, C.; Catel, N.; Abbadie, L. Which 2:1 clay minerals are involved in the soil potassium reservoir? Insights from potassium addition or removal experiments on three temperate grassland soil clay assemblages. Geoderma 2008, 146, 216–223. [Google Scholar] [CrossRef]
  72. Boyle, J.R.; Voigt, G.K. Biological weathering of silicate minerals. Plant Soil 1973, 38, 191–201. [Google Scholar] [CrossRef]
  73. Hinsinger, P. How do plant roots acquire mineral nutrients? Chemical processes involved in the rhizosphere. Adv. Agron. 1998, 64, 225–265. [Google Scholar]
  74. Meunier, J.-D. Le rôle des plantes dans le transfert du silicium à la surface des continents. CR Geosci. 2003, 335, 1199–1206. [Google Scholar] [CrossRef]
  75. Lewin, J.; Reimann, B.E.F. Silicon and Plant Growth. Annu. Rev. Plant Physiol. 1969, 20, 289–304. [Google Scholar] [CrossRef]
  76. Lanning, F.C.; Hopkins, T.L.; Loera, J.C. Silica and ash content and depositional patterns in tissues of mature Zea mays L. plants. Ann. Bot. 1980, 45, 549–554. [Google Scholar] [CrossRef]
  77. Epstein, E. Silicon. Annual Review of Plant Physiology and Plant Molecular Biology. Soil Sci. 1999, 50, 641–664. [Google Scholar]
  78. Blecker, S.W.; McCulley, R.L.; Chadwick, O.A.; Kelly, E.F. Biologic cycling of silica across a grassland bioclimosequence. Glob. Biogeochem. Cycles 2006, 20. [Google Scholar] [CrossRef] [Green Version]
Figure 1. (a) Grain size distributions of the <2 mm fraction obtained for soil samples 1904–2014 from the sequential size-fractionation procedure described in the text. (b) Comparison of experimental XRD profiles for Ca-AD and EG treated <2 µm fractions of samples 1904 and 2014. Quartz and feldspar reflections are indicated by solid black and open triangles. Peak positions are given in Å, CEC values in cmolc kg−1.
Soilsystems 02 00046 g001
Figure 2. (a) Grain size distributions of the <2 µm fraction obtained for soil samples 1904–2014 from the sequential size-fractionation procedure described in the text. The dashed line highlights the apparent increase of the <0.05 µm subfraction. (b) Comparison of experimental XRD profiles for Ca-AD and EG treated subfractions of sample 2014. Symbols and notations as in Figure 1b. Solid grey triangles indicate hk bands of phyllosilicates. The vertical grey bar represents an increase in intensity of the high-angle region compared to the 2−22° 2θ angular range (×2 scale factor).
Soilsystems 02 00046 g002
Figure 3. Comparison of experimental XRD profiles collected for K-AD and K-150 and K-350 slides of the different subfractions of sample 2014. Symbols and notations as in Figure 1b and Figure 2b. The vertical grey bar represents an increase in intensity of the high-angle region compared to the 2−22° 2θ angular range (×2 scale factor).
Soilsystems 02 00046 g003
Figure 4. Comparison of experimental XRD patterns obtained on the <0.05 µm subfraction of soil samples 1904–2014 (Ca-AD). The vertical grey bar represents an increase in intensity of the high-angle region compared to the 2−22° 2θ angular range (×2 scale factor).
Soilsystems 02 00046 g004
Figure 5. Comparison of experimental and calculated XRD patterns for the 2–0.2, 0.2–0.05 and <0.05 µm subfractions of sample 2014. Experimental and calculated patterns are shown as black crosses and solid red lines, respectively. Difference plots are shown as solid grey lines at the bottom of the figure. Quartz and feldspar reflections are indicated by solid black and open triangles, respectively. Solid grey triangles indicate hk bands of phyllosilicates, which are not fitted. The vertical grey bar represents an increase in intensity of the high-angle region compared to the 2−22° 2θ angular range (×2 scale factor). The goodness of fit parameter Rp is indicated for each pattern.
Soilsystems 02 00046 g005
Figure 6. Sensitivity of calculated XRD patterns to the mineralogical composition. Experimental (sample 2014) and calculated XRD patterns are shown as black crosses and solid red lines, respectively. Optimal fits are shown in the right-hand-side column. Calculated patterns in the left-hand-side column illustrate (a) the effect of replacing the ISSCh 35 (composition: 40/34/26—CSD size: 4) and ISSCh 50 (composition: 60/18/22—CSD size: 8) contributions with a unique one of intermediate composition (composition: 50/26/24—CSD size: 6; <0.05 µm subfraction of sample 2014, Ca-AD); (b) the effect of replacing chloritic layers by smectite (S2) layers in the ISSCh 80 contribution (0.2–0.05 µm subfraction of sample 2014, Ca-AD); and (c) the effect of decreasing the occupancy of the interlayer brucite sheet in chloritic layers of ISSCh 50 from 5.4 to 4.9 per O20(OH)8 (<0.05 µm subfraction of sample 2014, Ca-AD). Zoomed regions highlight areas with significant misfit compared to the best fit.
Soilsystems 02 00046 g006
Figure 7. Comparison of the experimental XRD data obtained by (a) Velde and Peck [15] from <2 µm fractions; and (b) in the present study from 0.2–0.05 µm subfractions.
Soilsystems 02 00046 g007
Figure 8. Relative proportions of the different layer types in the <2 µm fraction as a function of time. Layer-type proportions are calculated as the weighted sum of a given layer abundance in the different mixed layers present in 2–0.2, 0.2–0.05 and <0.05 µm subfractions. Illite, smectite, chlorite and kaolinite layers are plotted as solid, dashed, dotted, and dotted-dashed lines, respectively. Note: the strong variation in illite layer content observed in 1980 and 2014 is due mainly to large variations in the relative abundance of the 2–0.2 µm subfraction.
Soilsystems 02 00046 g008
Table 1. Results of CEC and chemical analyses for Na-saturated <2 µm fractions from soil samples 1904, 1957 and 2014.
YearFractionCECCHNK2ONa2OMgOCaO 1TiO2Fe2O3MnOP2O5SiO2Al2O3LOI
cmolc kg−1%%%%%%%%%%%%%%
1904<2 µm45.56.471.560.582.150.251.780.080.798.560.070.2845.5717.2522.34
1957<2 µm47.96.181.490.572.180.221.780.070.828.330.080.2946.5617.3020.20
2014<2 µm55.25.791.590.601.830.151.91-0.658.850.060.3243.0918.1022.38
1 The low value reported for Ca is due to the Na-saturation of samples prior to the analysis.
Table 2. Measured and calculated CEC values for sample 2014 clay-size fractions and subfractions. The calculated CEC value for the bulk <2 µm fraction is a weighted average of the CEC values measured for the different subfractions.
SubfractionCEC (meas.) cmolc kg−1Rel. prop. (wt. %)CEC (calc.) cmolc kg−1
<2 µm55.2-57.8
2–0.2 µm22.130.7-
0.2–0.05 µm58.625.6-
<0.05 µm82.243.8-
Table 3. Main structural parameters of the different mineral phases used to fit experimental XRD patterns of sample 2014.
Mineral PhaseSubfraction2–0.2 µm0.2–0.05 µm<0.05 µm
TreatmentCa-ADCa-EGCa-ADCa-EGCa-ADCa-EG
IlliteCSD size 136----
ISSCh 90I/S/S/Ch 292/3/0/594/2/0/494/1/1/489/4/3/489/7/0/4
CSD size2712109
ISSCh 80I/S/S/Ch75/5/10/1080/4/2/1478/5/3/14--
CSD size2318--
ISSCh 50I/S/S/Ch50/20/5/2550/18/7/2556/8/11/2552/13/10/2560/6/12/2254/12/12/22
CSD size1997
ISSCh 35I/S/S/Ch35/36/9/2030/38/12/2030/35/15/2040/20/14/2630/38/6/26
CSD size1774
ISSCh 5I/S/S/Ch0/80/0/200/70/10/200/73/7/205/66/17/120/85/3/12
CSD size76543
KaoliniteCSD size4728--
KI R1K/I80/2080/2080/20
PII0.40.40.4
CSD size472819
ChloriteI/Ch1/993/97--
CSD size2713--
Smectite 2WCSD size----2
1 Average CSD size is given in layers per crystal. 2 Relative proportions of the different layer types interstratified. Note: All mixed layers are randomly interstratified (Reichweite = 0), except for KI R1, which exhibits a tendency to segregation (PII > WI, with WI and PII being the relative proportion of illite layers in the mixed layer and the probability for an illite layer to follow another illite layer, respectively).
Table 4. Relative proportions of the different contributions used to fit experimental XRD patterns of sample 2014 clay subfractions.
ContributionSubfraction2–0.2 µm0.2–0.05 µm<0.05 µm
TreatmentCa-ADCa-EGCa-ADCa-EGCa-ADCa-EG
Illite4440----
ISSCh 90161417151310
ISSCh 80972218--
ISSCh 50142040423940
ISSCh 35479133839
ISSCh 5000135
Kaolinite7788--
KI (R1)334355
Chlorite/ICh3311--
Smectite----22

