Abstract
Phosphorus (P) is an essential nutrient for sustaining life and agricultural production. Transformation of readily available P into forms that are unavailable to plants adds costs to P replenishment, which eventually translates into lower agronomic benefits and potential loss of soil P into runoff may degrade water quality. Therefore, understanding the sources and pathways of the formation of residual P pools in soils is useful information needed for the development of any technological or management efforts to minimize or inhibit the formation of such P pool and thus maximize availability to plants. In this research, we paired phosphate oxygen isotope ratios (δ18OP) with solid-state 31P NMR and quantitative XRD techniques along with general soil chemistry methods to identify the precipitation pathways of acid-extracted inorganic P (Pi) pools in an agricultural soil. Based on the comparison of isotope values of 0.5 mol L−1 NaOH-Pi, 1 mol L−1 HCl-Pi, and 10 mol L−1 HNO3-Pi pools and correlations of associated elements (Ca, Fe, and Al) in these pools, the HNO3-Pi pool appears most likely to be transformed from the NaOH-Pi pool. A narrow range of isotope values of acid-Pi pools in shallow (tilling depth) and below (where physical mixing is absent) is intriguing but likely suggests leaching of particle-bound P in deeper soils. Overall, these findings provide an improved understanding of the sources, transport, and transformation of acid-Pi pools in agricultural soils and further insights into the buildup of legacy P in soils.
1. Introduction
Phosphorus (P) is a limited (~0.09 wt. % of Earth’s crust) non-renewable resource and an essential component of fertilizer for food production. Multiple studies have raised concern over the sustainable use of P because the increased exploitation of P, after the Green Revolution, has reduced its reserves on Earth and the unidirectional transport—from mines to fertilizers for crop production and then to foods and fodders [1]—has caused a series of unintended environmental problems [2]. As a result, the pressure to economize P usage by minimizing P fertilizer application, more efficient usage of available P (such as 4R-right source, right rate, right time and right place) or recycling P from a variety of waste sources has increased [3]. Consequently, a series of research efforts and technological developments are being undertaken towards recycling P from human waste and sewage sludge in wastewater treatment plants, incentivizing recycled P products, rationing P application in agricultural soils based on soil P concentration, reducing leaching and runoff. Similarly, various methods to enhance P uptake from soils including manipulation of symbiotic fungi and microorganisms on plant roots and genetic modification on plants are being investigated [4,5]. All these efforts are directed towards recovering the lost P in the environment or remobilize the already unavailable P forms in soils. The opposite of this—that is how does the readily bioavailable P pools transform into less (or un-) bioavailable P—has not gotten sufficient scientific attention. One of the major reasons for this drawback is the lack of appropriate research techniques to study P transformation in soils and other environmental matrices.
Advances in the understanding of soil P dynamics, particularly the transfer and transformation of P pools and biogeochemical processes that facilitate or restrict these interactions, is limited largely due to lack of appropriate analytical methods of investigation [6]. While a series of innovative research tools have been used to understand P dynamics [7], most of these methods are either in the early stage of development or have limited applications. Sequential extraction methods are widely used in past several decades to differentiate operationally discrete bioavailable and recalcitrant P pools in soils [8,9,10]. Because of the operationally defined nature, sequential extraction method cannot be reliably used to provide direct information on the structure and chemical forms of the various P pools. Thus, as expected, P speciation and biogeochemical interpretations derived from sequential extraction results are often questioned (e.g., [11]). While the scientific community is well aware of this limitation, the lack of appropriate research techniques either to prove the extraction method or complement the results has remained a major challenge. Often a combination of this technique with other complementary research methods have been used to identify P speciation and develop a relationship of pool and speciation [12,13,14]. Among them, a combination of sequential extraction with stable isotopes [15,16,17,18,19,20] has shown encouraging results because sequentially extracted P pools are in the order relative of the recalcitrance to microbial accessibility and thus may imprint specific isotope composition. It means if the original isotope composition is different and if the imprinted signature is preserved, the combination of sequential extraction with isotope methods provides reliable information to study biological cycling and reactivity of each P pool. This will allow assessing biologically inert P pools and identifying mechanisms and pathways of P transfer and transformation. Furthermore, it will provide an avenue to address questions on P paradox—declining P reserves and lost P from agricultural activities causing environmental problems.
Oxygen isotopic compositions of phosphate (δ18OP) have been used as a tracer to disentangle specific biogeochemical reactions and interactions among different P forms and phases and input/output budgets [18,19,21,22,23,24,25]. Fundamentally distinct properties of oxygen isotope ratios in abiotic and biotic reactions make this tool a more reliable tracer of P to study the physicochemical and biological pathways of P cycling to better understand the fate of P in agricultural and non-agricultural soils [18,19,21,22]. For example, the oxygen isotopic composition of phosphate remains almost unchanged during sorption, desorption, transport, and mineral transformation, except for short-term kinetic fractionation among P pools, at low temperature (<70 °C) and circumneutral pH [26,27,28]. However, during biological processes, rapid O-isotope exchange between inorganic P (Pi) and ambient H2O often results in complete isotope exchange and produces temperature-dependent equilibrium O-isotope fractionation [29,30,31]. These specific properties of δ18OP in abiotic and biotic reactions provide the potential means to apply this tool as a geochemical indicator to develop the mechanistic understanding of the formation of recalcitrant P pools and interplay of biotic and abiotic reactions involved in soil P cycling.
In this research, we combined stable isotope method with sequential extraction method along with solid-state NMR and quantitative XRD techniques with an aim to develop a mechanistic understanding of the sources and pathways that form residual and recalcitrant P pools. In this communication, we have mostly used generic terms like 0.5 mol L−1 NaOH-Pi, 1 mol L−1 HCl-Pi and 10 mol L−1 HNO3-Pi instead of the terms recalcitrant and residual P pools to be explicit with the operationally defined terminologies. Please note 10 mol L−1 HNO3-P is only a fraction of residual P because the soil still contains additional P in the soil after this extraction. We analyzed soils from the surface to below agronomically relevant depth in a long-term agronomy research field in a Mid-Atlantic sandy soil at the agricultural experiment station in Newark, Delaware, USA. Based on results obtained, we discuss potential pathways of phase transformations among P pools and ultimate formation of these pools in an agricultural soil.
2. Materials and Methods
2.1. Site Description and Soil Sampling
A site classically used for corn and soybean fertility research at the Agricultural Experiment Station at the University of Delaware was used for this research. The details about the study site and agronomic practices are described before [19]. In brief, the water table is about 0.5 m or more below the surface and therefore the major part of biologically and agronomically active soil is unsaturated. Every year the soil is chisel-plowed (~30 cm) and fertilized using commercial fertilizers before cropping. This farm is drip irrigated as needed during crop growing seasons.
To quantify Pi pools and their isotopic compositions, soil cores were retrieved from the experimental site using a Hoffer soil sampler (2.54 cm id) at intervals of 2.0 cm up to a total depth of 105 cm. We collected three to four soil cores from different parts of the farm and sectioned into 2 or 5 cm depth intervals. All core slices from the same depth interval were combined into one and homogenized before processing and analysis. To collect the equilibrated and average soil water for the measurement of oxygen isotopes (δ18OW), suction lysimeters were inserted into the soil at selected depths for a period of month and waters collected in the porous cups of the lysimeter were retrieved at the end of the month. Soil temperature at different soil depths was measured by inserting a 3 mm-diameter stem thermometer at targeted depths. The soil cores were freeze-dried and then ground thoroughly and size separated (<200 µm). All analyses including sequential extraction were done in <200 µm size fraction. Please note that the nominal aggregate size (2 mm) chosen for general soil property has been found to generate erroneous results in sediment [32] and agricultural soils [19]. Therefore, soil aggregates were grounded using mortar and pestle and screened to <200 µm size. The soil pH and organic matter content were measured in as received soil to be realistic about the field conditions. The size-separated soils were analyzed for other physical and chemical properties and for isotope measurements.
2.2. Soil Characterization
The physical and chemical properties of the soil samples were measured to differentiate the most biologically and agronomically in active topsoil (0–20 cm), intermediate-depth soil (20–40 cm) and deep soil (>40 cm, largely beyond the active biological and agronomical activities). The soil pH was measured by mixing 10 g of soil with 10 mL of de-ionized (DI) water and gently shaken in a reciprocator shaker for 10 min before measuring pH using Orion® glass electrodes. The soil samples before the start of extraction, after each P pool, and residual soils after the extraction were dissolved using the microwave digestion method. Concentrations of P and other elements that are relevant to P speciation (Fe, Al, and Ca) were measured by using inductively coupled plasma optical emission spectrometer (ICP-OES).
Variations in soil mineralogical composition across the soil depth were analyzed by using X-ray diffraction (XRD) (Rigaku Miniflex 600, with CuKα radiation λ = 1.5418 Å). Five soil depths (0–2, 8–10, 20–22, 50–52, 82.5–90, and 97.5–105 cm) were chosen for XRD analyses based on the trends of P, Fe, Al, and Ca and pH. To understand the selective removal of minerals and changes in the concentration of amorphous minerals during sequential extraction, three separate XRD analyses were performed on soil residues (i) after 0.5 mol L−1 NaOH extraction but before HCl extraction, (ii) after HCl extraction, and (iii) after HNO3 extraction (see Section 2.4 for extraction methods). Minerals were identified and quantified by full-pattern (Rietveld) refinement [33] using the program TOPAS (v5, Bruker AXS) and crystal structures from the inorganic crystal structure database (ICSD). An internal standard, weighed and mixed homogeneously into the soil samples, was used to quantify minerals on an absolute basis and therefore determine the amorphous content by the difference. We used ZnO, a National Institute of Science and Technology (NIST) certified standard, as the internal standard for this purpose because ZnO peaks did not overlap with the minerals. However, to our surprise, ZnO appeared to react with residual nitrate (from the reagent HNO3) in the solid-phase and generated new peaks in the soil residue after HNO3 treatment. To circumvent this problem, we repeated XRD data collection using Al2O3 as a new internal standard and performed the quantitative analyses of crystalline and amorphous minerals.
2.3. 31P Solid-State NMR Spectroscopy
Solid-state NMR was employed to directly determine the P speciation of soil samples. Solid-state 31P single pulse (SP) magic-angle-spinning (MAS) NMR spectra for several soil samples were collected on a 500 MHz Bruker AVIII solid-state spectrometer (11.7 T) at an operating frequency of 202.5 MHz for 31P and 500.1 MHz for 1H. A Bruker 4.0 mm HX double resonance probe was used for all solid-state NMR measurements. All powder samples were packed into the rotor and spun at the MAS frequency of 10 kHz. The other parameters for 31P analyses were 30° with a pulse length of 0.8 μs, and the relaxation delay of 30 s. To achieve a reasonable signal, the scanning was performed up to 48 h.
2.4. Extraction of Soil Phosphorus Pools
Soil P pools were extracted using a commonly used operationally defined sequential extraction technique originally developed by Hedley et al. [9] and revised by Tiessen et al. [10] with slight modifications [19]. In brief, 5–10 g of soil (based on the size of each P pool) samples were directly extracted with different regents at 1:100 soil to solution ratio. The first extraction included DI water for 4 h twice, which was followed by 0.5 mol L−1 NaHCO3 for 16 h. To avoid carryover of the remaining P extracted by NaHCO3 but not removed from soil suspension, the soil was further rinsed with H2O (e.g., [32]). Then, the soil was extracted with 0.5 mol L−1 NaOH for 16 h followed by washing by 0.5 mol L−1 NaHCO3 and H2O each. The soil after NaOH extraction was further treated with 1.0 mol L−1 HCl for 16 h followed by separate 0.5 mol L−1 NaHCO3 and H2O washes, as before. Finally, the soil residue after HCl extraction was treated with 10.0 mol L−1 HNO3. To ensure that Pi from any particular pool was not carried over to subsequent pools, supernatant from the extraction and each rinsing step in a particular P pool was collected separately and quantified individually before combining for further processing. Concentrations of Pi and total P (TP) in each extract were measured by using the phosphomolybdate blue method [34] and after persulfate digestion [35] respectively. Organic P (Po) concentration was calculated as the difference between TP and Pi. In addition, the concentrations of Fe, Al, and Ca in HCl and HNO3 extracts were measured by using ICP-OES. Extracted supernatants for each P pool were combined and stored at 4 °C before processing and purification for isotope analysis.
2.5. Purification of Extracted Solution for Isotope Analyses
The extracted Pi pools (NaHCO3-Pi, NaOH-Pi, HCl-Pi, and HNO3-Pi) were processed to remove residual reagents and cations, anions, and other compounds in extracted solutions and to concentrate Pi before it was ultimately converted to silver phosphate. A step by step process of the purification and precipitation methods is schematically shown in Figure 1 and explained below in detail. Different P pools contain variable amounts of Po. Among them, NaHCO3-P and NaOH-P pools, in particular, had a higher range of Po content (7–32% of total P) than other P pools.
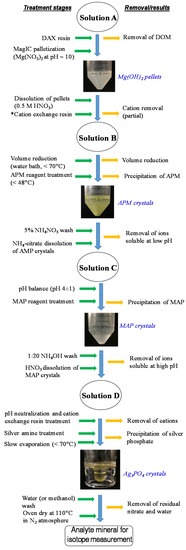
Figure 1.
Flow diagram for the purification of P pools (NaHCO3-Pi, NaOH-Pi, HCl-Pi, and HNO3-Pi) sequentially extracted from soils and precipitation of silver phosphate, the ultimate analyte for isotope measurement.
The Po compounds have to be removed before isotope analyses because their hydrolysis incorporates dominantly the light water O isotope [36] in the released Pi and thus compromises the true Pi O-isotope signature. Here we used non-functionalized macro porous SuperliteTM DAX-8 resin (40–60 mesh, Sigma Aldrich, Burlington, MA, USA) to remove the bulk of dissolved Po and other organic matter in the extracted solutions. The DAX is an adsorbent resin with moderate polarity and thus can be used for the separation and removal of surfactants, fulvic and humic acids, and other hydrophobic organic compounds (with molecular weight up to 150 KDa). Soil extracts from shallow depths required two DAX resin treatments. In selected samples, we measured TP and Pi before and after treatment to compare the efficiency of the DAX resin to trap organic matter as well as to identify any Pi loss. The generally clear solution thus generated after DAX treatment was further processed to reduce its volume and to concentrate the Pi by the Mg-induced co-precipitation (MagIC) method [37]. The amount of MagIC needed to scavenge Pi in the solution varied with the concentration Pi and other competing anions. It is, however, important to generate finely dispersed Mg(OH)2 colloids to maximize the trapping Pi in MagIC and gentle shaking to maintain a homogeneous dispersion of colloids. For the large volume of extracted solution (a few liters) and especially for low Pi soils and environmental waters, it is prudent to prepare a concentrated MagIC colloidal solution in a small volume (200–300 mL) in a split of the same solution and vigorously shaken to generate finely dispersed MagIC colloids and then add to the remaining solution. A pH adjustment before adding the MagIC seed is helpful to ensure the stability of the colloids. The entire volume was gently shaken for before separating the MagIC suspension by centrifugation. Nominally, the centrifuge parameters are set to pelletize >50 nm MagIC particles. The pelleted MagIC was then separated from the supernatant by decanting or siphoning. The cohesive nature of MagIC pellets allows easy separation. The concentration of residual Pi in the supernatant was measured after decreasing the volume (by 1.0 to 1.5 order of magnitude through rotary evaporation) so that colorimetric quantitation becomes reliable. In the case that the Pi was not fully removed by MagIC, repeated MagIC treatment was done. Please note that the presence of HCO3− in the solution inhibits the efficiency of MagIC to sorb Pi, therefore HCO3− was removed by acid treatment (forming CO2) before MagIC treatment. The MagIC pellets were dissolved in 0.5 mol L−1 HNO3 by vortexing the mixture before and immediately after the addition of the acid to maximize the dissolution and to minimize the time action of the acid. In selected samples, 18O-enriched water was spiked into the acid to test residual Po hydrolysis during MagIC pellet dissolution. The Pi concentrations after the DAX-8 and MagIC treatments each were individually measured to ensure that Pi loss was at least (<5%) during these treatments.
Following preliminary volume reduction and partial impurity removal by DAX-8 and MagIC treatments, extracted solution from each P pool was processed further to purify Pi as follows. Precipitation of ammonium phosphomolybdate (APM) and subsequent steps followed the methods described in Jaisi and Blake [6,15] as explained in Figure 1. For this step, MagIC-dissolved Pi was evaporated (at 60–70 °C) to attain a final concentration of ~500 to 1000 μmol Pi. The APM precipitation occurs at low pH and thus allows the separation and removal of ions and contaminants that are soluble at low pH. Polysulfone filters (0.1 µm, Pall Scientific, San Diego, CA, USA) were used to separate APM precipitates and rinsed off the contaminants using 5% NH4NO3 solution twice. The separated APM precipitates were dissolved in an ammonium citrate solution. Magnesium ammonium phosphate (MAP) precipitation was the second step which occurs at high pH, thus removes ions and contaminants that are soluble at high pH. The MAP precipitates, once formed, were separated by filtration (as above) and then rinsed with dilute (5%) NH4OH. The MAP dissolved solution, after pH adjustment to neutral (7.0 ± 1.0), was passed through a vertical fixed-bed column packed with freshly conditioned cation-exchange resin (AG 50W-X8) to remove cations (primarily Mg2+ and NH4+) and achieve Pi in protonated forms (HPO42− and H2PO4−). The resin bed thickness was determined based on meq/L capacity of resin and the amount of cations to be removed. The eluted solution from the cation resin column was further evaporated down to ~1–3 mL in a customized beaker to increase Pi concentration. Finally, Ag3PO4 was precipitated by using a silver amine reagent. A separate phosphate standard and replicate soil extracted Pi (NaHCO3-Pi pools), in which 18O-labeled water (with final δ18OP values = 47.21‰) was spiked in all reagents, were processed in parallel with soil extracts to validate the sample processing protocol as well as to confirm the reliability of isotope values.
2.6. Measurement of Phosphate Oxygen Isotope Ratios
A Thermo-Chemolysis Elemental Analyzer (TC/EA) coupled to a Delta V continuous flow isotope ratio monitoring mass spectrometer (IRMS, Thermo-Finnigan, Germany; the precision of 0.3‰) was used to measure δ18OP values of precipitated Ag3PO4. Each run sequence included an internal phosphate standard, benzoic acid, and two isotope standards (YR1a and YR3-2 with δ18OP values of −5.49 and +33.63‰, respectively) at the beginning and two isotope standards at the middle and the end. Each standard and sample was run at least in triplicate. The yield of oxygen in Ag3PO4 was calculated based on theoretical O in the silver phosphate (15.4%). The data with acceptable yield (>90%) were only used for analyses and included in the results and discussion.
Because the biological reactions imprint equilibrium isotope composition, knowledge of equilibrium isotope values in the field condition is required. For this, δ18OW values of soil porewater, collected for a month using porous pot lysimeters at selected depths, were measured using a FinniganTM GasBench II coupled with IRMS using CO2 equilibration method (with a typical precision of <0.06‰). The δ18OW values were calibrated against two USGS standards W67400 and W32615 with their isotope values of −1.97‰ and −9.25‰, respectively. The δ18Ow and δ18OP values are reported following standard delta (δ) notation relative to Vienna Standard Mean Ocean Water (VSMOW).
The theoretical isotopic equilibrium values were determined using a newly determined equation [38], which is more relevant to Ag3PO4 as the analyte mineral and measurement done online in TC/EA:
where T indicates the soil temperature in the degree Kelvin (K), δ18OP and δ18OW represent the oxygen isotope values of phosphate and water, respectively. To account for the variability of these parameters in the soil, the range of equilibrium was calculated based on the minimum and maximum temperature for the month of soil sampling and the porewater collected in the lysimeter cup. Further average minimum and maximum monthly temperatures for a calendar year for the soil at 5 cm depth was also used to compare the expected annual change in equilibrium zone.
3. Results
3.1. Mineralogical Composition of Soils
Quantitative analyses of mineralogical composition using XRD in untreated soils, soil residues after NaOH extraction but before HCl extraction, and after HCl and HNO3 extraction (each from 0−2, 8−10, 20−22, 50−52, 82.5−90, and 97.5−105 cm depths) included minerals predominantly of quartz, feldspar, mica, kaolinite, and amorphous minerals (Table 1). A small amount of smectite was detected in most samples; however, the quantitation of this mineral was not considered to be reliable because the actual crystal structure is likely to be significantly different and disordered compared to the idealized structure database available. The quantity of smectite is, therefore, a component of the ‘amorphous’ material shown in Table 1. There was a slight variation in the relative content of these minerals with soil depth. Comparative analyses of different extraction steps allowed us to identify selective removal of minerals as well as changes in the concentration of amorphous minerals during sequential extractions. For example, comparison of minerals in soil residues before and after HCl extraction and after HNO3 extraction shows the removal of mica and kaolinite by 1 to 3, and 2 to 5%, respectively. On the other hand, amorphous minerals in soil residues increased by more than 20% after HNO3 extraction. The increase in amorphous mineral content after harsher reagent treatment is likely a sample-processing artifact, due to the precipitation of ions extracted by reagents. However, the difference in the content of amorphous minerals at different depths could partly be inherent to the soil composition. The potential impact of P pool quantitation, as well as fate of externally applied P in the presence of amorphous minerals, are included in the discussion.

Table 1.
Mineralogical compositions of soil residues (i) after NaOH extraction, (ii) after HCl extraction, and (iii) after HNO3 extraction at six different depth intervals.
3.2. 31P NMR Results on the Composition of Phosphorus Minerals
Solid-state 31P NMR provided a direct characterization of the P speciation in soils (Figure 2). The NMR spectra were able to be retrieved to soil depths up to 15 cm but not below because of lower P content and poor spectral resolution, which are major factors limiting the application of solid-state NMR in soil P studies. The NMR spectrum of shallow soil (0−7.5 cm) yielded a well-resolved major peak at 2.6 ppm, indicative of apatite mineral. A minor and broad peak at –5 ppm could be ascribed to Pi sorbed to mineral surfaces. The soil collected at 7.5−15 cm depth, however, showed a much broader feature, which limited the reliable identification of P form/mineral.
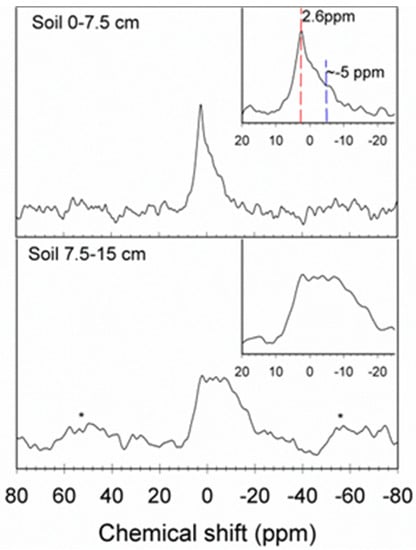
Figure 2.
31P solid-state NMR spectra of bulk soils (from 0−7.5 and 7.5−15 cm depths). Spectra were acquired at the single-pulse magic angle spinning (MAS) condition at a spinning rate of 10 kHz, with a π/6 pulse and a pulse delay of 30 s. Approximately 3000−14,000 scans were accumulated for each sample.
3.3. Concentrations and Isotopic Compositions of Phosphorus Pools
Concentrations of different Pi pools at different depths are shown in Figure 3 and Figure 4. Overall, the general trend of Pi concentration in all P pools was similar (i.e., high at the shallow soil depth (0−20 cm), decreased sharply at intermediate depths (20−40 cm) and then slightly increased with increasing depth. However, relative concentrations among Pi pools were different. For example, at the shallow depth, HCl-Pi was ~60% higher compared to the HNO3-Pi pool. However, the concentrations of both acid-Pi pools were similar in the deeper soils. Among all P pools, NaOH-Pi was the predominant pool in all depths. Interestingly, the remaining P in soil (i.e., after 4 steps of Hedley extraction plus HNO3 extraction) was still a significant fraction and was 2–3 times higher than the acid Pi pools combined.
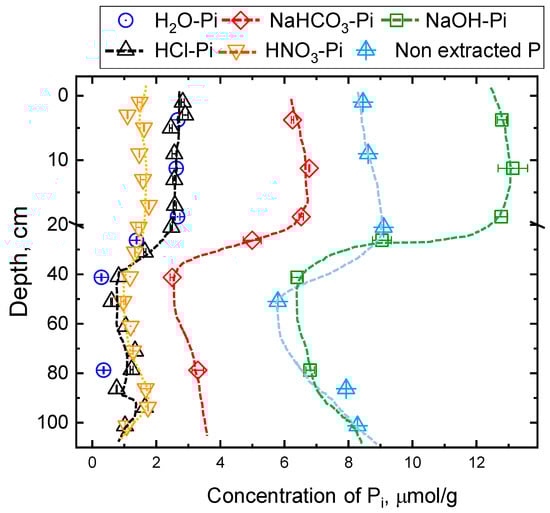
Figure 3.
Concentrations of different soil Pi pools as a function of depth. Please note the ‘non-extracted P’ refers to P remaining in the residual soil after Hedley and 10 mol L−1 HNO3 extraction.
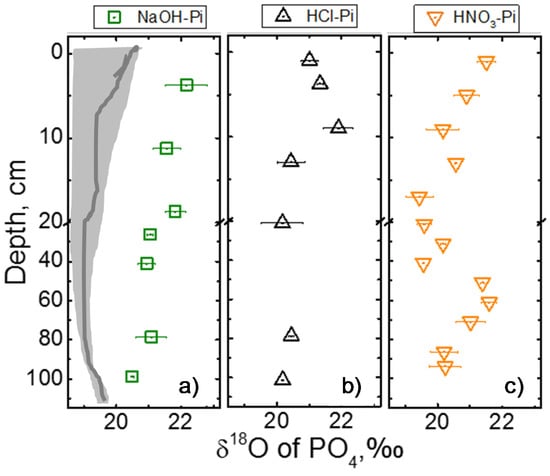
Figure 4.
Isotope values of three major Pi pools: (a) NaOH-Pi, (b) HCl-Pi, and (c) HNO3-Pi. The dark grey zone in (a) indicates equilibrium isotope composition (which is the same for all three P pools) calculated from measured water δ18Ow values (–4.9 to –6.2‰) and temperature (8.5 to 12.0 °C) in the month of sampling and solid grey line on the day of soil sampling. If the monthly average temperature of a year were to be used (which is available for 0–5 cm depth), the equilibrium isotope zone becomes heavier by about 0.85‰.
The isotopic compositions of NaOH-Pi, HCl-Pi, and HNO3-Pi pools varied from 19.3 to 22.3‰ for the ranges of depth (0−105 cm) studied (Figure 4a–c). The ranges of δ18OP values NaHCO3-Pi were well within the equilibrium range (18.5−19.9‰, not shown). The heavier range of isotopic values is close to that of external P fertilizer (22.0−23.5‰) applied at the study site over the past several years. Interestingly, general trends of δ18OP values of a particular Pi pool as a function of depth were unique, and all values are heavier (~0.5−3.9‰) than the equilibrium isotopic composition. Please note that equilibrium isotope values were calculated from the equation 1 using the measured water isotope values and temperature. Given these measurements were performed from cumulative water collected over a month and temperature measured every other day, the calculated equilibrium isotope values should be more reliable. Please note if the monthly average variation of temperate (for 5 cm soil depth) for a year is included, the zone of equilibration only expands by +0.85‰. So monthly high/low temperature and isotope values in late spring-summer months, when external P is applied followed by active uptake by crop plants, is considered reasonable to calculate equilibrium values and compare isotope compositions.
Based on the particular differences in the trend of isotope values as well as the concentrations of P, Fe, Al and Ca, soils in this study site could be categorized into three different depths, i.e., shallow (<20 cm), intermediate (20−40 cm) and deep (>40 cm) soils. For example, at shallow depth, δ18OP values of NaOH-Pi were ~22‰ which gradually depleted with depths to become ~21‰. On the other hand, δ18OP values of HCl-Pi became steadily heavier from the surface to ~10 cm (~22‰), and then became lighter and remained close to equilibrium (~20.0‰) at all depths below it. Interestingly, the trend of the isotopic composition of HNO3-Pi pool was opposite to that of HCl-Pi, albeit with a wider range (between 19.5 to 21.9‰) with heavier isotopic compositions near the surface. The δ18OP values of HNO3-Pi steadily depleted with depth until about 40 cm and enriched again to near-surface isotope values at 50−60 cm depth. This pool was within the equilibrium isotopic composition at intermediate depths.
3.4. Concentrations of P, Fe, Al, and Ca in Acid Extracts
Concentration profiles of total P, Fe, Al, and Ca in 1 mol L−1 HCl and 10 mol L−1 HNO3 extracts along with soil pH are shown in Figure 5. At the shallow depth, overall concentration profiles of P, Fe, Al, and Ca were similar in both HCl and HNO3 extracts but their trends were markedly different in deep soil. For example, the concentration of HCl-Pi was higher (by about 60%) than that of HNO3-Pi at shallow depths (0−20 cm) whereas the concentrations of both pools were similar in the deeper soil. As soil acidity increased below 20 cm, concentrations of Fe and Al increased but P decreased. The impact of pH change on the size of P pool was higher in the HCl-Pi than that in the HNO3-Pi pool. Similarly, the role of pH on Fe and Al concentrations was clearly evident in HCl extraction over HNO3. Conversely, small changes in soil acidity with depth had a negligible effect on Ca concentration, until the pH decreased to 5.3, which is rather uncommon. The depth-averaged concentration of Ca in HCl extract was 15.2 (±2.6) µmol g−1 which is about a log order higher than that in the HNO3 extract (i.e., 2.1 (±0.3) µmol g−1).
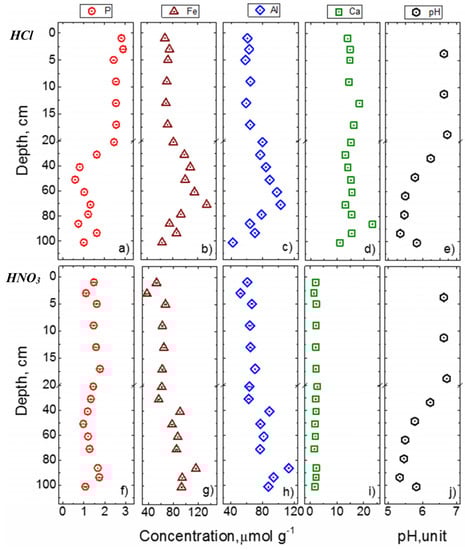
Figure 5.
Concentrations of total P, Fe, Al, and Ca in 1.0 mol L−1 HCl (a–d) and 10.0 mol L−1 HNO3 (f–i) soil extracts. The soil pH is shown in (e) and (f) panels to allow visual comparison with the profiles of other elements.
The relationship of P with other elements (Fe, Al, and Ca) in HNO3 extracts from the shallow (0−20 cm) and deeper (>40 cm) soils is shown in Figure 6. As the intermediate depth lies in the pH transitional zone where pH gradually decreases by ~1.5 units over the depth of about 20 cm, correlation analysis was quite variable, as expected, and thus is not included. In HCl extracts, there was not any statistically significant correlation between P and other elements (Fe, Al and Ca) in either shallow or deep soils. However, in the HNO3 extract, there was a statistically significant correlation between P and Fe in both shallow and deeper soils with the difference at the significance levels of 0.05 and 0.1, respectively. Similarly, the correlation between P and Al was significant at 0.01 and 0.05 for shallow and deeper soils, respectively. The relationship of P with Fe and Al in HNO3 extract was similar to that of NaOH extract.
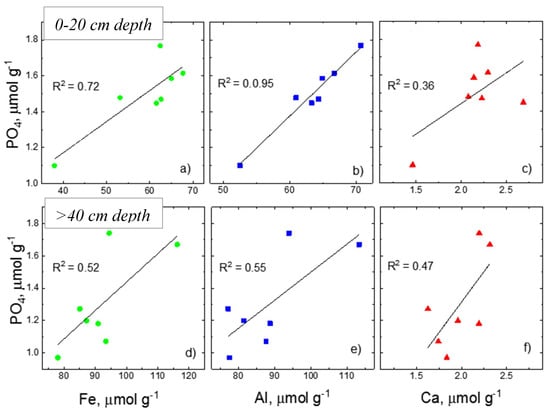
Figure 6.
Scatter plots showing the correlation of P with other elements [Fe (a,d), Al (b,e), and Ca (c,f)] in 10 mol L−1 HNO3 soil extract. The top panel is for shallow soil (0–20 cm) and bottom panel for deeper soil column (>40 cm).
4. Discussion
Formation of acid-P pools at the expense of other P pools has been speculated or interpreted from changes in the concentration of P pools both in space and time [39,40,41]. However, these changes are empirically defined because of the inability of concentration-based methods to identify the source or the mechanism of transformation. Recently, active P transformation of readily available P (H2O-Pi and NaHCO3-Pi) into moderately available (NaOH-Pi) and finally into HCl-Pi in an agricultural soil was identified through the application of 18O-labeled phosphate [19] and precipitation of HCl-P [23,24] using natural abundance isotope studies. Given that there are several potential P sources within the soil that may contribute to the formation of HCl-P and HNO3-P pools, and complex interactions among biotic and abiotic processes including dissolution and release of P from these soil P pools, identification of P sources and processes becomes complicated. In the discussion below, we disregard the reverse pathway that forms available P pools from acid-P pools. This is because the forward reaction forming these P pools should be dominant in agricultural soils where excess P is applied beyond agronomic needs. Furthermore, various mechanisms by which plant roots and soil organisms remove P from acid-P pools (e.g., [4,42]) are ignored. Based on the data generated in this research, we discuss potential sources and pathways that form acid-P at the surface and deeper soil horizons.
4.1. Potential Sources and Pathways Forming Acid-P Pools: Insights from Associated Elements
Evaluation of the relationship of P with Fe, Al, and Ca in HCl and HNO3 extracts provides insights into potential sources and modes of transformation of soil P pools. The high concentration of Ca in HCl extracted solutions over the entire soil depth (Figure 5) indirectly supports the notion that HCl dissolves primarily crystalline Ca-P minerals such as apatite and Ca-associated P [43,44]. Furthermore, solid-state 31P NMR for the first time confirmed the presence of apatite minerals in surface soils (Figure 2). Although HCl dissolves primarily Ca-P minerals, a high concentration of Fe and Al in HCl extracts (Figure 5b–d) suggests dissolution of additional soil minerals (primarily not associated with Ca) by HCl. Similar results have been reported in the literature (e.g., [45]) and hints towards the dissolution of clay minerals (consistent with the XRD results in Table 1). It is also likely that the remaining oxides after NaOH treatment could have dissolved under HCl.
The HNO3 extract contained a high amount of Fe and Al and a negligible amount of Ca (Figure 5g–i). The overall strong positive correlation of Fe, Al, and Ca with P (Figure 6) suggests the potential dissolution of secondary clay minerals and Fe and Al minerals during this extraction. More importantly, the trends of Fe, Al, and Ca with P in NaOH and HNO3 extracts were similar. Dissolution of clay minerals such as mica and kaolinite was also supported by quantitative XRD results that showed a consistent decrease in HNO3 extraction (Table 1). Furthermore, the amount of amorphous mineral content increased in the residual minerals after NaOH to HCl and to HNO3 extractions. This could likely result from the supersaturation of ions and corresponding precipitation of the extracted solution during freeze-drying before XRD measurement. Given that the fate of P in soils is controlled by amorphous minerals and those with highly reactive surface area, absence of an appropriate method to quantify amorphous minerals limits quantitative understanding of the composition of these minerals that are not extracted by 0.5 mol L−1 NaOH but dissolve in 1 mol L−1 HCl, and the residual minerals that dissolve in 10 mol L−1 HNO3 and their roles on the fate of P in agricultural soils.
4.2. Potential Sources and Pathways Forming Acid-P Pools: Insights from Isotope Results
Given that NaOH-Pi, HNO3-Pi, and HCl-Pi pools are generally recalcitrant for microbial cycling, their isotopic compositions could largely be preserved pending mixing with new generations of P pools [19]. The NaOH-P (i.e., P tightly bound to Fe and Al minerals) is considered to be moderately bioavailable or unavailable depending upon soil P content and plant efficiency of P uptake [42,44,46]. In terms of bioavailability, NaOH-P pool is presumed to act as an intermediate form between dissolved or loosely sorbed (H2O-P and NaHCO3-P) and acid-P (HCl-P and HNO3-P) pools. Preservation of source signature allows potential identification of precursor P sources that may precipitate or transform into new (acid-P) pools and thus provides information on potential sources and insights into the fate of applied P in soils.
HCl-Pi pool: The isotopic compositions of HCl-Pi in non-agricultural and agricultural soils measured so far have been found to include a wider range (between 5.6−21.3‰) depending upon P sources and the action of biogeochemical processes on the formation of these P pools [16,17,18,19,23,24,47]. The δ18OP values of HCl-Pi from geological sources should be much lighter [15,18,47,48]. As expected, the δ18OP values of HCl-Pi from non-agricultural soils (natural woodland) next to the agricultural soil site in this study was 11.03−16.22‰. The isotopic composition of HCl-Pi pool at shallow depth in the agricultural soil is ~2‰ lighter than that of P fertilizer (22–23.5‰) applied in the field. The isotope values become heavier during weathering and dissolution of primary apatite and formation of seconday apatite [49]. However, biological cycling also changes the P pool composition (most likely to NaHCO3-Pi or NaOH-Pi) besides the isotope composition of these pools [19]. These lines of evidence suggest that the HCl-Pi pool extracted from the study site even at greater depths (105 cm) is not derived from geogenic origin but rather was precipitated from anthropogenic P sources (i.e., P fertilizer applied for crops).
Comparison of isotope values of HCl-Pi with NaOH-Pi provides further insights into potential sources of P forming this pool. For the purpose of comparison, we consider the difference in the isotopic values of 1‰, ~7 times the analytical error of IRMS (0.3‰) and ~3 times the reproducibility range, as a significant value. The δ18OP values of HCl-Pi in the soil are lighter than that of NaOH-Pi and still mostly heavier than the calculated depth-equilibrium trend (Figure 4a) with an exception of two data at intermediate depths (12−14 and 20−22 cm) where it reached near the equilibrium zone. The near-equilibrium isotope values HCl-Pi in those two depths suggest that a certain fraction of microbially cycled P might be precipitated as HCl-Pi, which is consistent with our recent study [19] in which 18O labeling of P allowed identification of HCl-Pi precipitated partly from bioavailable P pools. A lighter isotope values of HCl-Pi than the fertilizer P as well as NaOH-Pi, is not expected if both derived from fertilizer P. However, it is possible that generations of new HCl-P formed with or without different isotope values and mixed with the bulk of HCl-P pool, which could not be resolved from the methods used in this study. It is noteworthy to mention that HCl-Pi includes amorphous or crystalline Ca-P minerals and NaOH-Pi includes P strongly sorbed, occluded, and precipitated with Fe and Al oxides, thus the elements associated in these P pools are different. If NaOH-Pi is a precursor phase for HCl-Pi, a strong correlation of elements on these two extracts is expected—which was not supported by the data. Thus, in summary, both isotope and concentration data preclude one P pool forming at the expense of the other pool.
HNO3-Pi pool: The δ18OP values of HNO3-Pi in the soil varied between 19.5 to 21.9‰ over the soil depth (0−105 cm) studied. Its trend along the entire depth was similar to that of NaOH-Pi pool (Figure 4a,c) and the difference between these two P pools was low. As mentioned above, isotope values of both acid P pools at the intermediate depth are close to the calculated equilibrium isotopic compositions. The reason for this trend at a depth where the groundwater table fluctuates is unknown and requires further investigation. Based on similar δ18OP values and trend of HNO3-Pi and NaOH-Pi pools with depth, the NaOH-Pi pool is a potential precursor for the HNO3-Pi pool. Additional evidence for this similar relationship lies in the correlation of Fe and Al content in both pools (similarities by 67–89%). The near absence of Ca and lack of statistical correlation with Pi in HNO3-Pi but higher concentrations of Al and Fe that are significantly correlated with P (Figure 6) is consistent with the interpretation that NaOH-Pi, but not HCl-Pi, transforms into HNO3-Pi.
Based on the above discussion, it is intuitive to discuss the origin of acid-P pools and the potential mode of transformation of P pools in soils. Exchange of P from one pool to another is described most often as a result of a change in the state of chemical equilibrium such as slow desorption which causes, for example, P release from the NaOH-Pi pool [9,42,50]. However, the solid-state equilibrium is different from classical equilibrium defined in aqueous geochemistry. While the actual mechanism could be different, for example, the formation of inner-sphere complexation from dissolved P or surface-catalyzed precipitation of Ca-P minerals, the end product of these chemical reactions is the formation of new species that are extracted by specific reagents in the sequential extraction methods. This process may be analogous to solid-state diffusion models used to describe slow P adsorption in soils [51]. Over time NaOH-Pi, P tightly bound to Fe and Al oxides and clay minerals, slowly diffuse into the minerals and transform or precipitate as acid-P pools. Furthermore, continuous loading of P fertilizer and thus increase in P adsorption onto these minerals over time might have redistributed adsorbed P into the minerals by solid-state diffusion [52]. Diffusion of adsorbed P on to Fe and Al oxides and clay minerals is controlled primarily by surface charge, crystallinity, and particle morphology [51,53]. It is, however, noteworthy to mention that neither the slow transformation of the NaOH-Pi pool nor surface precipitation alters its original isotopic composition, except minor kinetic fractionation [28], which is expected to be insignificant in soil environments. Furthermore, any unused fertilizer left in the field from previous growing seasons could also contribute to the acid-P pool if the residual P pool mixed with a new generation of acid-P with light isotopes (δ18OP values NaHCO3-Pi were well within the equilibrium range). However, since δ18OP values of NaOH-Pi are heavier than those of the acid-P pool, it is more likely that they formed from transfer or transformation of NaOH-Pi and potentially other bioavailable P pools. The fact that the NaOH-Pi pool is largely non-bioavailable, transforming it into an even more recalcitrant P pool should lock in its isotopic signatures (e.g., [15,20]). A suite of physicochemical processes in soils might have promoted physical entrapment or occlusion of NaOH-Pi or precipitation of amorphous Fe and Al-P minerals, preserving the isotopic compositions of NaOH-Pi. In summary, based on trends of isotope and elemental compositions, it is likely that NaOH-Pi is a potential precursor pool that transformed primarily into HNO3-Pi.
4.3. Vertical Movement of Phosphorus in Soil
The isotopic compositions of acid-Pi pools varied within a narrow range in the range of soil depth studied but still were heavier (by ~0.5−3.9‰) than the equilibrium isotopic composition (Figure 4a). As discussed above, HCl-Pi are not expected to be biologically cycled in agricultural soils where other readily available P pools are often in excess of biological demand [6,20] but could be precipitated from several sources. However, any reaction that removes P from HCl-Pi pool will build into other readily bioavailable forms [19]. The similar isotopic compositions of acid-Pi over depth suggest the physical movement of particle-bound P from surface soil into deeper soil. Few studies have reported that the significant amount of P may be transported into deeper soil horizons both as dissolved and particulate forms [54,55,56]. The extent of vertical transport is largely controlled by soil type and structure, physical disturbance of surface soil (e.g., tilling), sorption and desorption processes, and water transport mechanisms [56,57]. Although the leaching of P from surface soil into the deeper soil is known from multiple field and laboratory column studies, mechanistic understanding of particular P pools and P forms (particulate, colloidal, and dissolved) and biogeochemical processes such as uptake and recycling during vertical transport of P is still unclear. Vertical profiles of δ18OP values of the acid-Pi pools at shallow depth are impacted by physical mixing because the soil is chisel-plowed (~30 cm) every year. The flat landscape of the study site, however, limits the possibility of allochthonous sources of P imported in the study area.
Based on the data generated in this study, there are three possible scenarios for P leaching: (i) HCl-Pi and HNO3-Pi are formed in shallow soil and later migrate to deeper soil, (ii) transformation of NaOH-Pi occurred at different depths during/after its migration, or (iii) downward movement of dissolved P underwent a series of transformations to form acid-P pools. Sequential extraction includes both leached P and in situ P for a particular pool, which means the elemental and isotope compositions are composite. Given that Ca-P minerals are not often in the nano- to colloidal-size range, the possibility of precipitated Ca-P minerals migrating downward in the soil column is low and is expected to be physically limited. However, Fe and Al oxides are most commonly present in nano- to colloidal-size range, thus NaOH-Pi and HNO3-Pi pools could migrate as intact minerals or NaOH-Pi transformed into HNO3-Pi at a certain depth. Given that the δ18OP values of HCl-Pi at 150 cm depth in the woodland next to the agricultural soil site were 11.03−16.22‰ and under the assumption that the native P in the study site at similar depths should have same isotope signature, the shallow surface-derived source of acid-P should be the dominant source to be migrated at depths. For this to happen, the bulk of Pi pools should be in fine particles —which is rather less realistic or there exists other yet unclear mechanisms of vertical transport. Nonetheless, the possibilities discussed here are consistent with the implications made in several other controlled and field studies on vertical transport (e.g., [56,58]). Further research on the modes and mechanisms of vertical transport of soil P pools is required.
5. Implications
Acid-extractable Pi pools (i.e., HCl-Pi and HNO3-Pi) constitute a significant proportion of total P, generally >30% in moderately weathered soils, but could be >80% in soils that are strongly weathered soils [59] and lies in between in agricultural soils. While fixed P in the soil can transfer into available forms [50], this condition is anticipated to be insignificant in agricultural soils where external sources of easily bioavailable P are added, mostly beyond the crop P removal rate. There are, however, several indirect mechanisms that plant roots can access the acid-P pool, including the release of protons and low-molecular-weight organic acids, microbial metabolites, or root exudates, or through symbiotic relationships with specific microorganisms but most often under P starvation or under low P conditions [4,42]. Thus, exploitation of these physicochemical or biological routes to turn recalcitrant P pools into plant available forms benefits both saving the declining natural resource as well as limiting P loss into open waters. The paucity of research on the pathways of acid-P pool formation has limited our ability to understand P dynamics in soils.
This study provided improved insight into the sources and pathways of formation of HCl-Pi and HNO3-Pi pools in an agricultural soil. This information could be useful to minimize or slow down the transformation of P into residual P pools. Furthermore, this information can be utilized to explore the avenues to mobilize these P pools. On the methodological front, our results provide evidence that the stable isotope method goes beyond operationally defined P pool speciation and aids in developing a mechanistic understanding on the formation of acid-P pools. It is hoped that application of new tracers that are more specific to reactions and processes will catalyze new research efforts and thus enhance our understanding from classically operationally-defined P pools to functionally-defined P speciation in soils.
Author Contributions
Conceptualization, S.R.J. and D.P.J.; Methodology, S.R.J., W.L. and M.B.; Formal Analysis, S.R.J., W.L. and M.B.; Investigation, S.R.J., D.P.J., W.L. and M.B.; Writing-Original Draft Preparation, S.R.J.; Writing-Review & Editing, S.R.J., D.P.J., W.L. and M.B.; Visualization, S.R.J., D.P.J. and W.L.; Supervision, D.P.J.; Project Administration, D.P.J.; Funding Acquisition, D.P.J. and W.L.
Funding
This research was funded by USDA grant number 2016-08499, NSF grant number 1738770, Delaware EPSCoR grant number 1301765, and National Natural Science Foundation (China) grant number 41571130061.
Acknowledgments
XRD analyses were performed at the Environmental Molecular Sciences Laboratory (EMSL), a national scientific user facility sponsored by the Department of Energy’s Office of Biological and Environmental Research, at Pacific Northwest National Laboratory (PNNL). We thank Ashley Denny and Nirman Dhakal for their help with soil core recovery and water extraction.
Conflicts of Interest
The authors declare no conflict of interest.
References
- Suh, S.; Yee, S. Phosphorus use-efficiency of agriculture and food system in the US. Chemosphere 2011, 84, 806–813. [Google Scholar] [CrossRef] [PubMed]
- Cordell, D.; Drangert, J.-O.; White, S. The story of phosphorus: Global food security and food for thought. Glob. Environ. Chang. 2009, 19, 292–305. [Google Scholar] [CrossRef]
- Morse, D.; Head, H.H.; Wilcox, C.J. Disappearance of phosphorus in phytate from concentrates invitro and from rations fed to lactating dairy-cows. J. Dairy Sci. 1992, 75, 1979–1986. [Google Scholar] [CrossRef]
- Richardson, A.E.; Simpson, R.J. Soil microorganisms mediating phosphorus availability. Plant Physiol. 2011, 156, 989–996. [Google Scholar] [CrossRef] [PubMed]
- Gaxiola, R.A.; Edwards, M.; Elser, J.J. A transgenic approach to enhance phosphorus use efficiency in crops as part of a comprehensive strategy for sustainable agriculture. Chemosphere 2011, 84, 840–845. [Google Scholar] [CrossRef] [PubMed]
- Jaisi, D.P.; Blake, R.E. Advances in using oxygen isotope ratios of phosphate to understand phosphorus cycling in the environment. Adv. Agron. 2014, 125, 1–53. [Google Scholar]
- Kruse, J.; Abraham, M.; Amelung, W.; Baum, C.; Bol, R.; Kuhn, O.; Lewandowski, H.; Niederberger, J.; Oelmann, Y.; Ruger, C.; et al. Innovative methods in soil phosphorus research: A review. J. Plant Nutr. Soil Sci. 2015, 178, 43–88. [Google Scholar] [CrossRef] [PubMed]
- Chang, S.C.; Jackson., M.L. Fractionation of soil phosphorus. Soil Sci. 1957, 84, 133–144. [Google Scholar] [CrossRef]
- Hedley, M.J.; Stewart, J.W.B.; Chauhan, B. Changes in inorganic and organic soil phosphorus fractions induced by cultivation practices and by laboratory incubations. Soil Sci. Soc. Am. J. 1982, 46, 970–976. [Google Scholar] [CrossRef]
- Tiessen, H.; Stewart, J.W.B.; Cole, C.V. Pathways of phosphorus transformations in soils of differing pedogenesis. Soil Sci. Soc. Am. J. 1984, 48, 853–858. [Google Scholar] [CrossRef]
- Barrow, N.J. Reaction of anions and cations with variable-charge soils. Adv. Agron. 1986, 38, 183–230. [Google Scholar]
- Ajiboye, B.; Akinremi, A.O.; Hu, Y.; Flaten, D.N. Phosphorus speciation of sequential extracts of organic amendments using nuclear magnetic resonance and x-ray absorption near-edge structure spectroscopies. J. Environ. Qual. 2007, 36, 1563–1576. [Google Scholar] [CrossRef] [PubMed]
- Kruse, J.; Negassa, W.; Appathurai, N.; Zuin, L.; Leinweber, P. Phosphorus speciation in sequentially extracted agro-industrial by-products: Evidence from x-ray absorption near edge structure spectroscopy. J. Environ. Qual. 2010, 39, 2179–2184. [Google Scholar] [CrossRef] [PubMed]
- Liu, J.; Hu, Y.F.; Yang, J.J.; Abdi, D.; Cade-Menun, B.J. Investigation of soil legacy phosphorus transformation in long-term agricultural fields using sequential fractionation, p k-edge xanes and solution p nmr spectroscopy. Environ. Sci. Technol. 2015, 49, 168–176. [Google Scholar] [CrossRef] [PubMed]
- Jaisi, D.P.; Blake, R.E. Tracing sources and cycling of phosphorus in peru margin sediments using oxygen isotopes in authigenic and detrital phosphates. Geochim. Cosmochim. Acta 2010, 74, 3199–3212. [Google Scholar] [CrossRef]
- Zohar, I.; Shaviv, A.; Young, M.; Kendall, C.; Silva, S.; Paytan, A. Phosphorus dynamics in soils irrigated with reclaimed waste water or fresh water—A study using oxygen isotopic composition of phosphate. Geoderma 2010, 159, 109–121. [Google Scholar] [CrossRef]
- Angert, A.; Weiner, T.; Mazeh, S.; Tamburini, F.; Frossard, E.; Bernasconi, S.M.; Sternberg, M. Seasonal variability of soil phosphate stable oxygen isotopes in rainfall manipulation experiments. Geochim. Cosmochim. Acta 2011, 75, 4216–4227. [Google Scholar] [CrossRef]
- Tamburini, F.; Pfahler, V.; Bunemann, E.K.; Guelland, K.; Bernasconi, S.M.; Frossard, E. Oxygen isotopes unravel the role of microorganisms in phosphate cycling in soils. Environ. Sci. Technol. 2012, 46, 5956–5962. [Google Scholar] [CrossRef] [PubMed]
- Joshi, S.R.; Li, X.N.; Jaisi, D.P. Transformation of phosphorus pools in an agricultural soil: An application of oxygen-18 labeling in phosphate. Soil Sci. Soc. Am. J. 2016, 80, 69–78. [Google Scholar] [CrossRef]
- Joshi, S.R.; Kukkadapu, R.K.; Burdige, D.J.; Bowden, M.E.; Sparks, D.L.; Jaisi, D.P. Organic matter remineralization predominates phosphorus cycling in the mid-bay sediments in the chesapeake bay. Environ. Sci. Technol. 2015, 49, 5887–5896. [Google Scholar] [CrossRef] [PubMed]
- Zohar, I.; Shaviv, A.; Klass, T.; Roberts, K.; Paytan, A. Method for the analysis of oxygen isotopic composition of soil phosphate fractions. Environ. Sci. Technol. 2010, 44, 7583–7588. [Google Scholar] [CrossRef] [PubMed]
- Johansen, H.S.; Middleboe, V.; Larsen, S. Delabelling of 18 o enriched phosphate added to soil as a function of biological activity in the soil. In Stable Isotopes in Plant Nutrition, Soil Fertility and Environmental Studies; IAEA: Vienna, Austria, 1991; pp. 553–559. [Google Scholar]
- Bauke, S.L.; von Sperber, C.; Tamburini, F.; Gocke, M.I.; Honermeier, B.; Schweitzer, K.; Baumecker, M.; Don, A.; Sandhage-Hofmann, A.; Amelung, W. Subsoil phosphorus is affected by fertilization regime in long-term agricultural experimental trials. Eur. J. Soil Sci. 2018, 69, 103–112. [Google Scholar] [CrossRef]
- Bauke, S.L.; von Sperber, C.; Siebers, N.; Tamburini, F.; Amelung, W. Biopore effects on phosphorus biogeochemistry in subsoils. Soil Biol. Biochem. 2017, 111, 157–165. [Google Scholar] [CrossRef]
- Von Sperber, C.; Stallforth, R.; Du Preez, C.; Amelung, W. Changes in soil phosphorus pools during prolonged arable cropping in semiarid grasslands. Eur. J. Soil Sci. 2017, 68, 462–471. [Google Scholar] [CrossRef]
- O’Neil, J.R.; Vennemann, T.W.; McKenzie, W.F. Effects of speciation on equilibrium fractionations and rates of oxygen isotope exchange between (PO4) aq and H2O. Geochim. Cosmochim. Acta 2003, 67, 3135–3144. [Google Scholar] [CrossRef]
- Lecuyer, C.; Grandjean, P.; Sheppard, S.M.F. Oxygen isotope exchange between dissolved phosphate and water at temperatures ≤135 c: Inorganic versus biological fractionations. Geochim. Cosmochim. Acta 1999, 63, 855–862. [Google Scholar] [CrossRef]
- Jaisi, D.P.; Blake, R.E.; Kukkadapu, R.K. Fractionation of oxygen isotopes in phosphate during its interactions with iron oxides. Geochim. Cosmochim. Acta 2010, 74, 1309–1319. [Google Scholar] [CrossRef]
- Stout, L.M.; Joshi, S.R.; Kana, T.M.; Jaisi, D.P. Microbial activities and phosphorus cycling: An application of oxygen isotope ratios in phosphate. Geochim. Cosmochim. Acta 2014, 138, 101–116. [Google Scholar] [CrossRef]
- Longinelli, A.; Nuti, S. Revised phosphate-water isotopic temperature scale. Earth Planet. Sci. Lett. 1973, 19, 373–376. [Google Scholar] [CrossRef]
- Blake, R.E.; O’Neil, J.R.; Garcia, G.A. Oxygen isotope systematics of biologically mediated reactions of phosphate: I. Microbial degradation of organophosphorus compounds. Geochim. Cosmochim. Acta 1997, 61, 4411–4422. [Google Scholar] [CrossRef]
- Ruttenberg, K.C. Development of a sequential extraction method for different forms of phosphorus in marine sediments. Limnol. Oceanogr. 1992, 37, 1460–1482. [Google Scholar] [CrossRef]
- Bish, D.L.; Howard, S.A. Quantitative phase-analysis using the rietveld method. J. Appl. Crystallogr. 1988, 21, 86–91. [Google Scholar] [CrossRef]
- Murphy, J.; Riley, J.P. A modified single solution method for the determination of phosphate in natural water. Anal. Chem. Acta 1962, 27, 31–36. [Google Scholar] [CrossRef]
- Rowland, A.P.; Haygarth, P.M. Determination of total dissolved phosphorus in soil solutions. J. Environ. Qual. 1997, 26, 410–415. [Google Scholar] [CrossRef]
- Jaisi, D.P.; Blake, R.E.; Liang, Y.; Chan, S.-J. Investigation of compound-specific organic-inorganic phos-phorus transformation using stable isotope ratios in phosphate. In Applied Manure and Nutrient Chemistry for Sustainable Agriculture of Environment; He, Z., Zhang, H., Eds.; Springer Science + Business Media: Dordrecht, The Netherlands, 2014; pp. 267–292. [Google Scholar]
- Karl, D.M.; Tien, G. Magic: A sensitive and precise method for measuring dissolved phosphorus in aquatic environments. Limnol. Oceanogr. 1992, 37, 105–116. [Google Scholar] [CrossRef]
- Chang, S.J.; Blake, R.E. Precise calibration of equilibrium oxygen isotope fractionations between dissolved phosphate and water from 3 to 37 degrees c. Geochim. Cosmochim. Acta 2015, 150, 314–329. [Google Scholar] [CrossRef]
- Lehmann, J.; Lan, Z.; Hyland, C.; Sato, S.; Solomon, D.; Ketterings, Q.M. Long-term dynamics of phosphorus forms and retention in manure-amended soils. Environ. Sci. Technol. 2005, 39, 6672–6680. [Google Scholar] [CrossRef] [PubMed]
- McKenzie, R.H.; Stewart, J.W.B.; Dormaar, J.F.; Schaalje, G.B. Long-term crop-rotation and fertilizer effects on phosphorus transformations. 2. In a luvisolic soil. Can. J. Soil Sci. 1992, 72, 581–589. [Google Scholar] [CrossRef]
- Richards, J.E.; Bates, T.E.; Sheppard, S.C. Changes in the forms and distribution of soil-phosphorus due to long-term corn production. Can. J. Soil Sci. 1995, 75, 311–318. [Google Scholar] [CrossRef]
- Guo, F.; Yost, R.S.; Hue, N.V.; Evensen, C.I.; Silva, J.A. Changes in phosphorus fractions in soils under intensive plant growth. Soil Sci. Soc. Am. J. 2000, 64, 1681–1689. [Google Scholar] [CrossRef]
- Cross, A.F.; Schlesinger, W.H. A literature review and evaluation of the. Hedley fractionation: Applications to the biogeochemical cycle of soil phosphorus in natural ecosystems. Geoderma 1995, 64, 197–214. [Google Scholar] [CrossRef]
- Tiessen, H.; Stewart, J.W.B.; Moir, J.O. Changes in organic and inorganic phosphorus composition of 2 grassland soils and their particle-size fractions during 60–90 years of cultivation. J. Soil Sci. 1983, 34, 815–823. [Google Scholar] [CrossRef]
- McLaren, T.I.; Guppy, C.N.; Tighe, M.K.; Schefe, C.R.; Flavel, R.J.; Cowie, B.C.C.; Tadich, A. Validation of soil phosphate removal by alkaline and acidic reagents in a vertosol soil using xanes spectroscopy. Commun. Soil Sci. Plant Anal. 2015, 46, 1998–2017. [Google Scholar] [CrossRef]
- Zhang, T.Q.; MacKenzie, A.F. Changes of phosphorous fractions under continuous corn production in a temperate clay soil. Plant Soil 1997, 192, 133–139. [Google Scholar] [CrossRef]
- Angert, A.; Weiner, T.; Mazeh, S.; Sternberg, M. Soil phosphate stable oxygen isotopes across rainfall and bedrock gradients. Environ. Sci. Technol. 2012, 46, 2156–2162. [Google Scholar] [CrossRef] [PubMed]
- Ayliffe, L.K.; Lister, A.M.; Chivas, A.R. The preservation of glacial-interglacial climatic signatures in the oxygen isotopes of elephant skeletal phosphate. Palaeogeogr. Palaeoclimatol. Palaeoecol. 1992, 99, 179–191. [Google Scholar] [CrossRef]
- Mizota, C.; Domon, Y.; Yoshida, N. Oxygen isotope composition of natural phosphates from volcanic ash soils of the great rift valley of Africa and east Java, Indonesia. Geoderma 1992, 53, 111–123. [Google Scholar] [CrossRef]
- Syers, J.K.; Johnson, A.E.; Curtin, D. Efficiency of soil and fertilizer phosphorus use: Reconciling changing concepts of soil phosphorus behavior with agronomic information. In FAO Fertilizer and Plant Nutrition Bulletin; Food and Agriculture Organization of the United Nations: Rome, Italy, 2008. [Google Scholar]
- Arai, Y.; Sparks, D.L. Phosphate reaction dynamics in soils and soil components: A multiscale approach. Adv. Agron. 2007, 94, 135–179. [Google Scholar]
- Bolan, N.S.; Barrow, N.J.; Posner., A.M. Describing the effect of time on sorption of phosphate by iron and aluminum hydroxy-oxides. J. Soil Sci. 1985, 36, 187–197. [Google Scholar] [CrossRef]
- Parfitt, R.L. Phosphate reactions with natural allophane, ferrihydrite, and goethite. J. Soil Sci. 1989, 40, 359–369. [Google Scholar] [CrossRef]
- Sims, J.T.; Simard, R.R.; Joern, B.C. Phosphorus loss in agricultural drainage: Historical perspective and current research. J. Environ. Qual. 1998, 27, 277–293. [Google Scholar] [CrossRef]
- Kleinman, P.J.A.; Church, C.; Saporito, L.S.; McGrath, J.M.; Reiter, M.S.; Allen, A.L.; Tingle, S.; Binford, G.D.; Han, K.; Joern, B.C. Phosphorus leaching from agricultural soils of the Delmarva Peninsula, USA. J. Environ. Qual. 2015, 44, 524–534. [Google Scholar] [CrossRef] [PubMed]
- De Jonge, L.W.; Moldrup, P.; Rubæk, G.H.; Schelde, K.; Djurhuus, J. Particle leaching and particle-facilitated transport of phosphorus at field scale. Vadose Zone J. 2004, 3, 462–470. [Google Scholar] [CrossRef]
- Djodjic, F.; Ulen, B.; Bergstrom, L. Temporal and spatial variations of phosphorus losses and drainage in a structured clay soil. Water Res. 2000, 34, 1687–1695. [Google Scholar] [CrossRef]
- Jiang, X.; Bol, R.; Nischwitz, V.; Siebers, N.; Willbold, S.; Vereecken, H.; Amelung, W.; Klumpp, E. Phosphorus containing water dispersible nanoparticles in arable soil. J. Environ. Qual. 2015, 44, 1772–1781. [Google Scholar] [CrossRef] [PubMed]
- Velasquez, G.; Ngo, P.T.; Rumpel, C.; Calabi-Floody, M.; Redel, Y.; Turner, B.L.; Condron, L.M.; Mora, M.D. Chemical nature of residual phosphorus in andisols. Geoderma 2015, 271, 27–31. [Google Scholar] [CrossRef]


© 2018 by the authors. Licensee MDPI, Basel, Switzerland. This article is an open access article distributed under the terms and conditions of the Creative Commons Attribution (CC BY) license (http://creativecommons.org/licenses/by/4.0/).