


Abstract
The X and Gamma Imager and Spectrometer (XGIS) on board THESEUS is a finely pixelized and modular instrument designed for broadband high-energy transient detection. XGIS consists of two cameras, each composed of 10 supermodules, with each supermodule further divided into 10 modules and each module made with 64 independent readout pixels based on Silicon Drift Detectors coupled with 5 × 5 × 30 mm3 CsI scintillator bars. An algorithm to quickly read out the signals from the 64 pixels and send them in chronological order through the module and supermodule logic up to the camera logic is under development. Furthermore, a challenge for space-based high-energy instruments is distinguishing X-/gamma-ray photons while effectively rejecting background photons and particles, including electrons, protons, and heavier cosmic rays. Unlike traditional systems that rely on anticoincidence systems, XGIS aims to achieve background rejection through an innovative readout logic that analyzes the spatial and temporal properties of energy deposits in the detector. By leveraging the finely pixelized structure, the readout system can differentiate single-photon events from charged-particle tracks based on energy deposition patterns and event topology.
1. Introduction
THESEUS (Transient High-Energy Sky and Early Universe Surveyor) is a space mission concept selected by ESA for a Phase 0/A study as one of the three candidate M7 missions in the framework of the Cosmic Vision program [1].
Its primary scientific goals are to explore the early universe by detecting and characterizing Gamma-Ray Bursts (GRBs) up to redshift and beyond in order to probe star formation history, the emergence of Pop. III/II stars, and the re-ionization epoch. At the same time, THESEUS will perform a deep monitoring of the X-ray transient sky, enabling rapid localization of electromagnetic counterparts to gravitational wave and neutrino sources, as well as detailed studies of diverse astrophysical transients ranging from magnetars and tidal disruption events to supernova shock breakouts and active galactic nuclei (AGN) [2].
The main payload on-board THESEUS consists of three main instruments [2]:
- Soft X-ray Imager (SXI): Based on two lobster-eye telescope units, provides wide-field coverage in the 0.3–5 keV band with arcminute accuracy;
- InfraRed Telescope (IRT): A 0.7 m class instrument with both imaging and spectroscopic capabilities, enables rapid follow-up of transients in the 0.7–1.8 μm band;
- X-Gamma-ray Imaging Spectrometer (XGIS): Provides a wider energy range up to 10 MeV through two wide-field coded-mask cameras, offering broad sky coverage and precise source localization in the hard X-ray/soft gamma-ray domain.
This work focuses in particular on two different aspects related to the XGIS instrument. On one hand, its simulates the readout logic up to the camera level: this is fundamental to evaluate some key XGIS performances before the actual hardware is available for testing. One of the main objectives is to avoid the on-board execution of time-sorting algorithms based on timestamp information, thereby accelerating the data flow and enabling the fastest possible transient detection: this is the focus of the study presented in Section 2. On the other hand, this study develops a discrimination algorithm between X/-ray photons and particles, a crucial task for this instrument since it lacks an anticoincidence system: this topic is addressed in Section 3.
2. XGIS Readout Logic Simulation
2.1. Materials and Methods
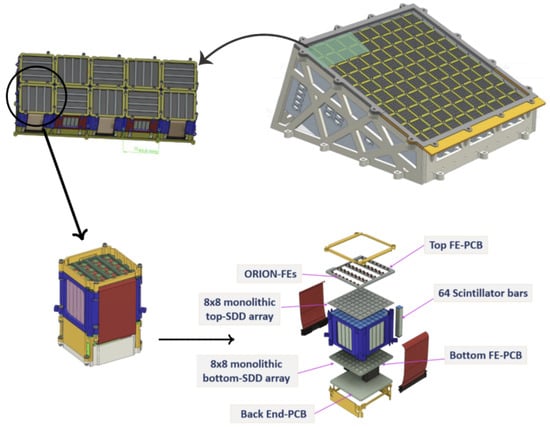
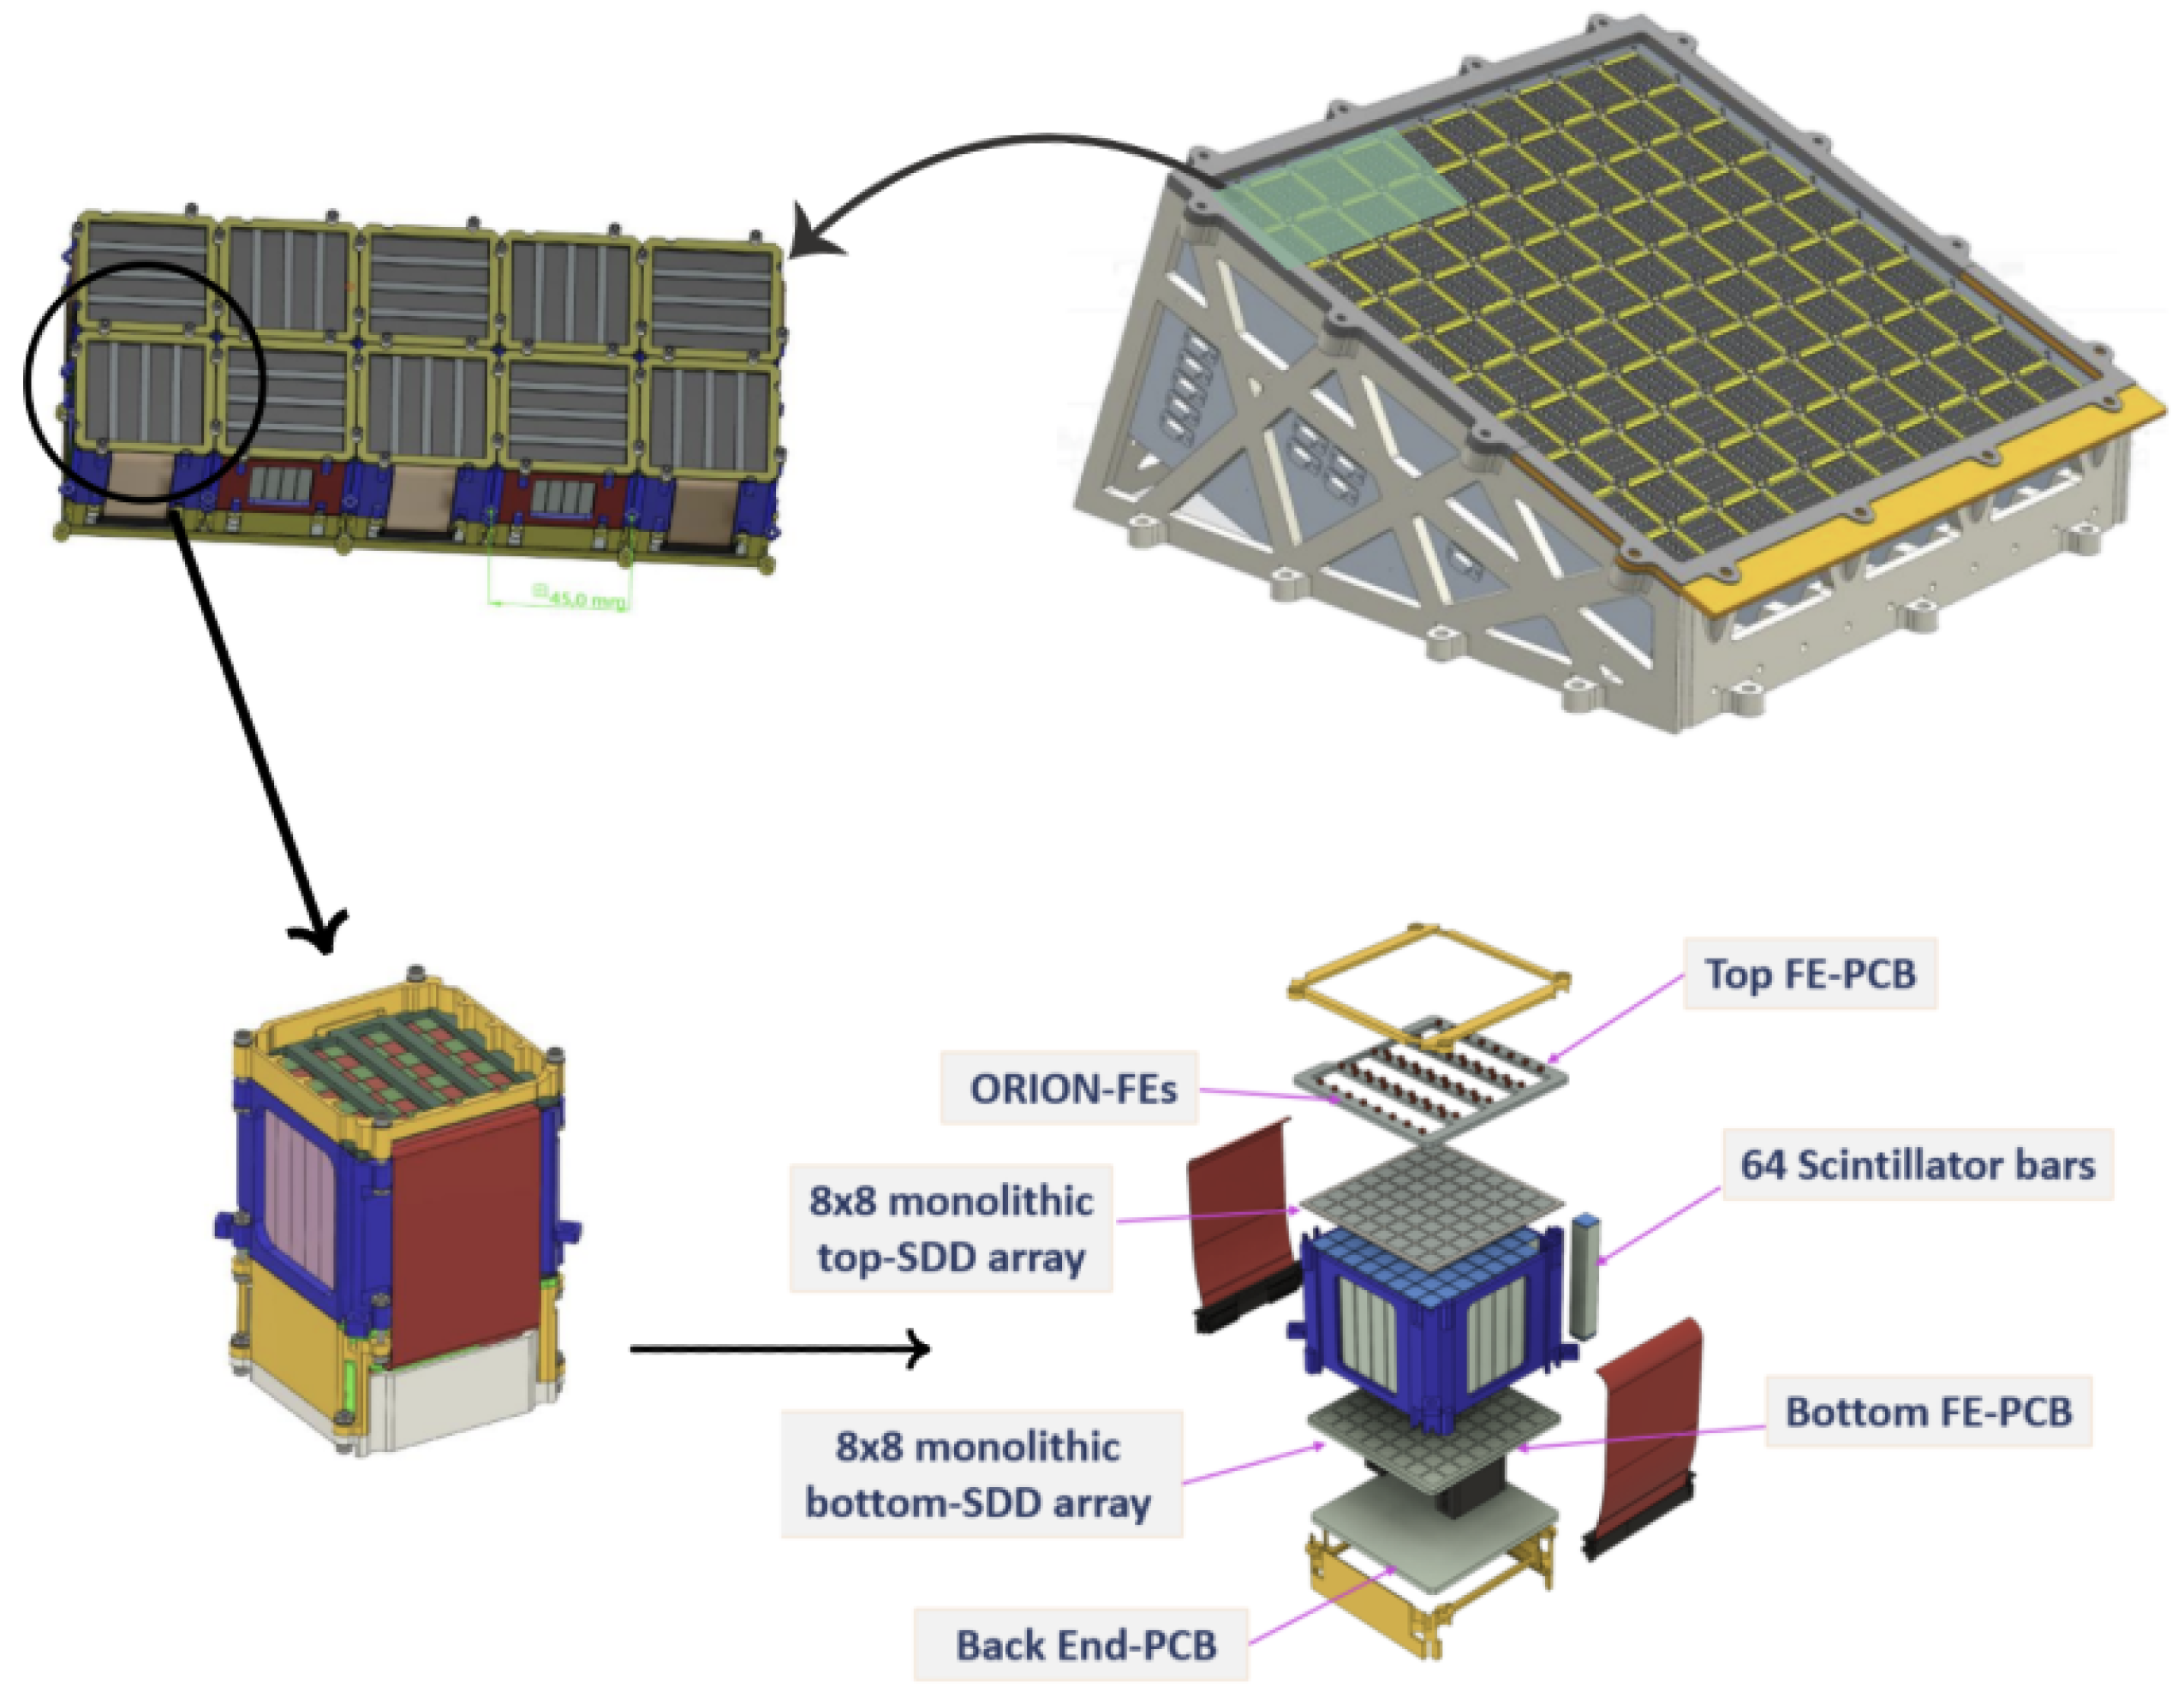
Each of the two XGIS cameras mentioned before is equipped, on its focal plane, with an array of 6400 pixels in total: they represent the basic detection element of the instrument and consist of CsI(Tl) scintillator bars (3 cm thick) read out at both ends by 2 Silicon Drift Detectors (SDDs, 4.5 × 4.5 mm2 area) [3]. The pixels are grouped into 100 modules (bottom left in Figure 1), each containing 64 pixels, and 10 modules are assembled into a supermodule (SM—upper left in Figure 1); finally, 10 SMs are combined to form the entire focal plane of a single XGIS camera.
Figure 1.
XGIS focal plane of a single camera (upper right) and close-up of a single SM (upper left) and of a single module (bottom left), with an exploded view of its components (bottom right) [Adapted from [3]].
The SDDs serve both as readout systems for the CsI bars and as independent detectors for X-rays, and each pixel operates independently, allowing for parallel and simultaneous detection of multiple events. Each photon detected produces a 64-bit digital word to be processed, carrying information about the energy deposited on the top and bottom SDD (the latter only in the case of a photon interacting with the scintillator), as well as the event timestamp with a precision1.
In order to mimic an accurate readout scenario and instrument response, we fed the algorithm with a list of events provided by Geant-4 simulations, including the overall expected background in a LEO orbit [4] and the photon flux from GRBs of different intensities and durations. In particular, we modeled the GRBs with a Band function [5]:
where and are the low- and high-energy photon indices, respectively, and Ebreak is the characteristic break energy in keV; the simulations were performed for three different photon fluxes, namely 40, 120, and , and a fixed GRB duration of 1 s. For each photon interaction with the pixel matrix, a binary 64-bit digital word as described above is provided in order for the obtained data stream to be compliant with the Data Handling Unit (DHU) requirements.
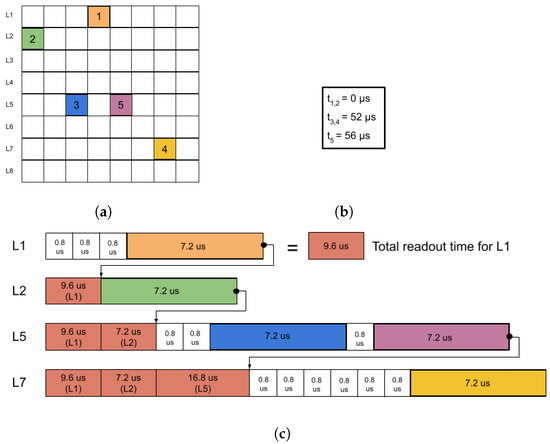
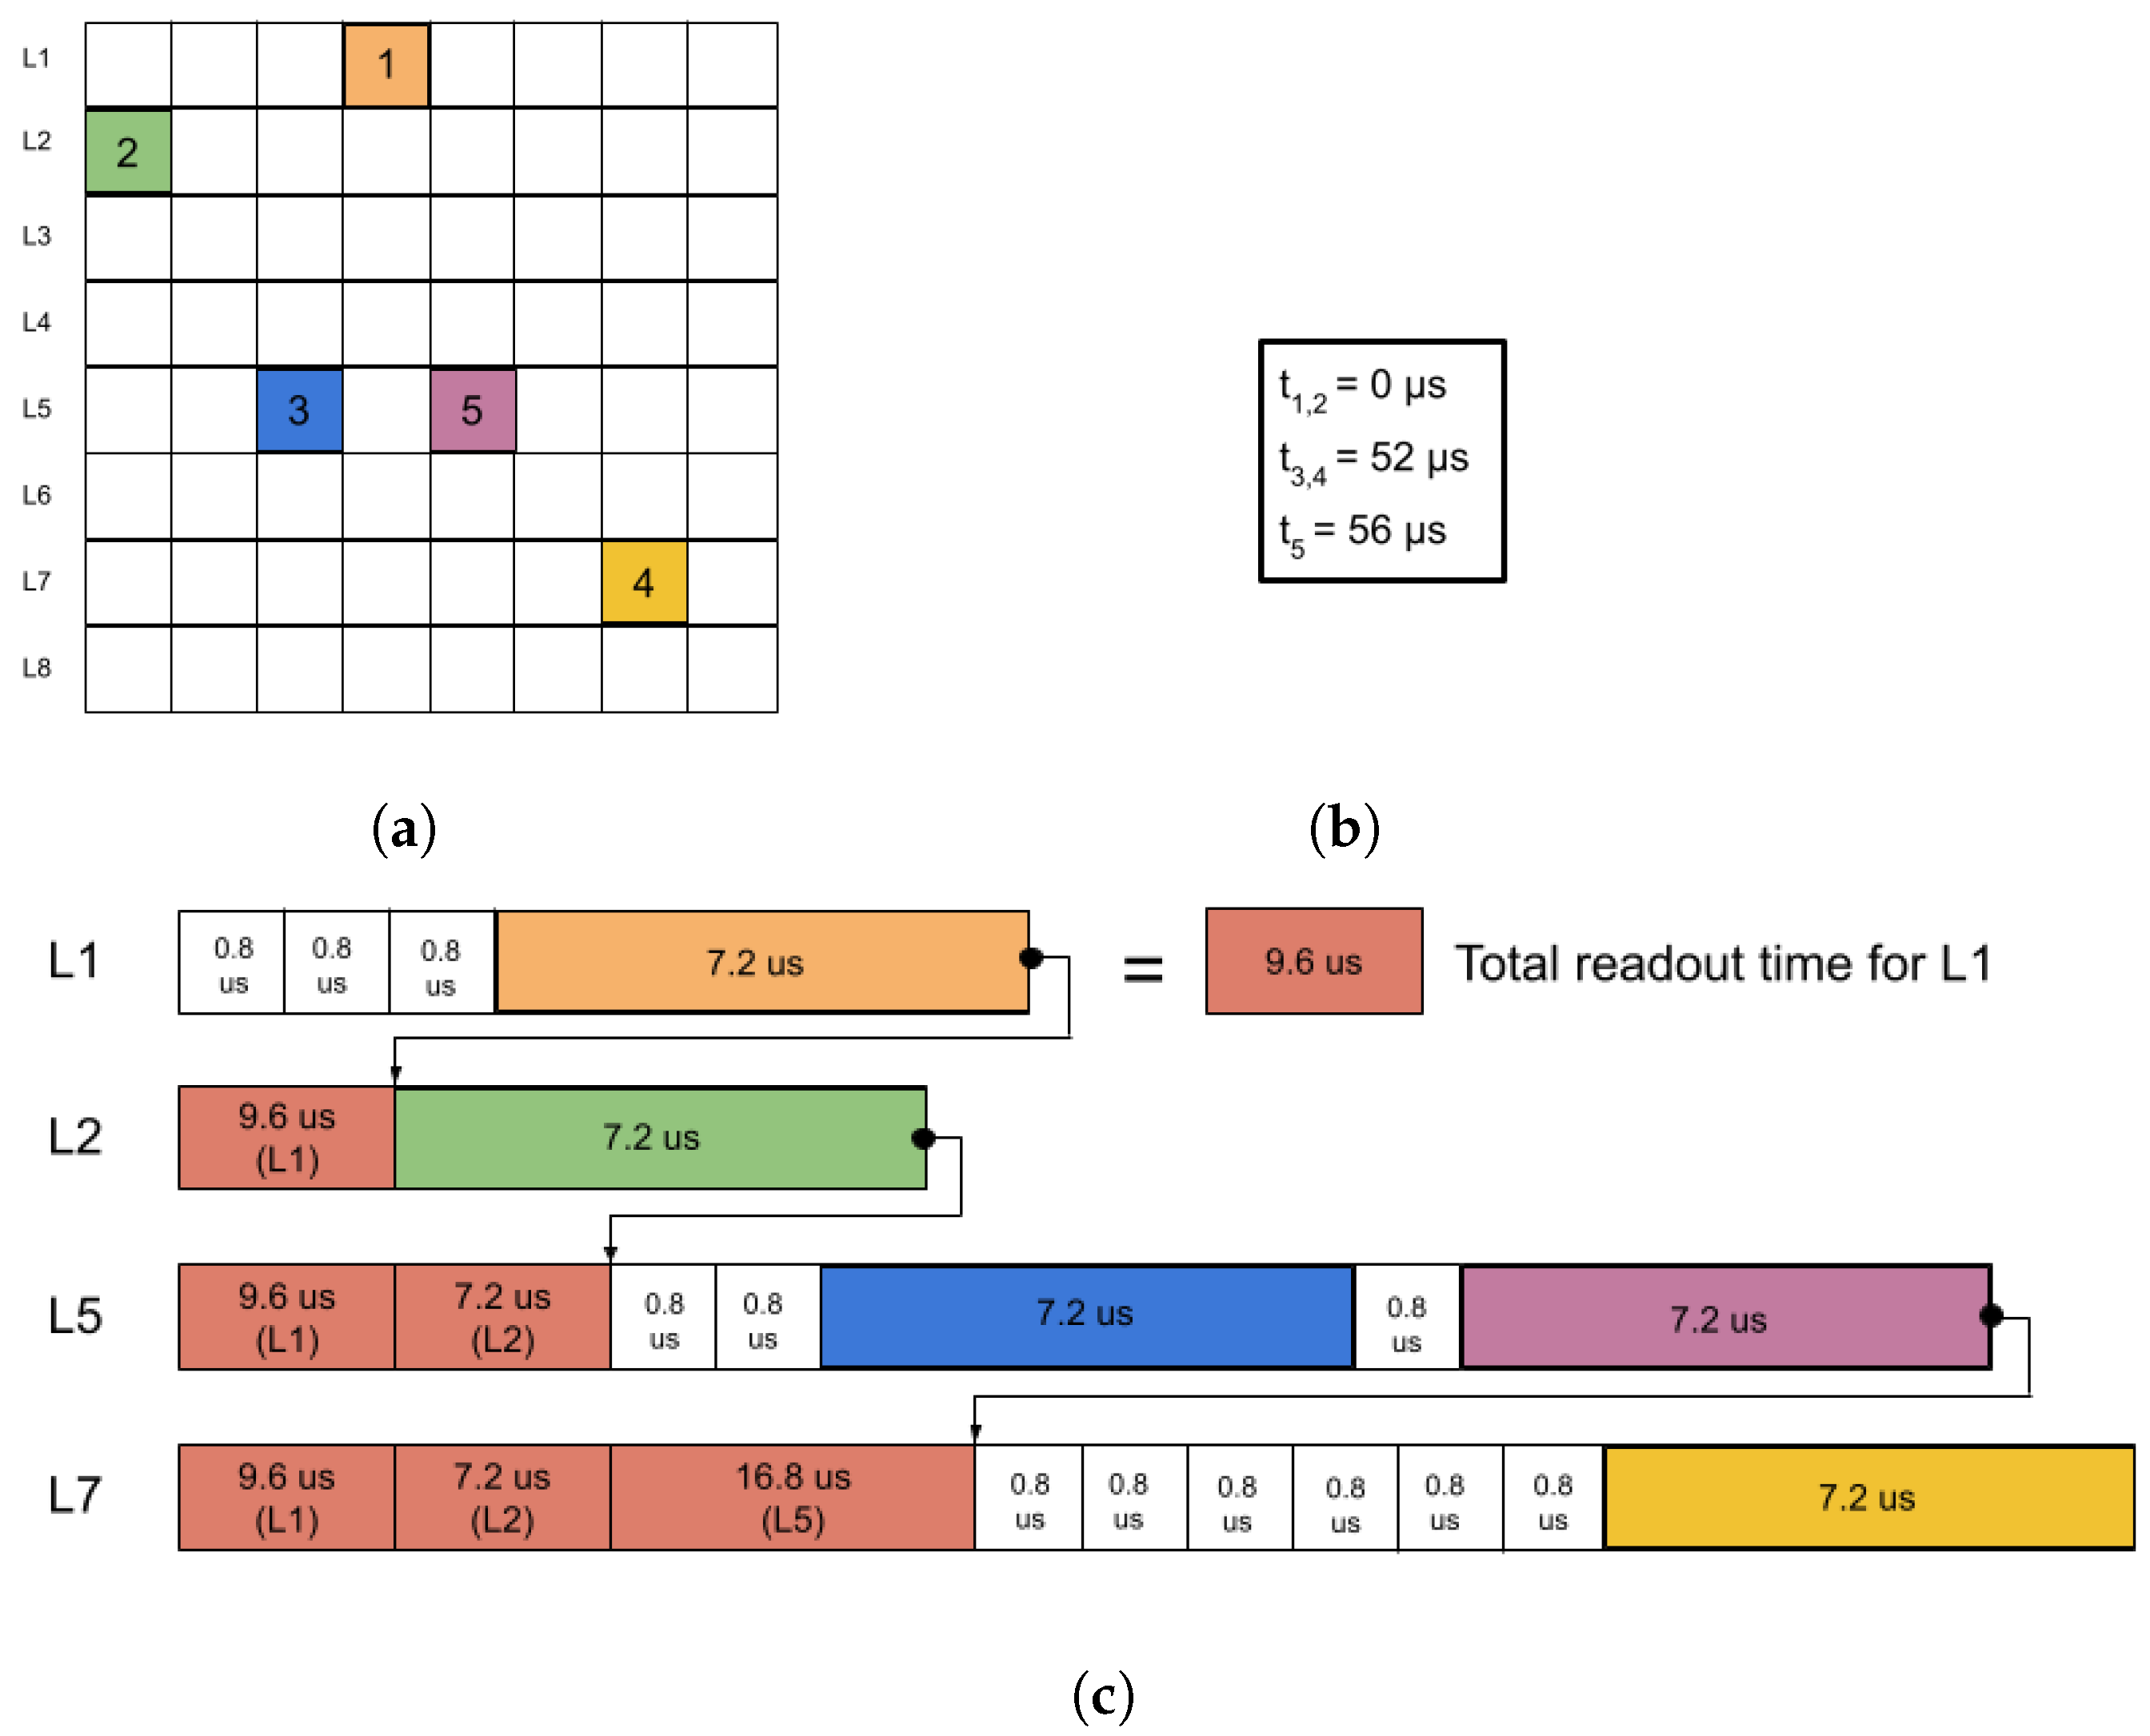
To assess the performance of the output data stream, we first examined various possible readout logics at the module level and decided to begin by testing the configuration presented in this article, with the aim of identifying the optimal setup and quantifying potential errors that may propagate to higher levels (SM, camera, etc.). In the proposed logic, the 64 pixels in a module are grouped into eight rows. When a photon or particle hits a pixel, a ‘Look At Me’ (LAM) signal is raised in the corresponding row, which is then read starting from the first pixel in that row. In the example provided in Figure 2, we set the clock at 10 MHz (1 bit = 0.1 µs).
Figure 2.
Five photons hit the module represented in (a), with arrival times provided in (b). The readout order for the five hit pixels, together with the time required to perform each process, is represented in panel (c).
With this clock frequency, an empty pixel will be read in 0.8 µs2, while those that carry information will take 7.2 µs. If two photons strike the same row within a short time interval, by the time the first processing is completed (blue in Figure 2c), another pixel from that row may already be active, so the readout continues on the same row. As a result, pixels in other rows, even if they were activated earlier (yellow in Figure 2c), may have to wait until the current row is fully handled.
To assess the level of disorder in the output data stream due to effects like the one described above, we measured the fraction of events whose temporal order changed between detection and module readout, also including missed pixels (e.g., event hitting an already active pixel) and information on the average “waiting time” for each pixel.
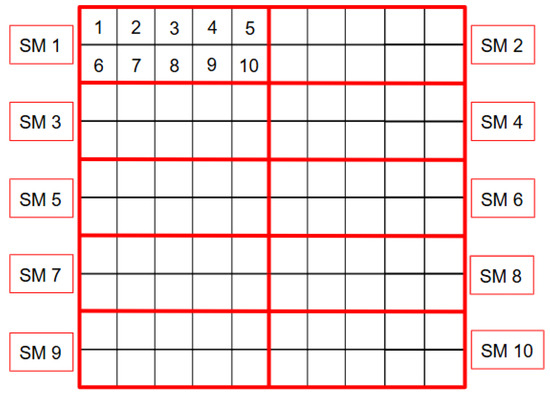
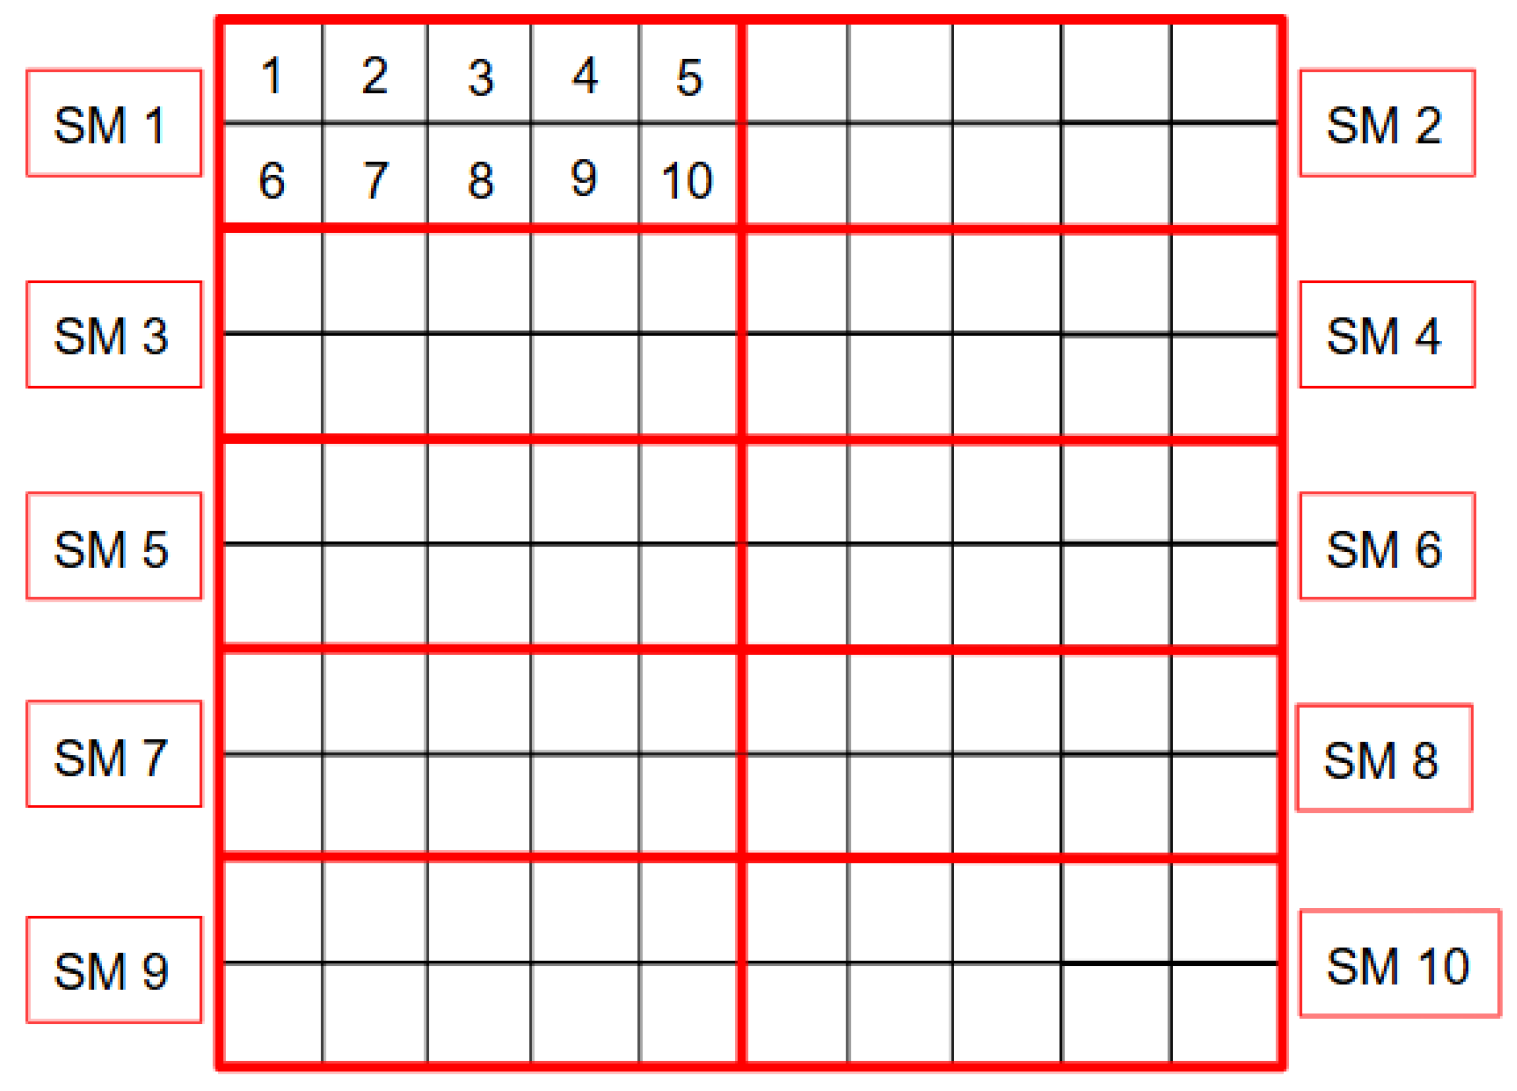
At the supermodule level, no additional disorder is expected: each module communicates independently with its own SM, and as soon as an event is read, it is transmitted to the SM together with information on the pixel/module/SM position encoded in the binary word. In Figure 3 is shown the currently adopted module and SM division at the camera level.
Figure 3.
Module and SM division inside an XGIS camera.
2.2. Results and Discussion
Results on a single SM are presented for a 10 s simulation of the background with a 1 s superimposed GRB, as described in Section 2.1. At least one particle for each type (primary/secondary protons; Cosmic X-ray Background—CXB; albedo neutrons; etc.) has been included in the simulation in order to assess the impact of various particle types on the readout process.
Data in Table 1 show several interesting trends: the percentage of missed photon hits appears to be driven mainly by the background, whereas the fraction of disordered photons increases primarily with the GRB flux. The median time shift suggests that disorder in the data usually corresponds to a single shift between two events, with the maximum shift linked to photons that arrive immediately after an energetic particle has hit the module. The median time in queue reflects the chosen readout logic, in which photons at the end of a row wait, on average, longer than those at the beginning (about 4 μs corresponds roughly to the middle of a row). Most importantly, the last row shows that, despite the presence of some disorder, this never exceeds—even in the strong GRB scenario—the millisecond resolution [3] that XGIS is expected to achieve during on-board sky monitoring (Survey Mode). Thus, there is no need to implement on-board event-sorting algorithms for the GRB fluxes that THESEUS is expected to observe.
Table 1.
Preliminary results from the proposed readout logic, related to a single supermodule. In the third row, time shift is defined as the number of positions by which an event is displaced relative to the actual order in which the photons hit the detector. Checkmarks in the last row indicates that data ordering at millisecond resolution has been achieved.
The next steps will involve new simulations, both with more realistic GRB models and, if necessary, with different readout logics. In addition, the new module design proposed in M7 should be taken into account, in which the pixels will no longer be grouped into eight rows but instead into four quadrants within each module. Finally, it is important to extend the simulation up to the Camera Back-End Electronics (BEE) and the DHU in order to have a clear understanding of the whole data stream.
3. Particle Rejection Algorithm
3.1. Materials and Methods
As XGIS lacks an anticoincidence system, distinguishing particle events from actual X and photons becomes a crucial task. By exploiting XGIS’s detector granularity, we proposed a multi-layered filter focusing on three different aspects:
- Double Energy–Multiplicity filter: We examined different primary energy bands.
- XGIS X (2–30 keV) and S-mode (20–150 keV) bands, the two main energy intervals in which the instrument has imaging capabilities;
- 150–300 keV;
- 300 keV–5 MeV;
- >5 MeV, which is most relevant for particles.
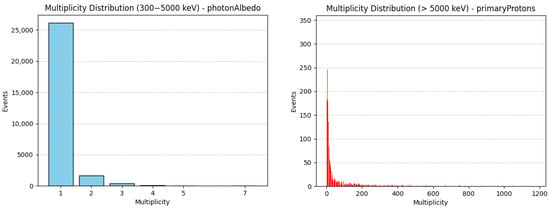
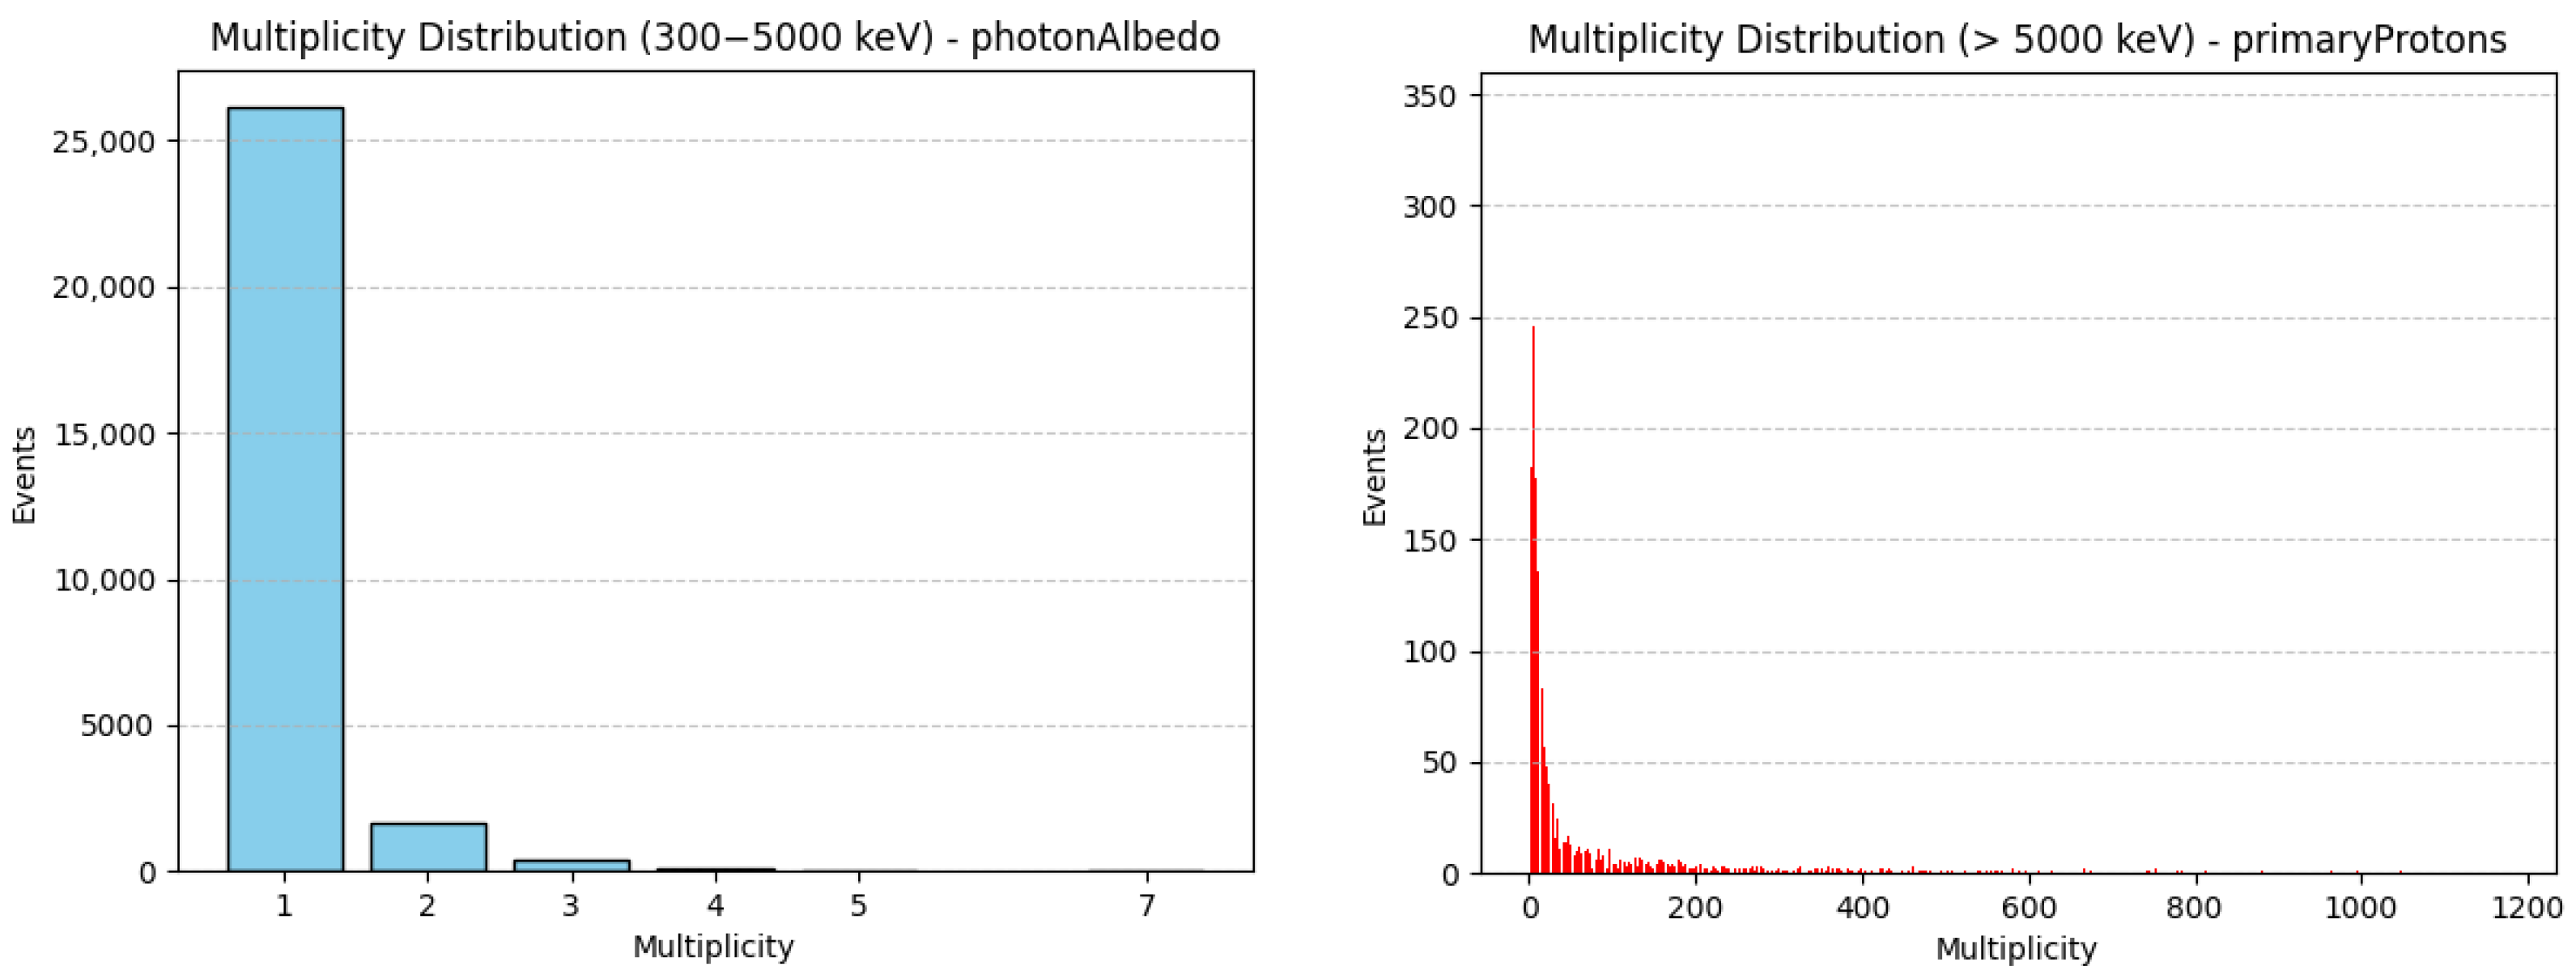
By examining the multiplicity distributions for photons and particles obtained from the Geant-4 simulations mentioned in Section 2.1, we decided to reject all events with a multiplicity greater than 4. This threshold was chosen because, even for high-energy photons, higher multiplicities are almost never observed, as shown in the left histogram of Figure 4. In contrast, particles can easily reach multiplicities exceeding 100, as illustrated in the right histogram of the same figure. For events with lower multiplicity, an additional cross-check can be performed by examining the mutual distance between simultaneous hits: if they are close to each other, the event is flagged as a photon3. We also reject low-energy deposits near the bottom of the SDD, which are primarily related to particles interacting with the spacecraft structure. In particular, we remove deposits below 150 keV by applying a threshold of 0.4 cm near the bottom of the SDD (i.e., by evaluating the ratio between the top and bottom ADC signals).Figure 4. Multiplicity distributions for albedo photons in the energy range 300 keV–5 MeV (left) and for primary protons with energies higher than 5 MeV (right). - Filter based on the MIP4 signature: Each particle exhibit unique ionization patterns (MIP) and characteristic energy deposition profiles in detector pixels. For the moment, our simulations do not yet include information about the vertical position (i.e., the height within the scintillator) at which the energy of an event is deposited: the bar is still considered as a unique element, so this option will be explored further in future publications.
- At a higher level (camera and above), it is possible to further analyze the particles rejected by the multiplicity filter in order to find a possible relation between the spatial spread of multiple interactions, energy, and type of particles. In other words, is possible to classify those particles based on the tracks recorded by the detectors. XGIS itself can indeed act as a particle and background monitor, without the need for additional hardware. Therefore, when THESEUS/XGIS is not engaged in its core science activities, it can still collect data to characterize the space environment encountered in orbit, contributing to the refinement of current radiation and background models for LEO.
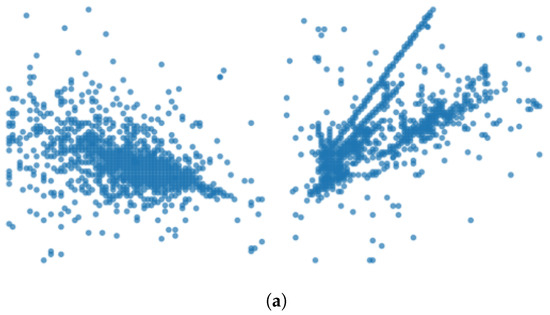
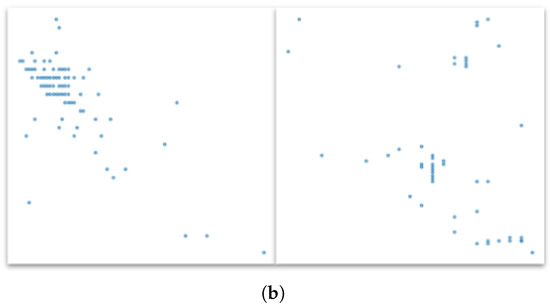
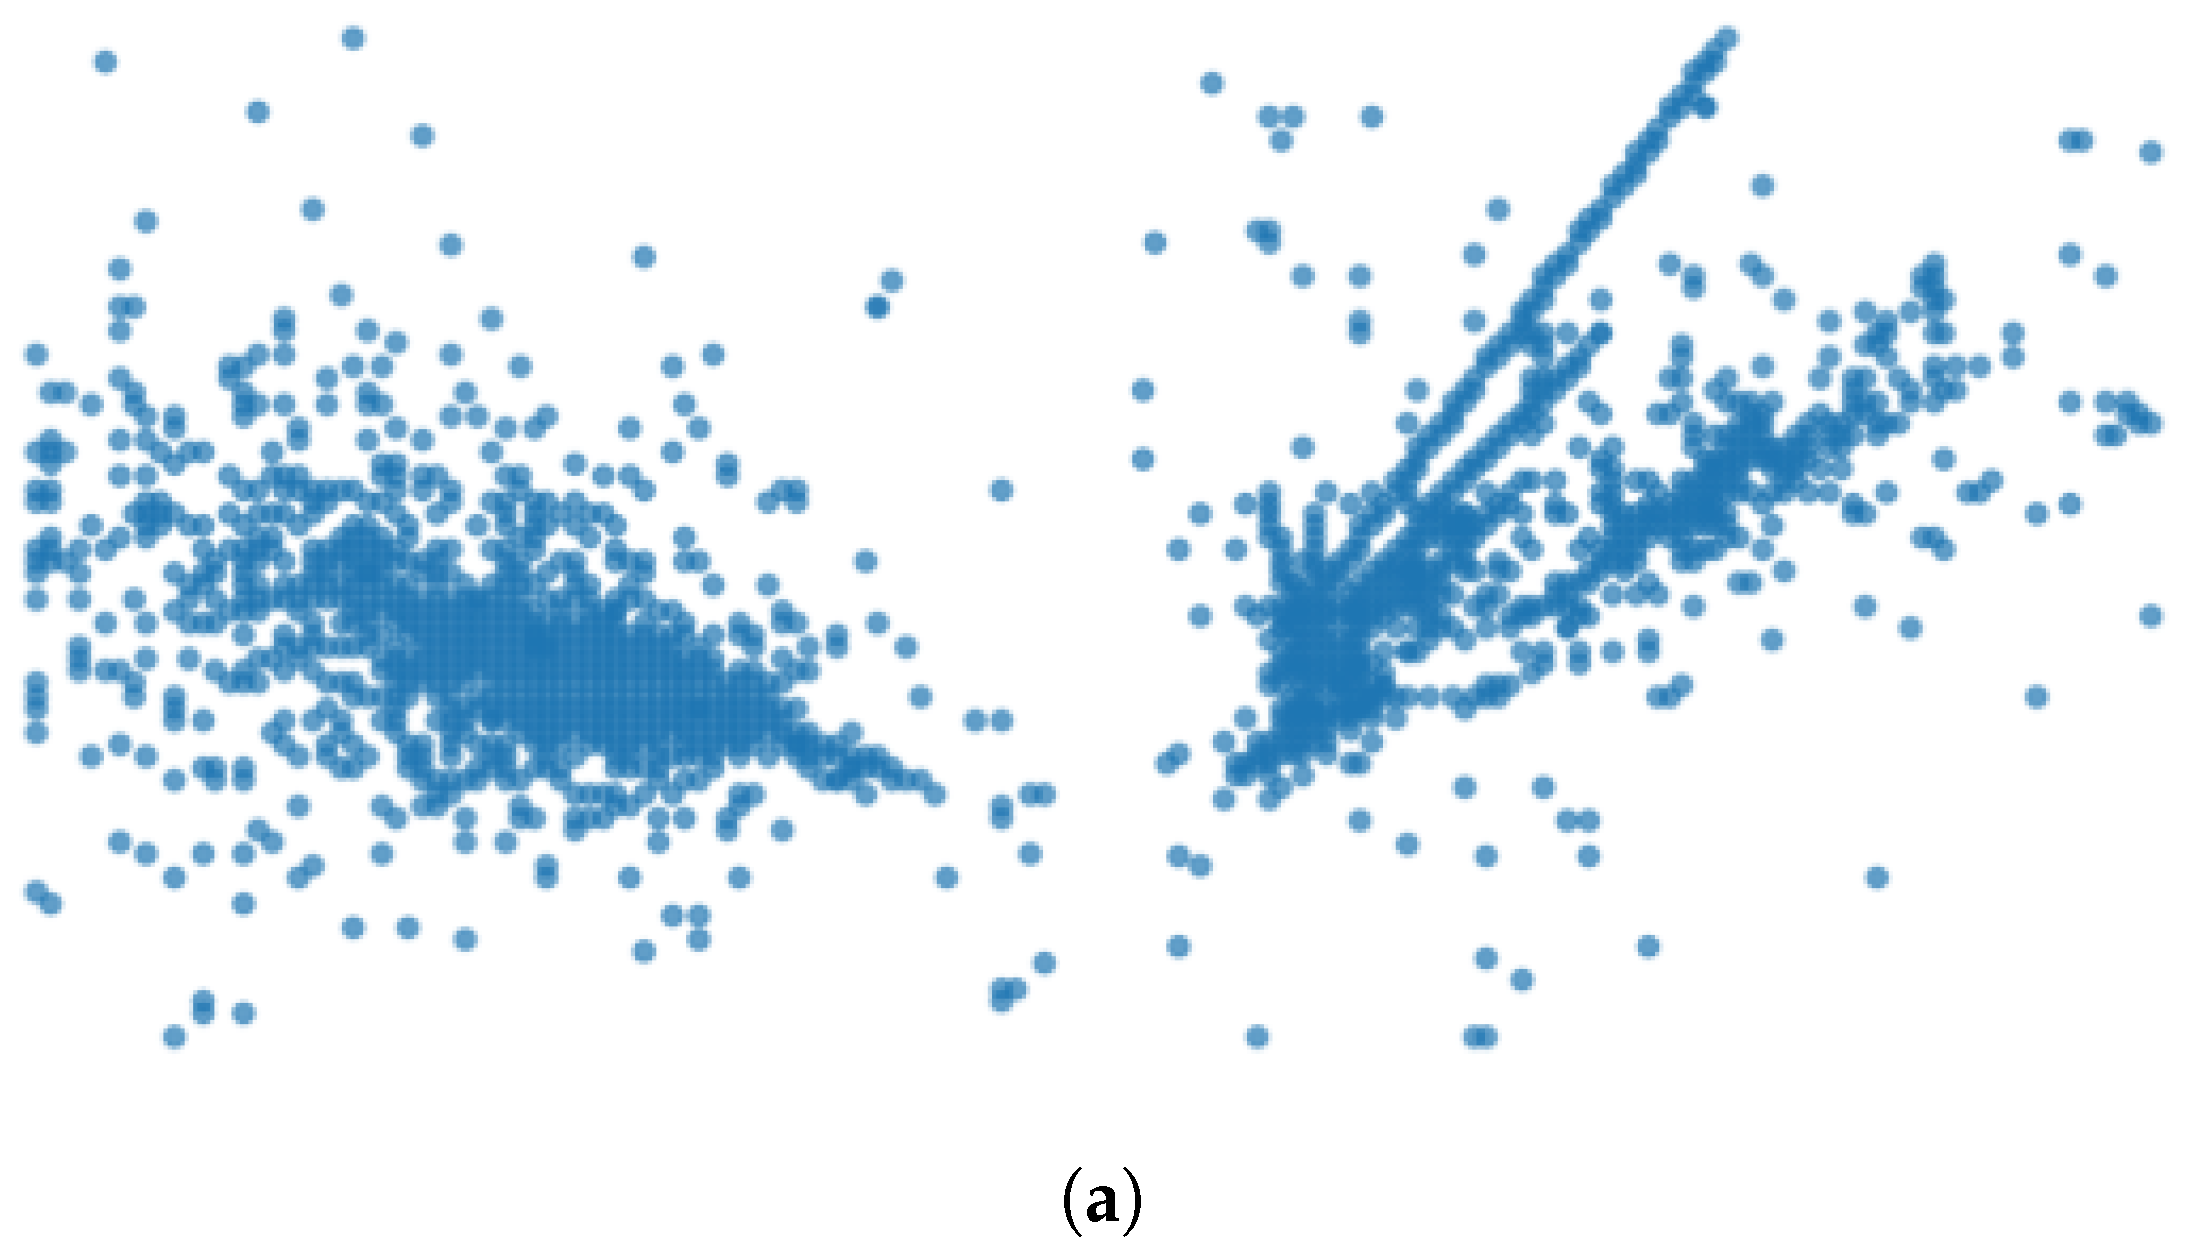
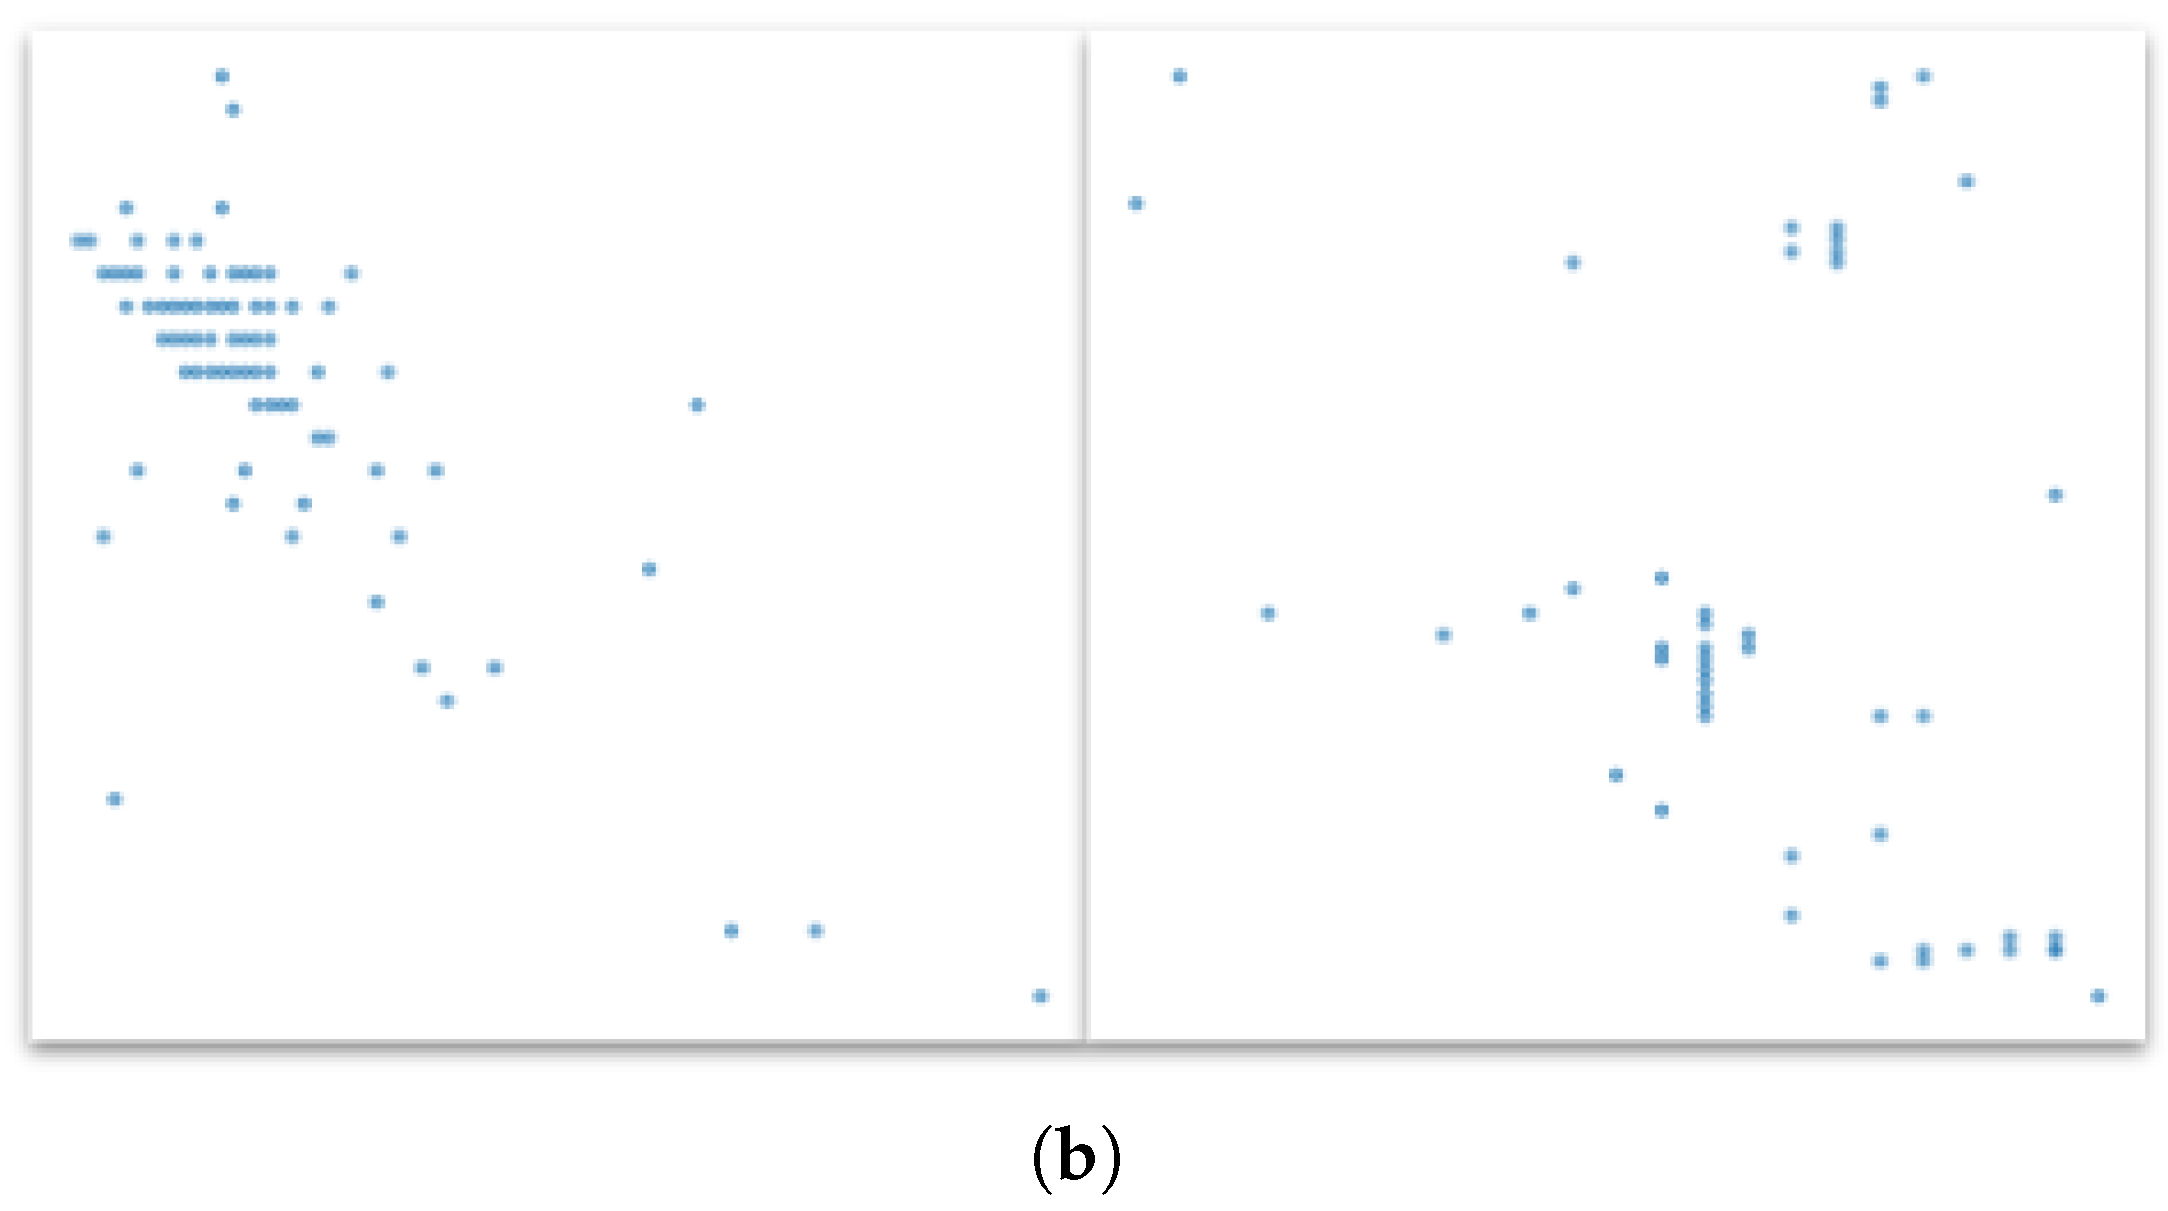
Given the limitations described above for the second filter (which also marginally affects the first filter), we mainly focused in this work on the development and testing of a Neural Network (NN) to assess the feasibility and accuracy of an on-board classification algorithm, especially for patterns that, at first sight, look hard to identify, such as those shown in Figure 5b.
Figure 5.
(a) Typical tracks of electrons (left) and protons (right) with a high multiplicity, as detected by an XGIS camera. Detections are considered simultaneous if they all happen within a 1 µs window. (b) A case in which it is not clear which particles we are dealing with: a classification algorithm is needed.
3.2. Results and Discussion
Current training was carried out starting with three different classes: protons, electrons, and neutrons. Each dataset consisted of 1000 samples taken by our Geant-4 simulations described in Section 2.1 and was split into 70% for training, 20% for validation, and 10% for testing. We opted for a convolutional neural network (CNN) made of three convolutional layers with 32, 64, and 128 filters, respectively, followed by a fully connected layer with 64 neurons and a softmax output layer. The model was trained using the Adam optimizer with categorical cross-entropy as the loss function.
Preliminary results show a validation accuracy of 92.3%, with an F1-score of ∼85%; in particular, the algorithm is able to perform really well in recognizing electrons and protons, while showing some difficulties with neutrons. This was expected, since neutrons display really sparse patterns on the camera, which are difficult to classify even for a CNN.
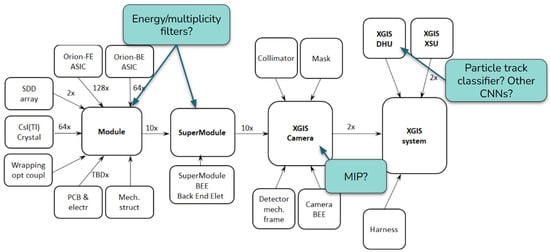
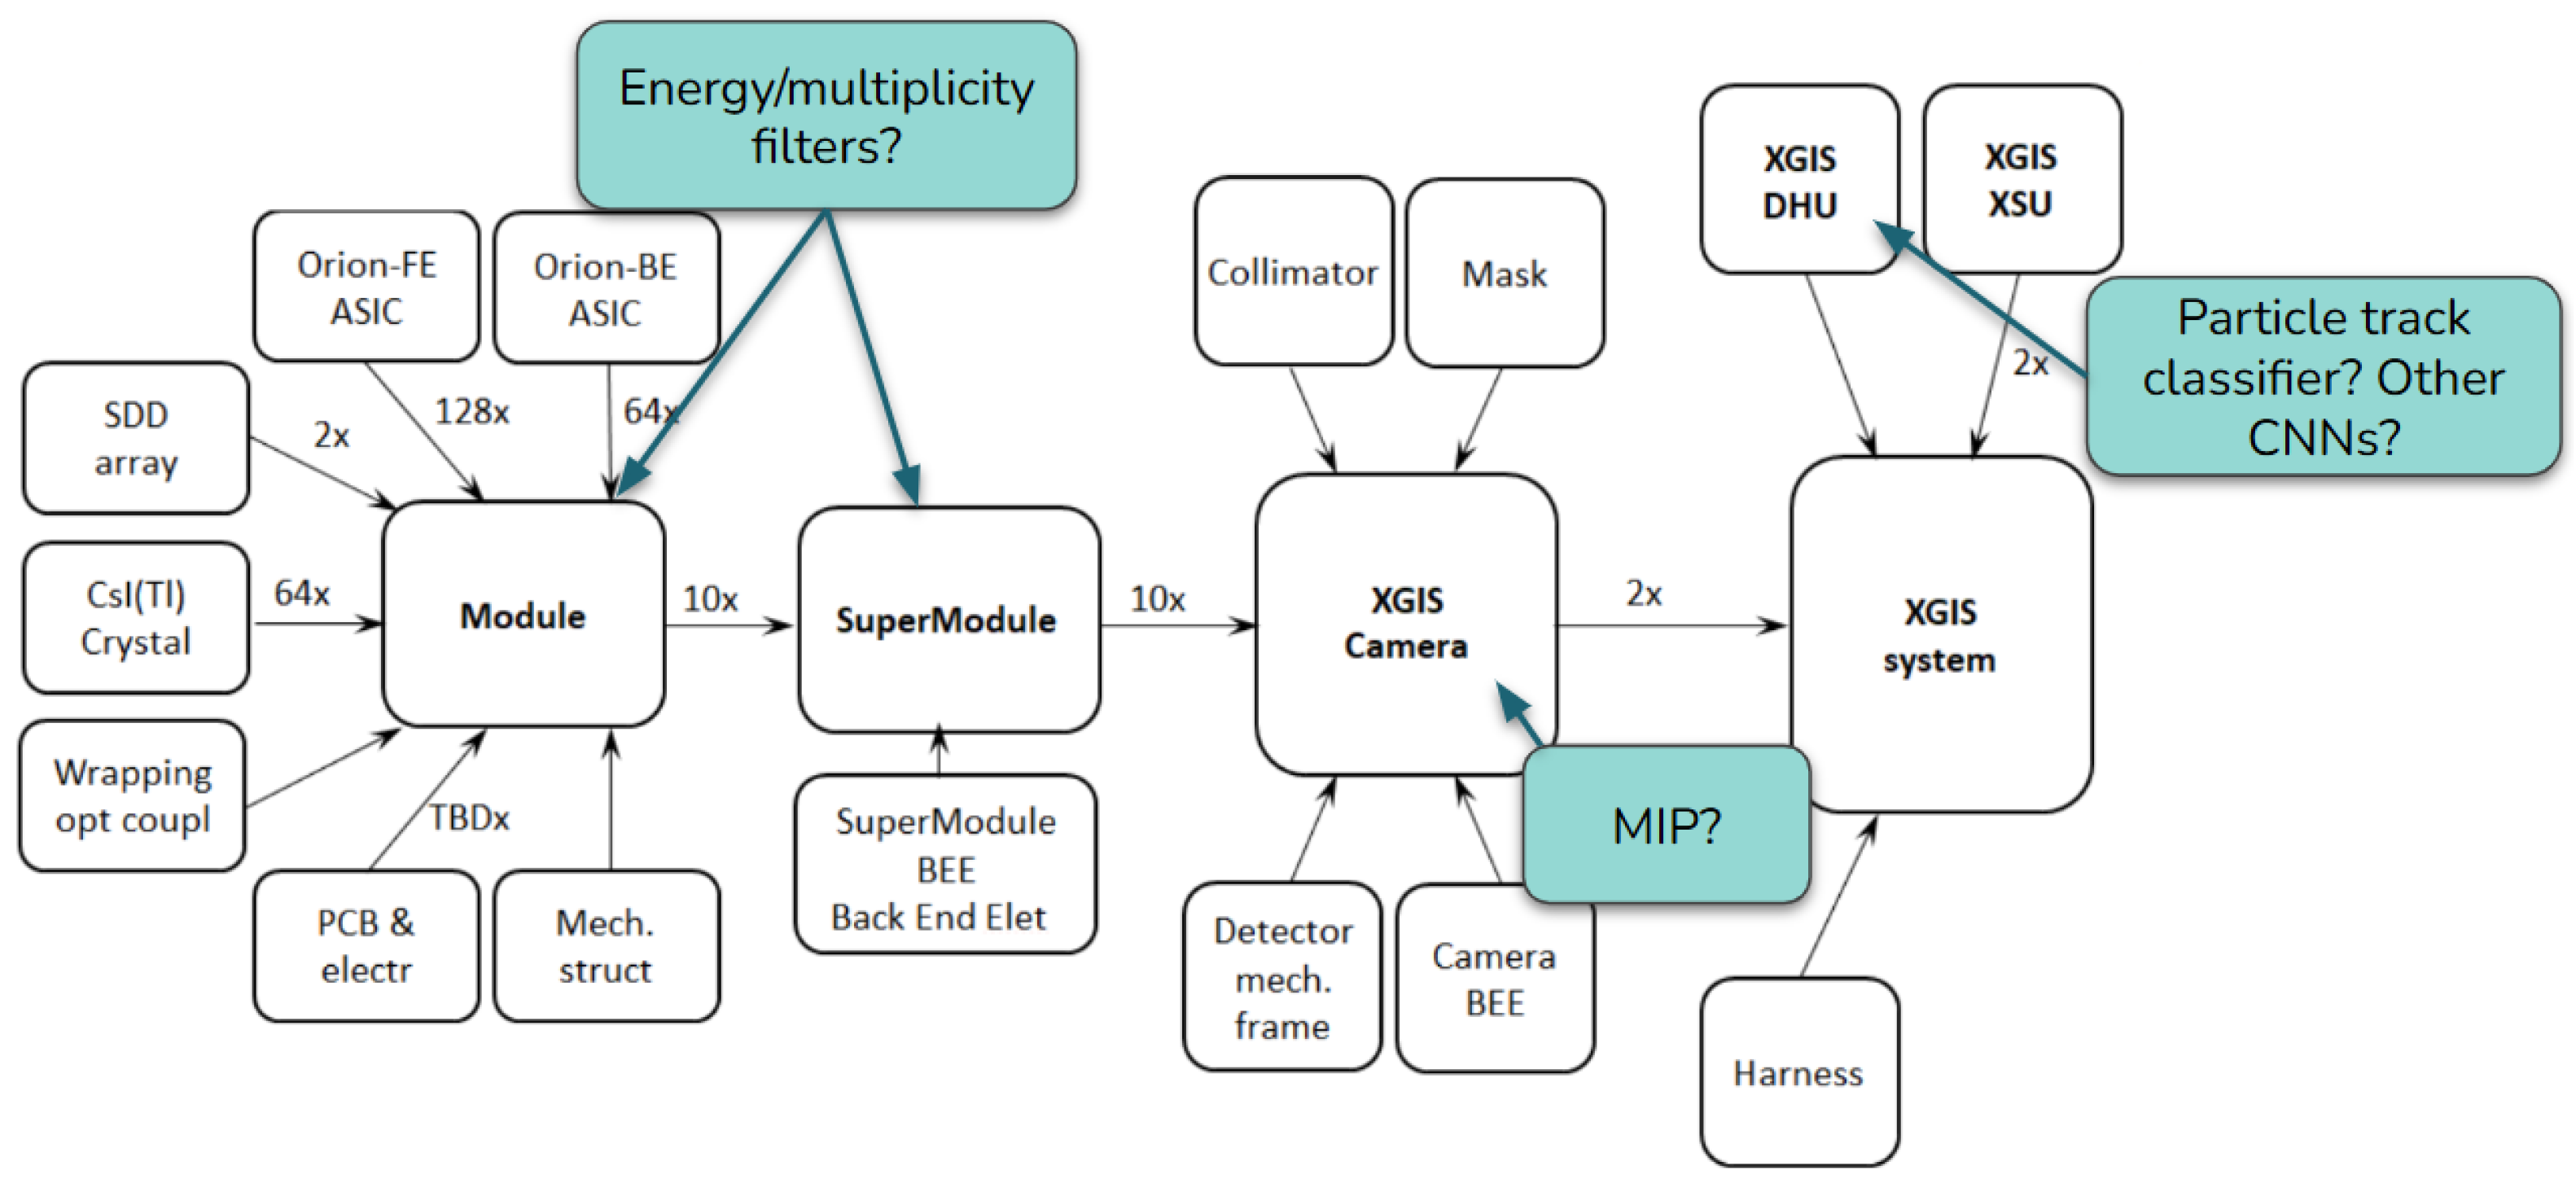
Future work will focus on identifying which filters are most effective and where they could be implemented in the on-board data processing chain. A proposed scenario is shown in Figure 6: an energy/multiplicity filter is easier to implement on lower-level BEEs like those at the module and SM levels; MIP analysis is more complex, so it requires the computational power provided by the camera BEE. For the same reason, a particle track classifier can be handled only by the XGIS DHU (Data Handling Unit). In addition, the feasibility of deploying more computationally intensive algorithms directly on-board will be evaluated. Finally, we plan to investigate CNN architectures trained directly on the pixel matrix, incorporating information on the depth and energy of individual interactions.
Figure 6.
Proposed scenario for the filter implementation [Figure adapted from [3]].
Author Contributions
Methodology, C.L., E.V., R.C., G.L.R., P.N. and G.S.; Software, P.C. and A.P.; Validation, C.L., E.V., R.C., G.M., S.S., E.J.M., E.B., A.S., G.L.R., P.N. and G.S.; Formal analysis, P.C.; Investigation, C.L., E.V., L.A., R.C., G.M., S.S., E.J.M., E.B., A.S., G.L.R., P.N., G.S. and A.P.; Resources, G.L.R., P.N. and G.S.; Data curation, P.C.; Writing—original draft, P.C.; Supervision, C.L., E.V., L.A. and R.C.; Project administration, C.L., E.V., L.A. and R.C.; Funding acquisition, L.A. All authors have read and agreed to the published version of the manuscript.
Funding
This research was supported by ASI-INAF agreement n.2024-17-HH.0.
Data Availability Statement
The raw data supporting the conclusions of this article will be made available by the author on request.
Acknowledgments
The ESA/M7 Phase-A study of THESEUS and the XGIS instrument in Italy was supported by ASI-INAF agreement n.2024-17-HH.0. The authors would like to acknowledge the members of the THESEUS consortium for their continued contributions.
Conflicts of Interest
The authors declare no conflicts of interest.
Notes
| 1 | Currently, interactions inside the bar are assumed to occur at its centre, regardless of the incoming photon energy, in order to simplify the simulations. |
| 2 | An extra byte is needed to discriminate between empty and full pixels. |
| 3 | The minimum distance between hits used to flag an event as a photon is still subject to study. |
| 4 | Minimum Ionizing Particle. |
References
- ESA Website. Available online: https://www.esa.int/Science_Exploration/Space_Science/Final_three_for_ESA_s_next_medium_science_mission (accessed on 2 September 2025).
- THESEUS Mission Website. Available online: https://theseus.astro-ge.ch/ (accessed on 2 September 2025).
- Labanti, C.; Amati, L.; Frontera, F.; Mereghetti, S.; Gasent-Blesa, J.L.; Tenzer, C.; Orleanski, P.; Kuvvetli, I.; Campana, R.; Fuschino, F.; et al. The X/Gamma-ray Imaging Spectrometer (XGIS) on-board THESEUS: Design, main characteristics, and concept of operation. Proc. SPIE 2021, 11444, 395–413. [Google Scholar]
- Campana, R.; Fuschino, F.; Labanti, C.; Mereghetti, S.; Virgilli, E.; Fioretti, V.; Orlandini, M.; Stephen, J.B.; Amati, L. The XGIS instrument on-board THESEUS: Monte Carlo simulations for response, background, and sensitivity. arXiv 2021, arXiv:2102.08699. [Google Scholar] [CrossRef] [Scilit]
- Band, D.L.; Matteson, J.; Ford, L.; Schaefer, B.; Palmer, D.; Teegarden, B.; Cline, T.; Briggs, M.; Paciesas, W.; Pendleton, G.; et al. BATSE Observations of Gamma-Ray Burst Spectra. I. Spectral Diversity. Astrophys. J. 1993, 413, 281–292. [Google Scholar] [CrossRef] [Scilit]

Disclaimer/Publisher’s Note: The statements, opinions and data contained in all publications are solely those of the individual author(s) and contributor(s) and not of MDPI and/or the editor(s). MDPI and/or the editor(s) disclaim responsibility for any injury to people or property resulting from any ideas, methods, instructions or products referred to in the content. |
© 2025 by the authors. Licensee MDPI, Basel, Switzerland. This article is an open access article distributed under the terms and conditions of the Creative Commons Attribution (CC BY) license (https://creativecommons.org/licenses/by/4.0/).