Abstract
Late detection of cracks can lead to serious failures and damages of drilling components, especially drill pipes and drill bits. Currently, the widely used method of repairing rotary drilling systems after a failure is corrective maintenance. Although this strategy has shown its effectiveness in many cases, waiting for a failure to occur and then performing a repair can be an expensive and time-consuming operation. Thus, the use of preventive maintenance under the aspect of periodic inspections can solve this problem and help engineers detect cracks before they reach critical sizes. In this study, modal analysis and finite element analysis (FEA) combined with artificial neural networks (ANN) were used to dynamically estimate the depth and location of a circular arc crack in the drill pipes of rotary drilling systems. To achieve this goal, a detailed analytical approach based on Euler–Bernoulli beam theory was adopted to validate the first four natural frequencies found by FEA for an undamaged pipe. Afterwards, an arc crack was assigned to the pipe already created using Abaqus, and the first four natural frequencies were obtained for each depth and location of the crack. Simulations with FEA led to the generation of a dataset with two inputs—depth and location of cracks—and four outputs: natural frequencies. Moreover, a multilayer perceptron (MLP) was designed and trained by the data collected from simulations. Finally, a comparison between the results obtained by FEA and ANN was performed, where both approaches showed a good agreement in predicting the depth and location of cracks.
1. Introduction
To extract oil and gas from sedimentary rocks [1], a deep hole of thousands of meters must be drilled. To do this, oil companies use rotary drilling technology, a concept based on rotating steel pipes with a rotary table or a top drive [2], also applying sufficient weight on the bit (wob) to overcome the different resistance forces [3,4].
However, the complex loading and the non-linear interactions with the borehole can lead to the appearance of several types of vibrations [5,6]. These vibrations could significantly accelerate the process of fatigue failure of the drilling system [7,8], especially if there are already cracks in the structure of the drill pipes [9]. Moreover, fatigue crack growth is the principal reason for the occurrence of sudden failures in the drilling field. The two main aspects of these failures are twist-off and wash-out [10]. In fact, toolstring failure leads to loss of availability of tools and equipment in the field [11,12], loss of money, an increase in nonproductive time [13], and many other repercussions. For these reasons, avoiding sudden failures is one of the most interesting topics for researchers and engineers. In this context, many studies have been carried out aiming to identify the causes of crack generation and detect the weakest part of drill pipes. Li et al. [14] conducted an analysis of the optimized design to avoid stress concentration. Similarly, Lin et al. in [15] simulated the transition area to define the stress-distribution factors. Contrary to [14], the authors proposed two new types of transition areas that could distributed stress along the drill pipe.
Despite all the efforts that have been made to identify the weakest parts of structures [16,17,18,19] and propose designs that can resist crack propagation, the problem is persistent. Therefore, new perspectives, such as fail-safe and damage-tolerant design [20], have to be introduced. The purpose of these methods is to define the allowable crack size below which the induced damage is not significant and thereafter monitor the range of crack growth by performing periodic inspections. This is a type of preventive maintenance or, more precisely, condition-based maintenance [21]. The principle of this strategy is to detect an eventual failure before its manifestation [22]. Furthermore, periodic inspections can be achieved using a set of methods called nondestructive testing (NDT) or nondestructive inspection (NDI). Regardless of the advantages of these techniques in the field of crack detection and service life prediction, their use faces various obstacles and hurdles, which are slowing down their implementation in the petroleum industry [23]. For that reason and with the development of simulation and numerical modelling software, new approaches, such as finite element analysis and modal analysis, could be elaborated.
Because the natural frequencies of a given structure are defined as eigenvalues [24,25], any change in the parameters of material and geometry will affect the characteristic vibration of the structure [26,27,28,29], in particular when there is a change in mass or stiffness [30,31,32,33,34]. To this end, the development of cracks automatically leads to material discontinuities and, consequently, to changes in the material parameters [35,36,37].
Generally speaking, there have been several methods used to examine the effect induced by the presence of cracks on engineering structures, such as the analytical approach. In this context, Murigendrappa et al. [38] presented an experimental and theoretical approach to study the influence of crack location along a pipe filled with fluid. They used a spring to experimentally analyze free vibrations. By representing the crack with a rotational spring, pipe stiffness was estimated by two methods: displacement and vibration-based methods. The accuracy of both methods was very interesting. Additionally, Marwah and Mohsin [39] developed an analytical approach to evaluate the natural frequencies of a cracked cylindrical shell structure. Equations of motion were derived, and the effect of crack length, depth, and location was analyzed. The obtained results were compared with those reported in the literature, and a good agreement was found.
The natural frequency method with finite element analysis has been of great interest in the last decade because it overcomes the need to prepare numerous test setups and samples; hence, it has simplified the task for researchers conducting different studies for various scenarios. More precisely, Mia et al. [40] performed a simulation with finite element analysis on a cracked cantilever beam. As a result, they reported some observations relating to the natural frequencies of the beam and crack opening size. Lohar and Mohanty [41] investigated the damage undergone by a cracked beam with different crack locations and severities. Simulations were carried out using Ansys, and the results obtained after vibration analysis were used as inputs for a system developed to assess the damage.
Moreover, Prathamesh et al. [42] studied the response of a cracked beam under free vibration; they showed the influence of boundary conditions on natural frequencies. Furthermore, Tufisi et al. [43] analyzed the stress distribution induced by cracks near the fixed end of a cantilever beam; in conclusion, they found that the Finite Element Method (FEM) cannot determine the exact frequency of the beam if the crack is too near the fixed end. In addition, Tamarkar et al. [44] studied the possibility of detecting cracks in rotating shaft systems. Two approaches were taken: an experimental approach and a finite element approach. The natural frequencies of the shaft were estimated for different depth values. In the end, a spectrum set for a healthy and cracked rotating shaft system was established.
Artificial intelligence methods have also earned a reputation in the field of engineering system analysis and assessment and have been widely used in all domains of daily life. As a variety of artificial intelligence technology, artificial neural networks (ANN) have arisen as one of the methods that can be exploited to make a decision and solve many problems in a record time. For this reason, several authors have used this technology to solve various challenges. Combining finite element analysis and artificial neural networks (ANN), Maurya et al. [45] carried out an analysis to investigate the influence of crack location on the first three natural frequencies of a cantilever beam; then, they designed and trained an ANN. The errors in the results obtained by the two methods were not considerable. Moreover, Thatoi et al. [46] conducted a frequency analysis using Ansys software to predict the depth and location of a crack on a cantilever beam. To evaluate the accuracy of the ANN, the authors used and compared three different networks: cascade-forward back propagation (CFBP), feed-forward back propagation (FFBP), and radial basis function (RBF). Haeri et al. [47] evaluated the dependence between failure mechanisms and crack coalescence patterns. In the study, ANNs were used to quantify the impact of crack parameters on the crack type coalescence. The developed model was validated by an experimental method.
In the present study, modal analysis of undamaged and cracked drill pipes was performed on the pipe of a rotary drilling systems. The crack was assumed to be in the form of a circular arc, with a depth not reaching the inner wall of the pipe. An analytical approach was used to validate the first four natural frequencies found by finite element analysis with Abaqus software. The circular arc crack was moved along the drill pipe with a predefined ratio, where for each move, a set of crack depth ratios was assigned. After that, the data obtained by simulation were collected and stored in two main vectors: an input vector and an output vector. This collection was then used to train the designed ANN with the Levenberg–Marquardt algorithm (LMA) as a learning approach. The main contribution of this study can be summed up in three points: to create and simulate a special crack geometry inside a drill pipe, investigate the effect of crack depths and locations on the first four natural frequencies, and finally, design an ANN that can predict crack positions using natural frequencies.
2. Theoretical Approach
Euler–Bernoulli beam theory was used to describe the equation of motion of the drill pipe in the displacement direction, z, as shown in Figure 1. After summation of forces and moments acting on a beam element, Equation (1) can be obtained.
where E is the elasticity modulus; I is the moment of the cross-sectional area; ρ is the density; A is the cross-sectional area; w(x, t) is the displacement at x location; t is the time; and P(x,t) is the external force acting on the pipe.
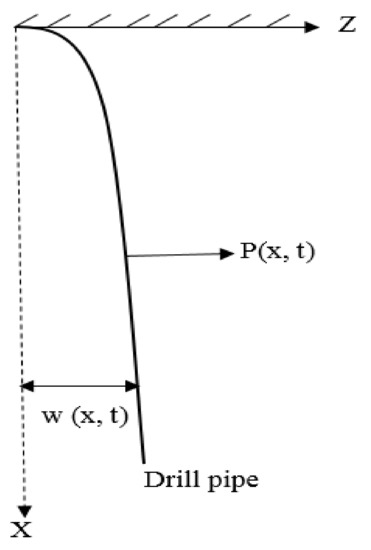
Figure 1.
Vibrational motion.
To deal with free vibrations, P(x,t) is assumed to be equal to zero. Then, Equation (1) becomes
The solution of Equation (2) is possible by taking a separation of variables [48]:
where X = X(x) and Φ = Φ(t).
w(x, t) = XΦ
The solution to Equation (2) is obtained as given by Equation (3).
where α2 = ω ; cosh and sinh are the hyperbolic cosine and sine functions, respectively; and ω is the natural frequency.
X(t) = C1sin αx + C2 cos αx + C3 sinh αx + C4 cosh αx
To obtain the values of the constants involved in Equation (3), boundary conditions were applied. It is assumed that the drill pipe has one end fixed, whereas the other end is free. Therefore, the following equalities were taken into consideration in this study:
Thus, the boundary conditions were expressed as follows
where β = αl.
To solve the above equations in matrix form, the determinant is supposed to be equal to zero.
The equation yields to
cosβ × coshβ = −1
Equation (4) accepts n roots. Because in the present study, the aim was to find the first four natural frequencies, only the first four roots were selected. The obtained natural frequencies are shown in Table 1.

Table 1.
The obtained four natural frequencies for the drill pipe.
3. Finite Element Analysis
In this section, Abaqus was used to perform the simulation and analysis of the natural frequencies of the drill pipe. For this, a 3D element in the form of a hollow tube was created, as shown in Figure 2. To make the simulation faster, the pipe length was limited to 3 m instead of 9 m (the nominal length). The drill pipe was made of steel-E75. After the material was assigned to the chosen section, imposed displacement was applied to one end of the pipe. Then, a frequency analysis with eight modes was conducted. The pipe meshing led to the generation of 30,285 elements with 60,128 nodes. Once the dynamic analysis was conducted, the following results were obtained (Figure 3, Figure 4, Figure 5 and Figure 6), where the first natural frequency was 6.0698 Hz, the second natural frequency was 37.922 Hz, the third natural frequency was 105.66 Hz, and the fourth natural frequency was 205.6 Hz.
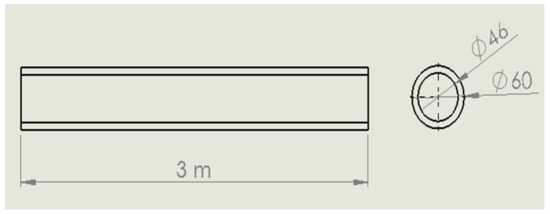
Figure 2.
Pipe dimensions used in the FEM simulation and analysis.
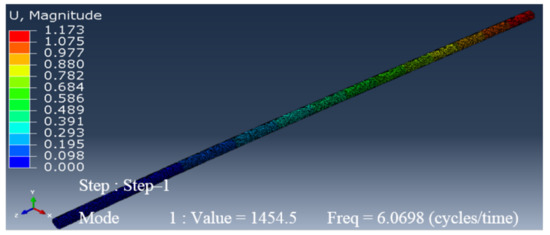
Figure 3.
First natural frequency of an undamaged pipe.
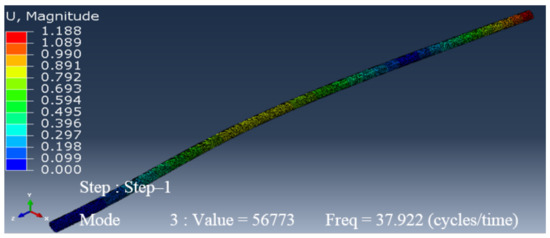
Figure 4.
Second natural frequency of an undamaged pipe.
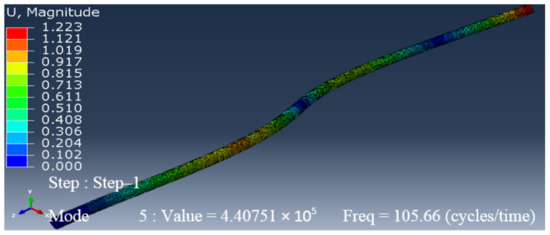
Figure 5.
Third natural frequency of an undamaged pipe.
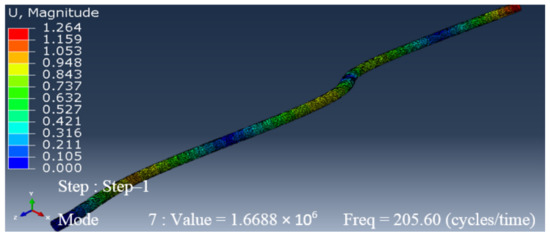
Figure 6.
Fourth natural frequency of an undamaged pipe.
Figure 7 illustrates a visual comparison between the corresponding natural frequencies for the first four modes determined by the theoretical approach and FEA. As shown in Figure 7, the results obtained by both methods are very close, which means that FEA is an effective alternative to the analytical approach for the first four frequencies. Therefore, to study the response of a cracked pipe and obtain its natural frequencies, FEA was adopted.
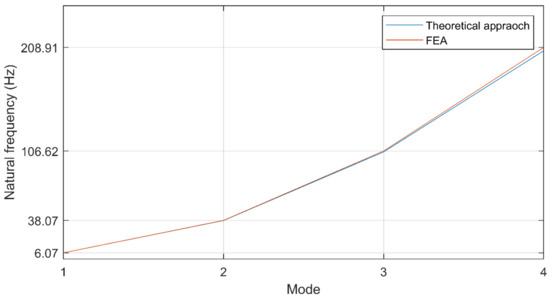
Figure 7.
Comparison between FEA and theoretical approach for natural frequency extraction.
4. Crack Attribution
Based on drilling field observations, the crack or defect was assumed to have a circular arc form with a depth, d, a fixed width of 10 mm, and an angle of 45°, as shown in Figure 8. It was also assumed that the axis of the crack and that of the pipe were coincident and that the outer diameter of the crack and that of the pipe were the same. Therefore, manipulation of the crack depth was performed by adjusting the inner diameter of the crack.
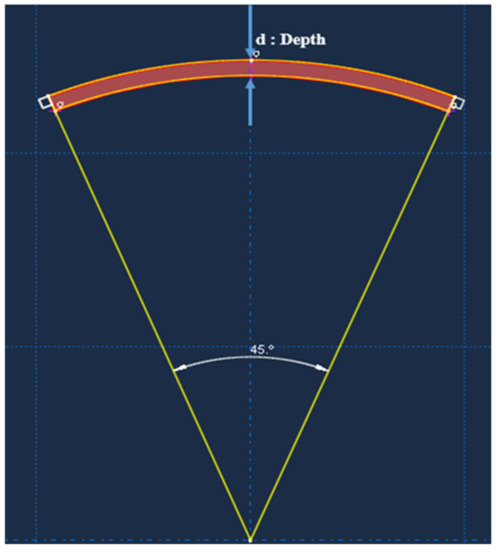
Figure 8.
Assumed crack geometry for the simulation scenarios.
In the following procedure, the crack was moved along the drill pipe with a specified location and depth, as demonstrated in Figure 9, setting the two variables as:
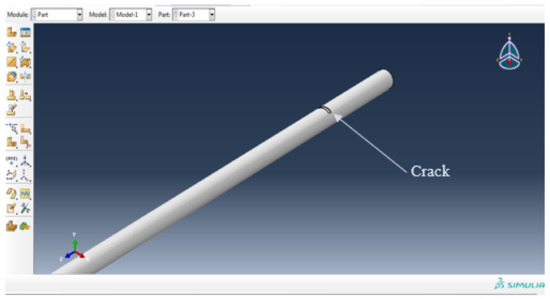
Figure 9.
Crack location along the drill pipe.
Relative depth: dr = crack depth/thickness of the pipe; dr varied from 0.1 to 0.9 with an increment of 0.1.
Relative location: lr = distance of the crack from the fixed end/length of the pipe; lr varied from 0.1 to 0.9 with an increment of 0.1.
The first four natural frequencies of the pipe were estimated for each combination of dr and lr. During the simulation, the element shape of the mesh was changed to a tetrahedral element to take into account the crack location and depth.
Effects of Cracks on Natural Frequencies
The surfaces shown in Figure 10 were created based the simulation of crack depths and locations for different values along the drill pipe. The surfaces represent the natural frequencies of the drill pipe in the function of crack depth and location. As can be seen, the crack effect is not the same for all vibration modes. Curves swept by varying the crack depths and locations are distinct and present characteristic waves for each mode. There is also an indirect link between crack position (depth and location) and natural frequencies. For this purpose and in the next section, an effective approach was used to investigate the vibratory behavior of drill pipes in the presence of cracks.
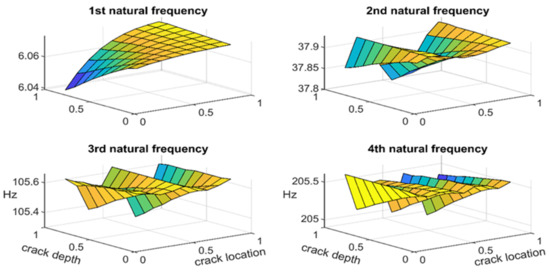
Figure 10.
Natural frequency variations in function of crack depth and location.
5. Artificial Neural Network
Artificial intelligence or, more precisely, artificial neural networks are one of the newest technologies that have been integrated into applications to solve various industrial problems [49,50]. The idea of developing an artificial neural network is derived by comparing and mimicking the structure and function of human brain neurons. In fact, biological neural networks include three parts: the cell body, dendrites, and the axon. Based on this architecture, information is transmitted in the form of a signal from local neurons to the other neurons. On the other hand, artificial neural networks are formed by a set of artificial neurons, which use weights as connections between them. Each artificial neuron contains an input, an output, an activation function, and a weight. The task of supervised learning is achieved by comparing received data (input) to target data (output) after each computation; the weights between neurons are adjusted based on the errors of previous iterations [51]. There are several ANN architectures used for different applications, the most widely used being multilayer perceptron (MLP), which consists of three layers: an input layer, several hidden layers, and an output layer. A simple representation of an MLP is shown in Figure 11.
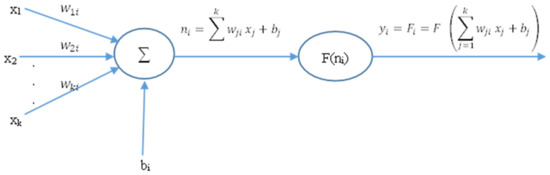
Figure 11.
Schematic of a simple MLP structure.
Where xi is the input vector, wji is the weight matrix, bi is the bias vector, and F is the activation function. In this research, two activation functions were considered: one for the hidden layers and one for the output layers. The activation function used in the ANN model consists of a basic hyperbolic tangent function multiplied by . It transforms the input data into output data according to Equation (5). The given output varies between −1 and 1.
5.1. Data Splitting for ANN Training
Data splitting is based on three procedures, as presented in [52]: (i) normalization, (ii) randomization, and (iii) separation. The normalization process was only applied to the target data, whereas the input data were taken as-is. Data randomization aimed to randomly classify the data without any pre-selection. The separation step consisted of using 80% of the data for training and the remaining 20% as test data.
ANN training is an iterative process that attempts to make the gap between the ANN outputs and the target data as small as possible based on a fixed threshold error. Once the training process was achieved, the test data were introduced into the ANN model, and the accuracy of the model was then examined.
5.2. Input and Output Data
The input and target data used to train the ANN are illustrated in Figure 12 and Figure 13, respectively. They represent 100% of the data obtained from FEA simulations. The ANN model was constructed with four inputs: first natural frequency of the cracked pipe (f1), second natural frequency (f2), third natural frequency (f3), and fourth natural frequency (f4). Moreover, the relative depth and location of the crack were taken as model outputs. All four frequency datasets, as well as the targeted outputs, were obtained from simulation with FEA.
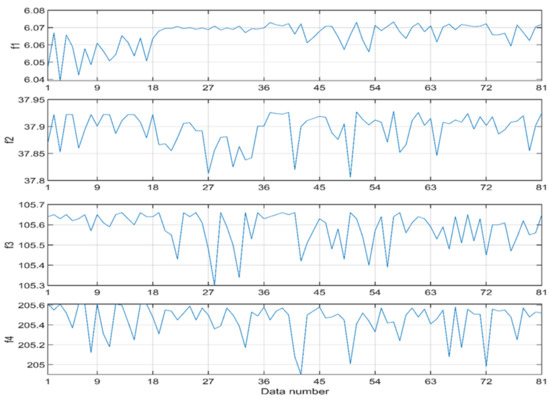
Figure 12.
ANN input data for the four frequencies, f1, f2, f3, and f4.
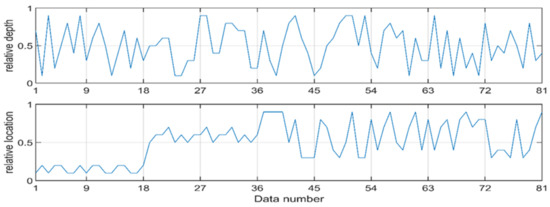
Figure 13.
ANN target data.
5.3. ANN Architecture
To obtain the optimal ANN architecture, the procedures suggested in [52] were used to find the most appropriate structure of ANN for this study. These procedures consist in varying the number of hidden layers to obtain the highest value of R2, given by Equation (6).
where R2 is the coefficient of determination, is the residual sum of squares, and is the total sum of squares.
Table 2 shows the variation of R2 as a function of the ANN architecture. Based on these results, the highest value of R2 is obtained for the architecture (04–11–02), as shown in Figure 14. The training parameters for this architecture are maximum error goal = 10−7 and maximum gradient = 10−7, whereas the learning rate is fixed at 10−4. More precisely, Matlab neural network toolbox was used to create and train the ANN with the Levenberg–Marquardt algorithm (LMA).
Table 2.
Results of optimal ANN architecture.
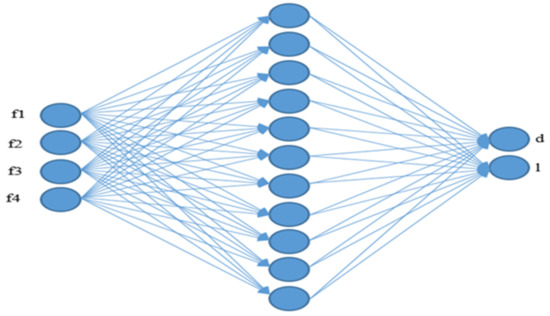
Figure 14.
Diagram of the obtained optimal ANN architecture.
5.4. ANN Validation
The best way to check the accuracy of an ANN is to estimate the errors between the ANN outputs and the target data. For this purpose, the mean square error (MSE) is plotted as a function of the number of epochs. As can be noted from Figure 15, the best validation is MSE = 0.0004657.
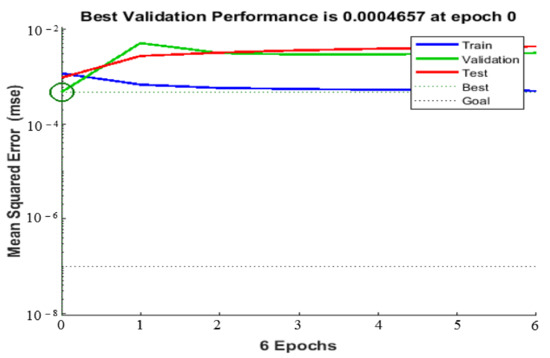
Figure 15.
ANN best validation.
From Figure 16, it can be observed that the fit lines (colored lines in blue, green, red, and black) are identical to the dashed lines for all subplots. This means that the ANN model is well trained and can therefore be used to predict the depth and location of cracks.
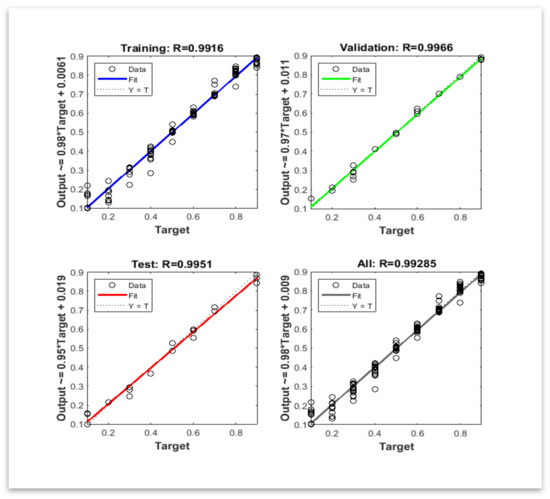
Figure 16.
ANN performances during the training based on target data.
5.5. ANN Testing
The ANN testing step aimed to expose 20% of the data set excluded from the training process to the trained ANN model. This phase is crucial for verifying the accuracy and performance of the obtained ANN model. The testing process consists of introducing four input vectors (f1,f2,f3,f4) and then using the trained ANN to estimate the outputs. Once the outputs were estimated, a comparison with real data was conducted.
The graphs shown in Figure 17 were obtained by testing the ANN model. The predicted depth and location are very close to the test data, which signifies that the ANN model is well trained; therefore, the model can be used as an alternative approach to predict the depth and location of cracks for the pipes of rotary drilling systems.
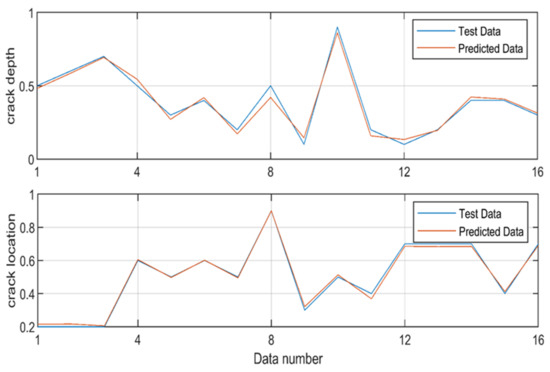
Figure 17.
ANN testing and prediction results for both crack depths and locations.
6. Discussion
Based on Figure 10, it can be seen that the presence of a crack in the drill pipe leads to the appearance of particular forms of natural frequencies varying according to crack depth and location. The effect of crack depth depends on its value. For a value lower than 0.5, the crack depth has no significant effect on the values of four natural frequencies. However, if the value is greater than 0.5, a considerable decrease in the values of the natural frequencies is observed.
Compared to crack depth, the effect of crack location depends on the vibration mode. For the first mode, a wave is shown on the surface for which the natural frequencies increase continuously. Similarly, the second mode presents two waves on the surface with two peaks at locations 0.25 and 1 and one valley at 0.5; for this, the values of natural frequencies decrease from the peak to the valley and vice versa. For the third mode, three waves are shown on the surface, with three peaks and two valleys. Natural frequencies decrease from the peak to the valley and vice versa. The same finding can be obtained for the fourth mode. Therefore, it can be concluded that variation of the crack with respect to depth and location leads to the generation of curves in which wave number is equal to the corresponding vibration mode.
Despite the growth of cracks, natural frequencies of the drill pipe do not vary in the same way for all the modes. Natural frequencies increase and decrease occasionally with increasing crack depths and locations; in other words, it is very difficult to relate the increase in natural frequencies to the increase in crack geometry. In this context, the only explanation that can be given is derived from the theoretical expression of the natural frequency. Because the stiffness and effective mass are the two parameters that are affected by the presence of cracks, any modification in one of them results in an increase or decrease in the natural frequency.
For the above reasons, an ANN was developed and designed to model the different relations between crack depth and position on one hand and between the stiffness and effective mass on the other hand. As can be seen in Figure 17, the developed model successfully predicted crack depths and locations for the given coordinates with high accuracy. Consequently, these results have proven the convenience of localizing cracks inside the drill pipe using an appropriate ANN model with natural frequencies as inputs.
7. Conclusions
In this paper, a useful approach was proposed to estimate crack depth and location in pipes of rotary drilling systems. The presence of cracks in any structure can lead to changes in certain vibratory characteristics. Conventional methods, such as NDT and NDI, are the widely used techniques in the field of crack detection in engineering structures. However, in some cases, NDT and NDI cannot predict the exact location of cracks, and as a result, the latter can grow and reach a critical level for which failure is unavoidable. To anticipate failure, new approaches that permit the prediction of cracks in the allowed time must be developed. In this study, one such efficient method was introduced, based on combining FEA with an ANN. The theoretical approach was used to show that FEA can estimate the first natural frequencies with good accuracy, but beyond these four frequencies, errors are found. Cracks affect the vibrational characteristics of the drill pipe, and their effect depends on their depth and position. Varied crack depths and positions create particular forms of natural frequencies that depend on the corresponding vibration mode.
To ensure the best combination performance, natural frequencies were chosen as control parameters to localize the cracks. The necessary data were collected by FEA simulations. Therefore, a structure in the form of a pipe was created and simulated. The crack had the form of a circular arc moving along the pipe. For each move, a set of depths were assigned. For every depth and location, the first four natural frequencies were calculated. FEA results show that the natural frequencies for all modes depend on the crack volume. This may be explained by analyzing the relationship between the element stiffness and effective mass. The developed ANN architecture successfully modelled the relationships between the pipe stiffness, mass, crack volume, and the corresponding natural frequencies. In addition, this learning process was expressed by the best prediction of all target data. To confirm the effective training of the ANN, a set of 16 datapoints was used to validate the model.
In this work, we demonstrated that the proposed ANN can predict crack depths and locations with high performance. The technical aspect of the research consists of collecting the natural frequencies of drill pipes by a set of methods such as hammer impact tests and then modifying and updating the developed ANN model. In this way, experts in the field of crack detection can effectively localize cracks inside drill pipes. Therefore, it is highly recommended to consider the developed model for predictive maintenance of pipes subjected to vibrations in rotary drilling systems.
Author Contributions
Methodology, I.K. and S.B.; software, I.K. and M.Z.D.; validation, S.B. and K.F.T.; analysis, I.K.; investigation, M.Z.D. and S.B.; resources, I.K. and K.F.T.; data curation, I.K. and S.B.; writing—original draft preparation, I.K. and M.Z.D.; writing—review and editing, S.B. and K.F.T.; visualization, I.K. and M.Z.D.; supervision, S.B. and M.Z.D.; project administration, K.F.T. and S.B. All authors have read and agreed to the published version of the manuscript.
Funding
This research received no external funding.
Institutional Review Board Statement
Not applicable.
Informed Consent Statement
Not applicable.
Acknowledgments
There are no acknowledgments for this paper.
Conflicts of Interest
The authors declare no conflict of interest.
Nomenclature
| Variable/Parameter | Variable/Parameter name | Value/Dimension |
| E | Elasticity modulus | 200 GPa |
| I | Moment of the cross-sectional area | 4.15 × 10⁻⁷ m4 |
| ρ | density | 7500 kg/m3 |
| A | Cross-sectional area | 1.16 × 10⁻³ m2 |
| w(x,t) | Displacement at x location | m |
| t | Time | sec |
| P | External force | N |
| l | Length | 3 m |
| ω | Natural frequency | Hz |
| OD | Outer diameter | 0.06 m |
| ID | Inner diameter | 0.046 m |
| dr | Relative crack depth | - |
| lr | Relative crack location | - |
| xi | Input vector | - |
| Wji | Weight matrix | - |
| bi | Bias vector | - |
| F | Activation function | - |
| R2 | Coefficient of determination | - |
| Residual sum of squares | - | |
| Total sum of squares | - |
References
- Ma, T.; Chen, P.; Zhao, J. Overview on vertical and directional drilling technologies for the exploration and exploitation of deep petroleum resources. Geomech. Geophys. Geo-Energy Geo-Resour. 2016, 2, 365–395. [Google Scholar] [CrossRef] [Green Version]
- Mendil, C.; Kidouche, M.; Doghmane, M.Z. A Study of the Parametric Variations Influences on Stick-Slip Vibrations in Smart Rotary Drilling Systems. In Artificial Intelligence and Renewables Towards an Energy Transition; Lecture Notes in Networks and Systems; Hatti, M., Ed.; Springer: Cham, Switzerland, 2021; Volume 174, pp. 707–715. [Google Scholar]
- Ghasemloonia, A.; Rideout, G.; Butt, S. The effect of weight on bit on the contact behavior of drillstring and wellbore. In Proceedings of the 2010 Spring Simulation Multiconference, Orlando, FL, USA, 11–15 April 2010; pp. 1–7. [Google Scholar]
- Doghmane, M.Z.; Bacetti, A.; Kidouche, M. Stick-Slip Vibrations Control Strategy Design for Smart Rotary Drilling Systems. In Artificial Intelligence and Renewables Towards an Energy Transition; Lecture Notes in Networks and Systems; Hatti, M., Ed.; Springer: Cham, Switzerland, 2021; Volume 174, pp. 197–209. [Google Scholar]
- Mendil, C.; Kidouche, M.; Doghmane, M.Z. Modeling of Hydrocarbons Rotary Drilling Systems under Torsional Vibrations: A Survey. In Artificial Intelligence and Renewables Towards an Energy Transition; Lecture Notes in Networks and Systems; Hatti, M., Ed.; Springer: Cham, Switzerland, 2021; Volume 174, pp. 243–251. [Google Scholar]
- Doghmane, M.Z.; Kidouche, M.; Ahriche, A. Decentralized Overlapping Control Design with Application to Rotary Drilling System. IETE J. Res. 2021, 1–10. [Google Scholar] [CrossRef]
- Zamani, S.M.; Hassanzadeh-Tabrizi, S.A.; Sharifi, H. Failure analysis of drill pipe: A review. Eng. Fail. Anal. 2016, 59, 605–623. [Google Scholar] [CrossRef]
- Kessai, I.; Benammar, S.; Doghmane, M. Dynamic failure analysis and lifetime estimation of Tool-string in rotary drilling system under Torsional-Axial coupled vibrations. Eng. Fail. Anal. 2022, 134, 106037. [Google Scholar] [CrossRef]
- Rahman, M.K.; Hossain, M.M.; Rahman, S.S. Survival assessment of die-marked drill pipes: Integrated static and fatigue analysis. Eng. Fail. Anal. 1999, 6, 277–299. [Google Scholar] [CrossRef]
- Macdonald, K.; Bjune, J. Failure analysis of drillstrings. Eng. Fail. Anal. 2007, 14, 1641–1666. [Google Scholar] [CrossRef]
- Albdiry, M.T.; Almensory, M.F. Failure analysis of drillstring in petroleum industry: A review. Eng. Fail. Anal. 2016, 65, 74–85. [Google Scholar] [CrossRef]
- Kessai, I.; Benammar, S.; Doghmane, M.Z.; Tee, K.F. Drill Bit Deformations in Rotary Drilling Systems under Large-Amplitude Stick-Slip Vibrations. Appl. Sci. 2020, 10, 6523. [Google Scholar] [CrossRef]
- Skalle, P.; Aamodt, A.; Swahn, I. Detection of Failures and Interpretation of Causes during Drilling Operations. In Proceedings of the Abu Dhabi International Petroleum Exhibition & Conference, Abu Dhabi, United Arab Emirates, 7–10 November 2016. [Google Scholar] [CrossRef]
- Yonggang, L.; Fangpo, L.; Xin, X.; Biyu, Y.; Caihong, L. Simulation Technology in Failure Analysis of Drill Pipe. Procedia Eng. 2011, 12, 236–241. [Google Scholar] [CrossRef] [Green Version]
- Lin, Y.; Qi, X.; Zhu, D.; Zeng, D.; Zhu, H.; Deng, K.; Shi, T. Failure analysis and appropriate design of drill pipe upset transition area. Eng. Fail. Anal. 2013, 31, 255–267. [Google Scholar] [CrossRef]
- Benammar, S.; Khellaf, A.; Mohammedi, K. Solar Tower Power Plants Performance and Reliability Analysis; Solar Power; Bailey, S., Ed.; Nova Science Publishers, Inc.: Hauppauge, NY, USA, 2014. [Google Scholar]
- Benammar, S.; Khellaf, A.; Mohammedi, K. Solar Tower Power Plant Reliability Analysis using FORM method. In Proceedings of the 3ème Conférence Internationale de Mécanique (ICM’2017), Annaba, Algeria, 26–27 April 2017; pp. 26–27. [Google Scholar]
- Benammar, S.; Tee, K.F. Structural reliability analysis of a heliostat under wind load for concentrating solar power. Sol. Energy 2019, 181, 43–52. [Google Scholar] [CrossRef]
- Benammar, S.; Tee, K.F. Failure probability analysis of heliostat systems. Int. J. Crit. Infrastruct. 2020, 16, 342–366. [Google Scholar] [CrossRef]
- Ellyin, F. Fatigue Damage, Crack Growth and Life Prediction; Springer Science & Business Media: Berlin, Germany, 1996. [Google Scholar]
- Ellis, B.A.; Byron, A. Condition based maintenance. Jethro Proj. 2008, 10, 1–5. [Google Scholar]
- Venkatasubramanian, V.; Rengaswamy, R.; Kavuri, S.N. A review of process fault detection and diagnosis: Part II: Qualitative models and search strategies. Comput. Chem. Eng. 2003, 27, 313–326. [Google Scholar] [CrossRef]
- Cawley, P. Non-destructive testing—Current capabilities and future directions. Proc. Inst. Mech. Eng. Part L J. Mater. Des. Appl. 2001, 215, 213–223. [Google Scholar]
- Loya, J.; Aranda-Ruiz, J.; Zaera, R. Natural frequencies of vibration in cracked Timoshenko beams within an elastic medium. Theor. Appl. Fract. Mech. 2022, 118, 103257. [Google Scholar] [CrossRef]
- Tee, K.F. Substructural Identification with Incomplete Measurement for Structural Damage Assessment. Ph.D. Thesis, National University of Singapore, Singapore, 2004. [Google Scholar]
- Poojary, J.; Roy, S.K. In Plane Radial Vibration of Uncracked and Cracked Circular Curved Beams Subjected to Moving Loads. Int. J. Struct. Stab. Dyn. 2021, 21, 2150146. [Google Scholar] [CrossRef]
- Zarabimanesh, Y.; Roodgar Saffari, P.; Roudgar Saffari, P.; Refahati, N. Hygro-thermo-mechanical vibration of two vertically aligned single-walled boron nitride nanotubes conveying fluid. J. Vib. Control 2021, 10775463211006512. [Google Scholar] [CrossRef]
- Wang, T.; Zhang, L.; Tee, K.F. Extraction of real modes and physical matrices from modal testing. Earthq. Eng. Eng. Vib. 2011, 10, 219–227. [Google Scholar] [CrossRef]
- Chen, H.-P.; Tee, K.F.; Ni, Y.-Q. Mode shape expansion with consideration of analytical modelling errors and modal measurement uncertainty. Smart Struct. Syst. 2012, 10, 485–499. [Google Scholar] [CrossRef]
- Thongchom, C.; Jearsiripongkul, T.; Refahati, N.; Saffari, P.R.; Saffari, P.R.; Sirimontree, S.; Keawsawasvong, S. Sound Transmission Loss of a Honeycomb Sandwich Cylindrical Shell with Functionally Graded Porous Layers. Buildings 2022, 12, 151. [Google Scholar] [CrossRef]
- Arefi, M.; Karroubi, R.; Irani-Rahaghi, M. Free vibration analysis of functionally graded laminated sandwich cylindrical shells integrated with piezoelectric layer. Appl. Math. Mech. 2016, 37, 821–834. [Google Scholar] [CrossRef]
- Wang, X.; Li, S. Free vibration analysis of functionally graded material beams based on Levinson beam theory. Appl. Math. Mech. 2016, 37, 861–878. [Google Scholar] [CrossRef]
- Koh, C.G.; Tee, K.F.; Quek, S.T. Condensed Model Identification and Recovery for Structural Damage Assessment. J. Struct. Eng. 2006, 132, 2018–2026. [Google Scholar] [CrossRef]
- Koh, C.G.; Quek, S.T.; Tee, K.F. Damage Identification of Structural Dynamic System. In Proceedings of the 2nd International Conference on Structural Stability and Dynamics, Singapore, 16–18 December 2002; pp. 780–785. [Google Scholar]
- Tamrakar, R.; Mittal, N.D. Crack detection in an overhung rotor system using external harmonic excitation. In Advances in Rotor Dynamics, Control, and Structural Health Monitoring; Springer: Singapore, 2020; pp. 159–169. [Google Scholar]
- Tee, K.F. Time Series Analysis for Vibration-based Structural Health Monitoring: A Review. Struct. Durab. Health Monit. 2018, 12, 129–147. [Google Scholar]
- Haidarpour, A.; Tee, K.F. Finite Element Model Updating for Structural Health Monitoring. Struct. Durab. Health Monit. 2020, 14, 1–17. [Google Scholar] [CrossRef]
- Murigendrappa, S.; Maiti, S.; Srirangarajan, H. Experimental and theoretical study on crack detection in pipes filled with fluid. J. Sound Vib. 2004, 270, 1013–1032. [Google Scholar] [CrossRef]
- Husain, M.A.; Al-Shammari, M.A. Analytical Solution of Free Vibration Characteristics of Partially Circumferential Cracked Cylindrical Shell. J. Mech. Eng. Res. Dev. 2020, 43, 442–454. [Google Scholar]
- Mia, M.S.; Islam, M.S.; Ghosh, U. Modal analysis of cracked cantilever beam by finite element simulation. Procedia Eng. 2017, 194, 509–516. [Google Scholar] [CrossRef]
- Lohar, S.; Mohanty, P.K. Damage Analysis of an Inclined Cracked Curved Beam Using ANFIS. In Advances in Engineering Design; Springer: Singapore, 2021; pp. 611–621. [Google Scholar]
- Jagdale, P.M.; Chakrabarti, M.A. Free vibration analysis of cracked beam. Int. J. Eng. Res. Appl. 2013, 3, 1172–1176. [Google Scholar]
- Tufisi, C.; Gillich, G.-R.; Aman, A.T. The effect of a crack near the fixed end on the natural frequencies of a cantilever beam. Vibroeng. Procedia 2019, 23, 37–42. [Google Scholar]
- Tamrakar, R.; Das Mittal, N.; Singh, R.K. Crack Depth Estimation in Shaft for an Overhung Rotating Shaft System: An Experimental Investigation. J. Fail. Anal. Prev. 2021, 21, 1–13. [Google Scholar] [CrossRef]
- Maurya, M.; Sadarang, J.; Panigrahi, I. Detection of crack in structure using dynamic analysis and artificial neural network. Eng. Solid Mech. 2020, 8, 285–300. [Google Scholar] [CrossRef]
- Thatoi, D.; Guru, P.; Jena, P.K.; Choudhury, S.; Das, H.C. Comparison of CFBP, FFBP, and RBF Networks in the Field of Crack Detection. Model. Simul. Eng. 2014, 2014, 1–13. [Google Scholar] [CrossRef] [Green Version]
- Haeri, H.; Sarfarazi, V.; Zhu, Z. Analysis of Crack Coalescence in Concrete Using Neural Networks. Strength Mater. 2016, 48, 850–861. [Google Scholar] [CrossRef]
- Leissa, A.W.; Qatu, M.S. Vibrations of Continuous Systems; McGraw-Hill Education: New York, NY, USA, 2011. [Google Scholar]
- Benazzouz, D.; Benammar, S.; Adjerid, S. Fault Detection and Isolation Based on Neural Networks Case Study: Steam Turbine. Energy Power Eng. 2011, 3, 513–516. [Google Scholar] [CrossRef] [Green Version]
- Benammar, S.; Mohammedi, K.; Khellaf, A. Prediction of the Central Cavity Receiver’s Performance Using Artificial Neural Network. In Proceedings of the 1st International Conference on Applied Automation and Industrial Diagnostics (ICAADI’ 2015), Djelfa, Algeria, 29–30 March 2015. [Google Scholar]
- Benammar, S.; Benazzouz, D. Fault Detection and Isolation using Levenberg-Marquardt algorithm. In Proceedings of the 6th International Symposium on Hydrocarbons & Chemistry, Boumerdes, Algeria, 13–15 October 2012. [Google Scholar]
- Benammar, S.; Tee, K.F. Criticality Analysis and Maintenance of Solar Tower Power Plants by Integrating the Artificial In-telligence Approach. Energies 2021, 14, 5861. [Google Scholar] [CrossRef]
Publisher’s Note: MDPI stays neutral with regard to jurisdictional claims in published maps and institutional affiliations. |
© 2022 by the authors. Licensee MDPI, Basel, Switzerland. This article is an open access article distributed under the terms and conditions of the Creative Commons Attribution (CC BY) license (https://creativecommons.org/licenses/by/4.0/).