


Influence of Seat Vibration Frequency on Total Annoyance and Interaction Effects Caused by Simultaneous Noise and Seat Vibrations in Commercial Vehicles


Abstract
:1. Introduction
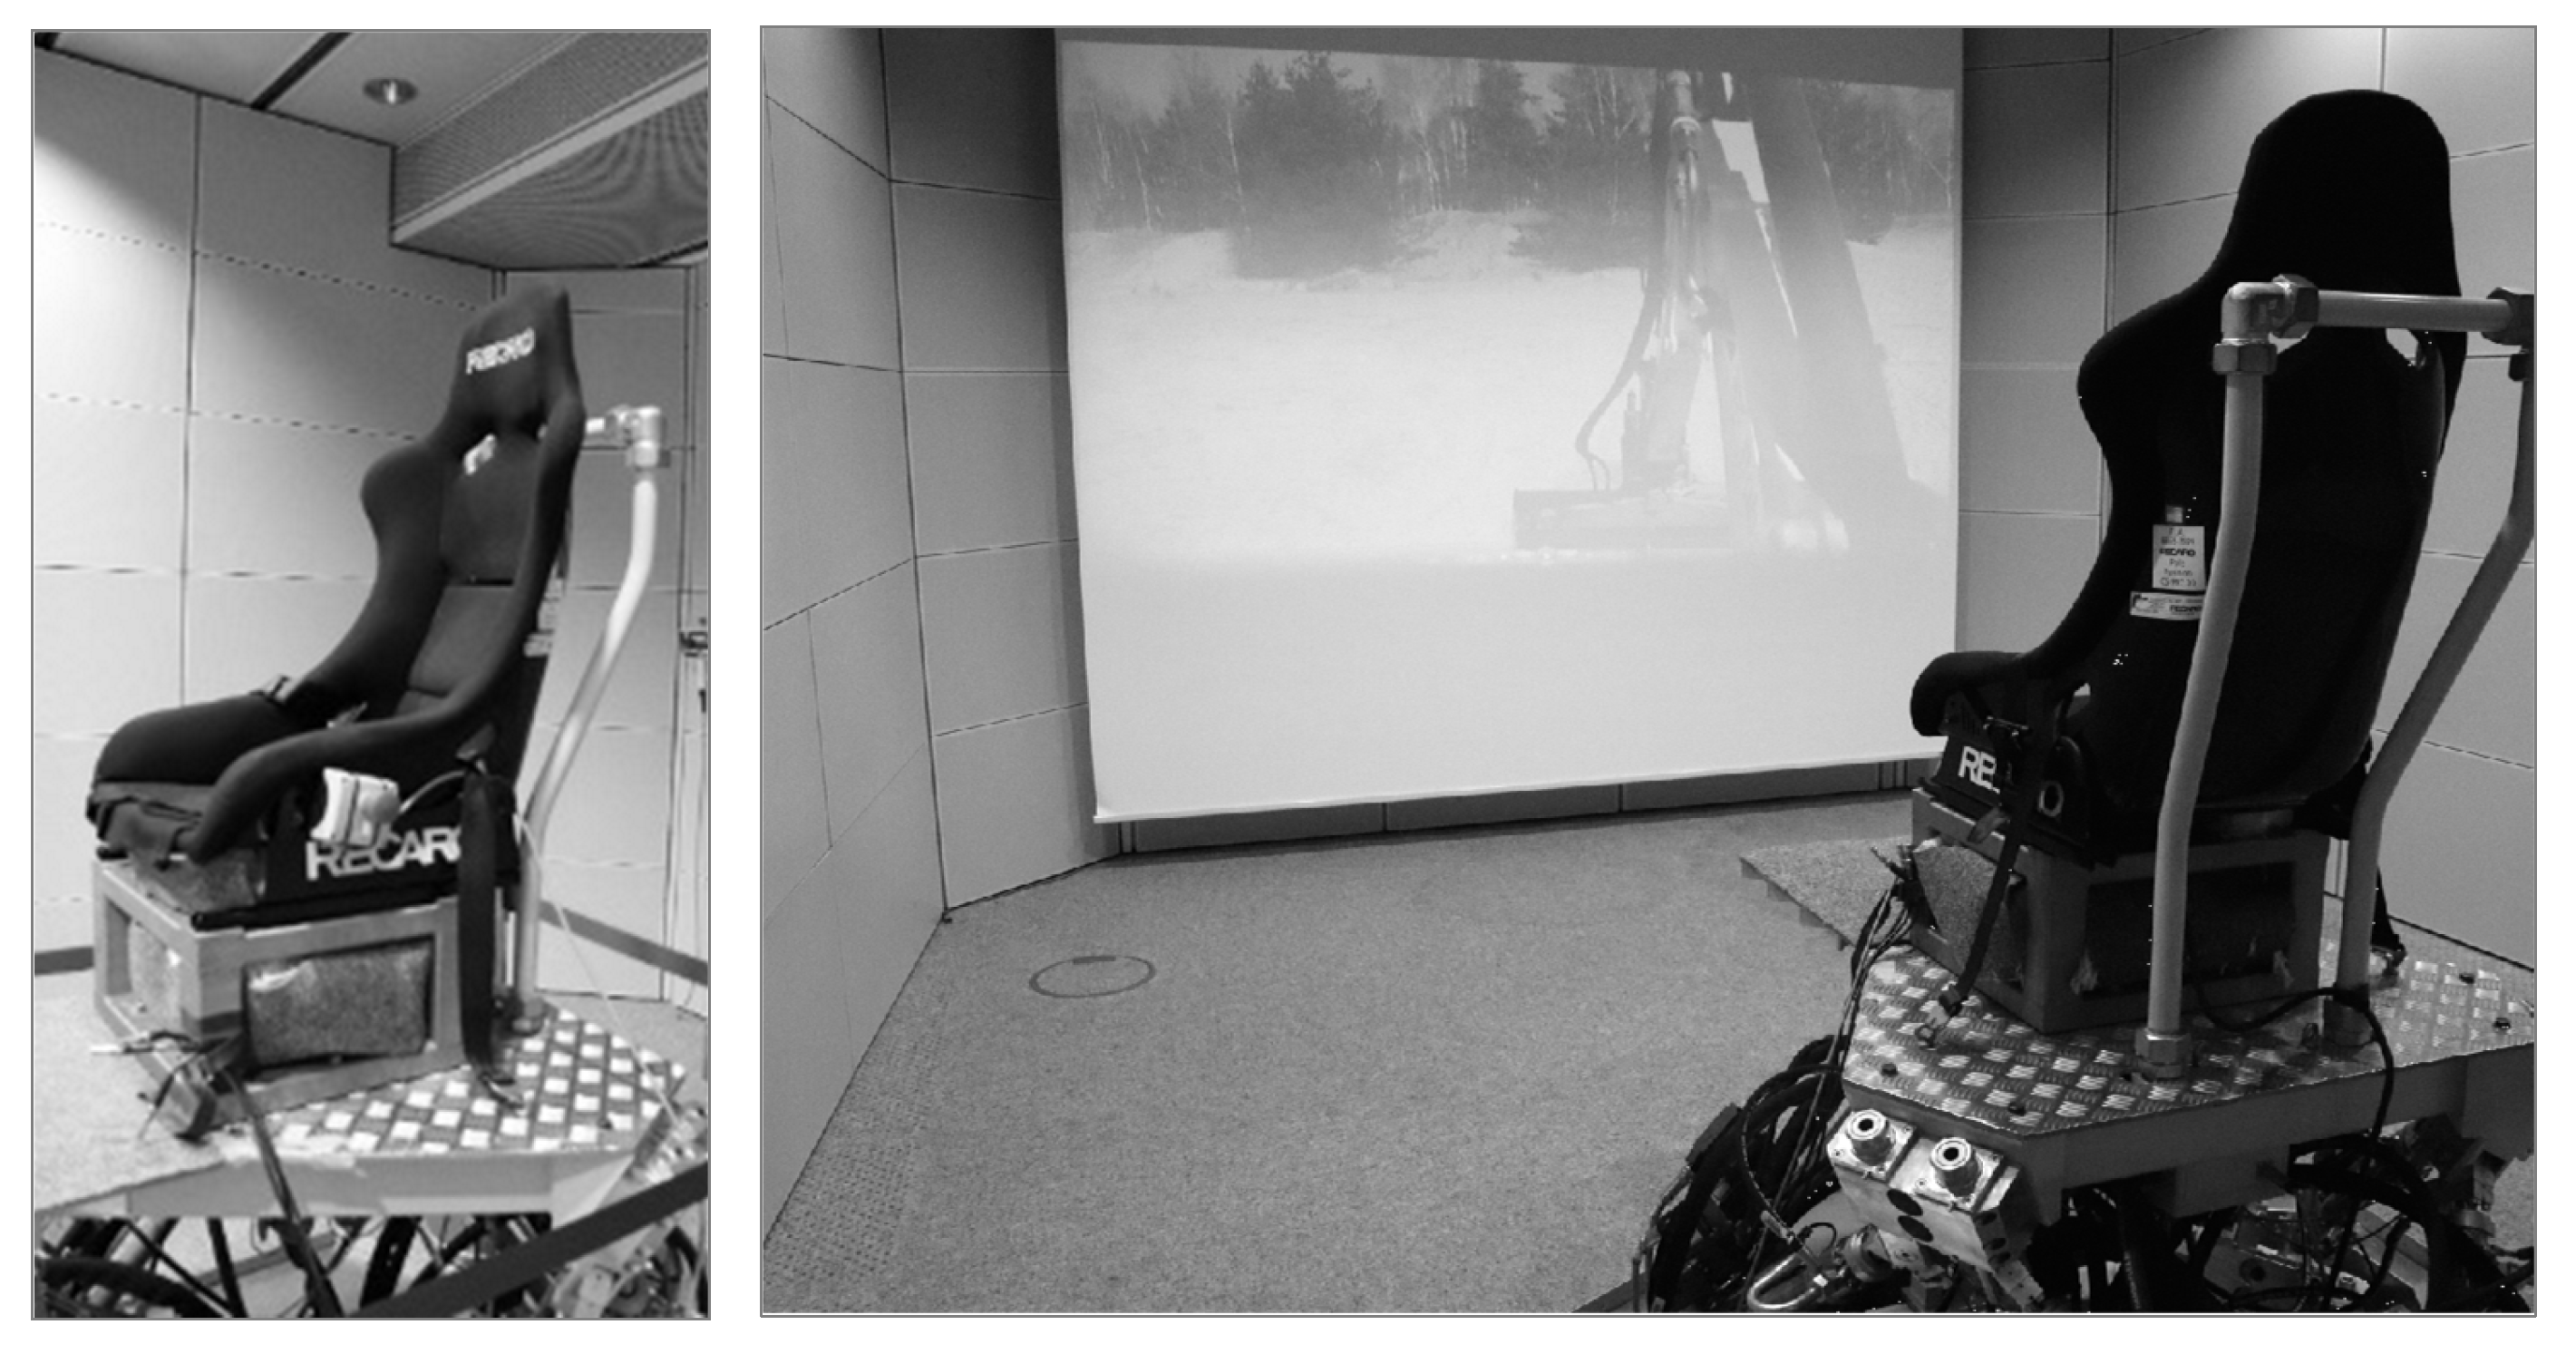
2. Apparatus
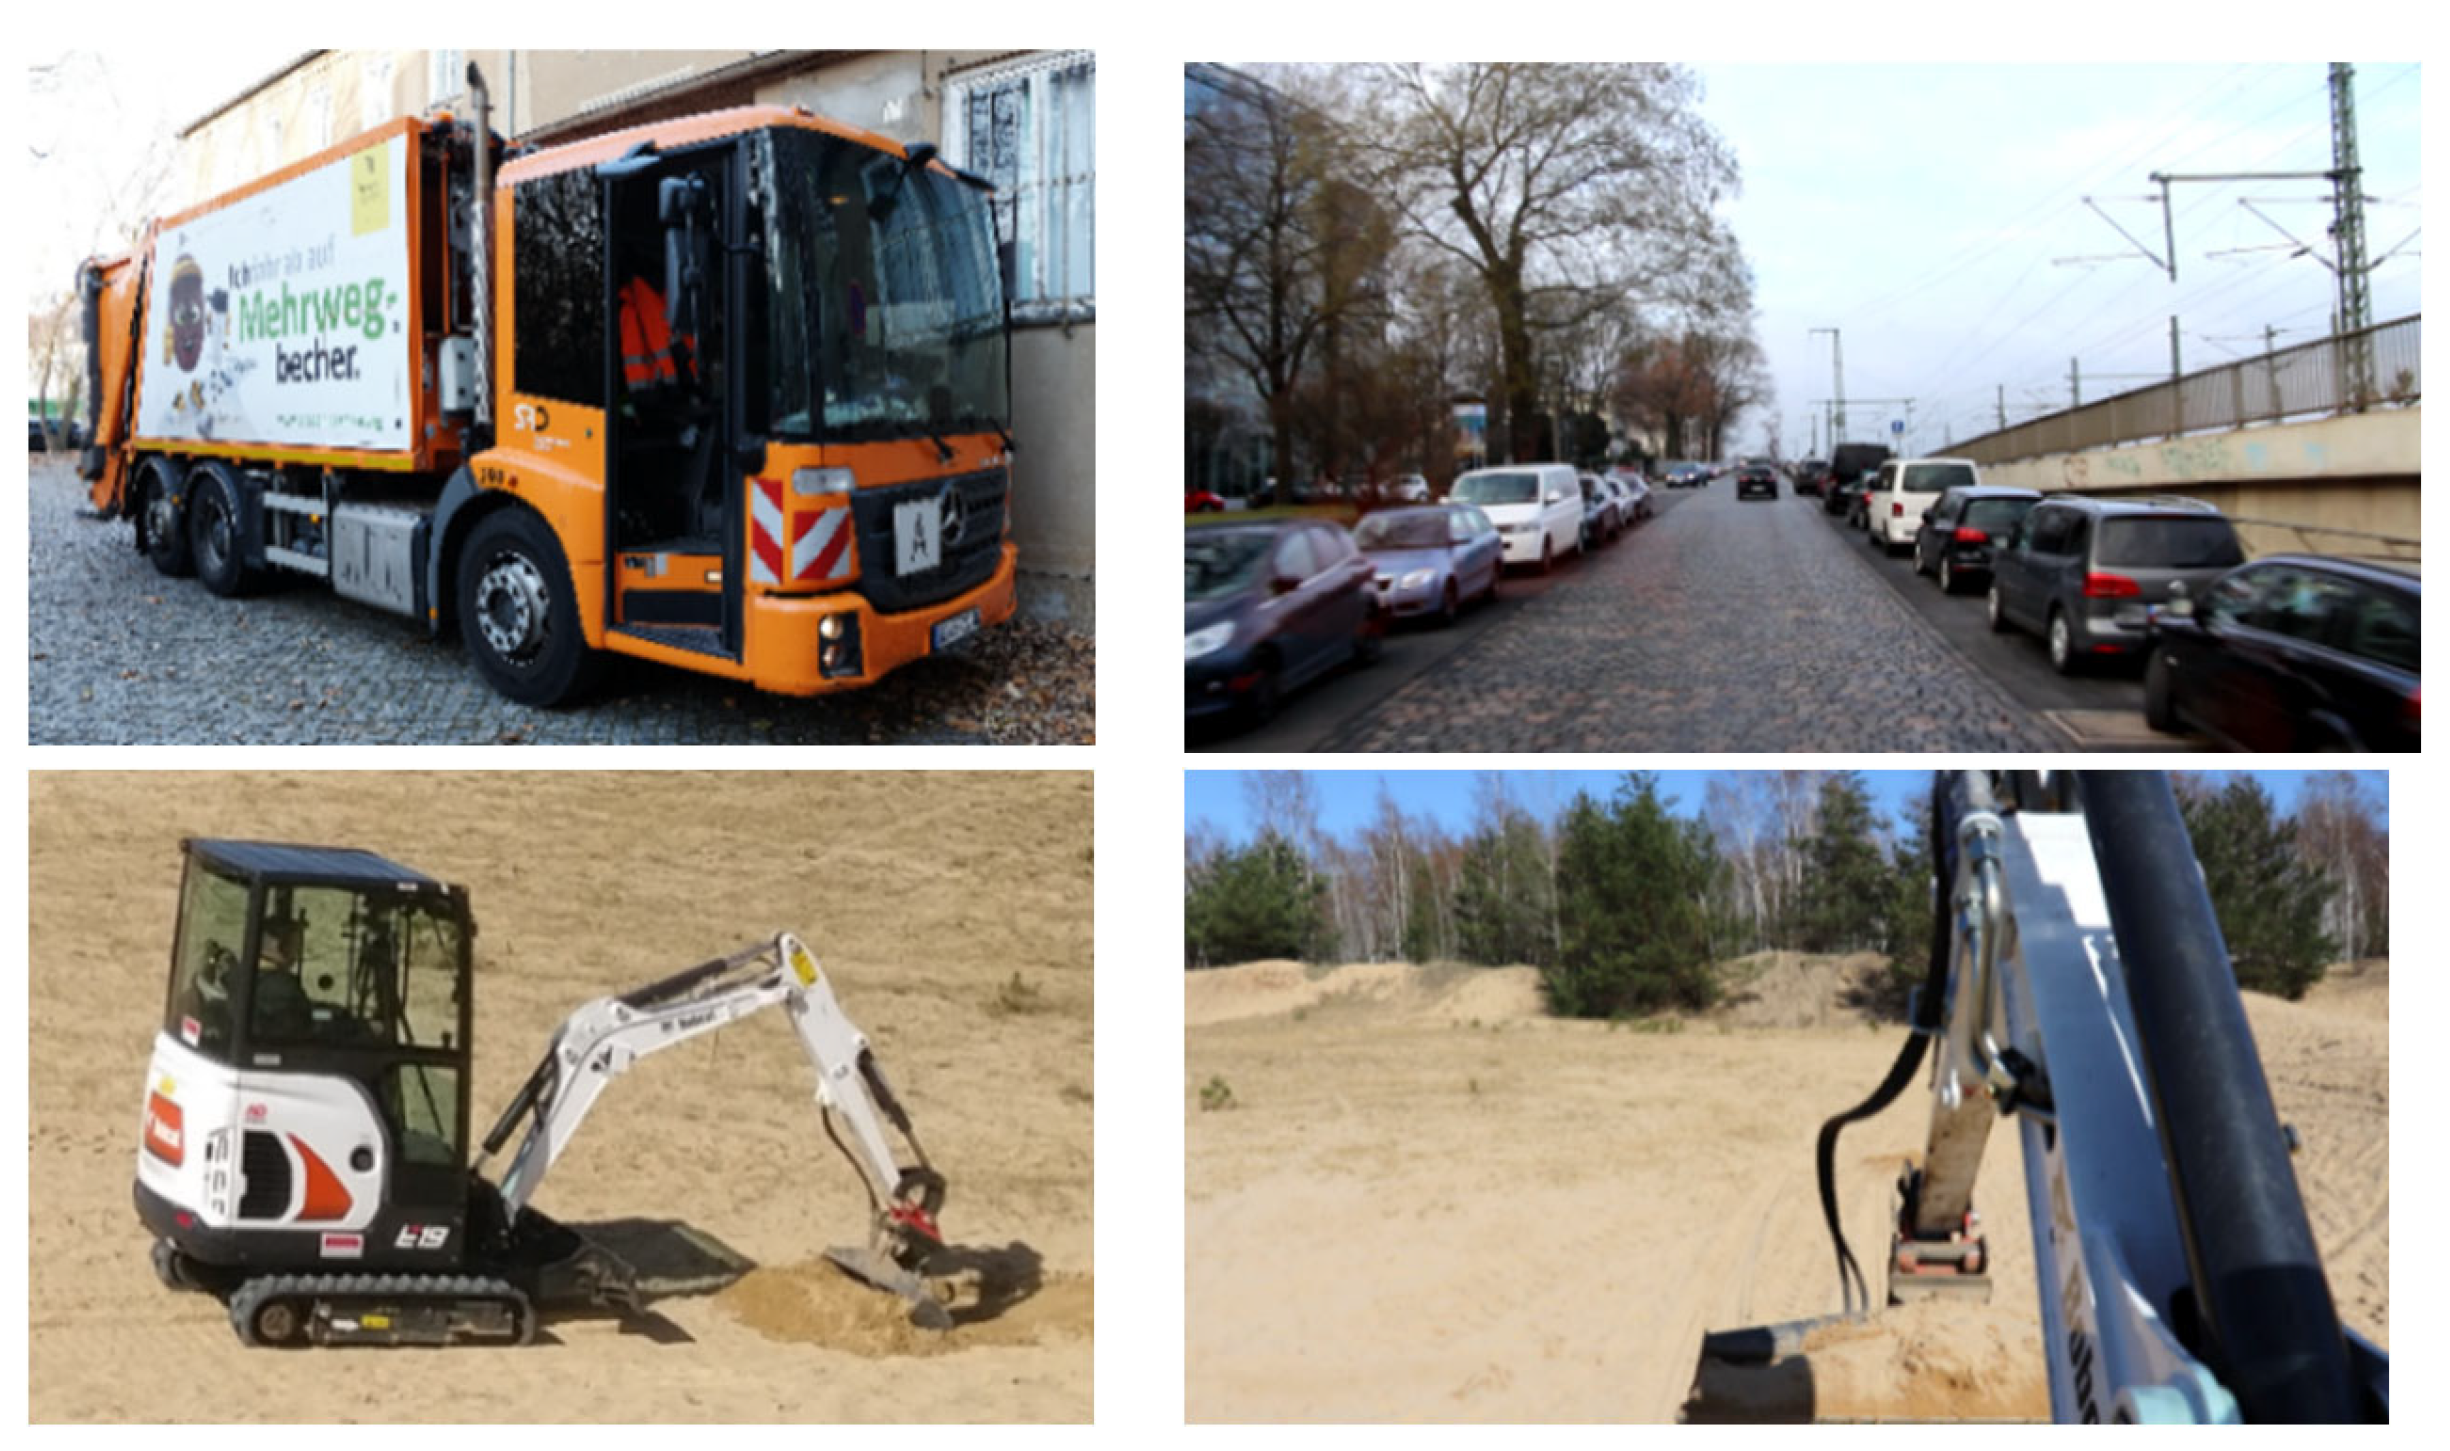
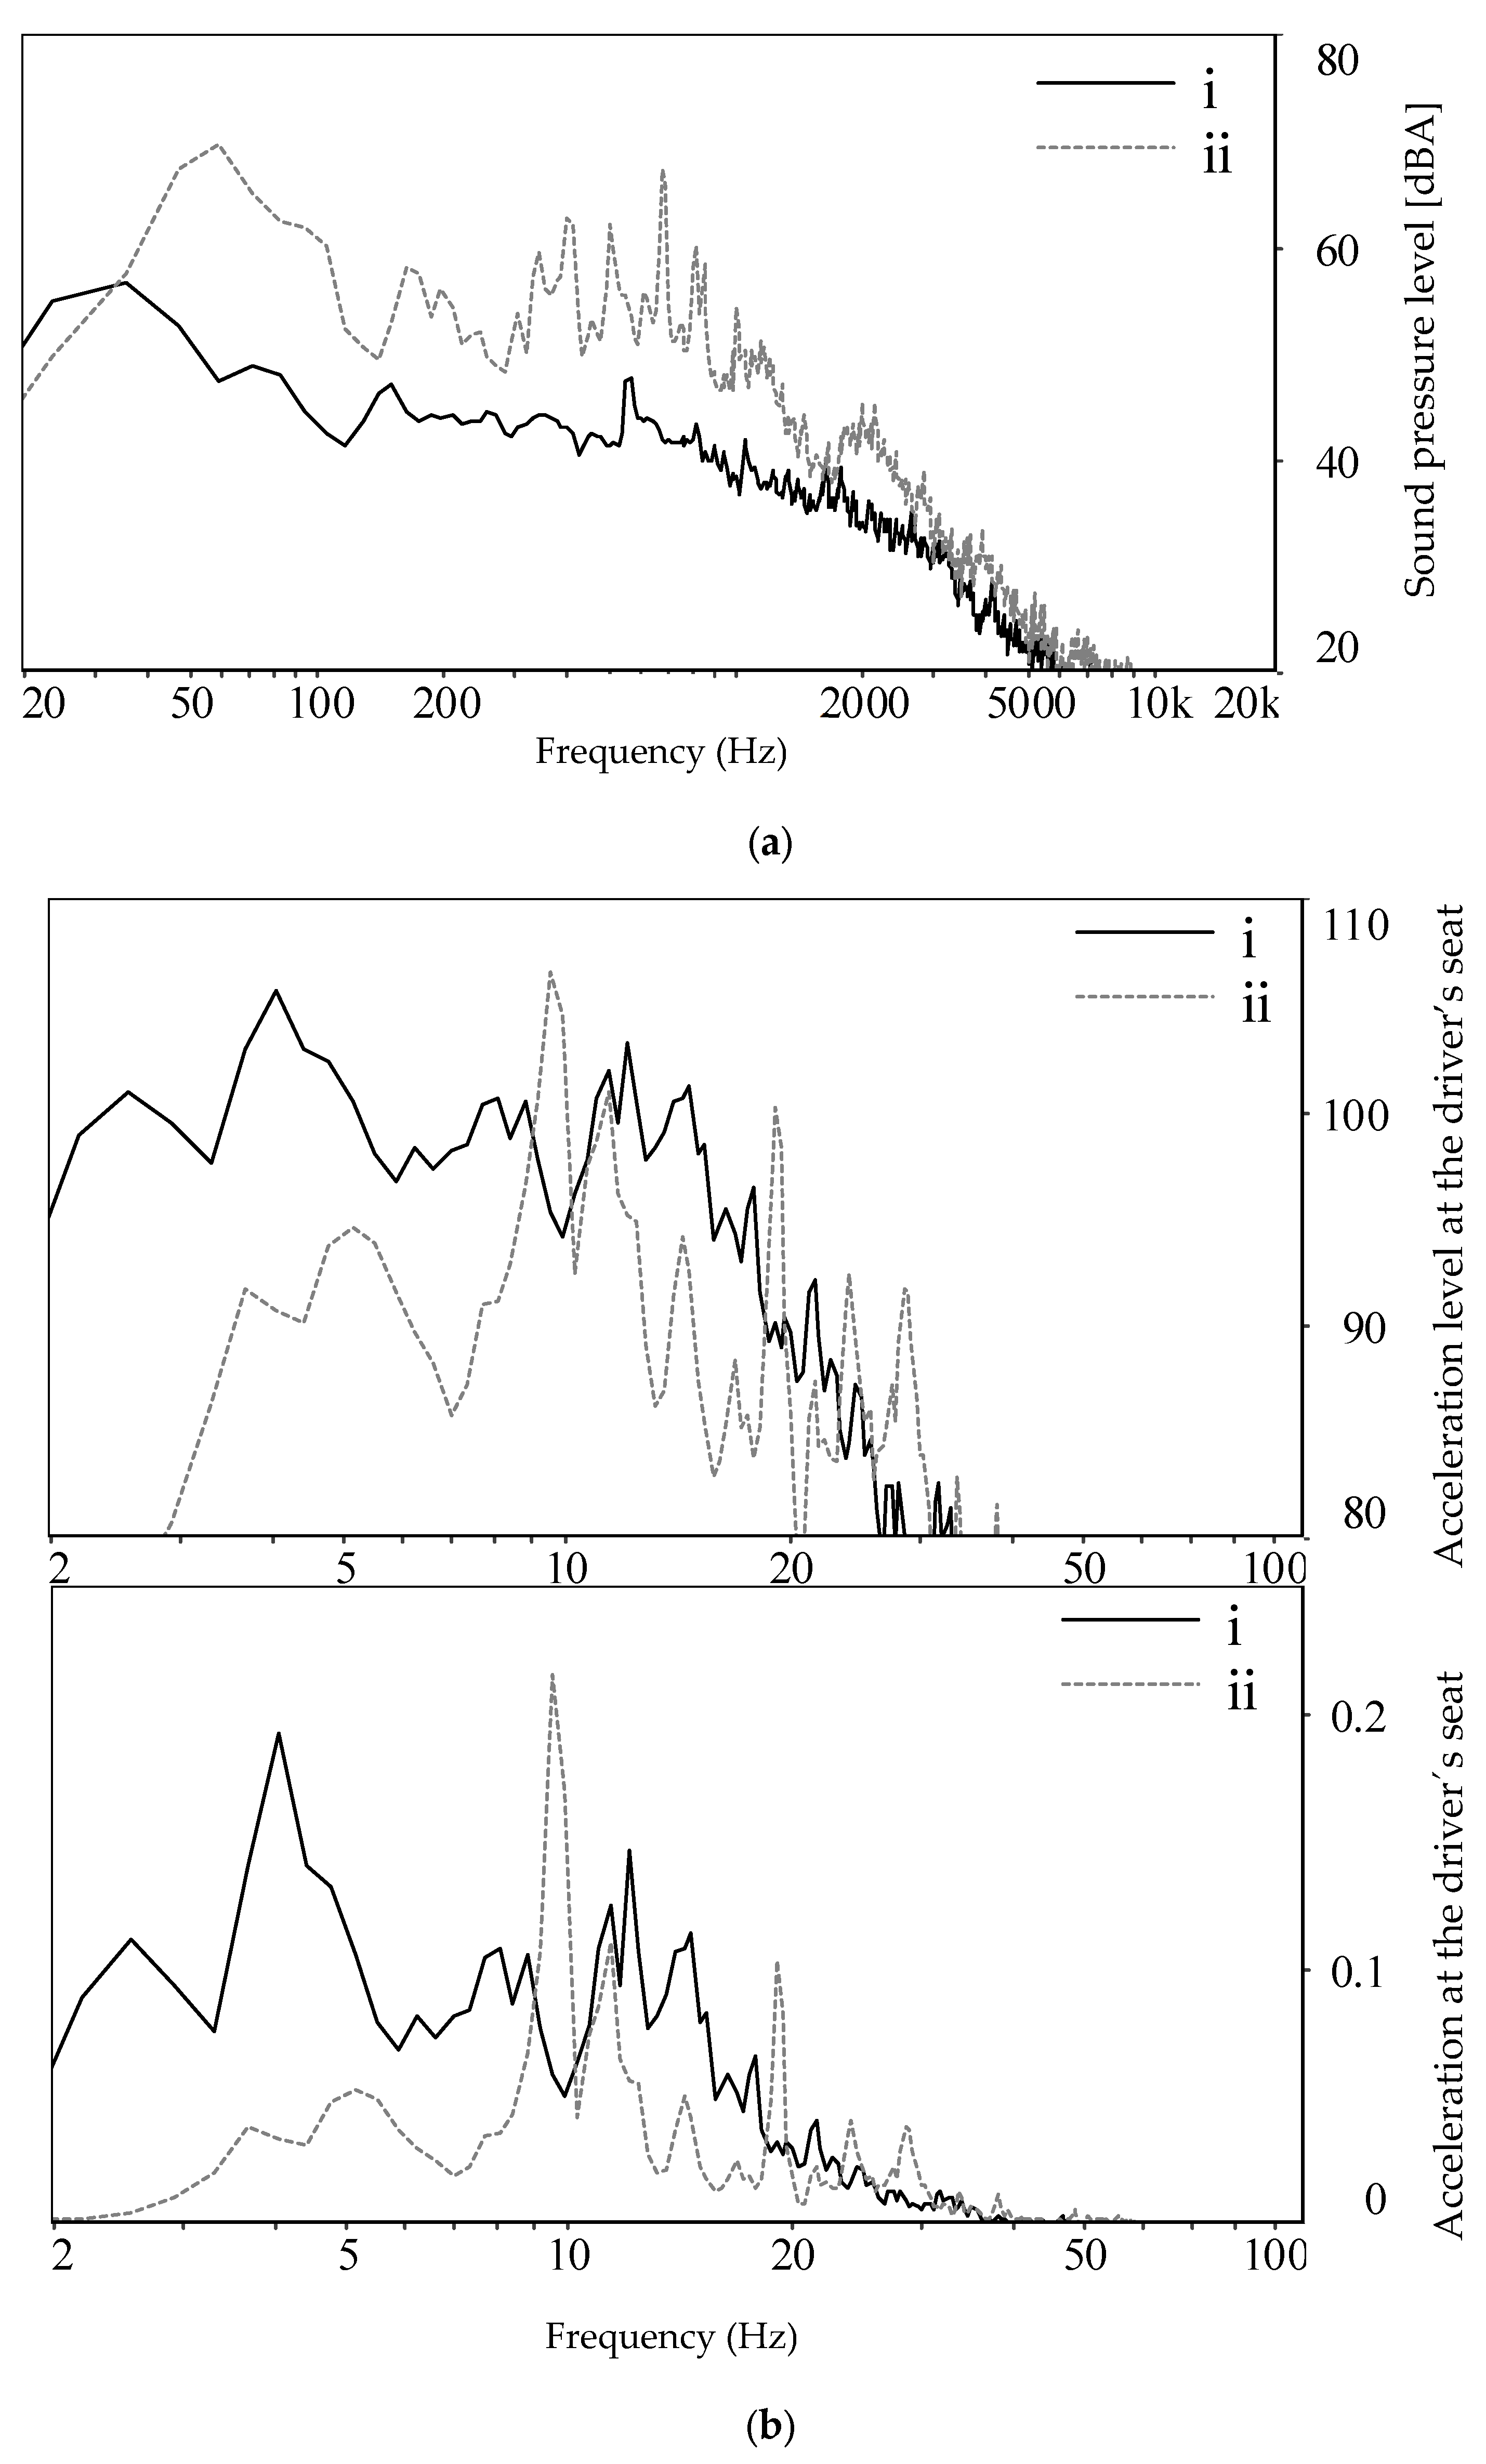
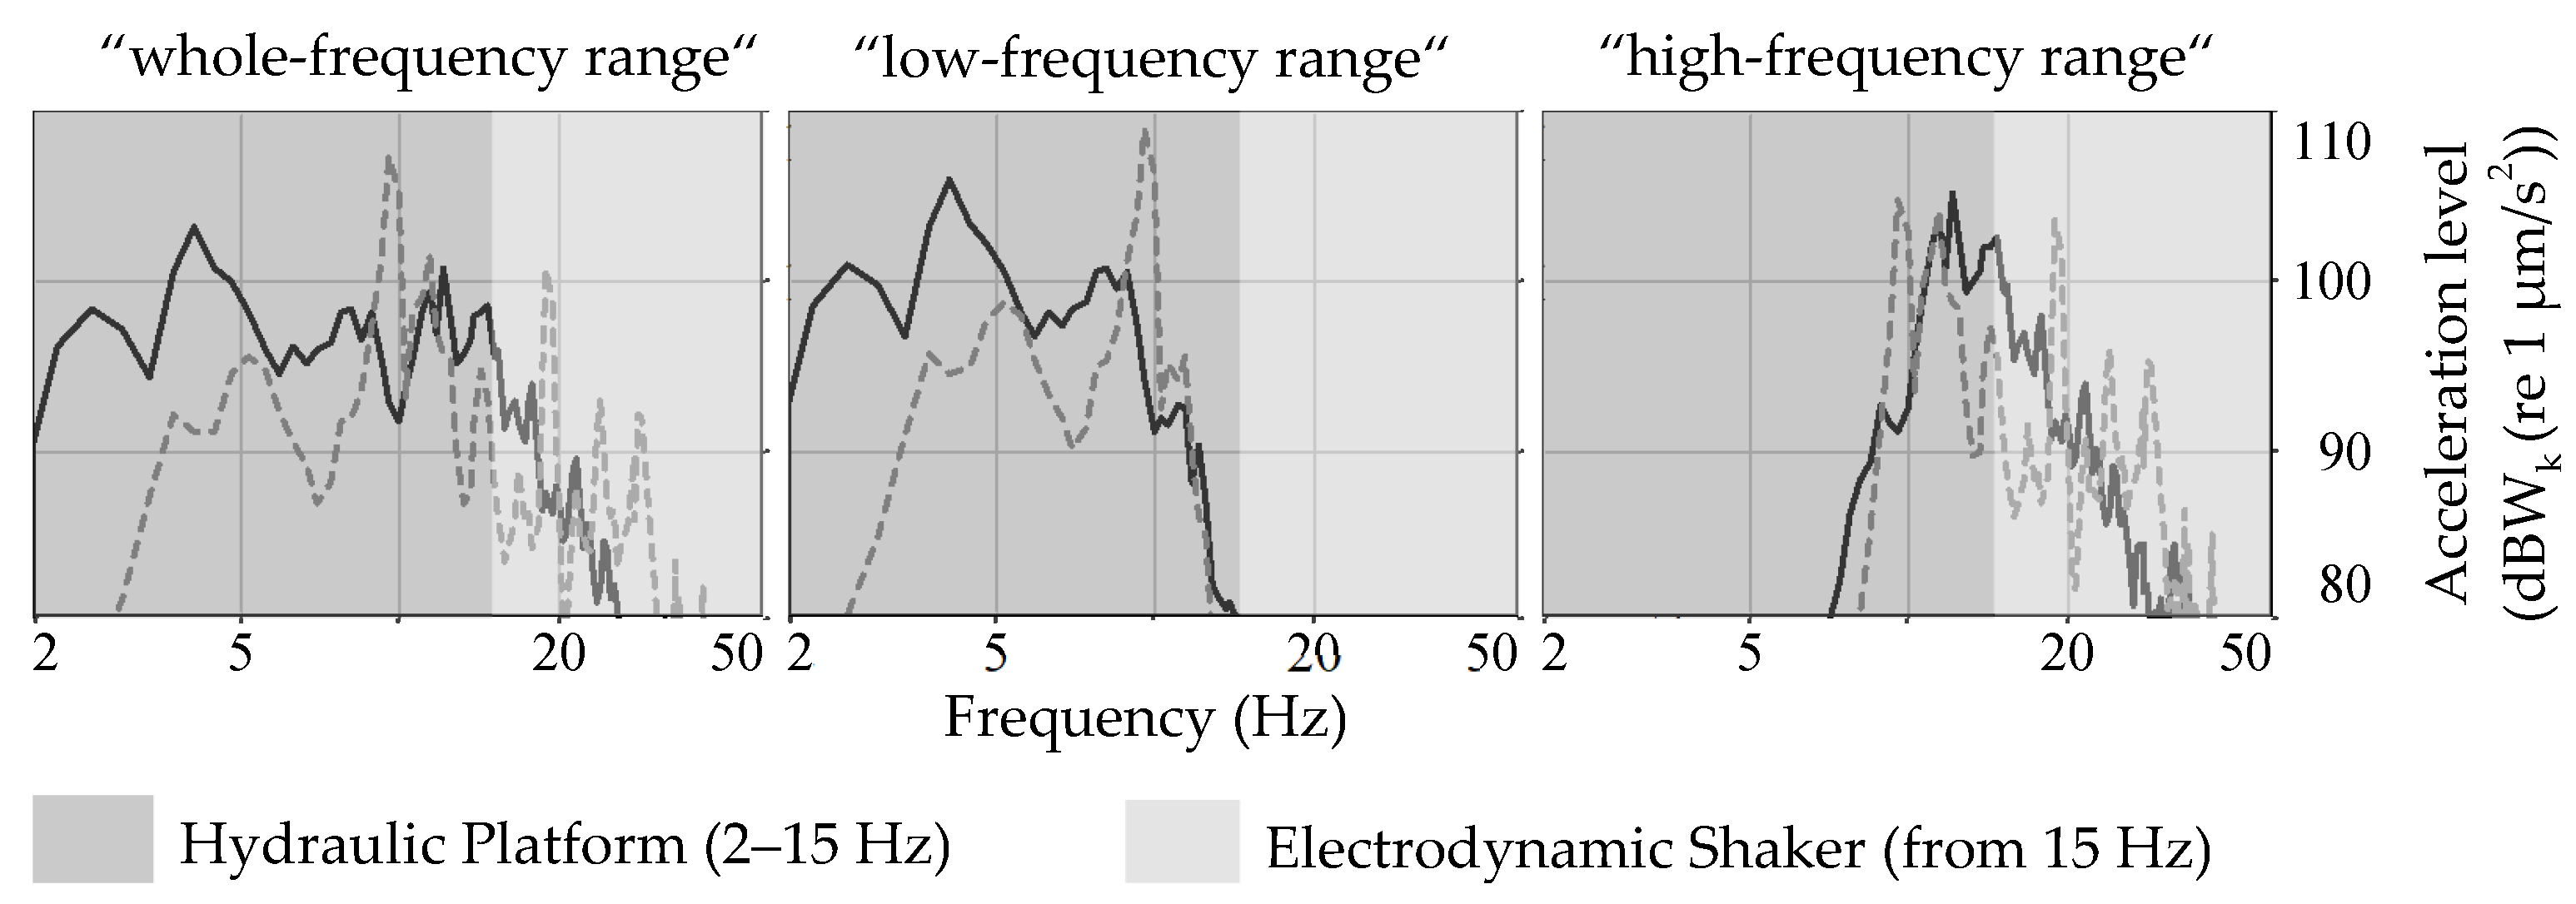
3. Stimuli
4. Design and Methodology
5. Participants
6. Statistics
7. Results
7.1. Main Effects
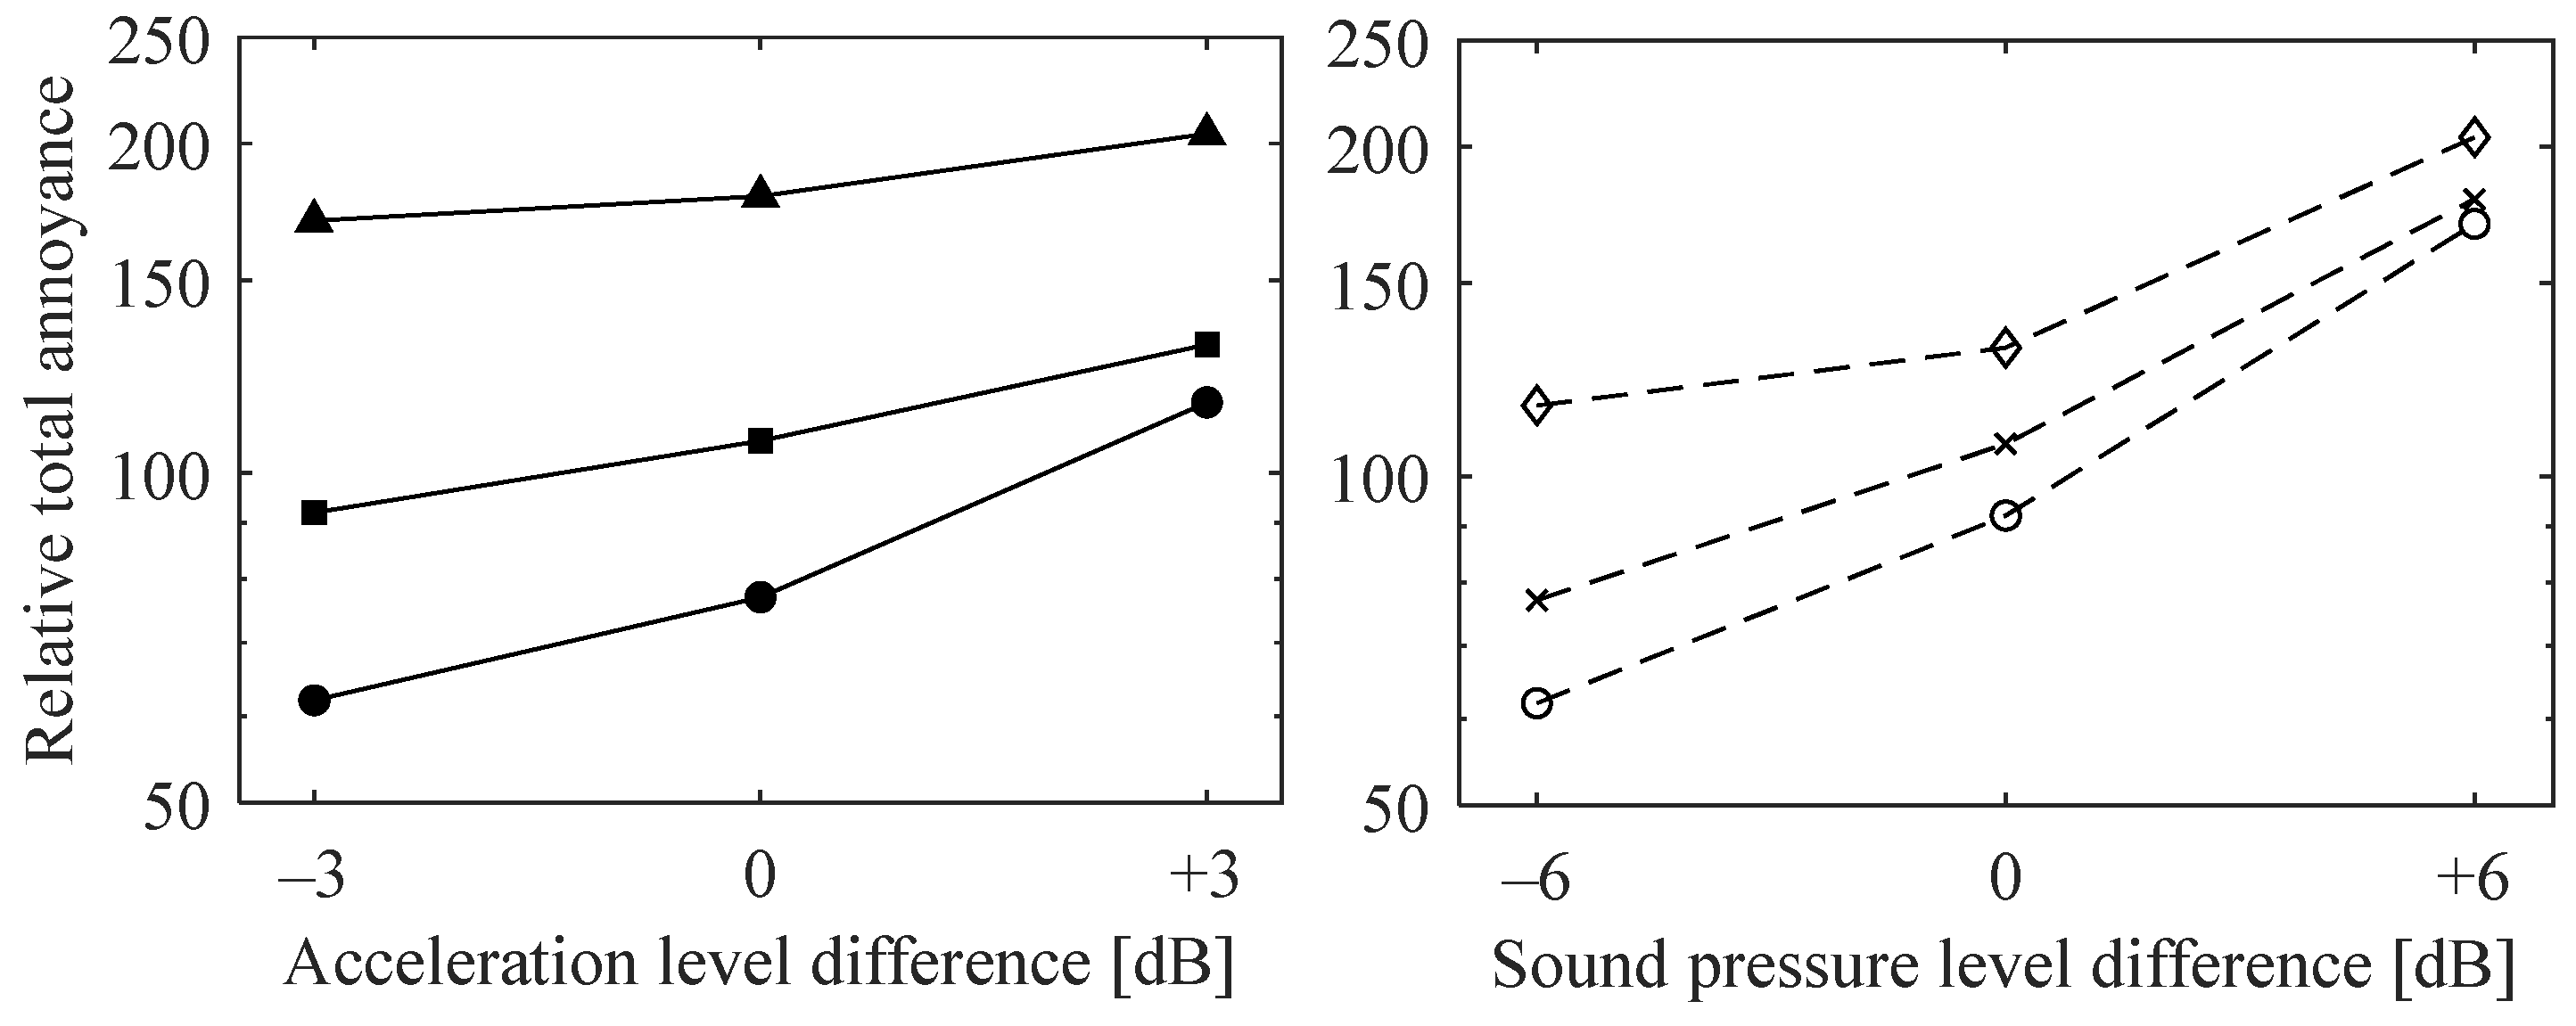
7.2. Interaction Effects
7.3. Comparisons between Both References (Experimental Part 3)
8. Discussions
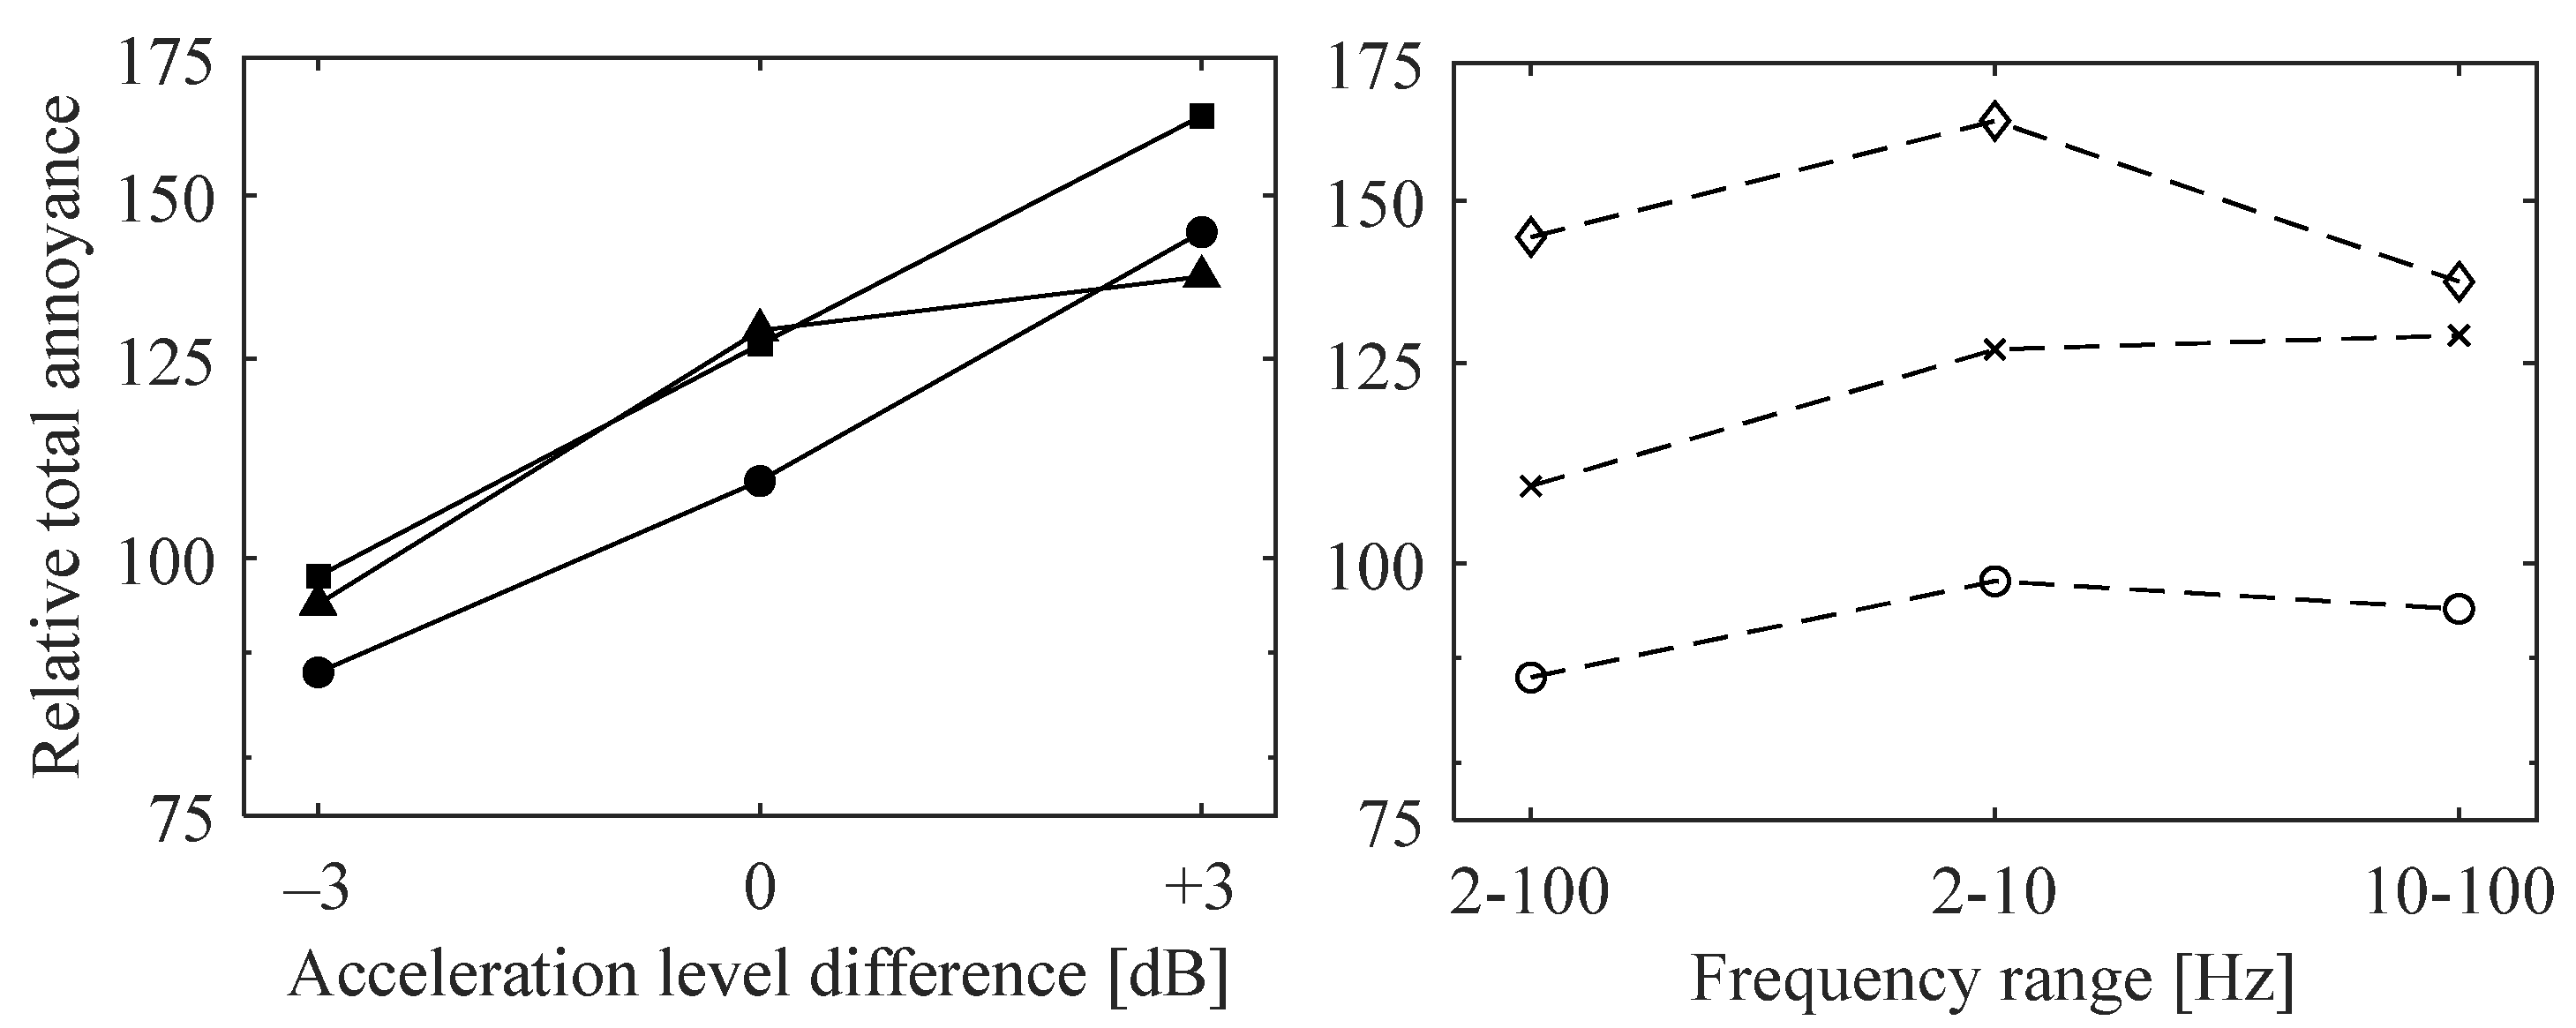
8.1. Influence of Weighted Vibration Frequency on Total Annoyance
8.2. Influence of Noise and Vibration Magnitude Differences and Their Interaction on Relative Total Annoyance
8.3. Prediction of Relative Total Annoyance with Multiple Linear Regression
8.4. Other Influencing Factors on Total Annoyance and Limitations
9. Conclusions
Author Contributions
Funding
Institutional Review Board Statement
Informed Consent Statement
Data Availability Statement
Acknowledgments
Conflicts of Interest
References
- Altinsoy, M.E. Auditory-Tactile Interaction in Virtuel Environments; Ruhr Universität Bochum: Ruhr, Germany, 2006. [Google Scholar]
- VDI 2057 Blatt 1:2017-08; Einwirkung Mechanischer Schwingungen auf den Menschen—Ganzkörper-Schwingungen. Verein Deutscher Ingenieure, Beuth Verlag: Berlin, Germany, 2017.
- TRLV Vibration Teil 1:2015-03; Technische Regeln zur Lärm- und Vibrations-Arbeitsschutzverordnung—TRLV Vibrationen—Teil 1: Beurteilung der Gefährdung durch Vibrationen. GMBl 2015 S. 485 [Nr. 25/26]; Verein Deutscher Ingenieure, Beuth Verlag: Berlin, Germany, 2015.
- ISO 2631-1:1997-05; Mechanical Vibration and Shock—Evaluation of Human Exposure to Whole-Body Vibration—Part 1: General Requirements. International Organization for Standardization: Genève, Switzerland, 1997.
- Huang, Y.; Griffin, M.J. The effects of sound level and vibration magnitude on the relative discomfort of noise and vibration. J. Acoust. Soc. Am. 2012, 131, 4558–4569. [Google Scholar] [CrossRef] [PubMed]
- Nicht, A.; Altinsoy, M.E. Multimodale Lästigkeit von Lärm und Vibrationen in Nutzfahrzeugen. Zeitschrift für Lärmbekämpfung. Heft 2015, 5, 212–216. [Google Scholar]
- Piranda, D.; Laroche, L.; Parizet, E.; Bornet, F. Multi-Excitation Discomfort in a Driving Car: Contribution from Sound and Vibrations; Forum Acusticum: Lyon, France, 2020. [Google Scholar]
- Howart, H.; Griffin, M. Subjective response to combined noise and vibration: Summation and interaction effects. J. Sound Vib. 1990, 143, 443–454. [Google Scholar] [CrossRef]
- Howarth, H.V.C.; Griffin, M.J. The annoyance caused by simultaneous noise and vibration from railways. J. Acoust. Soc. Am. 1991, 89, 2317–2323. [Google Scholar] [CrossRef]
- Lee, P.J.; Griffin, M. Combined effect of noise and vibration produced by high-speed trains on annoyance in buildings. J. Acoust. Soc. Am. 2013, 133, 2126–2135. [Google Scholar] [CrossRef] [PubMed] [Green Version]
- Paulsen, R.; Kastka, J. Effects of combined noise and vibration on annoyance. J. Sound Vib. 1995, 181, 295–314. [Google Scholar] [CrossRef]
- Maigrot, P.; Marquis-Favre, C.; Parizet, E. Two laboratory methods of assessing annoyance due to railway noise and vibration. J. Acoust. Soc. Am. 2017, 142, 3284–3287. [Google Scholar] [CrossRef] [PubMed]
- Meloni, T.; Krueger, H. Wahrnehmung und Empfindung von kombinierten Belastungen durch Lärm und Vibrationen. Z. Für Lärmbekämpfung 1990, 37, 170–175. [Google Scholar]
- Morihara, T.; Yokoshima, S.; Matsumoto, Y. Experimental study on combined effect of Shinkansen railway noise and vibration on daily activities: A case of reading and calculation tasks. Acoust. Sci. Technol. 2020, 41, 607–613. [Google Scholar] [CrossRef]
- Trollé, A.; Marquis-Favre, C.; Parizet, E. Perception and Annoyance Due to Vibrations in Dwellings Generated from Ground Transportation: A Review. J. Low Freq. Noise Vib. Act. Control 2015, 34, 413–457. [Google Scholar] [CrossRef] [Green Version]
- Huang, Y.; Griffin, M.J. The discomfort produced by noise and whole-body vertical vibration presented separately and in combination. Ergonomics 2014, 57, 1724–1738. [Google Scholar] [CrossRef] [PubMed] [Green Version]
- Huang, Y.; Li, D. Subjective discomfort model of the micro commercial vehicle vibration over different road conditions. Appl. Acoust. 2019, 145, 385–392. [Google Scholar] [CrossRef]
- Hashimoto, T.; Hatano, S. Effect of Factors other than Sound to the Perception of Sound Quality, Rome, Italy. In Proceedings of the 17th International Congress on Acoustics, Rome, Italy, 2–7 September 2001. [Google Scholar]
- Yokoshima, S.; Morihara, T.; Matsumoto, Y. Combined effect of vibrations on railway noise annoyance. In Proceedings of the 23rd International Congress on Acoustics, Aachen, Germany, 9–13 September 2019. [Google Scholar]
- Altinsoy, M.E.; Jekosch, U.; Landgraf, J.; Merchel, S. Progress in Auditory Perception Research Laboratories-Multimodal Measurement Laboratory of Dresden University of Technology; Audio Engineering Society Convention: New York, NY, USA, 2010; p. 129. [Google Scholar]
- Merchel, S.; Altinsoy, M.E. Auditory-tactile music perception. J. Acoust. Soc. Am. 2013, 133, 3256. [Google Scholar] [CrossRef]
- Cohen, J. Statistical Power Analysis for the Behavioral Sciences; Erlbaum: Hillsdale, NJ, USA, 1988. [Google Scholar]
- BS 6841; British Standard. Measurement and Evaluation of Human Exposure to Whole-Body Mechanical Vibration and Repeated Shock. British Standards Institution: London, UK, 1987.
- Maigrot, P.; Parizet, E.; Marquis-Favre, C. Annoyance due to combined railway noise and vibration: Comparison and testing of results from the literature. Appl. Acoust. 2020, 165, 107324. [Google Scholar] [CrossRef]
- Aladdin, M.; Jalil, N.; Guan, N.; Rezali, K. Perturbation effect of noise on overall feeling of discomfort from vertical whole-body vibration in vibro-acoustic environment. Int. J. Ind. Ergon. 2021, 83, 103136. [Google Scholar] [CrossRef]


| 2–100 Hz | Total Annoyance | 2–10 Hz | Total Annoyance | 10–100 Hz | Total Annoyance | ||||||
|---|---|---|---|---|---|---|---|---|---|---|---|
| SPL (dB) | AccL (dBW) | Mean | Median | SPL (dB) | AccL (dBW) | Mean | Median | SPL (dBA) | AccL (dBW) | Mean | Median |
| 70 | 109 | 61 | 70 | 70 | 109 | 62 | 75 | 70 | 109 | 62 | 60 |
| 70 | 112 | 80 | 80 | 70 | 112 | 78 | 80 | 70 | 112 | 74 | 72 |
| 70 | 115 | 115 | 130 | 70 | 115 | 127 | 130 | 70 | 115 | 106 | 115 |
| 76 | 109 | 92 | 95 | 76 | 109 | 92 | 100 | 76 | 109 | 92 | 97 |
| 76 | 112 | 100 | 100 | 76 | 112 | 111 | 105 | 76 | 112 | 111 | 110 |
| 76 | 115 | 118 | 120 | 76 | 115 | 159 | 155 | 76 | 115 | 120 | 127 |
| 82 | 109 | 174 | 187 | 82 | 109 | 190 | 195 | 82 | 109 | 149 | 150 |
| 82 | 112 | 169 | 180 | 82 | 112 | 184 | 200 | 82 | 112 | 186 | 175 |
| 82 | 115 | 215 | 200 | 82 | 115 | 209 | 210 | 82 | 115 | 187 | 170 |
| 2–100 Hz | Total Annoyance | 2–10 Hz | Total Annoyance | 10–100 Hz | Total Annoyance | ||||||
|---|---|---|---|---|---|---|---|---|---|---|---|
| SPL (dB) | AccL (dBW) | Mean | Median | SPL (dB) | AccL (dBW) | Mean | Median | SPL (dBA) | AccL (dBW) | Mean | Median |
| 59 | 109 | 55 | 70 | 59 | 109 | 57 | 68 | 59 | 109 | 58 | 55 |
| 59 | 112 | 76 | 75 | 59 | 112 | 82 | 85 | 59 | 112 | 96 | 100 |
| 56 | 115 | 108 | 108 | 56 | 115 | 122 | 135 | 56 | 115 | 100 | 105 |
| 65 | 109 | 86 | 88 | 65 | 109 | 96 | 100 | 65 | 109 | 91 | 90 |
| 65 | 112 | 101 | 100 | 65 | 112 | 133 | 130 | 65 | 112 | 116 | 110 |
| 65 | 115 | 142 | 145 | 65 | 115 | 172 | 163 | 65 | 115 | 133 | 130 |
| 71 | 109 | 148 | 155 | 71 | 109 | 174 | 173 | 71 | 109 | 164 | 160 |
| 71 | 112 | 170 | 170 | 71 | 112 | 185 | 195 | 71 | 112 | 193 | 188 |
| 71 | 115 | 194 | 188 | 71 | 115 | 211 | 200 | 71 | 115 | 193 | 183 |
| Scene | R² | Intercept | Slope SPL | Slope Vibration | Slope SPL∗Vibration |
|---|---|---|---|---|---|
| Model with mean values | |||||
| ME | 0.942 *** | 2.072037 *** | 0.029199 *** | 0.028021 *** | −0.002729 *** |
| RCV | 0.957 *** | 2.075015 *** | 0.029177 *** | 0.032919 *** | −0.002744 *** |
| Model with median values | |||||
| ME | 0.905 *** | 2.083175 *** | 0.027199 *** | 0.024326 *** | −0.003124 *** |
| RCV | 0.929 *** | 2.081055 *** | 0.026499 *** | 0.028899 *** | −0.002615 *** |
Publisher’s Note: MDPI stays neutral with regard to jurisdictional claims in published maps and institutional affiliations. |
© 2022 by the authors. Licensee MDPI, Basel, Switzerland. This article is an open access article distributed under the terms and conditions of the Creative Commons Attribution (CC BY) license (https://creativecommons.org/licenses/by/4.0/).
Share and Cite
Maravich, M.M.; Altinsoy, E. Influence of Seat Vibration Frequency on Total Annoyance and Interaction Effects Caused by Simultaneous Noise and Seat Vibrations in Commercial Vehicles. Vibration 2022, 5, 183-199. https://doi.org/10.3390/vibration5020012
Maravich MM, Altinsoy E. Influence of Seat Vibration Frequency on Total Annoyance and Interaction Effects Caused by Simultaneous Noise and Seat Vibrations in Commercial Vehicles. Vibration. 2022; 5(2):183-199. https://doi.org/10.3390/vibration5020012
Chicago/Turabian StyleMaravich, Maria Mareen, and Ercan Altinsoy. 2022. "Influence of Seat Vibration Frequency on Total Annoyance and Interaction Effects Caused by Simultaneous Noise and Seat Vibrations in Commercial Vehicles" Vibration 5, no. 2: 183-199. https://doi.org/10.3390/vibration5020012
APA StyleMaravich, M. M., & Altinsoy, E. (2022). Influence of Seat Vibration Frequency on Total Annoyance and Interaction Effects Caused by Simultaneous Noise and Seat Vibrations in Commercial Vehicles. Vibration, 5(2), 183-199. https://doi.org/10.3390/vibration5020012