Abstract
The Shenzhen–Zhongshan Link is a key cross-sea corridor in the Guangdong–Hong Kong–Macao Greater Bay Area. As a representative ultra-wide cross-section undersea tunnel, it exhibits smoke spread behaviors that differ fundamentally from those of traditional road tunnels. In particular, the radial flow region of fire smoke is more pronounced, resulting in substantial lateral variations in smoke dynamics parameters. These characteristics render classical one-dimensional ceiling jet temperature rise theories insufficient for capturing the multidimensional thermal behavior in such geometries. In this study, the immersed-tunnel section of the Shenzhen–Zhongshan Link was investigated through a combination of full-scale fire experiments and Fire Dynamics Simulator (FDS) simulations. The longitudinal attenuation and lateral distribution characteristics of hot smoke temperature rise during spread in an ultra-wide tunnel were systematically obtained. Based on a simplified one-dimensional ceiling jet concept, differences in hot smoke diffusion distance were employed to characterize the lateral temperature rise ratio at any longitudinal location, from which a lateral distribution model was developed. The classical one-dimensional average temperature rise decay model was further reformulated to derive a modified longitudinal decay model applicable to the tunnel centerline of ultra-wide cross-sections. By integrating these characteristic models, a two-dimensional longitudinal prediction framework for hot smoke temperature rise in ultra-wide tunnels was established. Validation against full-scale fire experiments demonstrates that the proposed model can predict the two-dimensional thermal field with an accuracy within 25%. The findings of this study provide a theoretical basis for fire scenario reconstruction in the Shenzhen–Zhongshan undersea tunnel and offer a technical foundation for optimizing emergency ventilation strategies during fire incidents.
1. Introduction
The Shenzhen–Zhongshan Link is located in the central region of the Pearl River estuary in Guangdong Province, China. It starts from Shenzhen Airport in the east and terminates at Hengmen on Ma’an Island in Zhongshan, with a total length of approximately 23,978 m. It is the most convenient cross-sea corridor in the Guangdong–Hong Kong–Macao Greater Bay Area. The project is an ultra-large sea-crossing infrastructure complex comprising offshore bridges, artificial islands, an undersea tunnel, and an underwater interchange tunnel [1]. The undersea tunnel has a total length of 6845 m, including a 5035 m immersed-tube section. Its standard cross-section accommodates eight bidirectional lanes (46 m in width), making it the widest immersed-tube tunnel currently constructed worldwide (as shown in Figure 1). The main tunnel adopts two bores and one central gallery configuration (as shown in Figure 2), with the central gallery subdivided into three compartments [1].
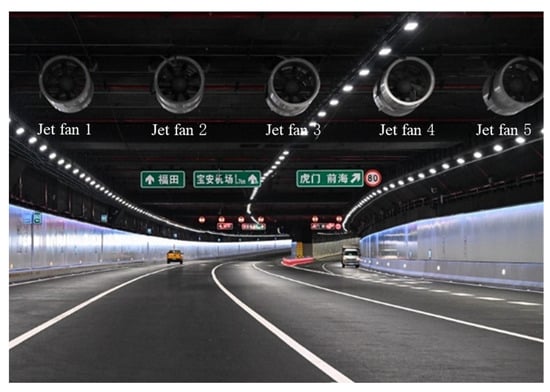
Figure 1.
Schematic of the traffic bores of the Shenzhen–Zhongshan undersea tunnel.
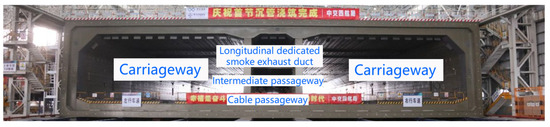
Figure 2.
Cross-sectional view of the Shenzhen–Zhongshan undersea tunnel.
As a representative ultra-wide undersea tunnel, the Shenzhen–Zhongshan Link exhibits fire smoke spread behaviors fundamentally different from those observed in traditional road tunnels. In ultra-wide cross-sections, the radial flow region of smoke becomes more pronounced. Coupled with the evolution of potential fire source parameters within the tunnel, this leads to substantial lateral variations in key smoke dynamics parameters and results in a complex two-dimensional distribution and evolution of smoke flow characteristics in the main tunnel, as shown in Figure 3.
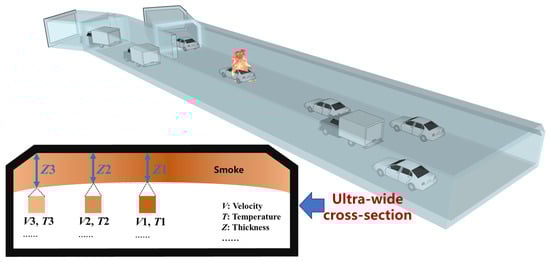
Figure 3.
Two-dimensional distribution and evolution of smoke flow characteristics in the tunnel.
Research on smoke spread and evolution in naturally ventilated tunnel fires has predominantly focused on jet temperature [2,3], jet velocity [4,5], and jet-layer thickness [6,7], leading to the development of extensive mathematical characterization models. Studies concerning jet temperature, velocity, and thickness have mainly concentrated on the flow characteristics within the one-dimensional longitudinal jet region [8,9,10]. Yang et al. [8,9] examined the longitudinal evolution of fire smoke temperature in tunnels and, under the assumption of identical parameters across the same cross-section, developed a conservation equation describing the longitudinal distribution of maximum smoke temperature. Following a similar approach, Shi et al. [3] established a longitudinal decay model for smoke temperature under longitudinal ventilation. Oka et al. [4] investigated the distribution of smoke velocity in tunnels and proposed a dimensionless equation for predicting the longitudinal attenuation of ceiling jet velocity as a function of the heat release rate. Regarding ceiling jet thickness, most previous studies assumed that the jet thickness is uniform across the same cross-section [6,11,12]. Tanno et al. [6] derived a longitudinal evolution equation for ceiling jet thickness based on flow field equations and experimental data. With respect to the influence of main tunnel or ramp tunnel geometries on smoke propagation, both domestic and international studies have primarily analyzed the underlying mechanisms from the perspective of jet temperature [13,14,15]. Zhang et al. [14] conducted experimental investigations on the temperature distribution of fire smoke in tunnels, considering the influence of fire lateral location on temperature attenuation in the main tunnel. By modifying classical models for the lateral and longitudinal evolution of jet temperature [16,17], they proposed a temperature distribution prediction model for main tunnels. Overall, although smoke spread under complex tunnel geometries has become a research hotspot in recent years, existing theoretical studies remain relatively limited and largely focus on jet temperature behavior.
Given the confined and elongated characteristics of traditional tunnels, most existing studies on the longitudinal temperature rise behavior of tunnel fire smoke have tended to overlook the lateral variations in smoke spread parameters. In addition, many longitudinal prediction models are built on the assumption of a laterally homogeneous ceiling jet cross-section [2,8,10,18], with limited evaluation of how lateral non-uniformities in smoke dynamics parameters affect longitudinal spread. Therefore, it is necessary to investigate the lateral distribution characteristics and longitudinal evolution patterns of temperature rise in ultra-wide tunnels, and to develop a multidimensional characterization model for the temperature rise behavior of fire smoke in the main tunnel of the Shenzhen–Zhongshan undersea tunnel. In this study, numerical fire simulations are combined with full-scale fire experiments. Continuous temperature rise data obtained from the simulations, together with classical tunnel fire dynamics theory, are used to develop a multidimensional characterization model for smoke temperature rise in the main tunnel of the Shenzhen–Zhongshan undersea tunnel. Discrete temperature data collected from the full-scale fire experiments are then used to calibrate and validate the accuracy of the proposed multidimensional model.
2. Experimental Design and Numerical Simulation Setup
2.1. Full-Scale Fire Experiment Design
The full-scale fire experiments were conducted in the entrance section of the immersed undersea tunnel of the Shenzhen–Zhongshan Link. The cross-section of the experimental region is approximately 17 m in width and 6.7 m in height, as shown in Figure 4. To establish a stable fire source, and following the approaches adopted in previous studies [19,20], methanol-fueled pool fires were used in the full-scale tests. The heat release rate was adjusted by varying the burning surface area of the fuel pool.
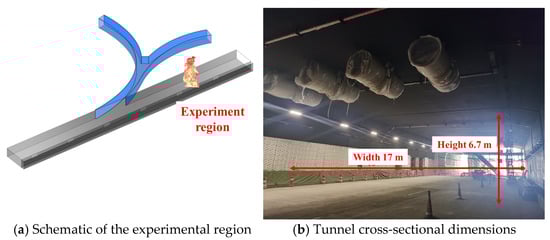
Figure 4.
Full-scale fire test region and tunnel dimensions.
In this experiment, the burning surface area of the pool fire was adjusted by changing the number of fuel pans. Each fuel pan had dimensions of 0.84 m (length) × 0.59 m (width) × 0.15 m (height). Three fuel pan configurations (four, eight, and twelve pans) were used in the full-scale fire tests. The heat release rate of a single fuel pan filled with methanol under fully developed burning conditions was calculated based on the standard heat release rate formula.
In the heat release rate calculation, Q denotes the heat release rate (MW), ∆m is the mass loss rate, and ∆H is the heat of combustion of methanol, taken as 22.7 kJ/g. The combustion efficiency χ is taken as 0.8 based on conclusions from previous studies under similar experimental conditions [21]. Due to the limitations of conducting full-scale tests on site, the mass loss rate could not be directly measured during the experiments. However, based on comparable experimental conditions and prior experience from full-scale fire tests, the heat release rate can be reasonably determined. Yue [22] conducted full-scale fire experiments in a similar single-head tunnel and mass loss rate in each fuel pan (0.84 m × 0.59 m) is about 13.8 g/s. On the basis of Equation (1), the heat release rate of each fuel pan (0.84 m× 0.59 m) can be calculated as 0.25 MW. On the other hand, with increasing fire size, the fuel mass loss rate per unit area approaches a constant value [23]. Thus, with a heat release rate of 0.25 MW per fuel pan, total heat release rates can be determined through the number of fuel pans in this study. The specific parameters used for the full-scale experiments in this work are summarized as shown in Table 1.

Table 1.
Summary of full-scale fire test cases and parameters.
Natural ventilation was maintained throughout the full-scale fire experiments, and All ventilation and smoke exhaust equipment remained shut down during the experiment. A smoke generator was used as the smoke producing device, directing the smoke generated by the combustion materials to diffuse toward the area directly above the fire. For each test, approximately 15–20 smoke cakes were used, producing visible smoke particles for about 10 min, thereby providing tracer support for observing smoke movement in the full-scale experiments, as shown in Figure 5.
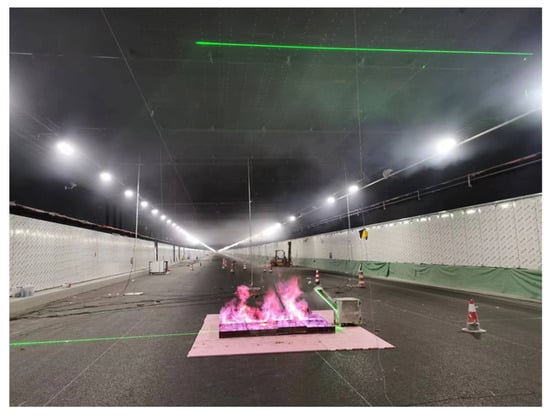
Figure 5.
Full-scale tunnel experiment.
In addition, the temperature measurement system used in this study consisted of thermocouples connected to a data acquisition module, covering a total length of approximately 200 m, with the fire positioned at the midpoint of the system. On each side of the fire, 30 temperature measurement cables were installed, arranged in three longitudinal rows: one along the tunnel centerline and two along the tunnel sidewalls. Each row contained six cables, resulting in a total of 36 temperature measurement cables symmetrically deployed on both sides of the fire. The spacing and layout arrangement are shown in Figure 6a. Each temperature measurement cable was fixed beneath the tunnel ceiling using magnetic mounts or cable ties. A single cable was 7.0 m in length and was equipped with ten temperature measurement points. The vertical spacing of the measurement points along each cable was 0.1 m, 0.5 m, 0.5 m, 0.5 m, 0.5 m, 0.5 m, 1.0 m, 1.0 m, 1.0 m, and 1.0 m from top to bottom. The detailed configuration is shown in Figure 6b, ensuring that the collected data captured the vertical temperature distribution throughout the tunnel cross-section.
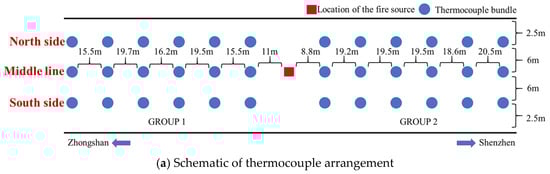
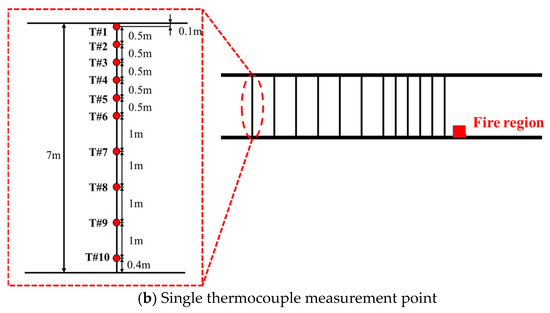
Figure 6.
Schematic layout of the experimental temperature measurement system.
2.2. Fire Numerical Simulation Setup
Fire Dynamics Simulator (FDS) was employed in this study to conduct full-scale fire simulations, serving as a supplement to the experimental data. A 1:1 numerical model of the full-scale fire test section (entrance segment) of the immersed undersea tunnel was developed, as shown in Figure 7. For the computational domain, half of the Shenzhen–Zhongshan immersed tunnel cross-section, including the main traffic tunnel and the smoke exhaust duct, which was selected as the modeling geometry.
Figure 7.
Establishment of the tunnel numerical model in FDS.
Two types of surface materials were used in the numerical simulation model: concrete and steel. The surface materials of the immersed tunnel were modeled at full scale in accordance with the actual construction configuration, adopting a layered structure of steel + concrete + steel for the tunnel lining. The physical parameters of these materials used in the model are summarized in Table 2.
Table 2.
Selection of wall materials and parameters for the tunnel and carriage.
Consistent with the fire parameters used in the full-scale fire tests at the entrance section of the Shenzhen–Zhongshan immersed tunnel, the FDS simulations employed a liquid fuel burner positioned along the centerline of the ultra-wide tunnel cross-section. The reaction fuel was specified as METHANOL using the NIST-validated combustion mechanism, and all combustion related parameters were taken from the NIST-verified default dataset [24,25]. In addition, FDS Devices with the output quantity set to TEMPERATURE were used to represent thermocouples, and their spatial arrangement precisely replicated the 1:1 layout of temperature measurement points in the full-scale fire experiments. The ambient temperature was set to 20 °C, and the ambient pressure was maintained at standard atmospheric levels (101.325 kPa) to ensure consistency between the numerical simulations and experimental conditions. A total of seven fire scenarios were developed. These scenarios were designed, on the one hand, to correspond 1:1 with the full-scale fire experiments conducted in the Shenzhen–Zhongshan undersea tunnel, and on the other hand, to examine conditions with increased heat release rates based on the same geometric scale. The specific simulation scenarios are summarized as shown in Table 3.
Table 3.
Summary of fire simulation codes and parameters.
For the grid configuration in FDS, the characteristic fire diameter D* was used to determine the appropriate mesh size range. The characteristic diameter D* was calculated using the following equation [25]:
In this study, the maximum heat release rate does not exceed 50 MW. Based on Equation (2), the corresponding characteristic diameter D* is no greater than 1.84. The dimensionless expression D*/δx serves as the basis for determining the FDS mesh size. Previous studies have recommended maintaining the dimensionless ratio D*/δx within the range of 5 to 10 [26,27]. Accordingly, for a heat release rate of 50 MW, the recommended mesh size δx for the numerical simulations in this study falls within 0.184 m to 0.368 m. To further assess grid sensitivity and determine an appropriate mesh resolution, mesh sizes of 0.10 m, 0.15 m, and 0.20 m were selected for comparative simulations. The temperature results obtained under a 50 MW fire condition using different mesh resolutions are shown in Figure 8.
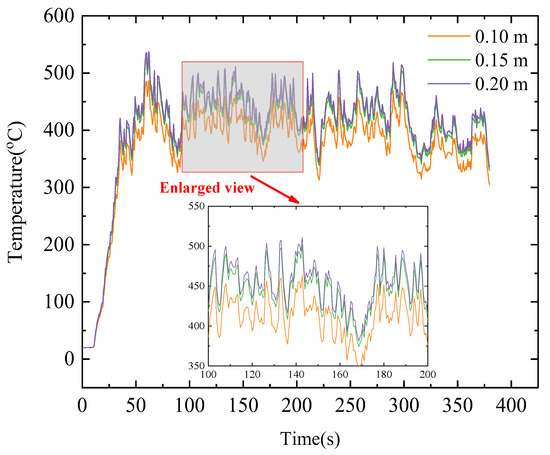
Figure 8.
Temperature data for different mesh resolutions under a 50 MW heat release rate.
As shown in Figure 8, when the mesh size δx is refined from 0.20 m to 0.10 m, the simulated temperature data exhibit a clear convergence trend. However, compared with the change from 0.20 m to 0.15 m, further refinement from 0.15 m to 0.10 m yields no significant differences in the temperature distribution curves, while the computational time increases substantially as the mesh becomes finer. Therefore, considering both computational accuracy and efficiency, a mesh size of 0.15 m was ultimately selected for the region near the fire. To further verify the accuracy of the numerical simulations, temperature rise curves at several characteristic measurement points under actual fire cases were compared with the corresponding FDS simulation results. For fire with heat release rates of 1 MW, 2 MW and 3 MW, the temperature rise curves obtained from experimental measurements (E1, E2 and E3) and numerical predictions (S1, S2 and S3) are shown in Figure 9. The comparison demonstrates that the FDS model established in this study can accurately capture both the trend and magnitude of the temperature rise. Hence, the numerical simulation results can be reliably used as a supplementary dataset to represent the temperature rise behavior of hot smoke in ultra-wide tunnel cross-sections.
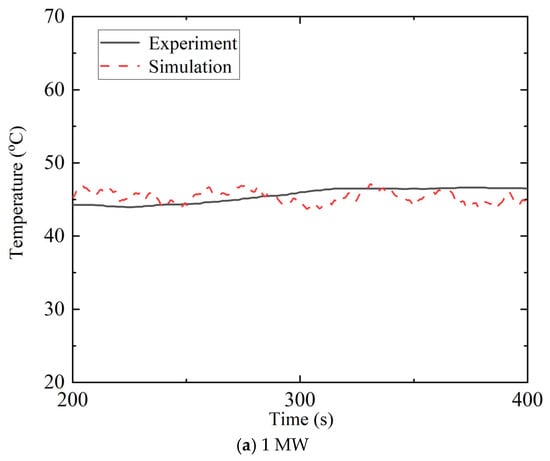
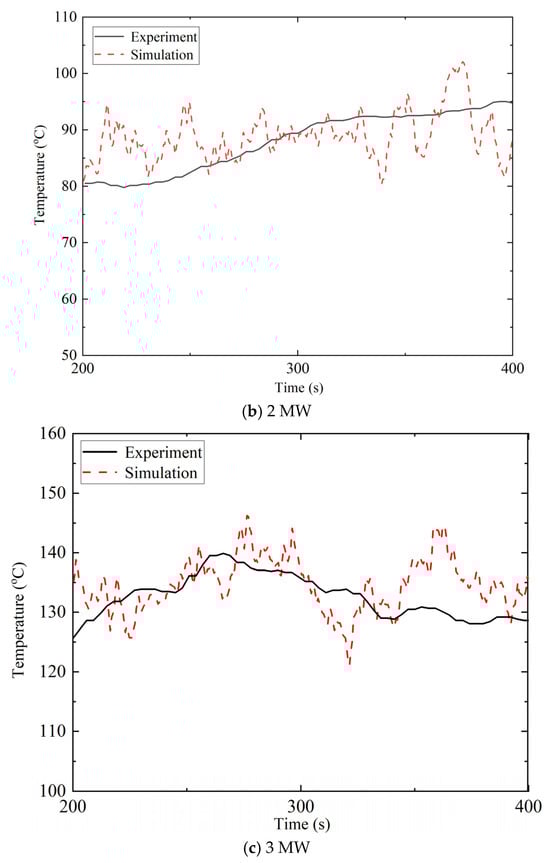
Figure 9.
Comparison of experimental and simulation results.
On the other hand, to minimize the simulation time while ensuring simulation accuracy, this study adopts a grid size of 0.15 m in the region near the fire source. In areas farther away from the fire source, a grid expansion principle is applied [25,26,28], gradually increasing the grid size to 0.60 m (seen in Table 4).
Table 4.
Determination of mesh characteristics.
3. Characteristics of Longitudinal Temperature Rise Data in Ultra-Wide Cross-Sections
In this study, the average temperature rise values during the steady burning stage were used for analysis. As described earlier, three groups of thermocouples were installed at each cross-section in the full-scale fire experiments of the Shenzhen–Zhongshan immersed tunnel, corresponding to the south side, north side, and centerline measurement points. This section extracts the average temperature rise data recorded at all measurement points in tests E1, E2, and E3 during the longitudinal propagation of hot smoke in the ultra-wide tunnel. These data are arranged according to their corresponding spatial coordinates and presented in Figure 10a–c. Furthermore, the lateral temperature rise ratio at the same longitudinal position is introduced and arranged as a function of the longitudinal distance from the fire, as shown in Figure 10d.
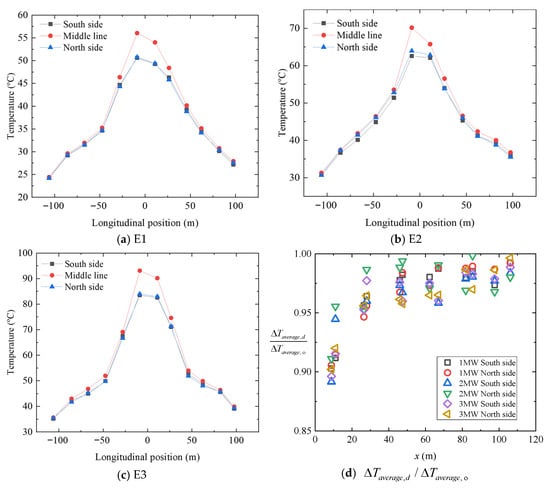
Figure 10.
Average temperature rise and lateral temperature-rise ratio in the full-scale experiments.
As shown in Figure 10, the average longitudinal temperature rise of hot smoke in the entrance section of the Shenzhen–Zhongshan undersea tunnel exhibits a typical exponential decay pattern, which is consistent with the conclusions of previous tunnel fire studies [9,17,29]. In addition, slight differences are observed between the exponential decay curves measured at the two lateral rows and those measured along the tunnel centerline. Specifically, the decay along the south and north sides is marginally weaker than that along the centerline. Moreover, clear lateral differences in temperature rise are present during the longitudinal diffusion of hot smoke in the ultra-wide tunnel. These differences gradually diminish as the longitudinal distance from the fire source x increases, and the lateral temperature rise ratio approaches 1 at sufficiently large longitudinal distances. The lateral temperature rise ratio also shows good convergence with respect to longitudinal position and does not change significantly with different experimental fire cases. This indicates that the lateral distribution characteristics of hot smoke temperature rise in an ultra-wide cross-section are essentially independent of the heat release rate.
To further investigate the lateral temperature rise characteristics at greater distances under the influence of an extremely high heat release rate, numerical scenario S7 (HRR = 50 MW) was selected for analysis. Temperature slices at steady state were extracted at locations far from the fire source (x = 300 m, 750 m, and 850 m), as shown in Figure 11. Despite the very high fire intensity (HRR = 50 MW) and the substantial distance from the fire, noticeable lateral variations in temperature rise remain present within the ultra-wide tunnel cross-section. However, these lateral differences gradually diminish as the hot smoke propagates longitudinally, which is consistent with the average temperature rise characteristics observed in the full-scale experiments.
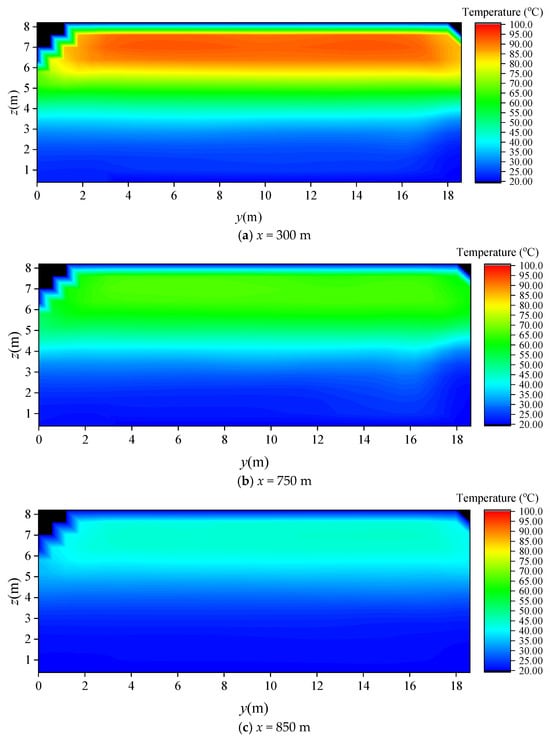
Figure 11.
Temperature field distribution under different fire locations.
4. Theoretical Analysis of Longitudinal Temperature Rise in Ultra-Wide Cross-Sections
4.1. Lateral Temperature Differences
For the longitudinal spread of fire smoke in an ultra-wide tunnel, the lateral variation in average smoke temperature within any cross-section cannot be neglected. As indicated by the temperature features in the numerical temperature slices, the lateral temperature rise ratio within a given cross-section is influenced not only by the flow and heat transfer characteristics of the hot smoke, but also by the coupling effects of three factors: the average temperature rise at the center point of the cross-section , the longitudinal distance from the fire x, and the lateral distance d. Accordingly, the characterization equation for the lateral temperature rise ratio of hot smoke in an ultra-wide tunnel cross-section can be expressed in the following form:
In Equation (3), k is a coefficient determined by the actual fire environment and the smoke spread characteristics, representing the flow and heat transfer properties of the hot smoke. Based on the energy conservation equation for smoke flow in a confined and elongated tunnel, Hu et al. [17] developed a longitudinal decay model for the temperature rise of hot smoke using experimental data, as expressed below.
In Equation (4), xo denotes the longitudinal distance of the reference point from the fire, and represents the temperature rise of smoke at the reference point. Furthermore, based on the derivation from the energy conservation equation, Hu et al. assigned a physical interpretation to the coefficient k, as given below [17,30].
In this expression, α denotes the heat loss coefficient during the propagation of hot smoke, Wp is the boundary length along which the hot smoke layer exchanges heat with the ambient environment, and Cp represents the specific heat capacity of the hot smoke at constant pressure. denotes the mass flow rate associated with the one-dimensional spread of smoke, which can be regarded as approximately constant [17,31]. Considering that, in both the experiments and simulations, neither continuous nor intermittent flames in the fire plume reached the tunnel ceiling, the reference point in Equation (4) can be taken at the fire location, that is, xo = 0 m. From a longitudinal perspective, the temperature rise of hot smoke at any position x along the tunnel and any lateral location d within an ultra-wide cross-section can be simplified as the result of a one-dimensional ceiling jet motion from the fire to that point, as illustrated in Figure 12 below.
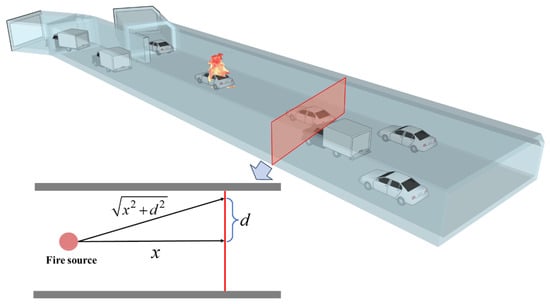
Figure 12.
One-dimensional ceiling jet motion from the fire to a point.
Based on the simplified principle of one-dimensional ceiling jet motion in an ultra-wide tunnel cross-section, the longitudinal decay model of hot smoke temperature rise (Equation (4)) can be incorporated into Equation (3) to explicitly characterize the lateral temperature rise ratio at any longitudinal cross-section in terms of differences in hot smoke spread distance. Moreover, during the simplified one-dimensional jet motion, the flow and heat transfer characteristics of the hot smoke remain relatively stable [10,31,32]. Therefore, the coefficient k is treated as a constant in this study. Accordingly, Equation (3) can be rewritten in the following form:
Equation (6) describes the lateral distribution ratio of hot smoke temperature rise at each longitudinal cross-section in an ultra-wide tunnel. Notably, Equation (6) does not contain the heat release rate, indicating that the lateral temperature rise distribution at any longitudinal position is independent of the heat release rate. To verify the rationality of Equation (6), validated numerical simulation data were substituted into both sides of the equation along with the corresponding spatial coordinates. This generated a large number of data points covering four heat release rates (10 MW, 20 MW, 30 MW, and 50 MW) and twelve longitudinal positions (5.4 m, 6.6 m, 11.9 m, 12.1 m, 20.7 m, 28.8 m, 28.9 m, 34.7 m, 37.6 m, 41.8 m, 46.1 m, and 64.3 m), as shown in Figure 13.
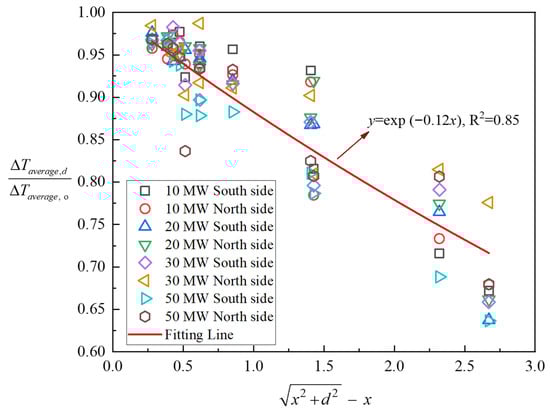
Figure 13.
Lateral temperature rise ratios at different heat release rates and longitudinal locations.
Despite the use of different heat release rates and longitudinal cross-sections, the data points calculated from Equation (6) exhibit a clear convergence trend, demonstrating the validity of the formulation proposed in this study. In addition, the data points follow a convergent exponential pattern. Based on this observation, the numerical data were fitted using an exponential function of the form y = ex (R2 = 0.85). The resulting fitted relationship is expressed in Equation (7).
In Equation (7), the coefficient k = −0.12 m−1 is determined to be based on the fitting results. Although this value differs from those reported in previous studies [17,30,33], the discrepancy is reasonable and acceptable. The spread behavior (i.e., ) and heat transfer boundary conditions (i.e., α and Wp) of hot smoke in an ultra-wide tunnel differ substantially from those in traditional tunnels. Moreover, the simplified one-dimensional ceiling jet proposed in this study neglects the reflection effects from tunnel walls. These differences collectively account for the variation in the obtained coefficient.
4.2. Longitudinal Temperature Rise Decay
The assumption of homogenized hot smoke forms the basis for modeling the longitudinal decay of temperature rise. However, in an ultra-wide tunnel cross-section, lateral variations in smoke parameters during longitudinal propagation cannot be ignored. Therefore, the modeling process must be carried out only after fully evaluating these lateral differences and selecting an appropriate control volume for the hot smoke. Based on the lateral distribution model of the temperature-rise ratio developed in the previous section (Equation (7)), a two-dimensional planar distribution map of the hot smoke temperature rise ratio in the ultra-wide tunnel was generated, as shown in Figure 14.
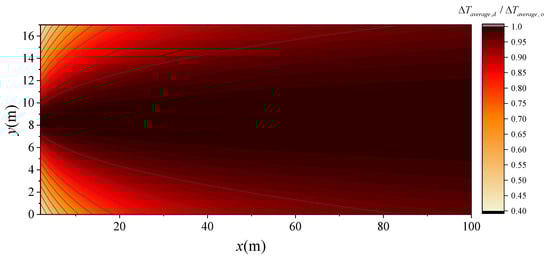
Figure 14.
Two-dimensional planar distribution map of the hot smoke temperature rise ratio in the ultra-wide tunnel.
The temperature rise ratio is more concentrated near the tunnel centerline than at the lateral regions of the ultra-wide cross-section, indicating smaller lateral variations in this area. In contrast, closer to the fire source, the lateral differences in the temperature rise ratio become increasingly pronounced. Therefore, when selecting the control volume for applying the conservation equation, particular attention must be given to the temperature variations in the near fire region. Following the homogenization criteria adopted in previous studies [9,18], the region defined by is selected as the boundary of the hot smoke control volume in this study. With respect to modeling the longitudinal decay of temperature rise, existing studies offer valuable theoretical guidance. Based on the assumption of homogenized hot smoke and the application of the conservation equation, Delichatsios et al. [29] developed a model describing the longitudinal decay of average hot-smoke temperature in confined spaces, as expressed below.
In Equation (8), H is the tunnel ceiling height (6.7 m in this study), and x is the longitudinal distance from the fire. St denotes the Stanton number, while hc/(Cpρu) reflects the ratio of heat received by the hot smoke to its own heat capacity and lb represents one-half of the width of the one-dimensional ceiling jet flow channel, which, in this study, corresponds to the lateral extent of the control volume selected for the hot smoke conservation equation. As described earlier, the boundary of the control volume is determined based on the lateral distribution of temperature-rise ratio . Considering the fire size and the radial flow behavior of the jet in the near fire region, the point at x = 2 m is selected as the starting (reference point) position for modeling the longitudinal decay of hot smoke temperature rise. Using Equation (7), the value of lb in this study is calculated to be approximately 1.8 m. In addition, ΔTf denotes the temperature rise of hot smoke directly beneath the ceiling above fire source, which can be evaluated using the ceiling temperature rise correlation proposed by Li et al. [34], given as follows:
where V′ is dimensionless ventilation velocity, which is determined by ventilation velocity, fire source and other environmental parameters [34]. Considering that there is no longitudinal ventilation inside the tunnel during the experiment, it can be determined that dimensionless ventilation velocity V′ is less than 0.19. Thus, we adopt the form of Equation (9) for , that is .
By substituting Equation (9) into Equation (8), the longitudinal decay model for the average hot smoke temperature rise along the tunnel centerline in this study can be expressed as follows:
To verify the reliability of the longitudinal decay model for the average hot smoke temperature rise proposed in this study, the temperature rise data (including the corresponding spatial coordinates) obtained from the numerical simulations at positions near the center of the tunnel were substituted into Equation (10). The resulting data points, calculated from both sides of Equation (10), are presented as shown in Figure 15.
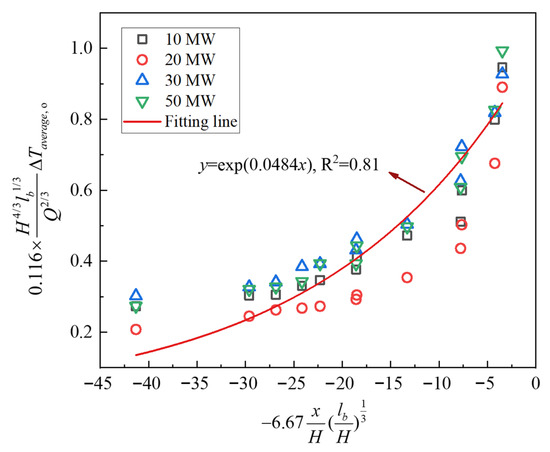
Figure 15.
Longitudinal decay model validation for the average hot smoke temperature rise.
Although different heat release rates (10 MW, 20 MW, 30 MW, and 50 MW) were used, the data points calculated from Equation (10) still exhibit strong convergence. Based on the fitted curve of these data points, St = 0.0484 is determined in this study for the hot smoke flow. According to previous studies, Delichatsios et al. [29] reported a Stanton number of St = 0.03, which is slightly lower than the value obtained in this work. Compared with the confined and slender spaces considered in earlier studies [29], the ultra-wide cross-section of the tunnel in this study leads to relatively lower smoke flow velocities. As a result, the slightly higher Stanton number obtained here is reasonable and acceptable.
4.3. Two-Dimensional Longitudinal Prediction of Hot Smoke Temperature Rise in Ultra-Wide Tunnel Cross-Sections
Based on the lateral temperature rise ratio model (Equation (7)) and the longitudinal decay model for the centerline average temperature rise (Equation (10)) developed in the previous sections, a two-dimensional longitudinal prediction framework for hot smoke temperature rise in ultra-wide tunnel cross-sections can be established as follows:
- Obtain the heat release rate Q, and substitute it into Equation (10) together with St = 0.0484 and lb = 1.8 m. This yields the decay behavior of the average hot smoke temperature rise along the longitudinal position x under the specified heat release rate.
- For each longitudinal position x, the lateral distribution of the hot-smoke temperature-rise ratio within the corresponding cross-section is calculated, thereby obtaining the proportional relationship between and at any lateral coordinate y under a fixed x.
- By combining the relationship between and x obtained in Step a and the relationship between and at different x obtained in Step b, the value of at any coordinate x, y can be determined.
Based on the above prediction framework, the temperature rise of hot smoke at any longitudinal and lateral position within an ultra-wide tunnel under natural ventilation can be determined. To validate the proposed two-dimensional longitudinal prediction model for hot smoke temperature rise, experimental data obtained from actual full-scale fire scenarios were used for verification. In this study, three sets of full-scale fire experiment data from the ultra-wide tunnel, corresponding to fire heat release rates of 1 MW, 2 MW, and 3 MW, which were selected for comparison, as shown in Figure 16.
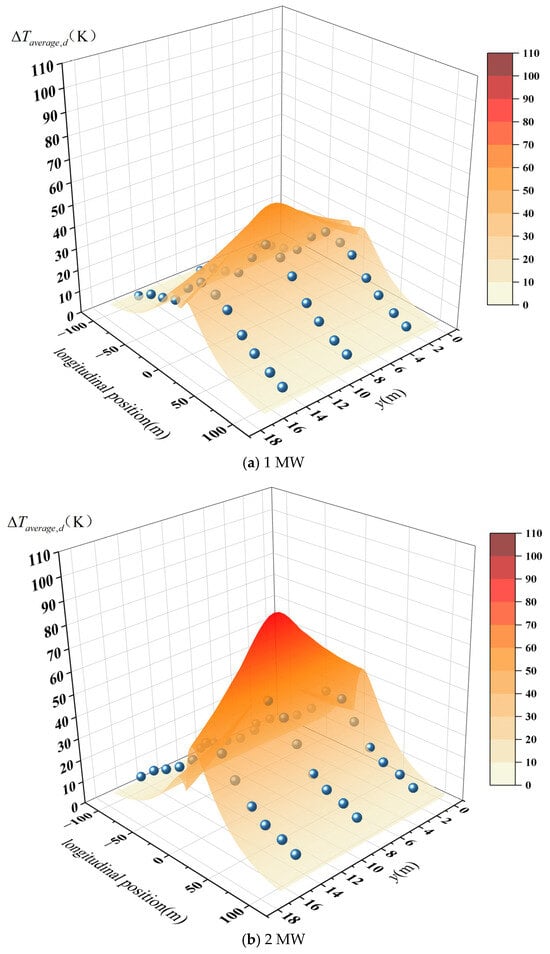
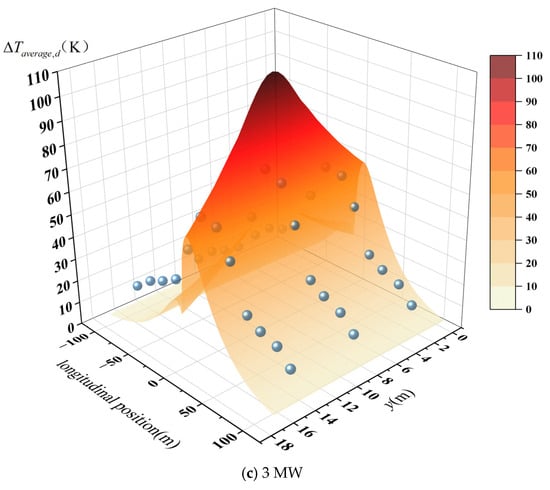
Figure 16.
Hot smoke temperature rise under different heat release rates.
When the measured temperature rise data from the full-scale fire tests in the ultra-wide tunnel cross-section were substituted into the prediction framework, the two-dimensional temperature rise model developed in this study (three-dimensional surface) exhibited good agreement and overlap with the experimental data (blue spheres). This demonstrates the validity of the proposed model. To further assess the prediction accuracy, a scatter comparison between the measured and predicted values was conducted. As illustrated in Figure 17, the vast majority of data points are distributed near both sides of the standard reference line (red line), and most of them fall within the ±25% relative error boundary. This indicates that, after verification using full-scale fire experiments, the two-dimensional prediction model for longitudinal temperature rise in ultra-wide tunnel cross-sections achieves an accuracy within 25%. The data points with relatively larger deviations are primarily located in regions close to the fire, where temperature rise is high. In these regions, the predicted temperature tends to be slightly higher than the measured values. This bias may be attributed to the homogenization assumption adopted when characterizing the longitudinal decay of centerline temperature rise. As shown in the previous section, lateral variations in temperature-rise ratio become more pronounced closer to the fire-plume region. However, Equation (10), which forms the basis of the centerline decay model, assumes lateral uniformity of jet parameters and does not account for lateral heat and mass transfer, especially near the fire. Consequently, Equation (10) overestimates the centerline temperature rise near the fire, which further leads to higher predicted values in the two-dimensional framework. Despite these localized deviations, the two-dimensional prediction model proposed in this study demonstrates strong applicability and robustness for estimating hot smoke temperature rise in ultra-wide tunnel cross-sections.
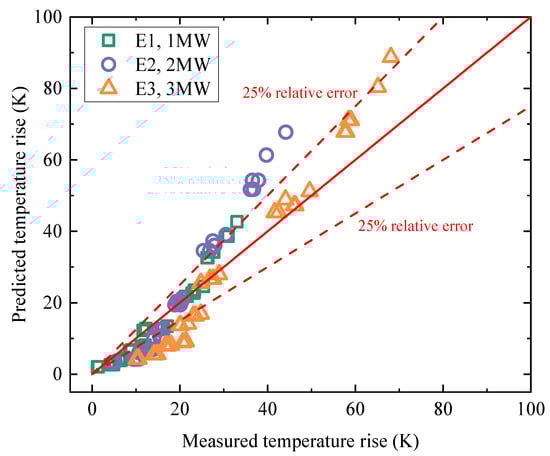
Figure 17.
Comparison between measured and predicted temperature rise.
With the discussion above, the proposed two-dimensional temperature rise prediction framework may lose prediction accuracy when investigating transverse temperature attenuation near fire plume. In addition, considering that both the experimental tests and numerical simulations in this study are conducted with the fire source located at the center of the tunnel, the proposed two-dimensional prediction model is primarily applicable to scenarios with centrally located fire sources. When applied to conditions involving lateral displacement of the fire source, deviations in the predicted temperature rise may occur. In particular, for fire sources located close to the side walls, wall-induced jet reflection effects can enhance flow disturbance and heat accumulation, thereby increasing the prediction uncertainty. Nevertheless, within its intended application range, the model provides reliable and engineering-acceptable predictions of the longitudinal temperature evolution.
5. Conclusions
In this study, the undersea tunnel of the Shenzhen–Zhongshan Link was selected as the research object. Full-scale fire experiments and FDS numerical simulations were conducted to systematically investigate the longitudinal decay and lateral distribution characteristics of hot smoke temperature rise in an ultra-wide tunnel cross-section (entrance section of the immersed tunnel). Corresponding characterization models were developed, and a two-dimensional longitudinal prediction framework for hot-smoke temperature rise was established. The main conclusions are as follows:
- (1)
- The influencing factors governing the lateral distribution of hot smoke temperature rise in an ultra-wide tunnel cross-section were analyzed, and it was verified that the lateral temperature rise distribution is independent of the heat release rate. Based on the simplified one-dimensional jet flow motion in an ultra-wide cross-section, differences in hot smoke diffusion distance were used to represent the lateral temperature rise ratio at any longitudinal position. A corresponding lateral temperature rise ratio distribution model was developed (Equation (7)).
- (2)
- Using the lateral temperature rise ratio characteristics at each longitudinal cross-section, an appropriate boundary was selected for defining the control volume of the longitudinally propagating hot smoke. The one-dimensional average temperature rise decay model was reformulated, and a modified longitudinal decay model applicable to the centerline of an ultra-wide tunnel was proposed (Equation (10)). Validation results indicate that the Stanton number in this model is St = 0.0484, consistent with values reported in previous studies.
- (3)
- By integrating Equations (7) and (10), a two-dimensional longitudinal prediction framework for hot smoke temperature rise in an ultra-wide tunnel was constructed. This framework enables prediction of temperature rise at any longitudinal and lateral position within the entrance section of the Shenzhen–Zhongshan undersea tunnel under natural ventilation. Verification using full-scale fire experiments shows that the proposed two-dimensional prediction model achieves an accuracy within 25%.
Author Contributions
Conceptualization, X.Y. and M.Z.; methodology, X.Y. and R.P.; software, X.Y.; validation, X.Y., C.R. and M.Z.; formal analysis, R.P.; investigation, X.Y., C.R., R.P. and M.Z.; resources, X.Y.; data curation, X.Y.; writing—original draft preparation, R.P.; writing—review and editing, X.Y., M.Z. and R.P.; visualization, X.Y.; supervision, M.Z., X.Y., R.P. and C.R.; project administration, M.Z.; funding acquisition, X.Y. and M.Z. All authors have read and agreed to the published version of the manuscript.
Funding
The authors gratefully acknowledge funding from the National Natural Science Foundation of China (52374210, 52304234) and Beijing Natural Science Foundation (L259032).
Institutional Review Board Statement
Not applicable.
Informed Consent Statement
Not applicable.
Data Availability Statement
The original contributions presented in this study are included in the article. Further inquiries can be directed to the corresponding author.
Conflicts of Interest
The authors declare no conflicts of interest.
References
- Yuan, X.; Zhong, M.; Pan, R.; Yue, S.; Cheng, L. Smoke exhaust system design and full-scale fire experimental study of the Shenzhen-Zhongshan link immersed tunnel. Exp. Technol. Manag. 2025, 42, 1–8. [Google Scholar]
- Ingason, H.; Li, Y.Z.; Lönnermark, A. Gas Temperatures. In Tunnel Fire Dynamics; Ingason, H., Li, Y.Z., Lönnermark, A., Eds.; Springer: New York, NY, USA, 2015; pp. 207–231. [Google Scholar]
- Shi, C.; Li, J.; Xu, X. Full-scale tests on smoke temperature distribution in long-large subway tunnels with longitudinal mechanical ventilation. Tunn. Undergr. Space Technol. 2021, 109, 103784. [Google Scholar] [CrossRef]
- Oka, Y.; Oka, H. Velocity and temperature attenuation of a ceiling-jet along a horizontal tunnel with a flat ceiling and natural ventilation. Tunn. Undergr. Space Technol. 2016, 56, 79–89. [Google Scholar] [CrossRef]
- Guo, Q.; Li, Y.Z.; Ingason, H.; Yan, Z.; Zhu, H. Theoretical studies on buoyancy-driven ceiling jets of tunnel fires with natural ventilation. Fire Saf. J. 2020, 119, 103228. [Google Scholar] [CrossRef]
- Tanno, A.; Oka, H.; Kamiya, K.; Oka, Y. Determination of smoke layer thickness using vertical temperature distribution in tunnel fires under natural ventilation. Tunn. Undergr. Space Technol. 2022, 119, 104257. [Google Scholar] [CrossRef]
- Guo, Q.; Li, Y.Z.; Ingason, H.; Yan, Z.; Zhu, H. Numerical study on thermally driven smoke flow characteristics in long tunnels under natural ventilation. Int. J. Therm. Sci. 2023, 192, 108379. [Google Scholar] [CrossRef]
- Ye, K.; Tang, X.; Zheng, Y.; Ju, X.; Peng, Y.; Liu, H.; Wang, D.; Cao, B.; Yang, L. Estimating the two-dimensional thermal environment generated by strong fire plumes in an urban utility tunnel. Process. Saf. Environ. Prot. 2021, 148, 737–750. [Google Scholar] [CrossRef]
- Ye, K.; Zhou, X.; Zheng, Y.; Liu, H.; Tang, X.; Cao, B.; Huang, Y.; Chen, Y.; Yang, L. Estimating the longitudinal maximum gas temperature attenuation of ceiling jet flows generated by strong fire plumes in an urban utility tunnel. Int. J. Therm. Sci. 2019, 142, 434–448. [Google Scholar] [CrossRef]
- Pan, R.; Zhu, G.; Xu, G.; Liu, X. Experimental analysis on burning rate and temperature profile produced by pool fire in a curved tunnel as a function of fire location. Process. Saf. Environ. Prot. 2021, 152, 549–567. [Google Scholar] [CrossRef]
- Oka, Y.; Oka, H.; Imazeki, O. Ceiling-jet thickness and vertical distribution along flat-ceilinged horizontal tunnel with natural ventilation. Tunn. Undergr. Space Technol. 2016, 53, 68–77. [Google Scholar] [CrossRef]
- Oka, Y.; Kakae, N.; Imazeki, O.; Inagaki, K. Temperature Property of Ceiling Jet in an Inclined Tunnel. Procedia Eng. 2013, 62, 234–241. [Google Scholar] [CrossRef]
- Li, J.; Li, Y.; Li, J.; Zhong, H.; Zhao, J.; Xu, D. Experimental analysis of the effect of the ramp slopes on the maximum exceedance temperature in a branched tunnel fire. Tunn. Undergr. Space Technol. 2023, 131, 104829. [Google Scholar] [CrossRef]
- Li, Z.; Gao, Y.; Li, X.; Mao, P.; Zhang, Y.; Jin, K.; Li, T.; Chen, L. Effects of transverse fire locations on flame length and temperature distribution in a bifurcated tunnel fire. Tunn. Undergr. Space Technol. 2021, 112, 103893. [Google Scholar] [CrossRef]
- Huang, Y.; Li, Y.; Li, J.; Li, J.; Wu, K.; Zhu, K.; Li, H. Experimental investigation on maximum gas temperature beneath the ceiling in a branched tunnel fire. Int. J. Therm. Sci. 2019, 145, 105997. [Google Scholar] [CrossRef]
- Ji, J.; Fan, C.; Zhong, W.; Shen, X.; Sun, J. Experimental investigation on influence of different transverse fire locations on maximum smoke temperature under the tunnel ceiling. Int. J. Heat Mass Transf. 2012, 55, 4817–4826. [Google Scholar] [CrossRef]
- Hu, L.H.; Huo, R.; Chow, W.K. Studies on buoyancy-driven back-layering flow in tunnel fires. Exp. Therm. Fluid Sci. 2008, 32, 1468–1483. [Google Scholar] [CrossRef]
- Pan, R.; Hostikka, S.; Zhu, G.; Xu, G.; Liu, X. Two-Dimensional Analysis on Ceiling Jet Temperature Characteristics in a Semicircular Tunnel. Fire Technol. 2021, 58, 959–990. [Google Scholar] [CrossRef]
- Cheng, H.; Liu, C.; Chen, J.; Wu, L.; Zhao, Y.; Zhong, M. Full-scale experimental study on fire under natural ventilation in the T-shaped and curved tunnel groups. Tunn. Undergr. Space Technol. 2022, 123, 104442. [Google Scholar] [CrossRef]
- Qiu, P.; Long, Z.; Liu, C.; Yang, Y.; Tian, X.; Zhong, M. Full-scale experiment on smoke propagation in metro station tunnel fire under opening the platform screen doors. Tunn. Undergr. Space Technol. 2021, 107, 103662. [Google Scholar] [CrossRef]
- Hamins, A.P.; Yang, J.C.; Kashiwagi, T. Global Model for Predicting the Burning Rates of Liquid Pool Fires (NISTIR 6381); National Institute of Standards and Technology: Gaithersburg, MD, USA, 1999. [Google Scholar]
- Yue, S.; Long, Z.; Qiu, P.; Zhong, M.; Hua, F. Full-scale experimental study on single-end tunnel fires. J. Tsinghua Univ. (Sci. Technol.) 2023, 63, 917–925. [Google Scholar]
- Hurley, M.J.; Gottuk, D.; Hall, J.R.; Harada, K.; Kuligowski, E.; Puchovsky, M.; Torero, J.; Watts, J.M.; Wieczorek, C. SFPE Handbook of Fire Protection Engineering; Springer: New York, NY, USA, 2016; pp. 487–500. [Google Scholar]
- McGrattan, K.; Hostikka, S.; McDermott, R.; Floyd, J.; Weinschenk, C.; Overholt, K. Fire Dynamics Simulator Technical Reference Guide Volume 3: Validation; NIST Special Publication; National Institute of Standards and Technology: Gaithersburg, MD, USA, 2013; Volume 1018. [Google Scholar]
- McGrattan, K.; Hostikka, S.; McDermott, R.; Floyd, J.; Weinschenk, C.; Overholt, K. Fire Dynamics Simulator User’s Guide; NIST special publication; National Institute of Standards and Technology: Gaithersburg, MD, USA, 2013; Volume 1019. [Google Scholar]
- Pan, R.; Hostikka, S.; Zhu, G.; Wang, X.; Liu, X.; Wang, W.; Lan, M. Experimental investigation and numerical simulation of transverse heat flux attenuation during fire in utility tunnel. Tunn. Undergr. Space Technol. 2023, 142, 105411. [Google Scholar] [CrossRef]
- McGrattan, K.; McGrattan, K.; Hostikka, S.; McDermott, R.; Floyd, J.; Weinschenk, C.; Overholt, K. Fire Dynamics Simulator Technical Reference Guide Volume 1: Mathematical Model; NIST special publication; National Institute of Standards and Technology: Gaithersburg, MD, USA, 2013; Volume 1018, p. 175. [Google Scholar]
- Pan, R.; Gao, Z.; Chen, J.; Li, J. Two-dimensional investigation on extension flame boundary beneath curved ceiling produced by buoyancy fire plume in utility tunnel. Appl. Therm. Eng. 2026, 288, 129528. [Google Scholar] [CrossRef]
- Delichatsios, M.A. The flow of fire gases under a beamed ceiling. Combust. Flame 1981, 43, 1–10. [Google Scholar] [CrossRef]
- Pan, R.; Wang, Y.; Yue, S.; Ran, C.; Cheng, H.; Zhong, M. Full-scale experimental study on longitudinal smoke flow field characteristics in high-speed railway tunnels. J. Tsinghua Univ. (Sci. Technol.) 2024, 64, 1575–1586. [Google Scholar]
- Kunsch, J. Critical velocity and range of a fire-gas plume in a ventilated tunnel. Atmos. Environ. 1998, 33, 13–24. [Google Scholar] [CrossRef]
- Pan, R.; Zhu, G. Multi-dimensional investigation of ceiling jet temperature characteristics beneath curved ceiling produced by fire in the utility tunnel. Fire Saf. J. 2024, 146, 104143. [Google Scholar] [CrossRef]
- Tian, X.; Zhong, M.; Shi, C.; Zhang, P.; Liu, C. Full-scale tunnel fire experimental study of fire-induced smoke temperature profiles with methanol-gasoline blends. Appl. Therm. Eng. 2017, 116, 233–243. [Google Scholar] [CrossRef]
- Li, Y.Z.; Lei, B.; Ingason, H. The maximum temperature of buoyancy-driven smoke flow beneath the ceiling in tunnel fires. Fire Saf. J. 2011, 46, 204–210. [Google Scholar] [CrossRef]
Disclaimer/Publisher’s Note: The statements, opinions and data contained in all publications are solely those of the individual author(s) and contributor(s) and not of MDPI and/or the editor(s). MDPI and/or the editor(s) disclaim responsibility for any injury to people or property resulting from any ideas, methods, instructions or products referred to in the content. |
© 2026 by the authors. Licensee MDPI, Basel, Switzerland. This article is an open access article distributed under the terms and conditions of the Creative Commons Attribution (CC BY) license.