Abstract
Fire is a key driver of ecosystem dynamics under global change, and understanding its complex relationship with the climate system is crucial for regional wildfire risk management and the development of ecological adaptation strategies. The western United States is a critical region for studying fire–climate interactions due to its pronounced environmental gradients, diverse fire regimes, and high vulnerability to climate change, which together provide a robust natural laboratory for examining spatial variability in fire responses. Based on tree-ring fire-scar records systematically collected from five major ecoregions in the western United States via the International Tree-Ring Data Bank (ITRDB), this study reconstructed fire history sequences spanning 430–454 years. By integrating methods such as correlation analysis, random forest regression, superposed epoch analysis, and effect size assessment, we systematically revealed the spatial differentiation patterns of fire frequency and fire spatial extent across different ecoregions, quantified the relative contributions of key climatic drivers, and identified climatic anomaly characteristics during extreme fire years. The results indicate that: (1) there are significant differences in fire frequency between different ecological areas; (2) summer drought conditions (PDSI) are the most consistent and strongest driver of fire across all ecoregions, and ENSO (NINO3) also shows a widespread negative correlation; (3) random forest models indicate that the Sierra Nevada and Madrean Archipelago ecoregions are the most sensitive to multiple climatic factors, while fire in regions such as the Northern Rockies may be more regulated by non-climatic processes; (4) extreme fire years across all ecoregions are associated with significant negative PDSI anomalies with prominent effect sizes, confirming that severe drought is the dominant cross-regional precondition for extreme fire events. This study emphasizes the region-specific nature of fire–climate relationships and provides a scientific basis for developing differentiated, ecoregion-specific fire prediction models and prevention strategies. The methodological framework and findings offer valuable insights for fire regime studies in other global forest ecosystems facing similar climate challenges.
1. Introduction
Fire, as a critical disturbance agent in natural ecosystems, plays a vital role in shaping landscape structure, maintaining biodiversity, and regulating nutrient cycling [1]. However, against the backdrop of global climate change, fire activity in the western United States has shown a significant intensifying trend, characterized by increased fire frequency, expanded burned area, and prolonged fire seasons [2]. These changes not only threaten ecosystem stability but also pose serious risks to human societies.
Understanding the complex relationships between fire activity and climatic factors is fundamental for predicting future fire dynamics. Direct climatic drivers such as temperature, precipitation patterns, and drought intensity regulate fire activity by influencing fuel moisture, fuel accumulation, and ignition probability [3]. Furthermore, large-scale ocean–atmosphere circulation patterns, including the El Niño-Southern Oscillation (ENSO), Atlantic Multidecadal Oscillation (AMO), and Pacific Decadal Oscillation (PDO), indirectly influence fire regimes by modulating regional climate variability [4,5]. Nonetheless, significant knowledge gaps remain regarding the relative importance of these climatic drivers and their interaction mechanisms across different ecoregions.
While numerous studies have reconstructed fire histories within individual ecoregions, a systematic, comparative analysis across a wide environmental gradient is lacking [6]. Current research status is thus fragmented, with limited understanding of how fire frequency and size are coordinated or divergent across regions. A key challenge is to integrate disparate fire-scar records into a unified analytical framework to distinguish regional-specific patterns from broader, climate-driven synchronies [7]. Previous research has largely relied on correlation analyses to identify key drivers. However, the collinear nature of climate variables (e.g., temperature and drought indices) poses a significant challenge. The current research status lacks a robust quantification of each driver’s unique contribution, and the challenge lies in employing advanced statistical models (e.g., machine learning) to disentangle these complex, interacting influences and assess their relative importance [8]. It is increasingly recognized that fire response to climate may be non-linear, with critical thresholds beyond which fire activity abruptly increases [9]. The current research status is predominantly qualitative, with few studies quantitatively identifying these tipping points. A major challenge is to move beyond linear assumptions and develop methods to detect and statistically validate such thresholds within century-long time series. Existing fire risk models often rely on linear relationships between climate and fire activity [10]. The current challenge is to integrate the newly quantified non-linear responses and threshold effects into a more mechanistic and reliable predictive framework. This is crucial for projecting future fire risks under novel climate conditions that may exceed historical ranges of variability.
The forest ecosystem of the western United States constitutes a region of exceptionally high environmental heterogeneity and complex ecological processes on the North American continent [11]. The humid coastal zone is characterized by dominant species such as Sequoia sempervirens and Pseudotsuga menziesii. These forests exhibit extremely high stand biomass, with dense understory vegetation where ferns and shade-tolerant shrubs flourish [12]. In the inland mountainous regions, distinct elevational zonation is evident: low-altitude areas are dominated by interior Pseudotsuga menziesii and Pinus ponderosa; mid-altitude zones are characterized by Pinus lambertiana, Sequoiadendron giganteum, and Abies concolor; while high-altitude areas transition to cold-tolerant forests of Picea engelmannii, Abies lasiocarpa, and Pinus contorta [13]. The arid interior forests have Pinus ponderosa and Pinus jeffreyi as their main constructive species. These forests feature sparse canopies and dry understories, reflecting an adaptation to periodic water stress and a fire regime historically characterized by frequent, low-intensity fires [14]. This pronounced beta diversity makes the Western forests a natural laboratory for studying biogeochemical cycles, community assembly, and disturbance ecology, especially in the context of modern climate change [15]. The western United States constitutes a critical domain for investigating fire–climate interactions, a status underpinned by several compelling factors: (1) its pronounced environmental gradients compressed over relatively short geographical distances; (2) its diverse fire regimes, which span frequent, low-severity surface fires to episodic, high-severity crown fires; (3) a well-documented, significant intensification of fire activity in recent decades, establishing it as a global hotspot for climate-fire research; and (4) the extensive archive of well-documented tree-ring fire-scar records across its multiple ecoregions, which provides unprecedented opportunities for robust comparative analysis. While fire regimes in other global regions undoubtedly warrant similar scrutiny, the western U.S. serves as a strategic model system—a vast natural laboratory where the interplay between climatic variability and fire activity can be dissected across fundamentally different ecological settings within a unified geographical and methodological framework.
Fire history reconstructions based on tree-ring fire-scar provide a unique data source for studying centennial-scale fire–climate relationships [16]. By analyzing tree-ring fire-scar records from five major ecoregions (including the Madrean Archipelago, Southern Rockies, Northern Rockies, Sierra Nevada and Wasatch and Uinta Mountains) in the western United States [17], this study aims to: (1) reveal the spatiotemporal patterns of fire activity across multiple ecoregions; (2) quantify the relative contributions of different climatic factors to fire activity; (3) identify threshold effects and non-linear responses to key climatic drivers; and (4) establish a climate-based predictive framework for fire risk. The findings will provide a scientific basis for regional-scale fire management, ecological conservation, and climate change adaptation strategies.
2. Research Methods and Data
2.1. Study Area
This study selected five major ecoregions in the western United States as the study area (Figure 1). The spatial extent encompasses the Madrean Archipelago (MA), Southern Rockies (SR), Northern Rockies (NR), Sierra Nevada (SN), and Wasatch and Uinta Mountains (WU), covering a total area of approximately 1.2 × 10⁶ km2. These regions form a distinct continuum of environmental heterogeneity along latitudinal and elevational gradients. The marked differentiation in their climate systems, topographic patterns, and vegetation assemblages provides an ideal natural experimental platform for analyzing the spatial variation patterns of wildfire history [18]. The comparative framework across these ecoregions allows for a robust examination of how fire regimes and their climatic drivers vary across fundamentally different environmental settings.
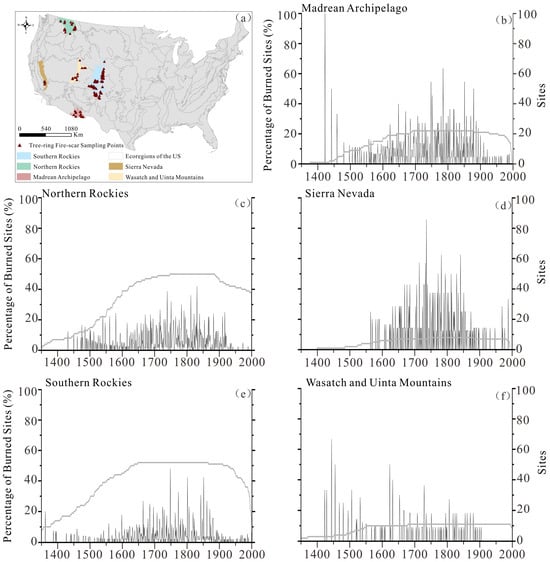
Figure 1.
Fire history study sites and chronologies across five ecoregions in the western United States. (a) Distribution of tree-ring fire-scar sampling sites; and fire chronologies of (b) Madrean Archipelago, (c) Southern Rockies, (d) Northern Rockies, (e) Sierra Nevada, (f) Wasatch and Uinta Mountains in the western United States.
The MA ecoregion is characterized by its unique “Sky Island” topography, where isolated mountain ranges with elevations of 900–3000 m are interspersed by extensive arid basins, creating a typical habitat fragmentation pattern [19]. Dominated by the North American Monsoon system, this region features an arid to semi-arid climate with mean annual precipitation ranging from 300 to 800 mm, exhibiting a distinct bimodal distribution (winter precipitation + summer monsoon rainfall) [20]. This unique precipitation pattern results in a fire season concentrated in the extremely dry period of May–June, preceding the monsoon arrival. The vegetation is primarily composed of drought-tolerant oak–pine woodlands and desert shrubs, forming a highly flammable fuel continuum [21].
The SR ecoregion, a high-elevation uplift of the Cordilleran system, is under strong continental climate influence [18]. The precipitation pattern shows a clear west-to-east decrease (400–1000 mm), with winter snowfall dominating the water balance [22]. This climate supports the development of mixed forests of Ponderosa Pine (Pinus ponderosa) and Subalpine fir, resulting in complex stand structures and fuel distribution patterns [23].
The NR ecoregion (elevation 800–3900 m) extends northward, marked by intensely glaciated mountains and broad river valleys [24]. Under cool and moist climatic conditions, the mean annual precipitation reaches 500–1500 mm with relatively even seasonal distribution [25]. Deep winter snowpack significantly delays the drying process of fuels at the beginning of the growing season, critically influencing the initiation timing of the fire risk season [15]. The main vegetation types include Lodgepole Pine (Pinus contorta) and Pinus monticola forests, forming extensive areas of continuous fuel distribution [26].
The SN ecoregion exhibits a strong topographic contrast between its steep western slope and gentle eastern slope (elevation 300–4400 m) [27]. Characteristic Mediterranean climate results in precipitation being highly concentrated in winter (500–2000 mm), while the summer drought period can last for 4–6 months [28]. Vegetation shows significant differentiation along the elevation gradient: highly flammable chaparral shrubs dominate at lower elevations, transitioning to forests of Jeffrey Pine (Pinus jeffreyi) and Giant Sequoia (Sequoiadendron giganteum) at mid to high elevations [29]. This vegetation pattern creates unique pathways for fire behavior propagation [30].
The WU ecoregion (elevation 1200–4100 m) is characterized by a combination of linear fault-block mountains and sedimentary basins [31]. Under a continental arid climate, precipitation shows a pronounced east–west gradient (300–1200 mm), with snowmelt from winter and spring storms dominating the regional hydrological processes [32]. The vegetation consists primarily of drought-tolerant juniper–pine (primarily Juniperus spp. and Pinus spp.) forest transition zones and alpine meadows, forming a patchy fuel distribution pattern [33].
Despite their distinct environmental characteristics, the five ecoregions share several fundamental features that collectively provide an ideal comparative framework for examining fire–climate relationships. All ecoregions are characterized by complex mountainous terrain that creates strong elevational gradients in temperature and precipitation, thereby influencing fuel production and distribution [25]. Seasonal precipitation patterns—whether dominated by winter snowpack, summer monsoons, or Mediterranean climate regimes—play a crucial role in determining the timing and duration of fire seasons across all regions [28]. Furthermore, drought emerges as a unifying climatic driver that transcends ecoregion boundaries, with moisture deficit consistently identified as a primary constraint on fire activity through its direct control on fuel flammability [34]. These shared characteristics, expressed through different combinations and intensities across the ecoregions, create a natural laboratory for investigating how similar climatic drivers manifest differently across varied ecological contexts, while maintaining sufficient commonality to support meaningful cross-system comparisons [7].
2.2. Research Data
2.2.1. Tree-Ring Fire-Scar Data
This study systematically collected all tree-ring fire-scar data for the five major ecoregions in the western United States from the International Tree-Ring Data Bank (ITRDB) [35]. It is important to note that these data are not newly collected for this study but represent a compilation of existing, publicly archived records. As the world’s largest public archive of tree-ring data, the ITRDB provided a standardized foundation for historical fire reconstruction. The distribution of sampling sites across the ecoregions is as follows: the MA ecoregion yielded 22 valid tree-ring fire-scar sampling sites, the NR contained 48 sites, the SN encompassed 8 sites, the SR had the largest number with 143 sites, and the WU ecoregion included 11 sites. These sampling sites provide uniform geographical coverage of the typical vegetation zones and topographic gradients within each ecoregion, ensuring the representativeness of the recorded fire events. All data underwent the ITRDB’s standardized quality control procedures, including cross-dating verification and consistency checks for fire event identification. The tree-ring fire-scar samples, by identifying features such as fire-induced traumatic resin ducts and characteristic scars, precisely recorded the calendar years of historical fire occurrences. To enhance the reliability of fire event identification, we only retained fire years that were recorded by at least two independent fire scars from the same site or adjacent sites. This conservative approach minimizes false positives caused by non-fire injuries (e.g., insect attacks or physical damage).
The selection of the International Tree-Ring Data Bank (ITRDB) was based on its status as the largest publicly accessible archive of tree-ring data, providing a standardized and quality-controlled foundation for cross-regional fire history comparisons. Although the spatial distribution of sampling sites is uneven (e.g., SR = 143 sites vs. SN = 8 sites), the ITRDB remains the most comprehensive source for multi-century fire scar records across the western U.S., enabling a spatially explicit and long-term perspective on fire–climate interactions.
2.2.2. Climate Data
This study utilized multiple paleoclimate reconstruction datasets to systematically assess the impact of historical climate variability on fire regimes. We employed the latest temperature reconstruction dataset for western North America published by King et al. (2024) [36]. This dataset provides gridded temperature series at a 0.5° × 0.5° spatial resolution, covering the period 1553–2020 CE, and achieves high-fidelity reconstruction of temperature variability across North America by assimilating multiple proxy records and early instrumental observations. Precipitation data were sourced from the North American Seasonal Precipitation Atlas developed by Stahle et al. (2020) [37]. This dataset, with a spatial resolution of 2.5° × 2.5° and a temporal span from 1500 to 2018 CE, effectively captures regional precipitation anomalies using the Standardized Precipitation Index (SPI) reconstructed from tree-ring widths. For drought indices, we used the North American Drought Atlas Version 2a [38]. This dataset offers a spatial resolution of 0.5° × 0.5°, covers the period 0–2005 CE, and provides a reliable metric for assessing hydrological balance through its tree-ring reconstructed Palmer Drought Severity Index (PDSI). Furthermore, ocean–atmosphere circulation indices, including the El Niño-Southern Oscillation (NINO3), the Pacific Decadal Oscillation (PDO), and the Atlantic Multidecadal Oscillation (AMO), were obtained from the KNMI Climate Explorer platform (https://climexp.knmi.nl) [39]. This platform, maintained by the Royal Netherlands Meteorological Institute, provides homogenized, standardized climate index series and integrates various statistical analysis tools.
We selected the North American Drought Atlas (NADA) PDSI reconstruction because it provides a spatially continuous, tree-ring-based moisture balance index that integrates both temperature and precipitation effects, making it highly relevant for fire risk assessment. The North American Seasonal Precipitation Atlas (NASPA) and the temperature reconstruction were chosen for their high temporal resolution and explicit calibration against instrumental data, ensuring robust representation of historical climate variability. Ocean–atmosphere indices (NINO3, PDO, AMO) were sourced from the KNMI Climate Explorer due to their widespread use in climate-fire studies and reliable homogenization. The selection of these specific climate variables (temperature, precipitation, PDSI, NINO3, PDO, AMO) was grounded in their established roles in the scientific literature as key drivers influencing the fundamental processes controlling fire activity, including fuel production, fuel drying, ignition probability, and fire weather conditions [18,19].
2.3. Research Methods
2.3.1. Fire Activity Metrics
Analysis of fire spatial extent (represented by the mean proportion of sites scarred per fire year, which serves as a proxy for the minimal spatial extent of fires within the sampling network) revealed a spatial pattern distinct from that of fire frequency.
To explore the climatic context of extreme fire events, we defined extreme fire years as all years where the fire frequency exceeded the 90th percentile based on data from the reference period (1700–2010). The 1700–2010 period was selected to ensure sufficient sample size for robust statistical analysis while excluding the earliest portions of the record where sample depth might be lower. The 90th percentile threshold was chosen to capture the most extreme fire years while maintaining a sufficient number of events for composite analysis.
2.3.2. Climate-Fire Correlation Analysis
To investigate the relationships between fire activity and climatic drivers, we performed correlation analyses between the fire activity chronology, the percentage of burned sites, and key climatic indicators, including temperature, precipitation, PDSI, as well as NINO3, PDO, and AMO [40]. Climate data (temperature, precipitation, PDSI, NINO3, PDO, AMO) were extracted for each ecoregion by spatially averaging all grid cells falling within the ecoregion boundaries. To align with the fire season of each region, we computed seasonal averages: summer (JJA) for temperature and PDSI, winter (DJF) for precipitation, and annual averages for ocean–atmosphere indices. For the correlation analysis, these climate variables for a given calendar year (T) were paired with the fire activity metrics for the same year (T), focusing on concurrent climate-fire relationships. All climate series were standardized to z-scores to facilitate cross-comparison and input into the Random Forest models.
2.3.3. Random Forest Modeling
To quantify the non-linear influences of multiple climate variables on fire activity and assess their relative importance, we constructed Random Forest regression models [8]. These models used interannual fire frequency (i.e., the fire-scarred ratio (percentage of sites scarred)) as a continuous response variable and concurrent temperature, precipitation, PDSI, along with the NINO3, PDO, and AMO indices as predictor variables. Random Forest is an ensemble machine learning algorithm that robustly captures complex non-linear relationships and interaction effects between predictors and the response variable by building a large number of decision trees and aggregating their predictions, while also being insensitive to multicollinearity. The analysis was implemented using the randomForest package in R 4.3.1. Model parameters were optimized, ultimately setting the number of trees generated to 500, and the number of variables randomly sampled at each split to one-third of the total number of predictors, ensuring model robustness and generalizability. Model performance was evaluated using the coefficient of determination (R2) and the root mean square error (RMSE) based on out-of-bag (OOB) predictions. The R2 values for the five ecoregions ranged from 0.21 to 0.48, and the RMSE values ranged from 0.08 to 0.14, indicating acceptable model fit and predictive accuracy. We assessed the relative importance of each climate variable by calculating the %IncMSE metric. %IncMSE (Percentage Increase in Mean Squared Error) measures the decrease in model prediction accuracy when the values of a specific predictor variable are randomly permuted, thereby breaking its relationship with the response variable. A higher %IncMSE value indicates that the variable contributes more substantially to the model’s predictive accuracy, reflecting its greater importance. The purpose of using the Random Forest algorithm was to capture potential non-linear relationships and complex interactions between the multiple climatic predictors, which a standard linear correlation analysis might miss. This method is well-suited for ecological data where predictor variables can be collinear [8].
2.3.4. Extreme Fire Year Analysis
Superposed Epoch Analysis (SEA) was employed to quantitatively compare the average differences in key climate variables (temperature, precipitation, PDSI, NINO3, PDO, AMO) between these extreme fire years and all other years (i.e., non-extreme years) [41]. For each extreme fire year, we extracted the climate variable values for that year and computed the composite anomaly as the average difference between extreme fire years and non-extreme years. Statistical significance was assessed using two-sample t-tests, thereby identifying climatic anomaly patterns significantly associated with extreme fire events.
To quantify the differences in climate variables between extreme and non-extreme fire years and to overcome limitations associated with relying solely on p-values in traditional hypothesis testing, we further conducted effect size analysis [42]. We used Cohen’s d as the effect size metric, which measures the standardized difference between two means. A Cohen’s d of 0.2, 0.5, and 0.8 is typically interpreted as a small, medium, and large effect, respectively. This method aims to evaluate the practical or substantive significance of the observed differences, beyond mere statistical significance. Additionally, to ensure the robustness of the estimates, we computed 95% confidence intervals for each effect size using the bootstrap method. A confidence interval not containing zero indicates that the effect is statistically significant (typically corresponding to p < 0.05).
The consistent and significant relationships identified through these multiple analytical approaches (correlation, Random Forest, Superposed Epoch Analysis) between fire activity and the selected climate drivers provide a robust, empirical validation for their inclusion and relevance in explaining fire regime variability across the studied ecoregions. All analyses described above were performed in the R 4.3.1 environment.
3. Results
3.1. Inter-Ecoregional Differences in Fire Frequency
Analysis of the 454-year (MA, WU) to 430-year (SN) fire history records across the five major ecoregions revealed significant differences in fire occurrence frequency among them (Table 1). A Chi-square test of independence confirmed that fire frequency (proportion of years with fire) differed significantly across the five ecoregions (p < 0.001). The NR ecoregion exhibited the highest fire frequency (0.59), indicating that fire events were recorded in nearly 59% of the years. The SR and MA ecoregions followed with fire frequencies of 0.57 and 0.54, respectively, demonstrating relatively frequent fire disturbance regimes. In contrast, the SN ecoregion had a fire frequency of 0.35, while the WU ecoregion experienced the least frequent fires, with records found in only 16% of the years (fire frequency = 0.16).

Table 1.
Statistical Characteristics of Fire History in Five Major Ecological Regions of the Western United States.
Analysis of fire spatial extent (represented by the mean proportion of sites scarred per fire year, which serves as a proxy for the spatial extent of fire within the sampling network) revealed a spatial pattern distinct from that of fire frequency. The SN ecoregion exhibited the highest mean fire spatial extent (7.88%), concurrently recording the maximum value for an extreme fire event (85.71%). This indicates that although fires occur relatively infrequently in this region, they tend to affect a larger proportion of the sampled network when they do occur. The MA ecoregion ranked second with a mean fire size of 6.68%, while the NR ecoregion maintained a moderate mean fire size (5.02%) against the backdrop of its high fire frequency (Table 1).
3.2. Wildfire–Climate Relationships
Correlation analysis between the fire history derived from tree-ring fire-scar records and key climatic factors across the five major ecoregions in the western United States revealed that the summer drought index (PDSI) was the strongest and most consistent driver of fire activity across all ecoregions (Table 2), showing a highly significant negative correlation (p < 0.001). Concurrently, the NINO3 index also universally exhibited a highly significant negative correlation (p < 0.001) across the ecoregions, indicating that ENSO events have a broad and stable regulatory effect on regional fire patterns. Winter precipitation showed significant negative correlations in the WU, SR, and MA ecoregions, demonstrating its suppressive effect on fire activity in these different regions. In contrast, temperature showed a highly significant positive correlation only in the NR ecoregion and no significant influence in others, highlighting clear regional heterogeneity. Furthermore, the AMO and PDO showed significant negative correlations in some ecoregions, such as SR, NR, and MA, but were non-significant in others, further indicating spatial differences in the influence of large-scale climate oscillations on fire activity (Figure 2).
Table 2.
Summary of Climate Variables across Five Ecoregions.
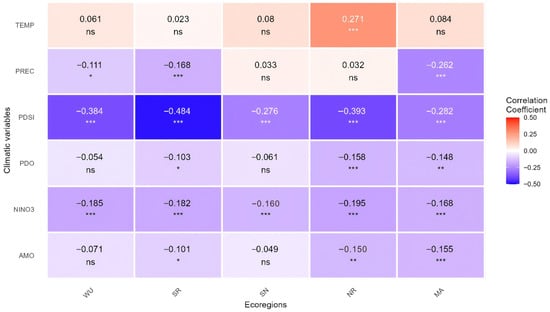
Figure 2.
Heatmap of correlations between fire chronologies and climatic drivers in five ecoregions of the western United States. *, ** and *** represent p < 0.05, p < 0.01, and p < 0.005, respectively. ns represent not significant.
3.3. Driver Importance Assessment
The assessment of driver importance for wildfires in the five western US ecoregions (MA, NR, SN, SR, WU), based on the Random Forest algorithm, revealed significant spatial heterogeneity in the relative contribution of various climate variables, uncovering differentiated regional driving mechanisms (Figure 3). Model performance was evaluated using the coefficient of determination (R2) and the root mean square error (RMSE) based on out-of-bag (OOB) predictions. The R2 values for the five ecoregions ranged from 0.64 to 0.71, and the RMSE values ranged from 0.08 to 0.14, indicating acceptable model fit and predictive accuracy. In the SN ecoregion (southwest), the importance of all climate factors was significantly higher than in other regions, with AMO (2.207), PDSI (1.989), and NINO3 (1.706) ranking as the top three, indicating that fire activity in this region is strongly influenced by the Atlantic Multidecadal Oscillation, drought conditions, and the El Niño-Southern Oscillation. The MA ecoregion (Great Basin) was primarily driven by Precipitation (1.111), PDSI (1.105), and AMO (1.046), reflecting the combined regulation of its fire regime by precipitation, drought, and North Atlantic sea surface temperature variability. Notably, although PDSI showed a consistently significant negative correlation in the correlation analysis, its importance in the Random Forest model was most prominent only in the SN and MA ecoregions, suggesting regional differences in the role of drought as a fundamental background condition. In contrast, the importance of all variables was generally low in the NR ecoregion, with values all below 0.574; TEMP (0.574) and PDSI (0.523) were slightly higher than other factors, implying that fires in this region might be more influenced by non-climatic factors or local processes. The SR and WU ecoregions exhibited similar driver structures, with overall low importance values, yet PDSI, PDO, and AMO still possessed some explanatory power, indicating the synergistic effect of drought and decadal-scale climate oscillations.
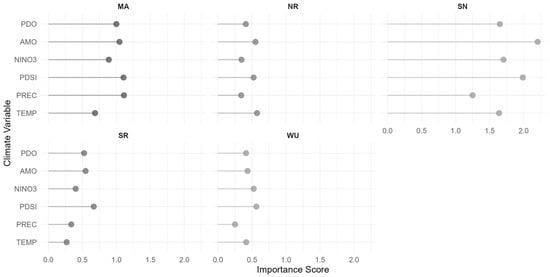
Figure 3.
Relative importance of climatic drivers of wildfire across the five major ecoregions in the western United States.
3.4. Climatic Anomalies During Extreme Fire Years
The results show that different climate variables exhibited significant anomalous characteristics during extreme fire years, and these characteristics demonstrated clear spatial heterogeneity among the ecoregions (Figure 4). During extreme fire years, surface temperature showed significant positive anomalies in the MA (+0.19 °C, p < 0.05) and NR (+0.53 °C, p < 0.001) ecoregions, indicating that high temperatures are an important climatic background for extreme fire events in these two regions. In contrast, temperature anomalies in the SN, SR, and WU ecoregions did not reach statistical significance. The MA ecoregion experienced significantly less precipitation during extreme fire years (−0.47 mm, p < 0.001), and the SR ecoregion also showed a significant negative precipitation anomaly (−0.19 mm, p < 0.01). Notably, precipitation anomalies in the NR, SN, and WU ecoregions were not statistically significant. The Palmer Drought Severity Index (PDSI) showed highly consistent and significant negative anomalies (p < 0.001) across all five ecoregions, with particularly prominent magnitudes in the MA (−1.51), NR (−2.27), SN (−1.05), SR (−2.34), and WU (−2.27) ecoregions. This finding strongly demonstrates that severe drought conditions are the primary climatic driver for the occurrence of extreme fire events, and this relationship is ubiquitous across all study regions. The ENSO indicator (NINO3) showed significant and strong negative anomalies (p < 0.001) in four of the five ecoregions (NR, SN, SR, WU). In the MA ecoregion, the NINO3 anomaly during extreme fire years was also negative, but its influence was comparatively weaker and not statistically significant at the same level as in the other regions. This suggests that while La Niña conditions are a potent driver of extreme fire years across most of the studied areas, its role in the MA ecoregion may be more subdued or indirect. Similarly, the Atlantic Multidecadal Oscillation (AMO) and Pacific Decadal Oscillation (PDO) also exhibited significant negative anomalies in most ecoregions, implying that these decadal climate variabilities play an important modulatory role in extreme fire risk.
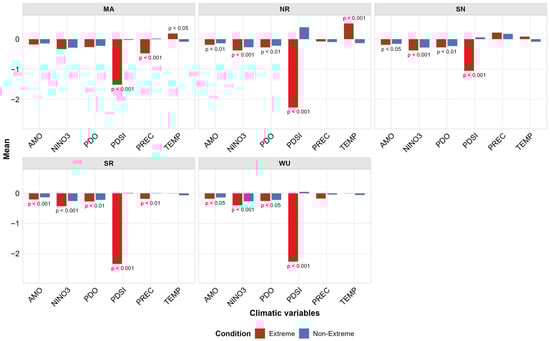
Figure 4.
Differences in climatic drivers between extreme and non-extreme fire years in five ecoregions of the western United States.
Cohen’s d effect size analysis revealed (Figure 5) that the temperature variable showed significant small-to-medium positive effects in the MA (d = 0.292, p < 0.05) and NR (d = 0.68, p < 0.05) ecoregions, indicating significantly higher temperatures during extreme fire years in these regions. However, in the SN (d = 0.173), SR (d = 0.079), and WU (d = 0.068) ecoregions, the temperature effects were non-significant and small, reflecting clear regional specificity in temperature’s driving role for extreme fires. Winter precipitation showed significant negative effects in the MA (d = −0.672, p < 0.05) and SR (d = −0.388, p < 0.05) ecoregions, with the MA ecoregion reaching a medium effect level, confirming the important contribution of long-term precipitation deficit to extreme fires. Notably, the precipitation effects in the NR, SN, and WU ecoregions were non-significant and weak, indicating that precipitation anomalies are not universal drivers of extreme fire events in these regions. The summer drought index (PDSI) exhibited significant medium-to-large negative effects across all five ecoregions (MA: d = −0.819; NR: d = −0.972; SN: d = −0.407; SR: d = −1.316; WU: d = −1.034; all p < 0.05), with the effect size being particularly prominent in the SR ecoregion (d = −1.316). This result robustly confirms that drought conditions are the most consistent and influential climatic driver for extreme fire events, transcending the geographical boundaries of different ecoregions. The ENSO indicator (NINO3) showed significant small-to-medium negative effects (d = −0.371 to −0.593, p < 0.05) in all ecoregions except MA, indicating that cold-phase ENSO events increase extreme fire risk by modulating regional climate conditions. Similarly, AMO and PDO also showed significant small effects (d = −0.19 to −0.365, p < 0.05) in most ecoregions, further confirming the decadal-scale modulation of sea surface temperature variability on the probability of extreme fires.
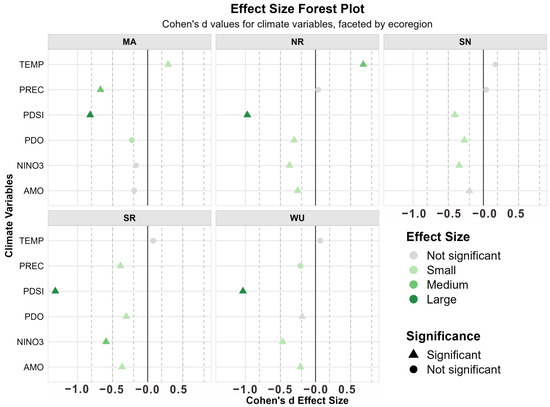
Figure 5.
Forest plot of effect sizes for climatic driver differences between extreme and non-extreme fire years in five ecoregions of the western United States. The magnitude of the effect size is represented solely by color intensity, statistical significance is indicated exclusively by symbols.
4. Discussion
4.1. Spatial Heterogeneity in Fire Regimes Across Major Ecoregions of the Western United States Based on Tree-Ring Fire-Scar Records
Utilizing long-term series data from tree-ring fire-scar records, this study systematically reveals significant spatial heterogeneity in fire frequency and size across the five major ecoregions in the western United States. This spatial heterogeneity underscores the complex interplay between regional climate, vegetation structure, topographic complexity, and anthropogenic influences in shaping fire regimes [43].
The NR and SR ecoregions exhibited characteristics of a high-frequency, low-to-moderate size fire regime (fire frequencies of 0.59 and 0.57, respectively), reflecting a tight coupling between their vegetation structure, climatic background, and fire disturbance regime. The NR ecoregion, dominated by flammable species like Lodgepole Pine (Pinus contorta), combined with the delayed drying of fuels at the start of the growing season due to persistent winter snowpack in a cool, moist climate, likely fosters a periodic mechanism of fire risk accumulation and release [26]. In these systems, deep snowpack synchronizes fuel moisture conditions across large landscapes. The subsequent relatively short window of warm, dry weather in the late summer allows for fire ignition and spread, but typically before fuels become critically dry enough to support unstoppable, high-severity crown fires [15]. This results in frequent, but often self-regulating, surface fires that maintain open forest structures.
In contrast, the SN ecoregion, despite a moderate fire frequency (0.35), displayed the highest mean and extreme fire spatial extent (7.88% and 85.71%, respectively), suggesting that the combination of prolonged summer drought under a Mediterranean climate and highly flammable vegetation (e.g., chaparral shrubs) readily leads to large-scale fire events. It is critical to note that the metric ‘mean proportion of sites scarred’ is used as a proxy for fire spatial extent within our sampling network and does not directly measure actual fire size (e.g., hectares burned) or fire intensity. The Mediterranean climate creates an extended period of atmospheric and fuel aridity, which effectively cures the live and dead fuels across the landscape [44]. When ignitions occur in these conditions, they can propagate rapidly through the continuous, highly flammable chaparral at low elevations and dense mid-elevation conifer forests, often overwhelming suppression efforts and resulting in megafires [30]. The steep western slope further promotes rapid fire spread through wind-driven events and pre-heating of upslope fuels.
The WU ecoregion showed the lowest fire frequency (0.16) and mean fie size (2.15%), potentially constrained by its patchy vegetation distribution and insufficient fuel continuity under arid conditions [33]. The inherent fragmentation of the juniper-pinyon woodlands and alpine meadows limits the potential for sustained large-fire spread. While the effectiveness of historical anthropogenic fire suppression in the wildland-urban interface cannot be discounted, the primary constraint is likely the bottom-up control of fuel limitation imposed by the arid continental climate [45].
The MA ecoregion, conversely, exhibited moderate frequency (0.54) but higher mean fire size (6.68%), where its “Sky Island” topography and seasonal dry periods likely jointly shape concentrated and intense fire-prone windows. The arid basins act as natural firebreaks, but during the extreme dry period of May-June (pre-monsoon), the continuous fuels within the mountain islands become uniformly available for burning [46]. This creates a scenario where any ignition that escapes the basin and reaches a “Sky Island” has a high probability of developing into a large, intense fire until it burns to a topographic barrier or the monsoon rains commence [21]. This dynamic leads to a fire regime characterized by pulses of large fires during these critical dry windows, rather than the more continuous fire season seen in the Rockies.
The ecological implications of these fire regimes are profound. In the Sierra Nevada, the combination of high-size fires and drought-prone vegetation (e.g., chaparral) suggests a system prone to post-fire type conversion, where forests may shift to shrub-dominated states under repeated burning [2]. In contrast, the frequent but low-severity fires in the Northern Rockies are consistent with a fire-adapted system where species like Lodgepole Pine exhibit serotiny or other fire-related reproductive strategies [6]. The low fire frequency in the Wasatch and Uinta Mountains may reflect a fuel-limited system where arid conditions and discontinuous vegetation restrict fire spread, thereby maintaining patchy and fire-resilient landscapes. The Southern Rockies, with high frequency but relatively low mean fire size, likely experienced a mixed-severity regime influenced by complex topography and forest structure [10]. The Madrean Archipelago’s regime of pulsed, large fires during dry windows likely maintained a dynamic mosaic of vegetation ages and types across the “Sky Islands.”
4.2. Differential Modulation of Regional Fire Regimes by Climatic Drivers
Correlation analysis indicated that the summer drought index (PDSI) was the most consistent and strongest climatic driver of fire activity across all ecoregions. Its highly significant negative correlation underscores the central role of moisture deficit in elevating fire risk by simultaneously drying both large woody fuels and fine live vegetation, thereby creating landscape-wide flammability [34]. Furthermore, ENSO (NINO3 index) also showed a stable negative correlation in most ecoregions, indicating that La Niña phases generally increase fire risk by intensifying drought conditions across the southwestern and central US. This is consistent with the known teleconnection pattern wherein La Niña tends to push the storm track northward, depriving these regions of winter and spring precipitation and setting the stage for an intense fire season [47].
However, the influence of other climatic factors exhibited marked regional specificity. For instance, winter precipitation showed a significant negative correlation in the WU, SR, and MA ecoregions, suggesting that winter wetness in these areas has a lasting suppressive effect on fuel moisture into the subsequent fire season. This phenomenon, termed the “legacy effect” of precipitation, is particularly crucial in fuel-limited arid and semi-arid systems. Higher winter snowpack and rainfall not only directly moisten fuels but also support the growth of herbaceous vegetation in spring, which can temporarily reduce fire risk by increasing live fuel moisture [15]. However, in the MA, this effect is seasonally bounded, as the pre-monsoon extreme drying can rapidly negate it.
Air temperature showed a highly significant positive correlation only in the NR ecoregion and was non-significant elsewhere, reflecting that the regulatory effect of high temperature on fire risk is constrained by local vegetation types and moisture availability. In the cool, moist NR, high temperatures promote fire not primarily by igniting fires but by driving evapotranspiration and accelerating the drying of the deep organic soil and duff layers that are characteristic of these forests [10]. In contrast, in already arid regions like the MA and WU, fuel aridity may be primarily limited by precipitation rather than temperature, and in the SN, the overriding effect of the intense summer drought may mask any additional, independent signal from temperature alone [44].
The influence of large-scale climate oscillations (AMO, PDO) also displayed spatial variation, showing significant negative correlations only in some ecoregions (e.g., SR, NR, MA), indicating that their modulating effects depend on the coupling between regional climate background and geographic location. These low-frequency oscillations act as “climate switches,” modulating the strength and positioning of pressure systems and storm tracks over periods of decades. For example, the negative correlation with PDO suggests that during its cool (negative) phase, which is associated with drier conditions in the interior West, fire activity increases in these ecoregions [48]. The absence of a consistent signal across all regions highlights that the expression of these teleconnections is filtered through regional topography and continental-scale atmospheric circulation patterns, making their influence spatially heterogeneous and non-stationary [26].
Across the five ecoregions, several common climatic drivers emerge despite their distinct fire regime characteristics. Drought, as quantified by the Palmer Drought Severity Index (PDSI), consistently functions as the principal limiting factor for fire activity throughout the western United States [10]. This pervasive influence operates primarily through the direct control of fuel moisture content: by desiccating both dead surface fuels and live vegetation, drought creates landscape-level flammability conditions that enable fire ignition and spread [49]. The universal significance of PDSI across all ecoregions underscores moisture deficit as a non-negotiable prerequisite for significant burning, regardless of local vegetation composition or topographic complexity. Beyond this drought foundation, large-scale climate oscillations—particularly ENSO and AMO—exert broad though variably expressed influences across the study regions [47]. These teleconnected patterns modulate fire potential by altering the position and intensity of major atmospheric circulation features, thereby controlling the delivery of moisture to western North America [50]. During La Niña (negative ENSO) phases, the northward displacement of storm tracks consistently reduces precipitation across much of the Southwest and interior West, synchronously elevating fire risk across multiple ecoregions [51]. Similarly, positive phases of the AMO reinforce drought conditions through their association with expanded subtropical high-pressure systems and reduced atmospheric moisture transport [52]. The synergistic influence of these interannual-to-decadal climate modes with background drought conditions creates a hierarchical control system in which large-scale oscillations set the multi-year stage for fire activity, while drought determines the annual implementation of that potential [26]. This cross-scale interaction between persistent climate modes and immediate drought conditions explains both the coherence and variability in fire responses observed across the diverse ecoregional landscapes.
4.3. Spatial Heterogeneity in the Relative Importance of Climatic Drivers Revealed by Random Forest Analysis
The Random Forest model further elucidated the relative contributions of climate variables in explaining fire variability, moving beyond the linear assumptions of simple correlation analysis to highlight the importance of non-linear relationships and complex variable interactions in shaping fire activity [8]. In the SN ecoregion, the importance of all climate factors was significantly higher than in other regions, particularly for AMO, PDSI, and NINO3. This indicates that fire activity here is strongly controlled by a multi-scale climate “synchronization,” where interannual (ENSO) to multi-decadal (AMO) oscillations modulate the background aridity (PDSI) set by the characteristic Mediterranean climate, creating a highly predictable, climate-dominated fire regime [44].
The MA ecoregion was primarily driven by PREC, PDSI, and AMO, reflecting the combined influence of seasonal precipitation distribution and sea surface temperature variability on its fire regime. The dominance of PREC underscores the “phenological gate” mechanism, where the timing and amount of winter rain and summer monsoon onset directly dictate the length and intensity of the critical pre-monsoon fire window [47]. The AMO’s influence suggests that its warm phases, associated with increased drought severity in the Southwest, can amplify fire risk over decades-long periods [48].
Notably, although PDSI showed a universally strong negative correlation with fire activity across all ecoregions (Section 3.2), its predictive importance in the Random Forest model (%IncMSE) was most prominent only in the SN and MA ecoregions. This suggests regional differences in the role of drought as a fundamental background condition. In the SN and MA, drought often acts as the proximal and sufficient trigger for widespread burning, directly driving fire risk in a climate-dominated system. In contrast, in regions like the NR and WU, drought may be a necessary but not sufficient condition, with its effect contingent on other non-climatic thresholds being crossed (e.g., ignition availability, fuel connectivity, or fine-scale topographic controls) [10].
In contrast, the importance of climate variables was generally lower in the NR, SR, and WU ecoregions, particularly in the NR. This strongly hints that fire dynamics in these regions might be more dominantly controlled by non-climatic bottom-up factors such as fine-scale topography influencing fuel moisture and fire spread, fuel connectivity dictated by forest structure, or local processes not included in the model (e.g., insect outbreaks, human ignition patterns, and fire suppression legacies) [26]. The model’s lower explanatory power in these areas highlights the limitations of macro-scale climate variables alone in predicting fire activity in systems where the physical capacity for fire spread (fuels) is not continuously available or is frequently disrupted by landscape heterogeneity.
Furthermore, it is important to acknowledge a potential limitation arising from the highly uneven distribution of tree-ring fire-scar sampling sites across the ecoregions (e.g., SR = 143 sites vs. SN = 8 sites; Section 2.2.1). While the ITRDB data provide an unparalleled spatial and temporal scope, this heterogeneity in sample size could influence the precision and comparability of fire frequency estimates and model results among ecoregions. The higher density of sites in the SR ecoregion likely yields a more robust reconstruction of its fire history compared to regions with sparser data. Therefore, comparisons of absolute fire frequency and the strength of climate relationships between ecoregions with vastly different sample densities should be interpreted with appropriate caution. Future efforts to augment fire-scar records in under-sampled ecoregions would be valuable for validating and refining these findings.
4.4. Extreme Fire Year Climate Anomalies Underscore the Primacy of Drought
The analysis of climatic anomalies during extreme fire years further reinforces the central role of drought in driving these events. PDSI showed highly consistent, significant negative anomalies across all five ecoregions, and effect size analysis revealed medium-to-large negative effects (Cohen’s d = −0.407 to −1.316) everywhere, confirming that severe drought is the dominant, cross-regional factor for extreme fire occurrence. The PDSI integrates both temperature-driven atmospheric demand and precipitation supply, and its strong negative anomalies indicate a state of “peak fuel aridity,” where both dead and live fuels become critically dry and available to burn, effectively synchronizing fire risk across diverse fuel types and landscapes [34]. The large effect sizes confirm that drought is not merely a correlate but a powerful driver capable of overwhelming regional-specific controls. Despite drought being the dominant climatic driver for extreme fire years across all ecoregions, its relative importance in the Random Forest model was notably lower in the NR ecoregion. This suggests that in regions like the NR, non-climatic factors (e.g., fine-scale topography, fuel connectivity, ignition patterns, or fire suppression legacies) may play a more predominant role in regulating fire dynamics than climate alone. This further underscores the regional specificity of fire–climate relationships and highlights the need to integrate both climatic and non-climatic processes in fire risk assessments for such ecosystems.
Temperature anomalies were significant only in the MA and NR ecoregions, with small-to-medium effect sizes, indicating the promoting effect of high temperature on extreme fires has clear regional limitations. In the MA, high temperatures exacerbate the already extreme pre-monsoon aridification, directly intensifying fuel drying. In the NR, the signal likely reflects the crucial role of warm temperatures in driving the “snowpack-to-fuel drought” pipeline: accelerated spring snowmelt and increased evapotranspiration rapidly dry the deep, compact organic layers (duff) that are characteristic of these cold, moist forests, enabling sustained ignition and spread [15]. Its non-significance in other regions, like the SN, suggests that the overriding effect of the Mediterranean summer drought is so strong that interannual temperature variations add little explanatory power for extreme years.
Precipitation anomalies were significantly reduced in the MA and SR ecoregions with medium effect sizes, but non-significant elsewhere, further corroborating the geographical variation in precipitation’s regulatory role on fire risk. In the MA, the negative anomaly points directly to a failure of the winter wet season or a delayed monsoon, prolonging the critical fire window. In the SR, it underscores the importance of winter snowpack for maintaining fuel moisture into the early summer. The lack of a significant signal in the WU and NR may be due to the higher baseline moisture and the fact that extreme fire years in these regions are more tied to the persistence of drought (captured by PDSI) than to the precipitation of a single season [10].
ENSO, AMO, and PDO also showed significant negative anomalies and small-to-medium effects in most ecoregions, suggesting these sea surface temperature oscillations indirectly increase the probability of extreme fires by modulating the regional climatic background (e.g., intensifying drought), potentially holding significant predictive value, particularly at decadal scales. The consistency of these teleconnections during extreme years is critical. It implies that phases like La Niña (negative NINO3) or the cold phase of the PDO create a “loaded background climate” that predisposes large regions to the drought conditions necessary for extreme fire activity [48]. While their individual effect sizes are smaller than that of PDSI, their persistence over seasons to decades provides a valuable, long-lead indicator for forecasting periods of elevated regional fire risk.
The ecological consequences of extreme fire years are particularly evident in regions like the Sierra Nevada and Madrean Archipelago, where synchronous drought and large fires can lead to widespread tree mortality and reduced recruitment. These events may exceed the ecological memory of the system, leading to long-term shifts in species composition and ecosystem structure. By contrast, in the Northern Rockies, extreme fires may still operate within the historical range of variability, promoting regeneration in serotinous conifers and maintaining open forest structures [23].
The findings from this study offer broader implications for global fire management. First, the demonstrated importance of ecoregion-specific approaches can guide fire risk assessment in other continent-scale fire-prone regions such as the Mediterranean Basin, Australian eucalypt forests, and boreal forests [53]. Second, the methodological framework integrating tree-ring reconstruction with machine learning and effect size analysis provides a transferable template for examining fire–climate relationships in data-rich and data-poor regions alike [54]. Third, the consistent primacy of drought across all ecoregions underscores the global relevance of moisture deficit as a fundamental fire driver, suggesting that monitoring drought conditions should be prioritized in early warning systems worldwide [55]. Finally, the identification of regions where non-climatic factors dominate (e.g., Northern Rockies) highlights that effective fire management must integrate both top-down climatic controls and bottom-up local factors, a principle applicable to fire management strategies across global forest ecosystems [56].
Our findings, which consistently identify drought as the principal driver of extreme fire years, raise a pertinent question regarding contemporary fire risk prediction models. Many operational fire danger systems, such as the US National Fire Danger Rating System (NFDRS), do incorporate drought proxies like the Keetch-Byram Drought Index (KBDI) or Palmer Drought Severity Index (PDSI) to some extent [57]. However, the primacy and consistent large effect size of PDSI across all ecoregions, as quantified in our study, suggest that its role may still be underrepresented or oversimplified in models that rely heavily on short-term weather variables. Current models often excel at predicting fire potential driven by synoptic-scale weather patterns (e.g., hot, dry, windy days) but may lack the mechanistic integration of long-term drought conditions that precondition landscapes for extreme fire events [58]. Our results, particularly the non-linear relationships and ecoregion-specific thresholds captured by the Random Forest models, underscore the necessity of more deeply embedding antecedent drought conditions as a foundational component of fire risk assessment. Enhancing models to dynamically weight drought based on ecoregion-specific sensitivities, and to account for its non-linear interaction with other drivers like temperature and atmospheric circulation patterns, could significantly improve the accuracy and lead time of seasonal fire risk forecasts, thereby supporting more proactive resource allocation and management strategies [59].
5. Conclusions and Outlook
Through a systematic analysis integrating multiple methods, this study accomplished its primary objectives: (1) revealing spatiotemporal patterns of fire activity and spatial extent; (2) quantifying the relative contributions of climatic drivers, identifying drought (PDSI) as the most consistent factor while highlighting regional heterogeneity for others; (3) identifying non-linear responses and threshold effects via Random Forest models, which revealed the high climate sensitivity of the Sierra Nevada and Madrean Archipelago; (4) establishing a foundational climate-based framework for understanding fire risk, particularly during extreme years dominated by drought.
Drought is the most consistent driver across all ecoregions, while the influences of temperature, precipitation, and large-scale climate oscillations exhibit strong regional dependence. The Random Forest model further emphasized the high sensitivity of fire activity to multiple climate factors in the SN and MA ecoregions, whereas fire dynamics in the NR, SR, and WU ecoregions are likely more regulated by non-climatic processes such as topography, fuel structure, and human activities.
Future research should further integrate non-climatic factors such as vegetation structure, topography, and human activity (e.g., ignition sources, land use change, and suppression effects), and develop region-specific fire risk prediction models. This will enhance the understanding and predictive capability of fire dynamics under climate change, providing a scientific basis for differentiated fire management strategies and ecological adaptive management.
Author Contributions
Conceptualization, M.B.; methodology, M.B.; software, M.B.; validation, H.Z.; formal analysis, L.S.; investigation, H.Z.; resources, M.B. and L.S.; data curation, M.B.; writing—original draft preparation, M.B.; writing—review and editing, L.S.; visualization, M.B.; supervision, H.Z.; project administration, L.S.; funding acquisition, L.S. and H.Z. All authors have read and agreed to the published version of the manuscript.
Funding
The authors gratefully acknowledge funding from the National Science Foundation of China (32201573 and 32301599).
Institutional Review Board Statement
Not applicable.
Informed Consent Statement
Not applicable.
Data Availability Statement
Data are contained within the article.
Conflicts of Interest
The authors declare no conflicts of interest.
References
- Kelly, L.T.; Giljohann, K.M.; Duane, A.; Núria, A.; Archibald, S.; Batllori, E.; Bennett, A.F.; Quim Canelles, S.T.B.; Clarke, M.F.; Fortin, M.-J.; et al. Fire and biodiversity in the Anthropocene. Science 2020, 370, eabb0355. [Google Scholar] [CrossRef] [PubMed]
- Alizadeh, M.R.; Abatzoglou, J.T.; Adamowski, J.; Rad, A.M.; AghaKouchak, A.; Pausata, F.S.R.; Sadegh, M. Elevation-dependent intensification of fire danger in the western United States. Nat. Commun. 2023, 14, 1773. [Google Scholar] [CrossRef] [PubMed]
- Xu, W.; Cen, J.; Fan, L.; Liu, Y.; Janssen, T.A.J.; Liu, P.; Wu, W.; Wang, L.; Li, N.; Veraverbeke, S. Land use and climatic drivers of early 21st-century fire activity in the Amazon. Agric. Forest Meteorol. 2025, 372, 110664. [Google Scholar]
- Yao, Q.; Brown, P.M.; Liu, S.; Rocca, M.E.; Trouet, V.; Zheng, B.; Chen, H.; Li, Y.; Liu, D.; Wang, X. Pacific-Atlantic Ocean influence on wildfires in northeast China (1774 to 2010). Geophys. Res. Lett. 2017, 44, 1025–1033. [Google Scholar]
- Fang, K.; Yao, Q.; Guo, Z.; Zheng, B.; Du, J.; Qi, F.; Yan, P.; Li, J.; Ou, T.; Liu, J.; et al. ENSO modulates wildfire activity in China. Nat. Commun. 2021, 12, 1764. [Google Scholar] [CrossRef]
- Heyerdahl, E.K.; Brubaker, L.B.; Agee, J.K. Spatial controls of historical fire regimes: A multiscale example from the interior West, USA. Ecology 2001, 82, 660–678. [Google Scholar] [CrossRef]
- Falk, D.A.; Heyerdahl, E.K.; Brown, P.M.; Farris, C.; Fulé, P.Z.; McKenzie, D.; Swetnam, T.W.; Taylor, A.H.; Van Horne, M.L. Multi-scale controls of historical forest-fire regimes: New insights from fire-scar networks. Front. Ecol. Environ. 2011, 9, 446–454. [Google Scholar] [CrossRef]
- Cutler, D.R.; Edwards, T.C.; Beard, K.H.; Cutler, A.; Hess, K.T.; Gibson, J.; Lawler, J.J. Random forests for classification in ecology. Ecology 2007, 88, 2783–2792. [Google Scholar] [CrossRef]
- Williams, A.P.; Seager, R.; Macalady, A.K.; Berkelhammer, M.; Crimmins, M.A.; Swetnam, T.W.; Rahn, T. Correlations between components of the water balance and burned area reveal new insights for predicting forest fire area in the southwest United States. Int. J. Wildland Fire 2015, 24, 14–26. [Google Scholar] [CrossRef]
- Littell, J.S.; McKenzie, D.; Peterson, D.L.; Westerling, A.L. Climate and wildfire area burned in western U.S. ecoprovinces, 1916–2003. Ecol. Appl. 2009, 19, 1003–1021. [Google Scholar] [CrossRef]
- Barbour, M.G.; Billings, W.D. (Eds.) North American Terrestrial Vegetation, 2nd ed.; Cambridge University Press: Cambridge, UK, 2002. [Google Scholar]
- Franklin, J.F.; Spies, T.A. Ecological definitions of old-growth Douglas-fir forests. In Wildlife and Vegetation of Unmanaged Douglas-Fir Forests; USDA Forest Service General Technical Report PNW-GTR-285; U.S. Department of Agriculture, Forest Service, Pacific Northwest Research Station: Corvallis, OR, USA, 1991; pp. 61–69. [Google Scholar]
- Peet, R.K. Forests of the Rocky Mountains. In North American Terrestrial Vegetation; Barbour, M.G., Billings, W.D., Eds.; Cambridge University Press: Cambridge, UK, 1998; pp. 63–101. [Google Scholar]
- Agee, J.K. Fire Ecology of Pacific Northwest Forests; Island Press: Washington, DC, USA, 1993. [Google Scholar]
- Westerling, A.L.; Hidalgo, H.G.; Cayan, D.R.; Swetnam, T.W. Warming and earlier spring increase western U.S. forest wildfire activity. Science 2006, 313, 940–943. [Google Scholar] [CrossRef]
- Roos, C.I.; Guiterman, C.H.; Margolis, E.Q.; Swetnam, T.W.; Laluk, N.C.; Thompson, K.F.; Toya, C.; Farris, C.A.; Fulé, P.Z.; Iniguez, J.M.; et al. Indigenous fire management and cross-scale fire-climate relationships in the Southwest United States from 1500 to 1900 CE. Sci. Adv. 2022, 8, eabq3221. [Google Scholar] [CrossRef] [PubMed]
- U.S. Environmental Protection Agency. Level III Ecoregions of the Continental United States; EPA—National Health and Environmental Effects Research Laboratory, map scale 1:7,500,000; U.S. Environmental Protection Agency: Corvallis, OR, USA, 2013.
- Omernik, J.M.; Griffith, G.E. Ecoregions of the conterminous United States: Evolution of a hierarchical spatial framework. Environ. Manag. 2014, 54, 1249–1266. [Google Scholar] [CrossRef] [PubMed]
- McLaughlin, S.P. An overview of the flora of the Sky Islands, southeastern Arizona: Diversity, affinities, and insularity. In Biodiversity and Management of the Madrean Archipelago: The Sky Islands of Southwestern United States and Northwestern Mexico; U.S. Department of Agriculture, Forest Service, Rocky Mountain Research Station: Fort Collins, CO, USA, 1995; pp. 60–70. [Google Scholar]
- Adams, D.K.; Comrie, A.C. The North American Monsoon. Bull. Am. Meteorol. Soc. 1997, 78, 2197–2214. [Google Scholar] [CrossRef]
- Barton, A.M.; Poulos, H.M. Pine vs. oaks revisited: Conversion of Madrean pine-oak forest to oak shrubland after severe wildfire in the Sky Islands of Arizona. For. Ecol. Manag. 2018, 414, 28–40. [Google Scholar] [CrossRef]
- Peel, M.C.; Finlayson, B.L.; McMahon, T.A. Updated world map of the Köppen-Geiger climate classification. Hydrol. Earth Syst. Sci. 2007, 11, 1633–1644. [Google Scholar] [CrossRef]
- Veblen, T.T. Disturbance patterns in the Rocky Mountains. In Rocky Mountain Futures: An Ecological Perspective; Island Press: Washington, DC, USA, 2002; pp. 69–88. [Google Scholar]
- Locke, W.W. Modeling of glaciated terrain. In Geomorphic Evolution of the Northern Rocky Mountains; GSA Bulletin: Boulder, CO, USA, 1995; pp. 87–102. [Google Scholar]
- Daly, C.; Halbleib, M.; Smith, J.I.; Gibson, W.P.; Doggett, M.K.; Taylor, G.H.; Curtis, J.; Pasteris, P.P. Physiographically sensitive mapping of climatological temperature and precipitation across the conterminous United States. Int. J. Climatol. 2008, 28, 2031–2064. [Google Scholar] [CrossRef]
- Schoennagel, T.; Turner, M.G.; Kashian, D.M. Spatial heterogeneity in lodgepole pine serotiny in the northern Rocky Mountains. Ecol. Appl. 2004, 14, 1023–1039. [Google Scholar]
- Huber, N.K. The Geologic Story of Yosemite National Park; U.S. Geological Survey Bulletin 1595; U.S. Geological Survey: Reston, VA, USA, 1981.
- Dettinger, M.D.; Cayan, D.R.; Diaz, H.F.; Meko, D.M. North–south precipitation patterns in western North America on interannual-to-decadal timescales. J. Clim. 1998, 11, 3095–3111. [Google Scholar] [CrossRef]
- Barbour, M.G.; Major, J. Terrestrial Vegetation of California, 2nd ed.; California Native Plant Society: Sacramento, CA, USA, 1988. [Google Scholar]
- Miller, J.D.; Safford, H.D. Trends in wildfire severity: 1984 to 2010 in the Sierra Nevada, Modoc Plateau, and Southern Cascades, California, USA. Fire Ecol. 2012, 8, 41–57. [Google Scholar] [CrossRef]
- Burchfiel, B.C.; Cowan, D.S.; Davis, G.A. Tectonic overview of the Cordilleran orogen in the western United States. In The Cordilleran Orogen: Conterminous; U.S. Geological Society of America: Boulder, CO, USA, 1992; pp. 407–479. [Google Scholar]
- Mock, C.J. Climate controls and spatial variations of precipitation in the western United States. J. Clim. 1996, 9, 1111–1125. [Google Scholar] [CrossRef]
- Heyerdahl, E.K.; Meyer, R.S.; Loehman, R.A. Exploring the role of topography, fuels, and weather on fire severity in the northern Great Basin. Fire Ecol. 2019, 15, 26. [Google Scholar]
- Abatzoglou, J.T.; Williams, A.P. Impact of anthropogenic climate change on wildfire across western US forests. Proc. Natl. Acad. Sci. USA 2016, 113, 11770–11775. [Google Scholar] [CrossRef] [PubMed]
- Grissino-Mayer, H.D.; Fritts, H.C. The International Tree-Ring Data Bank: An enhanced global database serving the global scientific community. Holocene 1997, 7, 235–238. [Google Scholar] [CrossRef]
- King, K.E.; Cook, E.R.; Anchukaitis, K.J.; Cook, B.I.; Smerdon, J.E.; Seager, R.; Harley, G.L.; Spei, B. Increasing prevalence of hot drought across western North America since the 16th century. Sci. Adv. 2024, 10, eadj4289. [Google Scholar] [CrossRef]
- Stahle, D.W.; Cook, E.R.; Burnette, D.J.; Torbenson, M.C.A.; Howard, I.M.; Griffin, D.; Diaz, J.V.; Cook, B.I.; Williams, A.P.; Watson, E.; et al. Dynamics, Variability, and Change in Seasonal Precipitation Reconstructions for North America. J. Clim. 2020, 33, 3173–3195. [Google Scholar] [CrossRef]
- Cook, E.R.; Seager, R.; Heim, R.R.; Vose, R.S.; Herweijer, C.; Woodhouse, C. North American Drought Atlas (Version 2a) [Data Set]; NOAA NCEI: Asheville, NC, USA, 2008. [Google Scholar]
- Li, J.; Xie, S.-P.; Cook, E.R.; Huang, G.; D’Arrigo, R.; Liu, F.; Ma, J.; Zheng, X.-T. Interdecadal modulation of El Niño amplitude during the past millennium. Nat. Clim. Change 2011, 1, 114–118. [Google Scholar] [CrossRef]
- Legendre, P.; Legendre, L. Numerical Ecology, 3rd ed.; Elsevier: Amsterdam, The Netherlands, 2012. [Google Scholar]
- Swetnam, T.W. Fire History and Climate Change in Giant Sequoia Groves. Science 1993, 262, 885–889. [Google Scholar] [CrossRef]
- Nakagawa, S.; Cuthill, I.C. Effect size, confidence interval and statistical significance: A practical guide for biologists. Biol. Rev. 2007, 82, 591–605. [Google Scholar] [CrossRef]
- Pausas, J.G.; Keeley, J.E. Wildfires as an ecosystem service. Front. Ecol. Environ. 2019, 17, 289–295. [Google Scholar] [CrossRef]
- Williams, A.P.; Abatzoglou, J.T.; Gershunov, A.; Guzman-Morales, J.; Bishop, D.A.; Balch, J.K.; Lettenmaier, D.P. Observed impacts of anthropogenic climate change on wildfire in California. Earth’s Fut. 2019, 7, 892–910. [Google Scholar] [CrossRef]
- Fulé, P.Z.; Crouse, J.E.; Roccaforte, J.P.; Kalies, E.L. Do thinning and/or burning treatments in western USA ponderosa or Jeffrey pine-dominated forests help restore natural fire behavior? For. Ecol. Manag. 2012, 269, 68–81. [Google Scholar] [CrossRef]
- Swetnam, T.W.; Baisan, C.H. Tree-ring reconstructions of fire and climate history in the Sierra Nevada and southwestern United States. In Fire and Climatic Change in Temperate Ecosystems of the Western Americas; Springer: New York, NY, USA, 2003; pp. 158–191. [Google Scholar]
- Swetnam, T.W.; Betancourt, J.L. Mesoscale disturbance and ecological response to decadal climatic variability in the American Southwest. J. Clim. 1998, 11, 3128–3147. [Google Scholar] [CrossRef]
- Kitzberger, T.; Brown, P.M.; Heyerdahl, E.K.; Swetnam, T.W.; Veblen, T.T. Contingent Pacific–Atlantic Ocean influence on multicentury wildfire synchrony over western North America. Proc. Natl. Acad. Sci. USA 2007, 104, 543–548. [Google Scholar] [CrossRef]
- Flannigan, M.D.; Harrington, J.B. A study of the relation of meteorological variables to monthly provincial area burned by wildfire in Canada (1953–80). J. Appl. Meteorol. Climatol. 1988, 27, 441–452. [Google Scholar] [CrossRef]
- Trenberth, K.E. The definition of el niño. Bull. Am. Meteorol. Soc. 1997, 78, 2771–2777. [Google Scholar] [CrossRef]
- Crimmins, M.A. Synoptic climatology of extreme fire-weather conditions across the southwest United States. Int. J. Climatol. 2006, 26, 1001–1016. [Google Scholar] [CrossRef]
- McCabe, G.J.; Palecki, M.A.; Betancourt, J.L. Pacific and Atlantic Ocean influences on multidecadal drought frequency in the United States. Proc. Natl. Acad. Sci. USA 2004, 101, 4136–4141. [Google Scholar] [CrossRef] [PubMed]
- Moreira, F.; Pe’er, G. Agricultural policy can reduce wildfires. Science 2018, 359, 1001. [Google Scholar] [CrossRef] [PubMed]
- Guiot, J.; Corona, C.; ESCARSEL Members. Will Mediterranean fires become increasingly more frequent? Nat. Clim. Change 2023, 13, 112–113. [Google Scholar]
- Jolly, W.M.; Cochrane, M.A.; Freeborn, P.H.; Holden, Z.A.; Brown, T.J.; Williamson, G.J.; Bowman, D.M.J.S. Climate-induced variations in global wildfire danger from 1979 to 2013. Nat. Commun. 2015, 6, 7537. [Google Scholar] [CrossRef]
- Schoennagel, T.; Balch, J.K.; Brenkert-Smith, H.; Dennison, P.E.; Harvey, B.J.; Krawchuk, M.A.; Whitlock, C. Adapt to more wildfire in western North American forests as climate changes. Proc. Natl. Acad. Sci. USA 2017, 114, 4582–4590. [Google Scholar] [CrossRef]
- Bradshaw, L.S.; Deeming, J.E.; Burgan, R.E.; Cohen, J.D. The 1978 National Fire-Danger Rating System: Technical Documentation; Gen. Tech. Rep. INT-169; USDA Forest Service, Intermountain Forest and Range Experiment Station: Fort Collins, CO, USA, 1984.
- Riley, K.L.; Abatzoglou, J.T.; Grenfell, I.C.; Klene, A.E.; Heinsch, F.A. The relationship of large fire occurrence with drought and fire danger indices in the western USA, 1984–2008: The role of temporal scale. Int. J. Wildland Fire 2013, 22, 894–909. [Google Scholar] [CrossRef]
- Abatzoglou, J.T.; Dobrowski, S.Z.; Parks, S.A.; Hegewisch, K.C. TerraClimate, a high-resolution global dataset of monthly climate and climatic water balance from 1958–2015. Sci. Data 2018, 5, 170191. [Google Scholar] [CrossRef]
Disclaimer/Publisher’s Note: The statements, opinions and data contained in all publications are solely those of the individual author(s) and contributor(s) and not of MDPI and/or the editor(s). MDPI and/or the editor(s) disclaim responsibility for any injury to people or property resulting from any ideas, methods, instructions or products referred to in the content. |
© 2025 by the authors. Licensee MDPI, Basel, Switzerland. This article is an open access article distributed under the terms and conditions of the Creative Commons Attribution (CC BY) license (https://creativecommons.org/licenses/by/4.0/).